Patellar tendinopathy (PT) is a common injury involving inadequate eccentric (ECC) knee extensor contractions during dynamic sports activities. However, any discrepancies in ECC power output between Olympic athletes with and without PT utilizing a flywheel ergometer squat remain to be determined.
OBJECTIVE:
To compare peak ECC power, concentric (CON) power, the ECC/CON power ratio, and performance speed in female and male athletes with and without PT, respectively.
METHODS:
Forty Olympic athletes with and without PT were included and analyzed for ECC power, CON power, ECC/CON power ratio, and performance speed (m/s) under varying load conditions, with analyses separated by gender.
RESULTS:
The ECC power, ECC/CON power ratio, and performance speed of the PT group were significantly lower than those of the non-PT (NPT) group in both genders. ECC and CON power significantly increased with higher inertial loads in the NPT groups, whereas the speed significantly decreased as the inertial load increased in both PT and NPT groups.
CONCLUSIONS:
Dynamic flywheel ergometer assessments may help in the quantitative diagnosis of athletes with PT under differing dynamic squat conditions. This assessment may be used to create standardized guidelines for squat performance testing, strengthening, conditioning, and rehabilitation.
Patellar tendinopathy (PT) frequently affects athletes and causes insufficient eccentric contraction (ECC) of the knee extensors during ecological activities of sports, including squatting, jumping, and running [1, 2]. Athletes with PT generate higher quadriceps ECC power before jumping than asymptomatic athletes [3], which is considered to be a major cause of microtears because the intrinsic strength of the tendon or associated connective tissue is exceeded [4]. Furthermore, quadriceps ECC contraction weakness is closely related to knee pain in athletes with PT during jumping and squatting movements [1, 5]. In Biodex isokinetic tests, athletes with PT show lower quadriceps ECC torque (Nm) at 180∘/s compared to asymptomatic athletes [6]. Therefore, the accurate assessment of ECC contractions at various functional loads is important for sports rehabilitation and performance in athletes with PT.
Accurate assessments of quadriceps ECC strength have been performed using stationary Biodex, Cybex, and Kin-Com isokinetic devices [7]. However, these devices assess single joints in a single plane, which are non-ecological, do not accurately replicate functional sports movements, and have limitations when considering various movement speeds and inertial forces. Additionally, these devices are not portable and are expensive. Unlike stationary or laboratory testing devices, flywheel ergometers are convenient, portable, and relatively inexpensive and can be used for evaluation and training in sports-specific ecological environments [1, 8]. Furthermore, flywheel ergometers accommodate variable inertial loads and multi-joint applications, unlimited resistance and speed, and continuous performance by combining ECC and concentric (CON) muscle activity [9]. Moreover, the effectiveness of ECC resistance exercises using flywheel ergometer squats has been demonstrated in the prevention and treatment of PT [1, 10].
The latest flywheel ergometers measure the speed of movement (m/s) during dynamic squat performances, and a moderate-to-high optimal inertial load in the flywheel ergometer squat test increases the ECC overload of the quadriceps in asymptomatic individuals [9]. However, this aspect remains unexplored in athletes with and without PT. Despite the important clinical contributions of flywheel ergometer measurements in athletes with and without PT, the ramifications of quantitative assessments are unknown. Furthermore, previous research indicates significant differences in muscle performance and injury prevalence in genders [11], necessitating separate analyses to accurately assess and interpret the physiological impacts of PT. We, therefore, aimed to compare peak ECC power, CON power, ECC/CON power ratios, and speed during different load conditions in female and male athletes with and without PT using an ecological dynamic flywheel ergometer squat test to provide evidence to construct guidelines for the conditioning, strengthening, and rehabilitation of these athletes. We hypothesized that variations would be observed regarding ECC power, ECC/CON power ratio, and speed among athletes with and without PT at each load condition in both genders, with expected variances within each load. This clinical information may serve as a foundation to create quantitative assessment standards to diagnose PT using a flywheel ergometer and establish injury prevention and ECC strengthening exercise regimens for athletes with and without PT.
Materials and methods
Participants
Demographic characteristics of the participants ( 40)
Female ( 20)
Male ( 20)
Variables
PT ( 9)
NPT ( 11)
PT ( 11)
NPT ( 9)
Age (years SD)
27.00 2.69
24.91 3.39
25.91 5.12
26.78 4.29
Height (cm SD)
166.56 8.89
168.18 6.98
175.55 4.68
181.22 9.76
Weight (kg SD)
61.44 11.77
65.82 9.87
75.27 4.90
84.11 10.97
Body mass index (kg/m2
SD)
21.99 2.50
23.27 3.32
24.45 1.71
25.56 2.18
PT, patellar tendinopathy; NPT, non-patellar tendinopathy; SD, standard deviation.
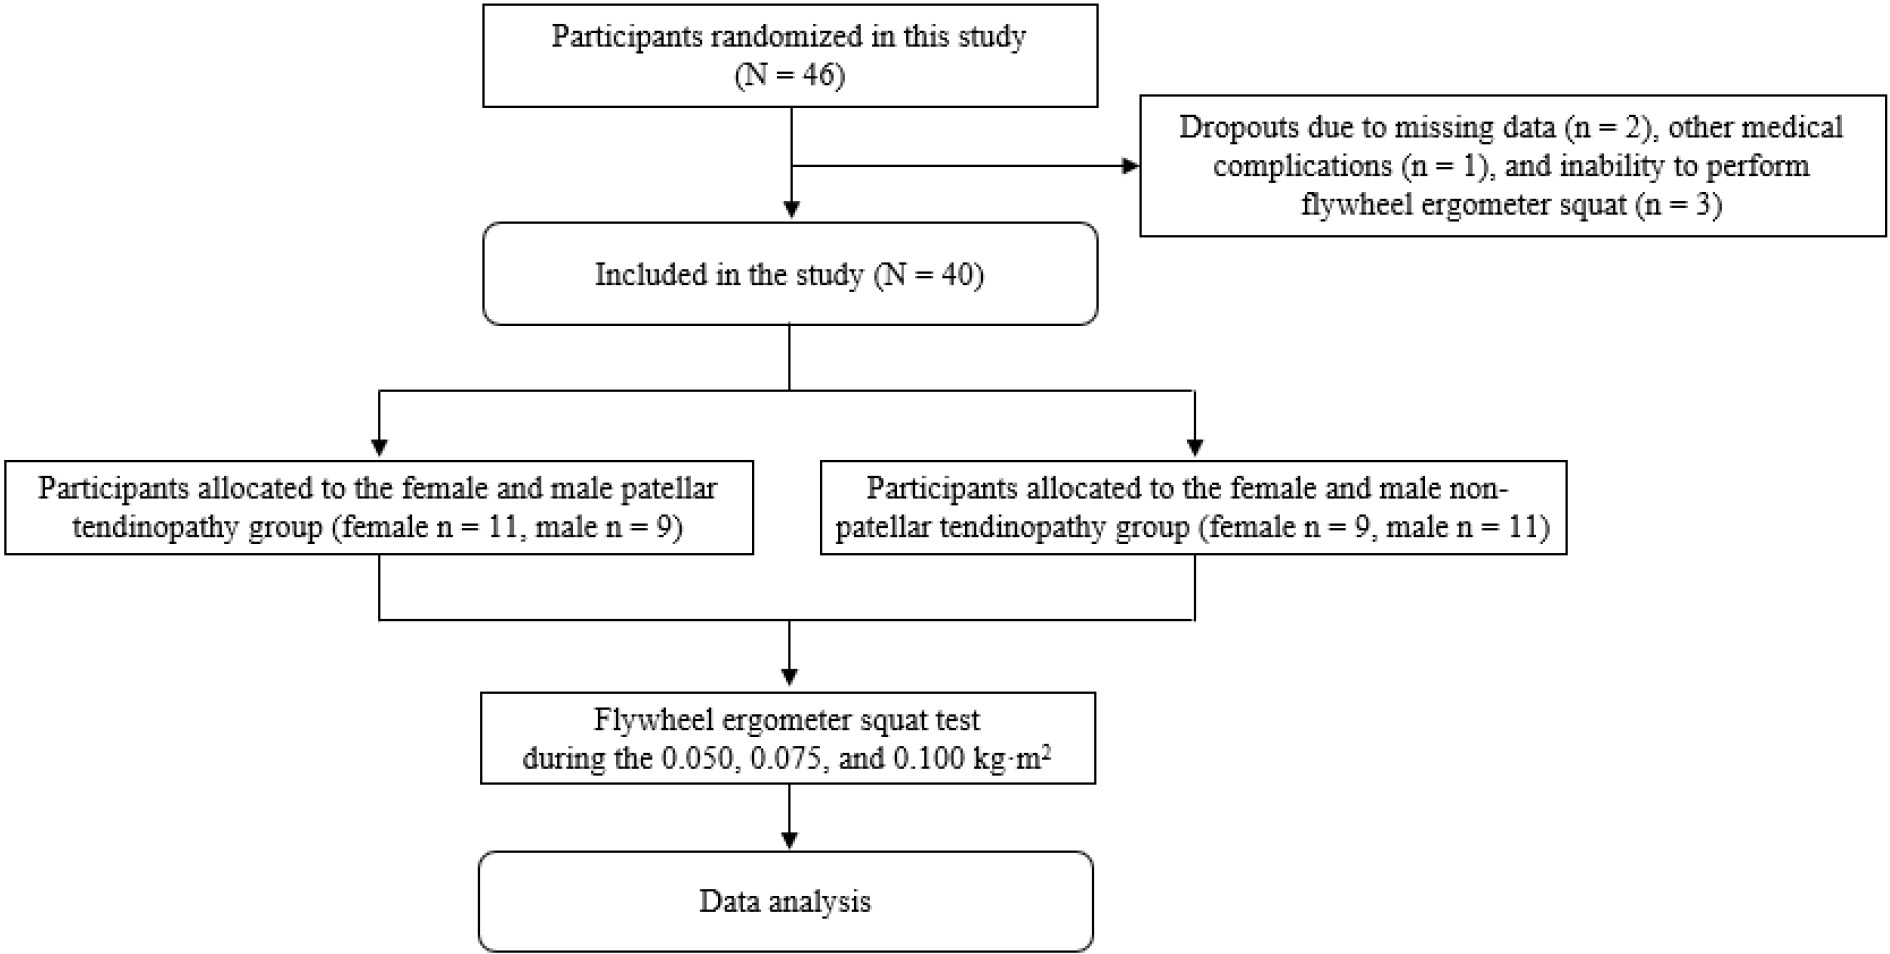
Flow chart of participant recruitment.
Forty Olympic athletes (mean age standard deviation, 26.30 4.29 years; range, 19–35 years; Table 1) from various jumping sports (such as badminton, handball, and gymnastics) were enrolled in the study. The participants were divided into four subgroups based on the presence of PT and gender: female PT, female NPT, male PT, and male NPT (Fig. 1). This division was made to address potential gender-specific physiological differences in muscle performance. Each participant was informed about the benefits and risks of the study before signing an institutionally approved informed consent document. The Institutional Review Board approved the study protocol (approval no.: 1041849-202209-BM-157-02). Participants included individuals with Olympic experience, national team qualifications, and at least 5 years of competition experience who regularly participated in approximately five training sessions per week (skill and tactics sessions and strength and speed sessions).
The PT group included athletes with scores of 80 for the knee on the Victorian Institute of Sports Assessment PT Questionnaire [12] and those who experienced patellar tendon pain while executing single-leg squats on a 25∘-decline board [13]. We excluded athletes with a history of corticosteroid injection into the tendon, those presenting with patellofemoral pain, and those who underwent patellar tendon or knee surgery within the past 12 months. The demographic and clinical characteristics of the participants are presented in Table 1.
Experimental testing procedures
This cross-sectional study implemented a squat test using a flywheel device (kBox 4 Pro, Exxentric AB TM, Stockholm, Sweden), the kMeter app (version 3.11.1; Exxentric), and an iPad (iPad Pro; Apple Inc., Cupertino, CA) at the National Athlete Training Center. The kMeter app, validated for use with a flywheel device [9, 14, 15], was linked to an iPad via Bluetooth, and the test values during the load conditions of 0.050, 0.075, and 0.100 kgm2 were recorded.
All participants performed three sets of 12 repetitions of maximal parallel harness half-squats under each load condition within safe limits [1, 16]. The initial two repetitions were employed to optimize the flywheel’s momentum and were therefore excluded from the final analysis. The buckle connecting the harness to a rotating belt, which was utilized to generate rotational energy, was changed for each participant to maintain that tension was retained while both legs were extended. Each participant was offered a 5-minute break for recovery between trials, with the loads randomized via a block randomization process. If participants experienced pain during the assessment that hindered their ability to perform adequately, they ceased immediately and were withdrawn from the experimental test.
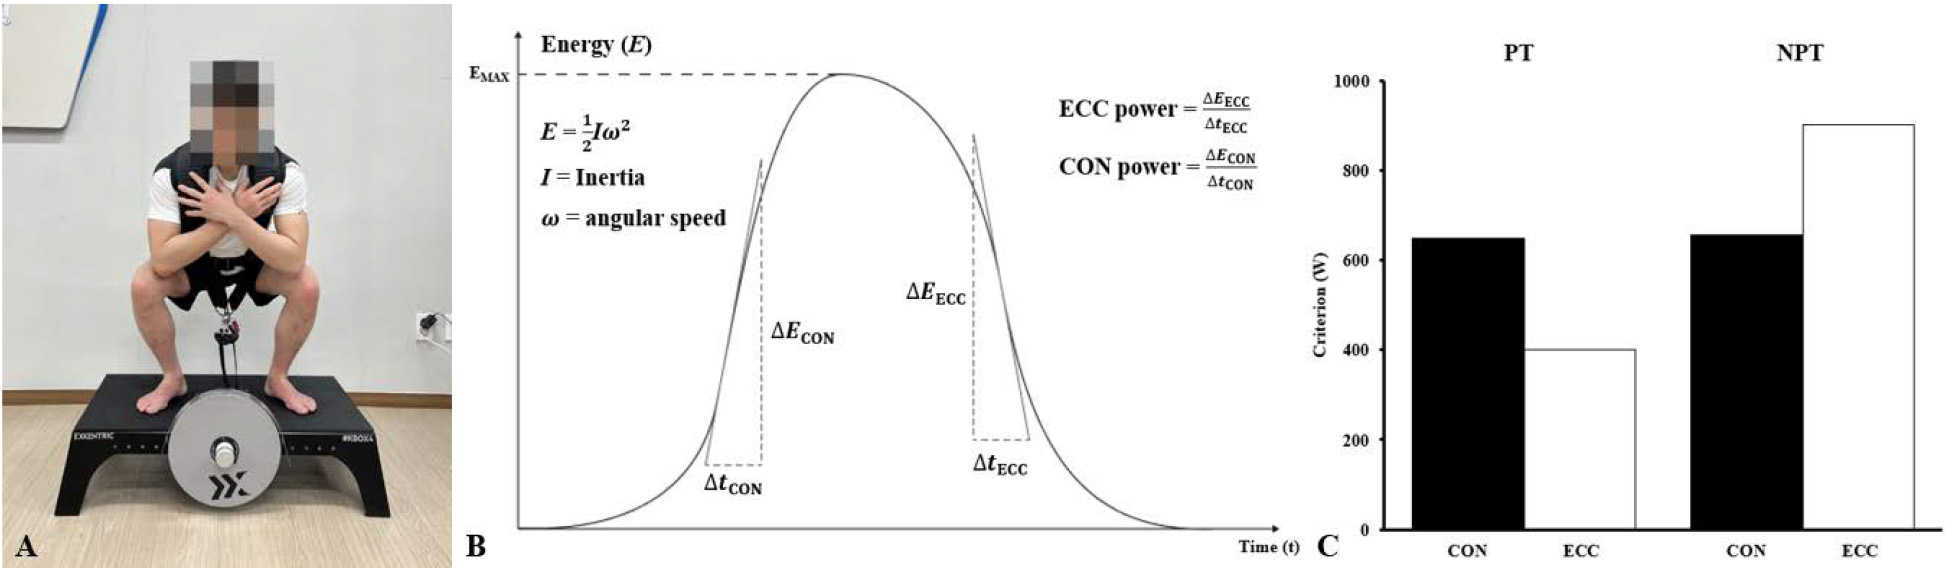
Flywheel ergometer squat test (A), data analysis and equations formulated with the assistance of Exxentric (B), representative testing values in ECC and CON between PT and NPT (C).
The participants first underwent two familiarization sessions, 2 days apart, to ensure that accurate values would be obtained [9]. Before testing, a consistent 15-minute warm-up was performed, which comprised the following: dynamic stretching of the gluteal, adductor, quadriceps, hamstring, and gastrocnemius muscles; jogging; and 10 repetitions of a semi-maximal squat under 0.050 kgm2 load conditions. The participants were instructed to perform parallel half-squats, which were administered by a professional physiotherapist and athletic trainer who were certified to perform the flywheel squat test. To standardize the participant’s squat range, the predetermined tape was applied to the midsection of the thigh, lateral to the femur, when the femur was parallel to the floor. The participants began the squat test with their feet unshod and proceeded to descend from a position in which the femur was parallel to the floor (90∘) to a position in which the knee was fully extended (180∘). The uniformity of the entire flywheel squat test was confirmed by adherence to a standardized protocol [9]. For the ECC phase (i.e., the descending phase of the half-squat test), the metronome was consistently set to 40 beats per minute [17]. This setting was used because the ECC power is influenced by speed [18, 19]. The initial beat signaled the initiation of the ECC phase, which was subsequently concluded by the second beat. Upon completion of the CON phase (i.e., the ascending phase of the half-squat test) at maximum speed, the ECC phase was initiated at the peak of the CON phase, displayed in real-time on the computer monitor. All participants were instructed to gradually increase muscular tension to avoid potential injuries associated with the flywheel squat test and to exert maximal effort to decelerate and halt the flywheel at the predetermined bottom squat position. The kMeter app captured and recorded the moment of inertia () and angular speed () data, which were subsequently used to calculate the power outputs while maintaining a consistent time variable () in the power equation for ECC phases (Fig. 2).
The test variables included peak ECC power, CON power, ECC/CON power ratio, and speed. The kinetic energy ( of the flywheel was calculated using the equation . Power ( was determined as the rate of change of energy over time, represented by . To compute the ECC and CON power, the maximum power output was identified during standardized time intervals, yielding the formulas for ECC power and for CON power, respectively. The ECC/CON power ratio was calculated as the ratio of the two peak powers data. Angular speed () is defined as the rate of change of angular displacement in radians per second and is converted to tangential speed ( at the flywheel’s perimeter in meters per second (m/s) using the equation = r, where is the radius. The data were analyzed using the peak values obtained after 10 repetitions of each set for all variables. Previous studies have reported similar responses to ECC overload training in peak power and mean values [20, 21, 22]. Furthermore, the significance of peak power creation in athletic performance [23] indicates that only peak power values were used in this assessment.
Comparisons of peak ECC power, CON power, ECC/CON ratio, and speed at each inertial load between the PT and NPT groups
Outcome measure
Female ( 20)
Male ( 20)
PT (mean SD)
NPT (mean SD)
PT (mean SD)
NPT (mean SD)
ECC 0.050
550.71 115.27*
649.53 160.04* ,†
611.30 134.81*
778.58 127.79* ,†
ECC 0.075
593.63 145.06*
766.64 140.31* ,†
647.56 110.84*
903.52 123.51* ,†
ECC 0.100
601.52 125.14*
867.88 187.34* ,†
663.77 114.35*
1043.65 147.16* ,†
CON 0.050
617.00 111.48†
601.23 151.40†
653.98 101.59†
676.31 123.70†
CON 0.075
691.45 160.37
663.85 155.73
781.62 116.26†
772.03 121.63
CON 0.100
735.73 143.48†
728.67 165.54†
857.70 107.76†
838.96 112.90†
Ratio 0.050
0.88 0.10*
1.08 0.07* ,†
0.93 0.16* ,†
1.16 0.12*
Ratio 0.075
0.87 0.14*
1.17 0.10* ,†
0.83 0.10*
1.18 0.15*
Ratio 0.100
0.83 0.13*
1.20 0.13* ,†
0.81 0.09* ,†
1.23 0.20*
Speed 0.050
0.48 0.12* ,†
0.62 0.09∗,†
0.59 0.12∗,†
0.76 0.11* ,†
Speed 0.075
0.41 0.08
0.46 0.10†
0.51 0.11∗
0.61 0.11* ,†
Speed 0.100
0.36 0.09†
0.41 0.09†
0.47 0.09* ,†
0.56 0.10* ,†
PT, patellar tendinopathy; NPT, non-patellar tendinopathy; SD, standard deviation. * Significant difference between groups for a given inertial load ( 0.05). †Significant difference between groups for inertial load setting ( 0.05).
Statistical analyses
Statistical data are expressed as means and standard deviations. A power analysis revealed that a sample size of 40 participants was required to achieve a medium effect size of 0.6 when the power was 0.8 and the level was 0.05. The power analysis was performed using the G*Power software (version 3.1.9.7, Heinrich-Heine-Universität Düsseldorf, Düsseldorf, Germany). Considering the physiological differences in the gender factor, we have additionally evaluated the influence of PT in male and female gender separately [11]. The normality and homogeneity of the data were confirmed using Shapiro–Wilk and Levene’s tests, respectively. A two-way mixed analysis of variance (ANOVA) test was implemented to evaluate differences in ECC power, CON power, ECC/CON power ratio, and speed during the 0.050, 0.075, and 0.100 kgm2 load conditions between the PT and NPT groups. If statistical significance was obtained for a parameter, a Tukey’s post hoc test was performed. Statistical significance was set at 0.05. All the statistical analyses were performed using SPSS software (version 26.0, SPSS Corp., Armonk, NY). The effect size was calculated using Cohen’s d [24] and interpreted as small ( 0.2), medium ( 0.5), or large ( 0.8), based on the proposed standards [25].
Results
Demographic characteristics
Forty-six participants aged 19–35 years were recruited and classified as athletes with and without PT. Six participants were excluded from the study because of missing data ( 2), other medical complications ( 1), or an inability to perform the flywheel ergometer squat ( 2). There were no significant differences in age, height, weight, or body mass index between athletes with and without PT ( 0.05).
Peak ECC power
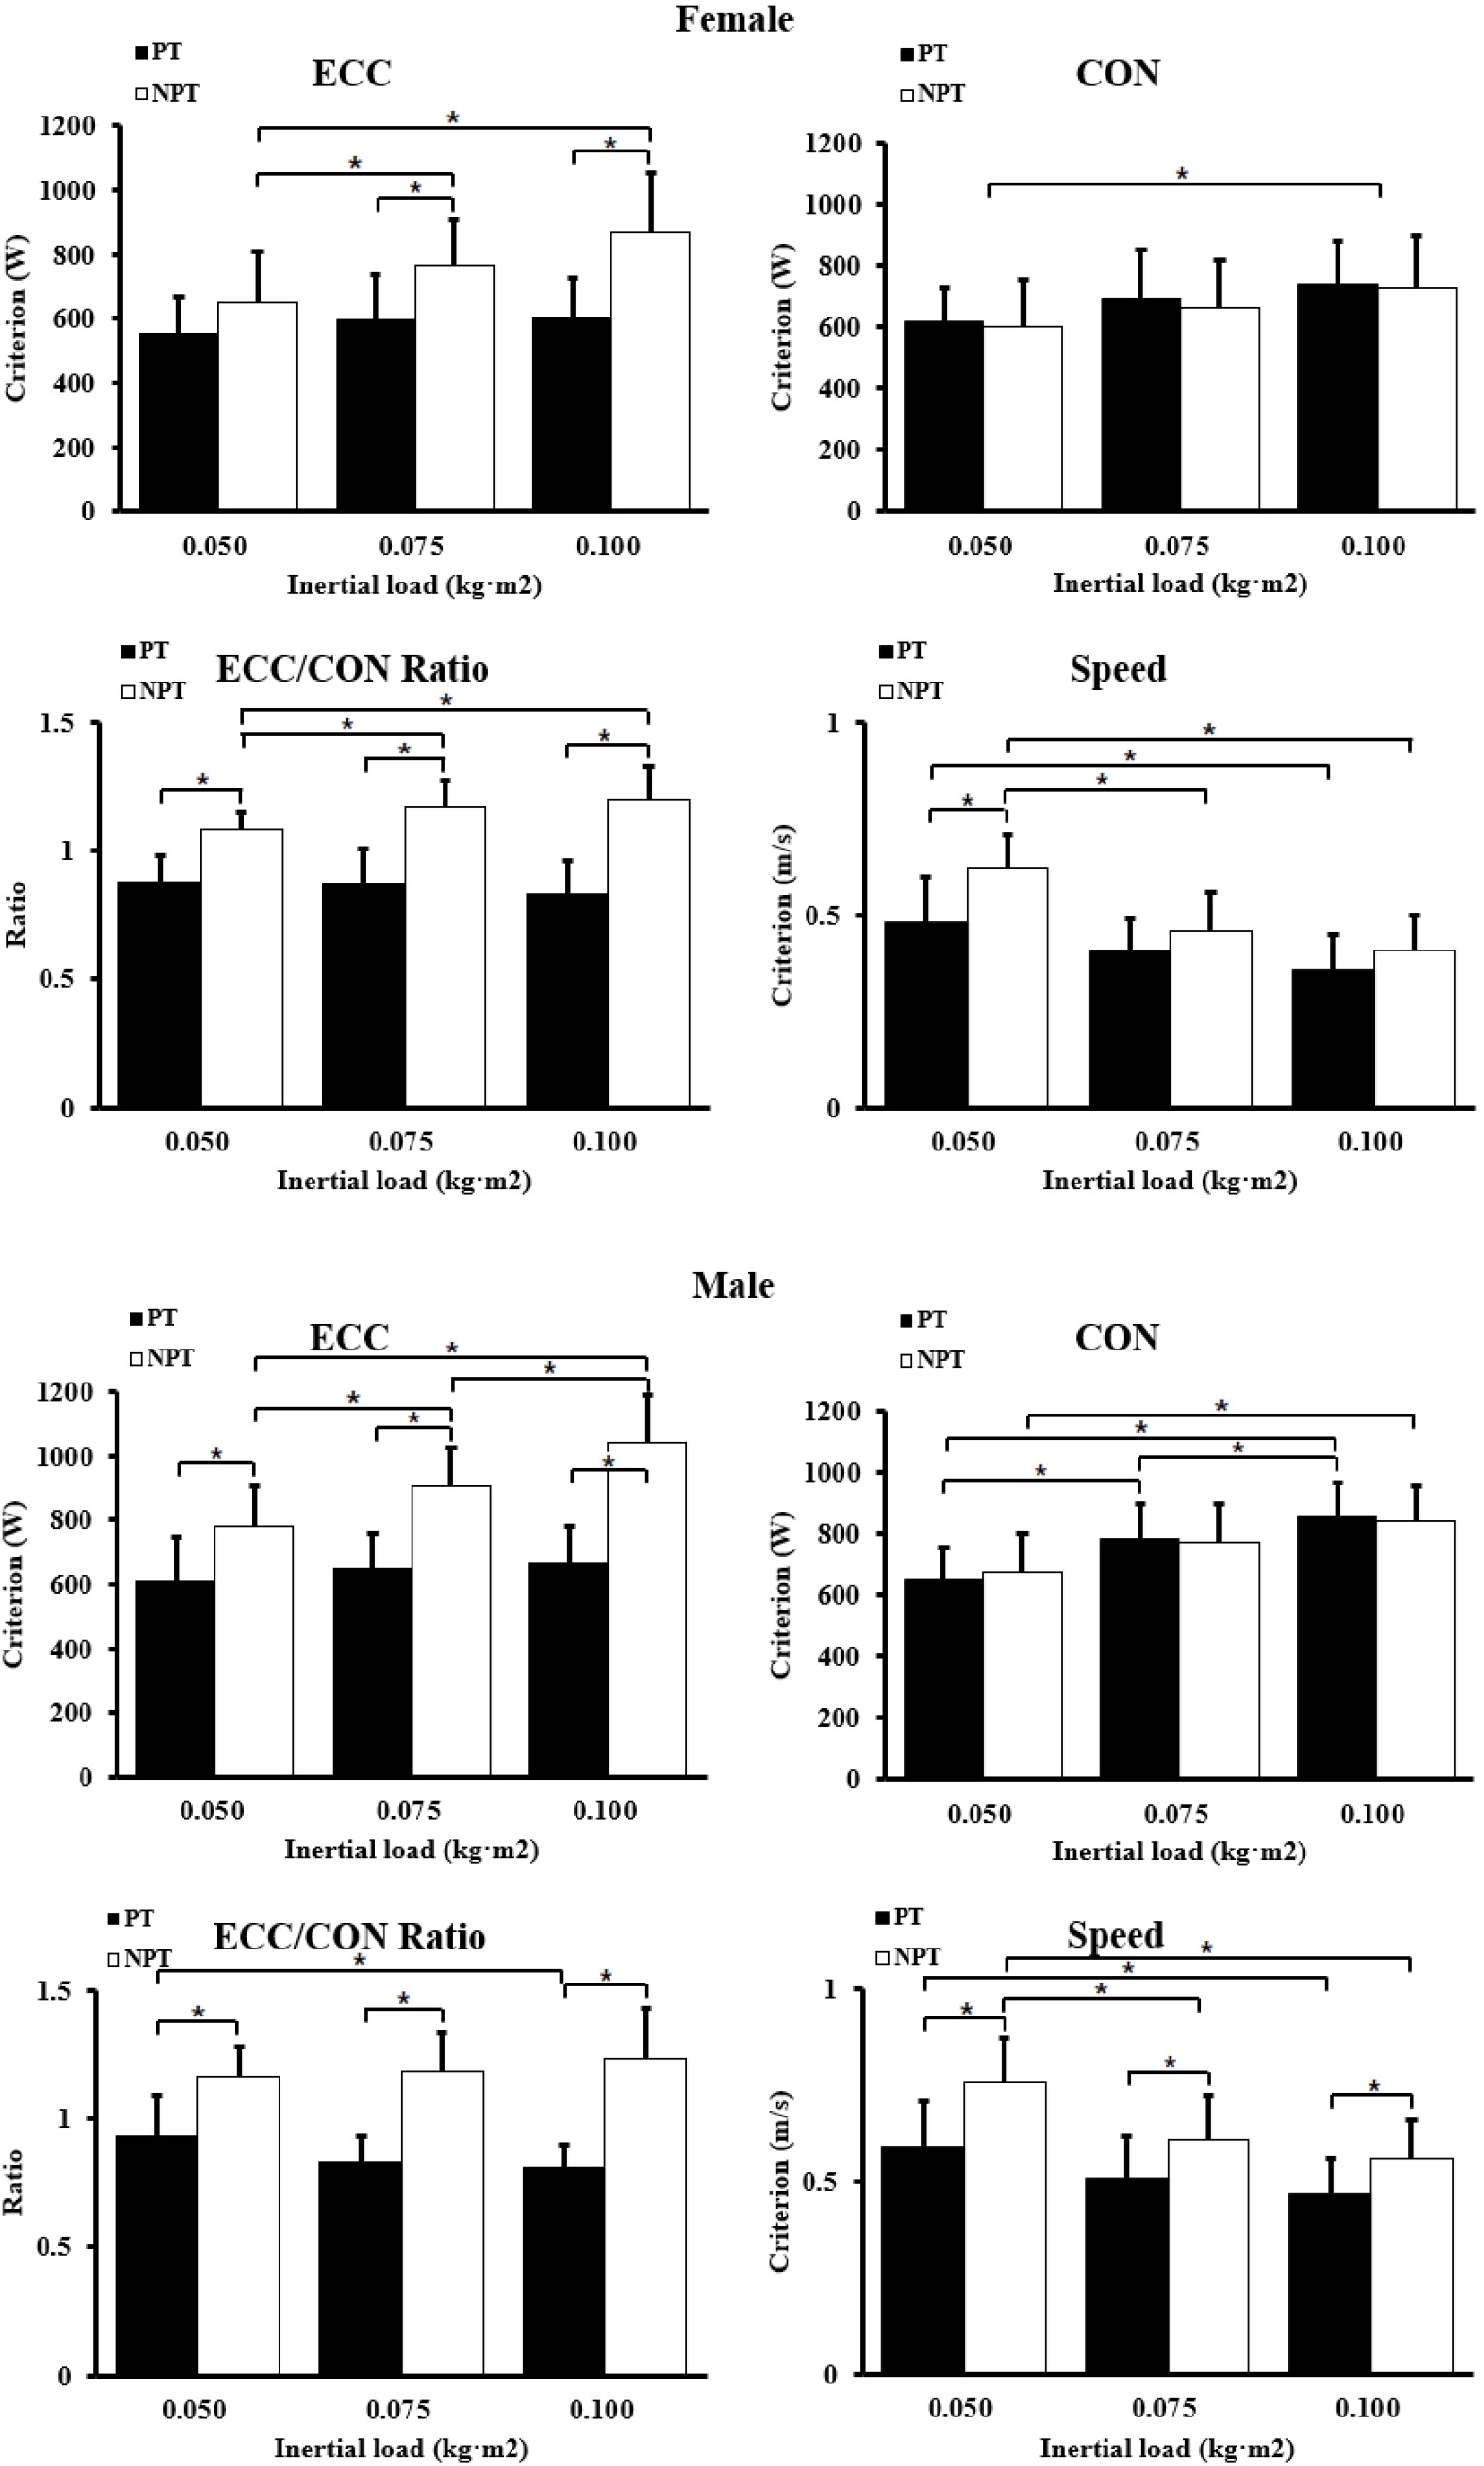
ECC power, CON power, ECC/CON power ratio, and speed under the load conditions of 0.050, 0.075, and 0.100 kgm2. PT, patellar tendinopathy; NPT, non-patellar tendinopathy; ECC, eccentric; CON, concentric. * P < 0.05, mean standard deviation.
For female participants, a repeated-measures ANOVA showed a significant interaction effect ( 0.002) with group ( 0.010) and condition ( 0.001) as the main effects for the ECC power data. A Tukey’s post hoc analysis demonstrated a significantly lower ECC power in the PT group than that in the NPT group under the load conditions of 0.075 and 0.100 kgm2 ( 0.05, 0.86 and 1.18). In the NPT group, ECC power was significantly greater under the 0.075 and 0.100 kgm2 load conditions than under the 0.050 kgm2 load condition ( 0.05, 0.55 and 0.89). However, in the PT group, no significant differences were observed among the 0.050, 0.075, and 0.100 kgm2 load conditions.
For male participants, a repeated-measures ANOVA showed a significant interaction effect ( 0.009) with group ( 0.001) and condition ( 0.001) as the main effects for the ECC power data. A Tukey’s post hoc analysis demonstrated a significantly lower ECC power in the PT group than that in the NPT group under the load conditions of 0.050, 0.075, and 0.100 kgm2 ( 0.05, 0.90, 1.54, and 2.04). In the NPT group, ECC power was significantly greater under the 0.075 and 0.100 kgm2 load conditions than under the 0.050 kgm2 load condition ( 0.05, 0.70 and 1.36), and under the 0.100 kgm2 load condition than under the 0.075 kgm2 load condition ( 0.05, 0.73). However, in the PT group, no significant differences were observed among the 0.050, 0.075, and 0.100 kgm2 load conditions (Table 2 and Fig. 3).
Peak CON power
For female participants, a repeated-measures ANOVA showed a significant main effect of load ( 0.001) for the CON power data. Tukey’s post hoc analysis demonstrated significantly greater CON power in both PT and NPT groups under the 0.100 kgm2 load condition than under the 0.050 kgm2 load condition ( 0.05, 0.65 and 0.55).
For male participants, a repeated-measures ANOVA showed a significant main effect of load ( 0.001) for the CON power data. Tukey’s post hoc analysis demonstrated significantly greater CON power in PT group under the 0.075 and 0.100 kgm2 load conditions than under the 0.050 kgm2 load condition ( 0.05, 0.83 and 1.38), and under the 0.100 kgm2 load condition than under the 0.075 kgm2 load condition ( 0.05, 0.48) (Table 2 and Fig. 3). Additionally, significantly greater CON power was observed in NPT group under the 0.100 kgm2 load condition than under the 0.050 kgm2 load condition ( 0.05, 0.97) (Table 2 and Fig. 3).
Peak ECC/CON power ratios
For female participants, a repeated-measures ANOVA showed a significant interaction effect ( 0.021) with group ( 0.001) as the main effects for the ECC/CON power ratio. A Tukey’s post hoc analysis demonstrated a significantly lower ECC/CON power ratio in the PT group than that in the NPT group under the load conditions of 0.050, 0.075, and 0.100 kgm2 ( 0.05, 1.75, 1.74, and 2.01). In the NPT group, ECC/CON power ratio was significantly lower under the 0.075 and 0.100 kgm2 load conditions than under the 0.050 kgm2 load condition ( 0.05, 0.74 and 0.81).
For male participants, a repeated-measures ANOVA showed a significant interaction effect ( 0.008) with group ( 0.001) as the main effects for the ECC/CON power ratio data. A Tukey’s post hoc analysis demonstrated a significantly lower ECC/CON power ratio in the PT group than that in the NPT group under the load conditions of 0.050, 0.075, and 0.100 kgm2 ( 0.05, 1.15, 1.94, and 1.91). In the PT group, ECC/CON power ratio was significantly greater under the 0.100 kgm2 load condition than under the 0.050 kgm2 load condition ( 0.05, 0.65) (Table 2 and Fig. 3).
Peak speed
For female participants, a repeated-measures ANOVA showed a significant interaction effect ( 0.018) with group ( 0.047) and condition ( 0.001) as the main effects for the ECC/CON power ratio. A Tukey’s post hoc analysis demonstrated a significantly lower speed in the PT group than that in the NPT group under the load condition of 0.050 kgm2 ( 0.05, 0.93). In the PT group, speed was significantly lower under the 0.100 kgm2 load condition than under the 0.050 kgm2 load condition ( 0.05, 0.80). In the NPT group, speed was significantly lower under the 0.075 and 0.100 kgm2 load condition than under the 0.050 kgm2 load condition ( 0.05, 1.19 and 1.65).
For male participants, a repeated-measures ANOVA showed a significant interaction effect ( 0.042) with group ( 0.018) and condition ( 0.001) as the main effects for the speed data. A Tukey’s post hoc analysis demonstrated a significantly lower speed in the PT group than that in the NPT group under the load conditions of 0.050, 0.075, and 0.100 kgm2 ( 0.05, 1.04, 0.64, and 0.67). In the PT group, speed was significantly lower under the 0.100 kgm2 load condition than under the 0.050 kgm2 load condition ( 0.05, 0.80). In the NPT group, speed was significantly lower under the 0.075 and 0.100 kgm2 load conditions than under the 0.050 kgm2 load condition ( 0.05, 0.96 and 1.35) (Table 2 and Fig. 3).
Discussion
The ECC power and ECC/CON power ratios decreased more in the PT group compared to those in the NPT group under load conditions of 0.050, 0.075, and 0.100 kgm2 in both genders. In the NPT group, ECC power differed across load conditions, whereas no significant difference was observed in the PT group within each gender. Therefore, utilizing ecologically dynamic flywheel ergometer assessments may offer a potential foundation for the quantitative diagnosis of athletes with PT and the establishment of standardized guidelines for strengthening and rehabilitating professional athletes with and without PT. To the best of our knowledge, this is the first clinical trial to evaluate the ECC power, CON power, ECC/CON power ratio, and performance speed of flywheel ergometer squats in Olympic athletes with and without PT under varying load conditions.
Our ECC power analysis on the separate female and male participants demonstrated that both female and male groups showed a greater reduction in the peak ECC power data in the PT group than that in the NPT group under load conditions of 0.050, 0.075, and 0.100 kgm2 (15%, 22%, and 31%, and 21%, 28%, and 36%, respectively). These findings are consistent with those of an earlier isokinetic study [6] in basketball players, which reported a greater decrease in quadriceps ECC strength in the PT group than in the NPT group. In leisure athletes, quadriceps ECC strength was found to be lower in the PT group than in the NPT group [26]. This reduction in ECC strength, with no difference in CON strength, may be associated with adaptive shortening and decreased sarcomere length, leading to neuromuscular disadvantages during ECC contractions [4, 27, 28].
In the female NPT group, ECC power data showed more significant changes under the 0.075 and 0.100 kgm2 load condition than under the 0.050 kgm2 load condition. In the male NPT group, ECC power data exhibited greater changes under the 0.075 and 0.100 kgm2 load conditions than under the 0.050 kgm2 load condition, and under the 0.100 kgm2 load condition than under the 0.075 kgm2 load condition. These results were consistent with those of a recent flywheel ergometer hip extension study [29], which reported a greater increase in ECC power under relatively heavy-load conditions (0.089 kgm2) than under light-load conditions (0.029 and 0.061 kgm2) in asymptomatic soccer athletes. In contrast, another flywheel ergometer squat study [9] reported relatively higher ECC power values under light-load testing (0.025 and 0.050 kgm2) conditions than under heavy-load conditions (0.075 and 0.100 kgm2) in asymptomatic handball athletes. Similarly, a flywheel ergometer deadlift evaluation during each load condition found that, compared with higher load conditions (0.075 and 0.100 kgm2), lower load conditions (0.025 and 0.050 kgm2) led to higher values in recreationally trained men [30]. These results indicate differences in power output production based on exercise experience [31]. However, in the PT group, no significant differences were observed among the different load conditions, attributed to muscle tension weakness and overuse of ECC contractions, which may cause altered motor control, viscoelastic changes, and associated muscle weakness in patients with PT [6, 28].
The ECC/CON power ratio on the separate female and male participants revealed that both female and male groups showed a greater decrease in the ECC/CON power ratio in the PT group than that in the NPT group under load conditions of 0.050, 0.075, and 0.100 kgm2 (19%, 26%, and 31%, and 20%, 30%, and 34%, respectively). This result corroborates a previous study [6], which reported a significantly reduced ECC/CON strength ratio in the quadriceps muscles of basketball players in the PT group compared to that in the NPT group. Additionally, the ECC/CON power ratio was significantly higher in the PT group than in the NPT group [32]. It is plausible that microtrauma-induced inhibition of the quadriceps during pre- and post-jump ECC contractions contributes to PT [3, 4, 28] and is not linked to CON strength at jump take-off. In the female NPT group, ECC/CON power ratio data exhibited a greater increase under the 0.075 and 0.100 kgm2 load condition than under the 0.050 kgm2 load condition. In the male PT group, ECC/CON power ratio data exhibited more substantial decreases under the 0.100 kgm2 load conditions than under the 0.050 kgm2 load condition. These results were consistent with those of a flywheel ergometer squat study [9], which reported a greater increase in ECC/CON power ratio under relatively heavy-load conditions (0.050, 0.075, and 0.100 kgm2) than under light-load conditions (0.025 kgm2) in asymptomatic handball athletes. To date, no previous studies have evaluated the ECC/CON power ratio in each inertial load in athletes with PT because the conventional isokinetic test is unable to measure various loads due to the inability to adjust the load [6].
The speed on the separate female and male participants revealed that female groups showed a greater reduction in the speed in the PT group than that in the NPT group under load conditions of 0.050 kgm2 (23%). The male groups showed more substantial decrease in the speed in the PT group than that in the NPT group under load conditions of 0.050, 0.075, and 0.100 kgm2 (22%, 16%, and 16%, respectively). No previous studies have evaluated the dynamic-related performance speed in athletes with PT because the conventional isokinetic test is unable to measure variable speed due to the constant setting (180∘/s) [6]. In the female PT group, the speed was significantly lower under the 0.100 kgm2 load condition than under the 0.050 kgm2 load condition. In the female NPT group, the speed was significantly lower under the 0.075 and 0.100 kgm2 load condition than under the 0.050 kgm2 load condition. In the male PT group, the speed was significantly reduced under the 0.100 kgm2 load condition than under the 0.050 kgm2 load condition. In the male NPT group, the speed was significantly reduced under the 0.075 and 0.100 kgm2 load conditions than under the 0.050 kgm2 load condition. These results are consistent with those of earlier leg curl examinations using a flywheel ergometer [31], which showed lower speeds during a relatively high-load condition (0.22 kgm2) than during a low-load condition (0.11 kgm2). Biomechanically, a high-inertia load test may require more force than a low-inertia load test, leading to a potential speed reduction during the dynamic flywheel ergometer performance test [22].
This study had some limitations. First, the experiment involved an ecologically dynamic eccentric flywheel ergometer squat performed under three inertial loads. Second, the participants were Olympic athletes; thus, our data should be carefully interpreted for nonathletic populations with different pathologies. Future research should investigate the effects of different types of dynamic movements and inertial load conditions on athletic and nonathletic populations with different pathologies.
Conclusion
The ecologically dynamic performance of the flywheel ergometer proved to be a valuable metric to quantitatively differentiate Olympic athletes with and without PT. This has the potential to serve as a basis to construct standardized directives for intensive strengthening and conditioning, in addition to preventive and rehabilitative training regimens for professional athletes with and without PT.
Author contributions
CONCEPTION: Hyoungjoo Choi.
PERFORMANCE OF WORK: Hyoungjoo Choi.
INTERPRETATION OR ANALYSIS OF DATA: Hyoungjoo Choi.
PREPARATION OF THE MANUSCRIPT: Hyoungjoo Choi.
REVISION FOR IMPORTANT INTELLECTUAL CONTENT: Joshua (Sung) H. You.
SUPERVISION: Joshua (Sung) H. You.
Ethical approval
Each participant was notified about the trial process and was asked for written consent before their involvement. The study protocol was approved by the Yonsei University Mirae Institutional Review Board (approval no.: 1041849-202209-BM-157-02).
Funding
This research was supported by a National Research Foundation of Korea (NRF) grant funded by the Korean government (MSIT) (No. RS-2023-00221762), and ‘Regional Innovation Strategy (RIS)’ through the National Research Foundation of Korea (NRF) funded by the Ministry of Education (MOE) (2022RIS-005).
Footnotes
Acknowledgments
I extend my appreciation to the athletes whose participation in the study facilitated the progress of sports physiotherapy. Furthermore, I would like to express my appreciation to Exxentric for providing the graph that depicts the data analysis methodology (B) of Fig. . This graph has been instrumental in clarifying the relationship between time, energy, and the ECC and CON phases of the exercise, thereby enriching our explanation of the power calculations derived from the flywheel ergometer’s use.
Conflict of interest
The authors have no conflicts of interest to report.
References
1.
GualGFort-VanmeerhaegheARomero-RodríguezDTeschPA. Effects of in-season inertial resistance training with eccentric overload in a sports population at risk for patellar tendinopathy. J Stren Cond Res. 2016; 30(7): 1834-42. doi: 10.1519/JSC.0000000000001286.
2.
SeifertLDavidsK, editors. Ecological dynamics: a theoretical framework for understanding sport performance, physical education and physical activity. First complex systems digital campus world e-conference 2015. Cham, Switzerland: Springer International Publishing; 2017. doi: 10.1007/978-3-319-45901-1_3.
3.
LianØEngebretsenLØvrebøRVBahrR. Characteristics of the leg extensors in male volleyball players with jumper’s knee. Am J Sports Med. 1996; 24(3): 380-5. doi: 10.1177/036354659602400322.
Holder-PowellHMRutherfordOM. Unilateral lower limb injury: its long-term effects on quadriceps, hamstring, and plantarflexor muscle strength. Arch Phys Med Rehab. 1999; 80(6): 717-20. doi: 10.1016/S0003-9993(99)90179-X.
6.
GaidaJECookJLBassSAustenSKissZ. Are unilateral and bilateral patellar tendinopathy distinguished by differences in anthropometry, body composition, or muscle strength in elite female basketball players? Br J Sports Med. 2004; 38(5): 581-5. doi: 10.1136/bjsm.2003.006015.
7.
WilkKJohnsonRLevineB, editors. A comparison of peak torque values of knee extension and flexor muscle groups using Biodex, Cybex, and Kin-Com isokinetic dynamometers. Physical Therapy. 1987. Alexandria (VA): American Physical Therapy Association.
8.
BoltRHeuvelmansPBenjaminseARobinsonMAGokelerA. An ecological dynamics approach to ACL injury risk research: a current opinion. Sports Biomech. 2021; 1-14. doi: 10.1080/14763141.2021.1960419.
9.
SabidoRHernández-DavóJLPereyra-GerberGT. Influence of different inertial loads on basic training variables during the flywheel squat exercise. Int J Sports Physiol Perform. 2018; 13(4): 482-9. doi: 10.1123/ijspp.2017-0282.
10.
MascaróACosMÀMorralARoigAPurdamCCookJ. Load management in tendinopathy: Clinical progression for Achilles and patellar tendinopathy. Apunts Medicina de l’Esport. 2018; 53(197): 19-27. doi: 10.1016/j.apunts.2017.11.005.
11.
NuzzoJL. Narrative review of sex differences in muscle strength, endurance, activation, size, fiber type, and strength training participation rates, preferences, motivations, injuries, and neuromuscular adaptations. J Stren Cond Res. 2023; 37(2): 494-536. doi: 10.1519/JSC.0000000000004329.
12.
YoungMACookJPurdamCKissZSAlfredsonH. Eccentric decline squat protocol offers superior results at 12 months compared with traditional eccentric protocol for patellar tendinopathy in volleyball players. Br J Sports Med. 2005; 39(2): 102-5. doi: 10.1136/bjsm.2003.010587.
13.
PurdamCRCookJLHopperDMKhanKMGroupVTS. Discriminative ability of functional loading tests for adolescent jumper’s knee. Phys Ther Sport. 2003; 4(1): 3-9. doi: 10.1016/S1466-853X(02)00069-X.
14.
Martín-San AgustínRSánchez-BarbadoraMGarcía-VidalJA. Validity of an inertial system for measuring velocity, force, and power during hamstring exercises performed on a flywheel resistance training device. PeerJ. 2020; 8: e10169. doi: 10.7717/peerj.10169.
15.
WeakleyJFernández-ValdésBThomasLRamirez-LopezCJonesB. Criterion validity of force and power outputs for a commonly used flywheel resistance training device and Bluetooth app. J Stren Cond Res. 2019; 33(5): 1180-4. doi: 10.1519/JSC.0000000000003132.
16.
FrohmASaartokTHalvorsenKRenströmP. Eccentric treatment for patellar tendinopathy: a prospective randomised short-term pilot study of two rehabilitation protocols. Br J Sports Med. 2007; 41(7): e7. doi: 10.1136/bjsm.2006.032599.
17.
BollingerLMBrantleyJTTarltonJKBakerPASeayRFAbelMG. Construct validity, test-retest reliability, and repeatability of performance variables using a flywheel resistance training device. J Stren Cond Res. 2020; 34(11): 3149-56. doi: 10.1519/JSC.0000000000002647.
18.
CowellJFCroninJBrughelliM. Eccentric muscle actions and how the strength and conditioning specialist might use them for a variety of purposes. Strength Cond J. 2012; 34(3): 33-48. doi: 10.1519/10.1519/SSC.0b013e318253f578.
Fernandez-GonzaloRLundbergTRAlvarez-AlvarezLde PazJA. Muscle damage responses and adaptations to eccentric-overload resistance exercise in men and women. Eur J Appl Phys. 2014; 114: 1075-84. doi: 10.1007/s00421-014-2836-7.
21.
NorrbrandLFluckeyJDPozzoMTeschPA. Resistance training using eccentric overload induces early adaptations in skeletal muscle size. Eur J Appl Physiol. 2008; 102: 271-81. doi: 10.1007/s00421-007-0583-8.
22.
NorrbrandLPozzoMTeschPA. Flywheel resistance training calls for greater eccentric muscle activation than weight training. Eur J Appl Physiol. 2010; 110: 997-1005. doi: 10.1007/s00421-010-1575-7.
DurlakJA. How to select, calculate, and interpret effect sizes. J Pediatr Psychol. 2009; 34(9): 917-28. doi: 10.1093/jpepsy/jsp004.
25.
CohenJ. The effect size index: d. Statistical power analysis for the behavioral sciences. Abingdon-on-Thames: Routledge Academic. 1988.
26.
KauxJ-FCroisierJ-LLibertiauxV. Isokinetic strength profile of subjects with proximal patellar tendinopathy. Muscles Ligaments Tendons J. 2019; 9(2). doi: 10.32098/mltj.02.2019.08.
27.
GrauSMaiwaldCKraussIAxmannDJanssenPHorstmannT. What are causes and treatment strategies for patellar-tendinopathy in female runners? J Biomech. 2008; 41(9): 2042-6. doi: 10.1016/j.jbiomech.2008.03.005.
28.
PagePFrankCCLardnerR. Assessment and treatment of muscle imbalance: the Janda approach. Champaign (IL): Human kinetics; 2010. doi: 10.5040/9781718211445.
29.
de KeijzerKLMcErlain-NaylorSABeatoM. The effect of flywheel inertia on peak power and its inter-session reliability during two unilateral hamstring exercises: leg curl and hip extension. Front Sports Act Living. 2022; 4: 898649. doi: 10.3389/fspor.2022.898649.
30.
BrienJBrowneDEarlsDLodgeC. The effects of varying inertial loadings on power variables in the flywheel Romanian deadlift exercise. Biol Sport. 2021; 39(3): 499-503. doi: 10.5114/biolsport.2022.106159.
31.
Tous-FajardoJMaldonadoRAQuintanaJMPozzoMTeschPA. The flywheel leg-curl machine: offering eccentric overload for hamstring development. Int J Sports Physiol Perform. 2006; 1(3): 293. doi: 10.1123/ijspp.1.3.293.
32.
Barker-DaviesRMRobertsAWatsonJBakerPBennettANFongDT, et al. Kinematic and kinetic differences between military patients with patellar tendinopathy and asymptomatic controls during single leg squats. Clin Biomech. 2019; 62: 127-35. doi: 10.1016/j.clinbiomech.2019.02.001.