
Abstract
The use of social media (SM) in modern political activities has reshaped how politicians run electoral campaigns. This study aims to improve the understanding of online campaigns and their correlation with electoral results. We focus on the 2018 Brazilian presidential campaign, which is well known for its strong online presence, and analyze how candidates used their SM profiles, as well as how citizens interacted with them. We propose a new set of metrics for modeling SM performance and identify statistical correlations between SM performance and votes received. For this, we analyzed more than 40,000 posts made by the 13 candidates on Brazil’s three major social networks (Facebook, Twitter, and Instagram) from January to October 2018. Results indicate that candidates used SM heavily throughout the year but focused on engaging words and avoided contentious topics. The most voted-for candidate received more than half (55%) of the interactions received by all the candidates. Posts’ interactions were highest on Instagram, where users were increasing the attention given to political content. Lastly, we found strong correlations between the proposed metrics and votes received. Thus, proposed metrics may support new models for predicting electoral results using combined data from many social networks.

Introduction
Social media (SM) has played a central role in politics and elections throughout this decade. We have entered a new era mediated by SM in which politicians conduct permanent campaigns without geographic or time constraints, and extra information about them can be obtained not only by the press but directly from their profiles on social networks and through other people sharing and amplifying their voices on SM. In this new scenario, SM is used extensively in campaigns, and an online campaign’s success can even decide elections. As a consequence, much academic research has been devoted to this modern political campaign paradigm and its activities (Carlisle & Patton, 2013; Jungherr, 2016), such as how well Facebook and Twitter users reflect the general voting public (Jungherr, 2016; Mellon & Prosser, 2017), how the sentiment of conversations is connected to real-world events affecting a political campaign (Park, 2013) and whether it is possible to predict election results based on SM analysis (Brito et al., 2021; Tumasjan et al., 2010).
SM also presents some new challenges: the popularity of fake news, in which false content against candidates is rapidly disseminated (Mustafaraj & Metaxas, 2017); the existence of social bubbles (Flaxman et al., 2016), a phenomenon by which people are usually presented with content that mainly agrees with their personal convictions and imparts a sensation of majority or unanimity; and the use of automated software known as bots to spread true or fake news, whether supporting allies or defaming opponents (Filer & Fredheim, 2017). To deal with these problems, one approach is to directly reach candidates’ SM profiles, which allows citizens to obtain official content instead of fake news, as well as to avoid the effects of a social bubble and massive exposure to bots. Moreover, by using their own SM profiles, candidates may actively engage with supporters of their campaigns, who can share and amplify candidates’ voices. The potential of this engagement may be reflected in the number of votes received, as occurred in the 2016 U.S. presidential election when Donald Trump focused his campaign on free media marketing (Francia, 2018).
This scenario also occurred in the 2018 Brazilian presidential election. The candidate with more followers on SM (12.5 million followers on Facebook, Twitter and Instagram one day before elections), and almost no time on TV (8 seconds in public propaganda), ran his campaign almost entirely online and was elected (46.0% of valid votes in the first round), while the candidate with more time on TV (5’ 32” in public propaganda) and fewer social network followers (2.2 million) received only the sixth most votes (4.7% of vote share).
Despite many initiatives aiming to study candidates’ SM behavior and its correlation with electoral results, many of them are constrained by the technical challenges of collecting SM data, especially from Facebook and Instagram. As a result, as presented in very recent surveys (Brito et al., 2021; Chauhan et al., 2020) most studies are limited to a small timeframe (some days before election day), and to Twitter posts, from which it is easier to collect data. Also, most studies focus on the sentiment analysis of citizens’ posts about candidates, forgetting the valuable information that can be gathered from the candidates’ networks.
In this context, this study aims to improve the understanding of online campaigning and its correlations with electoral results. It focuses on the first round of the 2018 Brazilian presidential campaign, well known for the strong online presence of the president who was elected, despite his small presence on traditional media and his absence from the debates before the first round. First, we analyzed how candidates used their SM profiles and how citizens interacted with them. Then, we present a new approach to find a correlation between candidates’ SM performance and votes received. Instead of the traditional approach of counting the volume and/or sentiment of people talking about a candidate, we elaborate on Zajonc’s exposure theory (ZAJONC, 1968) to consider how many people are paying attention to a candidate and amplifying his voice. Thus, we propose a new set of metrics based on attention to and engagement with model candidates’ performance on SM. Using the proposed metrics, we identified statistical correlations between SM performance and votes received.
For this, we collected and analyzed data from more than 44,000 posts made by the 13 candidates from January 1, 2018, to October 6, 2018, one day before the first-round election day. Data was collected from the three most used social network sites in Brazil: Facebook, Twitter and Instagram.
The remainder of this paper is organized as follows: Section 2 presents the conceptual background and related works, followed by a brief overview of the 2018 Brazilian elections in Section 3. Section 4 presents the research approach, including the research questions, the reasoning behind and proposal of a new set of metrics for measuring performance on SM, data collection strategy, and analysis methodology. In Section 5, the results are presented and discussed, followed by Section 6, which presents concluding remarks and future work.
Background
Contemporary SM systems are new: Facebook launched for public access in 2006, Twitter debuted in 2006, and Instagram emerged in 2010. The use of SM in modern political activities is a new phenomenon that already presents promising results. As the background for this research, we first explore the role of SM in elections and the use of SM by politicians and candidates. Then, research on correlating SM and electoral performance is presented. Finally, the state of the art in this area is discussed.
The use of social media in elections
The impact of SM on politics and elections around the world is receiving attention. Smyth (DiGrazia et al., 2013) studied how SM was used in the 2011 elections in West Africa, Nigeria and Liberia, concluding that SM helped to overcome a previous scarcity of information during the electoral process. In a study regarding the 2013 national election in Norway, Kalsnes (Kalsnes, 2016) described “social media interaction deadlock,” a phenomenon that is increasing the disparity between the parties’ expressed strategies and online performance. Moreover, it was determined that political parties identify three clear disadvantages when communicating with voters online: (a) online reputation risk; (b) negative media attention and (c) limited resources. In the 2014 Indian general elections, Jaidka (Jaidka & Ahmed, 2015) studied official Twitter accounts of the top ten political parties and identified the new paradigms created by political parties to engage and inform voters, driven by modern information and communications technology (ICT).
Concerning U.S. elections, in an analysis of 2012 U.S. presidential candidates’ Facebook pages, Bronstein (Bronstein, 2013) showed that in addition to the mobilization of supporters, campaigns used to post information only on a small number of non-controversial subjects, discouraging dissent and encouraging affective allegiances between the candidate and his or her supporters. Regarding the same elections, Mascaro (Mascaro et al., 2016) studied conversational features in Twitter and concluded that, although candidates and media are the most talked about and talked to, these interactions elicited no response.
More recently, Hall (Hall et al., 2018) analyzed the role that SM played in the outcome of the 2016 U.S. presidential election and the Brexit referendum. His conclusions were different from those of previous studies, and he argued that discussions on SM only represent a small portion of the overall discussions in a political campaign and play a minor role in the overall ecosystem. However, in the same year, and regarding the 2016 U.S. presidential election, Morris’ results (Morris, 2018) suggested that campaign messages about candidates sent via Twitter – regardless of the candidate of focus – resonated just as strongly with potential voters as those sent via traditional media, reinforcing the power of SM. In one of the very few studies including Instagram, Aminolroya (Aminolroaya & Katanforoush, 2017) highlighted that in 2016, the flow of information from followees to followers in Instagram played a significant role in the Iranian parliamentary election.
After finding the use of SM in campaigns worldwide, researchers naturally started to study the correlations of SM use and electoral performance, presented next.
The use of social media and electoral performance
The correlation between SM performance and electoral performance has been the focus of research since 2010. Tumasjan et al. (Tumasjan et al., 2010) presented a seminal study in the context of the German federal election aiming to predict the results. They collected all tweets that contained the names of the six parties represented in the German parliament or selected prominent politicians of these parties and compared the volume of tweets with the election results. They observed that the relative volumes of tweets closely mirrored the results of the federal election. Then, they claimed that the mere number of tweets mentioning a political party has high correlations with votes, can be considered a plausible reflection of the vote share, and has predictive power even comes close to traditional election polls. In the same year, O’Connor (O’Connor et al., 2010) found similar results with a similar approach improved by sentiment detection of tweets.
Kruikemeier (Kruikemeier, 2014) studied content characteristics and candidates’ styles of online campaigning during the Dutch national elections of 2010. His findings showed that candidates who used Twitter during the campaign received more votes than those who did not, and that using Twitter in an interactive way had a positive impact as well. Effing (Effing et al., 2011) also studied the impact of SM usage in elections in the Netherlands, showing that during the national elections in 2010, politicians with higher SM engagement received relatively more votes within most political parties. In 2013, (DiGrazia et al., 2013) showed a statistically significant association between tweets that mention a candidate for the U.S. House of Representatives and his or her subsequent electoral performance, indicating that data about political behavior can be extracted from SM. Later, Ramadhan (Ramadhan et al., 2014) analyzed SM utilization in the 2014 Jakarta legislative election, showing that the usage of SM, especially Facebook and Twitter, is strongly correlated with the number of votes gained by the candidate.
Following these studies, a vast literature was published aiming to correlate SM and election performance, and ultimately trying to predict elections’ results. Two very recent papers summarize these initiatives. Chauhan et al. (Chauhan et al., 2020), surveyed 38 papers, and Brito et al. (Brito et al., 2021) performed a systematic review of 83 relevant studies. Both reviews highlight that most studies have used Twitter as a corpus for correlating SM and election results based on volume and sentiment analysis. However, some studies challenge this approach (Gayo-Avello et al., 2011; Jungherr et al., 2012; Jungherr et al., 2017), and Brito et al. also found that only 55% of the 64 studies that used this approach obtained success. Both survey studies (Brito et al., 2021; Chauhan et al., 2020) also highlight that the existence of irrelevant, junk, fake, or spam posts can affect the results, as well as the challenges of accurate sentiment analysis on tweets, which are small texts. Moreover, (Brito et al., 2021) highlighted the difficulties in using data from multiple networks besides Twitter, and the positive effect of collecting data for long periods (from 45 to 120 days before elections). Finally, both studies call for metrics and models capable of exploring data from other social networks, useful in more than one electoral context (such as in different countries and continents), and not dependent on an arbitrary choice of words for filtering posts.
State-of-the-art discussion
Based on the conclusions of the presented studies and literature reviews, we can surmise that SM analysis, especially Twitter analysis, already plays an important role in democracies worldwide. Further, politicians and parties have already moved to online candidatures. Indeed, contemporaneous political activity is strongly based on the concept of the “permanent campaign” having a permanent nature, including the execution of campaign-like activities by the political actors during non-election periods. In addition, many studies correlating SM data and election outcomes are also being performed. However, some limitations can be highlighted.
Data-gathering barriers: SM platforms have substantial restrictions to access their data through their application programming interfaces (APIs). For instance, Twitter’s standard API (Twitter Inc., 2020a) only searches against tweets published in last seven days, and open queries do not guarantee that all tweets are returned. Furthermore, due to the Cambridge Analytica data scandal (Isaak & Hanna, 2018), the process of collecting data from Facebook and Instagram became more difficult and now requires Facebook’s explicit consent after it has analyzed the system requesting the information. This barrier leads to other study limitations, presented next. Focus on Twitter data: Most studies focus on Twitter not because it is the more relevant social network, but because it is easier to collect data from their API than from other social networks, such as the Facebook/Instagram API. For instance, it is possible to perform an open search for posts containing a word on Twitter but not on Facebook. As a result, large sets of data and indicators on other social networks are simply being ignored. Temporality: A great deal of research effort is spent only during campaign periods, even though there are currently “permanent campaign” activities. Considering that presidential candidates are usually also members of the parliament or are trying to be reelected, analysis of their online activities over longer periods can lead to better understanding. Moreover, most studies also fail to obtain data from the entire campaign period, restricting data collection to an arbitrary choice between one day and a few weeks prior to elections.
Agreeing with (Kreiss et al., 2018), who stated that “researchers should refrain from automatically generalizing the results of single-platform studies to ‘social media’ as a whole,” we conclude that studies regarding politicians’ behavior on SM covering other networks besides Twitter, as well as studying the correlation of this behavior and election results, is very necessary to better frame and understand this new scenario. Also, new metrics considering these networks should be investigated and proposed. These metrics must be well defined, generalizable, and applicable in several electoral contexts, such as across different countries and years.
Thirteen candidates ran for president in a controversial campaign that was polarized by two main candidates: Fernando Haddad and Jair Bolsonaro.
Despite ex-President Lula’s imprisonment in April 2018, polls pointed to him as the favorite to win the election in all scenarios. He was officially launched as a candidate, but after the campaigns started, Lula’s candidacy was denied by the Superior Electoral Court; he was replaced by former São Paulo mayor Fernando Haddad, who used the slogan “Haddad is Lula.” Both Lula and Haddad are from the Workers’ Party (PT), which won the last four presidential elections. The party is left-wing oriented.
The second most prominent candidate (elected as president after winning the first and second election rounds) was Jair Bolsonaro. He had been a federal deputy since 1991 and is well known as a veteran and for his non-politically correct opinions and speeches. He moved to a small party (PSL) in 2018 to get support for his candidature. In contrast to Lula/Haddad’s campaign, Bolsonaro presented a right-wing proposal. At the beginning of the campaign, he was stabbed in the stomach while interacting with supporters. His condition prevented him from returning to public activities and debates for the remainder of the first round.
Many candidates presented themselves as third options: Ciro Gomes (center-left) and Geraldo Alckmin (center-right) presented themselves as moderate options for left and right-wing voters. João Amoêdo, a right-wing businessman, was the “non-political candidate.” Cabo Daciolo (far-right) was often the “comic candidate.” Henrique Meirelles (center-right) represented the current government, which was very unpopular because of the impeachment of the last president. Marina Silva (center-left), the third most voted for candidate in 2014, and Alvaro Dias (center-right) completed the list of “third way” candidates. Guilherme Boulos (ultra-left), Vera Lúcia (ultra-left), Eymael (center-right) and João Goulart Filho (center-left) composed a group of candidates with very few supporters.
It is important to note that initially, the two most popular candidates were the Workers’ Party candidate (Lula/Fernando Haddad) representing the left and having the second most time on TV (2’23”), and Geraldo Alckmin, representing the right and with the most time on TV (5’32”), similar to previous elections in 2014. Geraldo Alckmin was confident that after the beginning of his campaign on TV he would perform better; this was shown to be incorrect (he came in fourth). Most of the other candidates had little time on TV and had to concentrate their campaigns on the internet. Jair Bolsonaro had only 8 seconds of TV time. As he was also prevented from participating in debates and public events, his campaign was mostly based on social networks – he even published from the hospital moments after his surgery.
Number of votes and TV airtime of each candidate
Number of votes and TV airtime of each candidate
Table 1 lists the candidates with the number of votes received and the duration of their official propaganda on TV, showing no relationship between exposure time on TV and votes received.
This research studies the relationship between SM and the electoral performance of candidates running in Brazil’s 2018 presidential election by focusing on the candidates’ use of SM and the impacts of this use. From this objective, we derived the following research questions:
RQ1: How did candidates use social media in 2018? RQ2: How did citizens interact with the official profiles of candidates during the year and during the campaign? RQ3: Is there a correlation between social media performance and votes received by candidates?
The approach for this research is based on gathering all data regarding candidates’ activities on the most used SM platforms in Brazil (Facebook, Twitter and Instagram) during 2018 from January until the first round of the elections. This data was collected and will be analyzed according to the following.
Measuring social media performance
As mentioned in Section 2, most studies measure performance on SM as the volume (sometimes considering sentiment) of posts made by ordinary people talking about a candidate (usually on Twitter). Such studies are based on the seminal paper by Tumasjan (Tumasjan et al., 2010), who claimed that “the mere number of tweets mentioning a political party can be considered a plausible reflection of the vote share and its predictive power even comes close to traditional election polls.” However, as discussed in Section 2.3, this approach has several drawbacks. This study presents an alternative.
In 1968 (ZAJONC, 1968) and beyond (Murphy & Zajonc, 1993; Zajonc, 1980, 2001) Zajonc studies on human psychology hypothesized that “mere repeated exposure of the individual to a stimulus object enhances his attitude toward it.” This effect, also called the familiarity principle, has been demonstrated in many different contexts, such as paintings, sounds, geometric figures, and affective reactions. In agreement with this theory, Swap (Swap, 1977) indicated that “overall, more frequently viewed others were preferred to those less frequently seen.” In other words, people tend to have better attitudes toward others whom they are used to seeing. Applying these theories in the electoral context, in 1986 Oppenheimer (Oppenheimer et al., 1986) found a correlation between politicians’ exposure and electoral performance, and Mondak (Mondak, 1995) found that “media exposure fuels political discussion.”
In a way different from most common hypotheses, we based our performance measurement on Zajonc’s mere-exposure theory by analyzing how many people are paying attention to a candidate by interacting with their content and propagating their presence, regardless of whether people are talking about them or not, in the context of SM. For this, we consider two sets of metrics. The first is the number of followers in each social network, and the second is the number of interactions on candidates’ posts.
The number of followers of candidates in each social network is a direct measure of how many people subscribed to directly receive candidates’ content. It is expected that more subscribers lead to more people receiving content and paying attention to a candidate. Considering an arbitrary time period before elections, we defined as metrics the total number of followers at the beginning and end of the period, the increase in the absolute number of followers over the period, and the increase in the relative number of followers during the period (see Table 2). It is important to note that this metric may fail to express how many people are paying attention to a candidate because not all content for all accounts followed by a person are shown to them: SM algorithms prioritize showing users content with more engagement and more aligned with users’ preferences (Lars Backstrom & The Facebook, 2013).
Follower metrics for performance measurement
Follower metrics for performance measurement
The number of interactions on the candidates’ posts consists essentially of the likes, comments, and shares on each post. These actions indicate that the user has seen and paid attention to the content and actively acted. One like may be considered a quick, easy endorsement of the content; a comment demands more cognitive effort and may be positive or negative; and a share replicates the content to the user’s own network, thereby actively helping to propagate it. In the case of Facebook, a like has subtypes, such as “Like”, “Love”, “Haha”, “Wow”, “Sad” and “Angry”. However, in practice there are no distinctions among these interactions, that may be considered as just one. This is because even negative reactions, such as “Sad” and “Angry”, are usually negative regarding the content of the post, for example the reporting of a sad situation, and not a disagreement with whoever posted it.
Indeed, all these actions, even negative comments, help to propagate a candidate’s presence online. As social network algorithms prioritize showing the content of users with more engagement (Lars Backstrom & The Facebook, 2013), this creates a snowball effect. As more people interact with a post, so it is shown to more people, leading to more people interacting with it. The end result of the exposure theory is that more engagement and more exposure may be correlated with a better attitude toward a candidate and more votes.
Interaction metrics for performance measurement
Thus, regardless of the social network, we consider the metrics related to number of likes, comments and shares (or similar items, such as Twitter retweets as synonyms of shares). We consider the absolute numbers in a period and the relative numbers per post. In the specific case of this study, we consider Facebook, Twitter and Instagram, and all defined metrics are presented in Table 3. It is important to note that if other relevant social networks would be created or identified as relevant in other elections, their metrics can also be added by following the same rationale of interactions. For example, considering YouTube, the number of visualizations, likes and comments on a video may be considered.
For our analysis, in order to avoid the selection of small arbitrary periods of time that would bias the results, we analyzed two periods: the campaign and the entire year leading up to the election (a period of 9 months).
Data was collected from the period of January 1, 2018, to October 6, 2018 – one day before the election. An information system was developed entirely for this collection and passed the verification process for access to Facebook/Instagram and Twitter APIs according to the official guidelines of each platform (Facebook Inc., 2020)(Twitter Inc., 2020b). The following data was collected:
From Facebook: number of likes (including subcategories such as sad, wow and lol), shares and comments; From Twitter: number of likes and retweets; From Instagram: number of likes and comments.
Social networks’ APIs allow for the gathering of data about past posts. Then, when a candidate was included in the system, all of their posts since January 1 were collected. In addition, considering that these metrics change in real time, the strategy consisted of updating data from the last 200 posts of all candidates every day. Then, the system was able to keep posts updated for 2 months after publishing, on average, without overloading the system or overcoming the APIs’ limits.
Data collection faced some limitations. As these networks’ APIs do not provide the number of followers for previous days, this information must be gathered on a day-by-day basis. Then, data about some candidates, such as Fernando Haddad, was not gathered from January 1 because they were not yet considered possible candidates. Thus, data started to be collected at least from the beginning of candidates’ campaigns. In addition, at the beginning of data collection, the accounts of Cabo Daciolo, Eymael and João Goulart Filho on Instagram were personal accounts, and it is only possible to automate data gathering from business accounts. Therefore, some of their data about Instagram followers were projected according to Facebook and Twitter variance. Finally, Instagram’s official API does not allow data collection of IGTV posts. Thus, data from this kind of post was ignored.
Data presented in this paper may present small differences in presented numbers from a preliminary version of the study presented in (Hidden, 2019). The differences in followers are due to the aforementioned projection of followers of minor candidates. Small differences in recorded interactions are due to adjustments to the time zones for data filtering. In (Hidden, 2019), we considered UTC, but in this paper we considered the Brazilian capital local time. This difference does not impact the results or conclusions of either of the papers.
Data analysis aimed to answer the research questions directly. Quantitative and statistical analyses were performed.
For “RQ1: How did candidates use social media in 2018?”, we performed quantitative analysis regarding the total number of posts by day and by platform, as well as the most used hashtags and words. We also analyzed the number of posts related to contentious topics at that moment in Brazil, such as healthcare, unemployment, education, corruption, public security, and social security.
For “RQ2: How did citizens interact with the official profiles of candidates during the year and during the campaign?”, the analysis is focused on the variation of candidates’ followers in each network and quantitative analysis of citizens’ interactions (likes, shares/retweets and comments) regarding the candidates’ posts.
For “RQ3: Is there a correlation between social media performance and votes received by candidates?”, we performed a statistical analysis to correlate data regarding candidates’ activities and votes received, as well as data pertaining to citizens’ interactions and votes, according to performance metrics already presented. The analysis was performed in two steps: (i) correlation analysis between each metric as defined in Section 4.1 (for example, likes on Facebook versus votes received) in order to find the strength of the relationship between votes and the variables related to SM performance; and (ii) linear regression models were created and tested for a preliminary prediction function.
Study results
This section presents the analysis and discussion of the collected data. First, we provide an overall summary of the results. Then, the findings and answers to the defined research questions are presented and discussed.
Candidates’ official accounts
Candidates’ official accounts
Thirteen candidates ran for the presidency. During the campaign, all of them had accounts on Facebook, Twitter, and Instagram (see Table 4).
The night before election day, the presidential candidates had, in total, 30.2 million followers of their SM accounts. The candidate with the most followers was Jair Bolsonaro, with a total of 12.5 million, and the candidate with the fewest followers was João Goulart Filho, with 20,500 followers.
In total, the candidates published 44,265 posts, with 12,776 (29%) on Facebook, 23,312 (53%) on Twitter and 8,177 (18%) on Instagram. These posts generated 290 million interactions – 143 million on Facebook (49%), 32 million on Twitter (11%) and almost 116 million on Instagram (40%). Detailed results and discussions are presented next.
RQ1: How did candidates use social media in 2018?
This research question aims to identify how candidates used their SM profiles throughout 2018 with regard to their total number of posts by day and by platform; most used hashtags; most used words; and their posts about contentious topics of the moment in Brazil, such as healthcare, unemployment, education, corruption, public security and social security.
The majority of the posts made by candidates were issued on Twitter (53%), followed by Facebook (29%) and Instagram (18%). It is relevant to note that the main candidates, Jair Bolsonaro and Fernando Haddad, were not the candidates who posted most often. Considering the quantity of days before the election (279), each candidate performed an average of 4.1 daily posts on each platform, as shown in Fig. 1.
Most-used hashtags
Most-used hashtags
Number of daily posts made by candidates.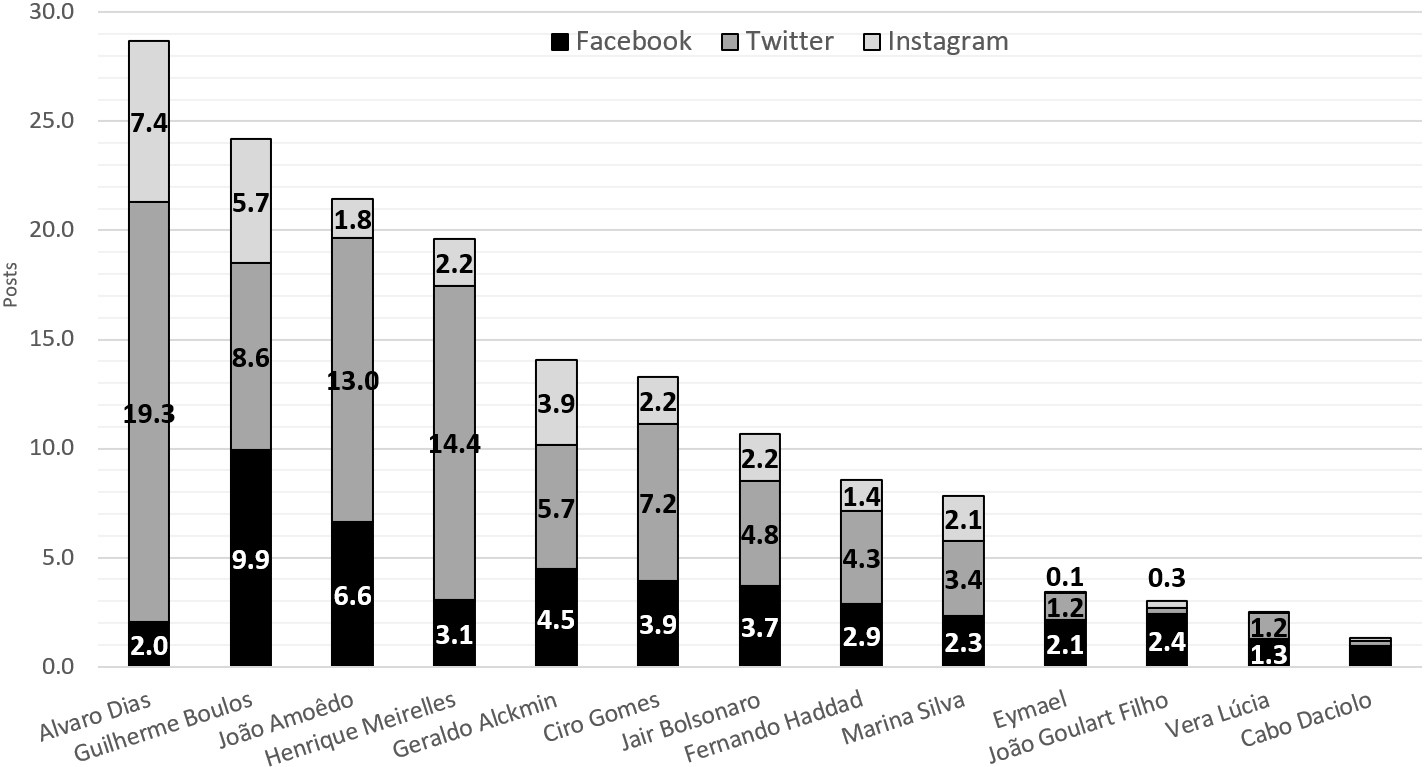
Regarding content, the most used hashtags and most used words (excluding stop words) are presented in Table 5. From the list of the 30 most used hashtags, it is clear that institutional hashtags prevailed in one of two categories: (i) a “team” post, indicating that the post was made by a candidate’s team but not the candidate himself (e.g., #ADCOMUNICAÇÃO, which refers to the Alvaro Dias team, or #EQUIPEHM, referring to the Henrique Meirelles team) or (ii) a slogan created for the campaign, such as #VoteSemMedo, meaning “vote without fear,” used by Guilherme Boulos. Only two hashtags do not fall into this category, #AoVivo, which was related to live content, and #Eleicoes2018, a general hashtag referring to elections.
Word cloud of most-used words.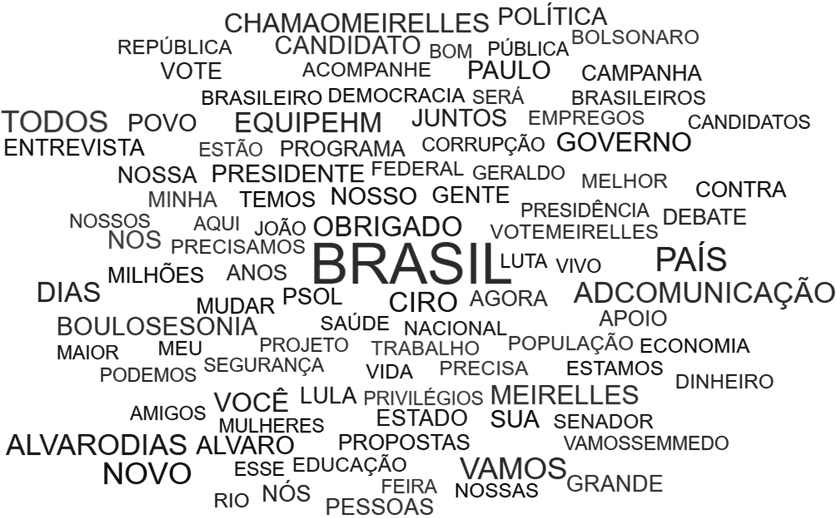
Figure 2 presents a word cloud related to the frequency of the 100 most used words, excluding most basic stop words. The most frequently used words were
Candidates used plural engaging words, such as Ex-President Lula, who started serving a 12-year jail sentence during the campaign but was considered a candidate until August 31, was the 32 Contentious topics were avoided by the candidates, appearing only after the 50
Going further in the content analysis, we assessed how each candidate posted about the contentious topics: healthcare, employment, education, economy, corruption, public security and social security.
Total posts about contentious topics.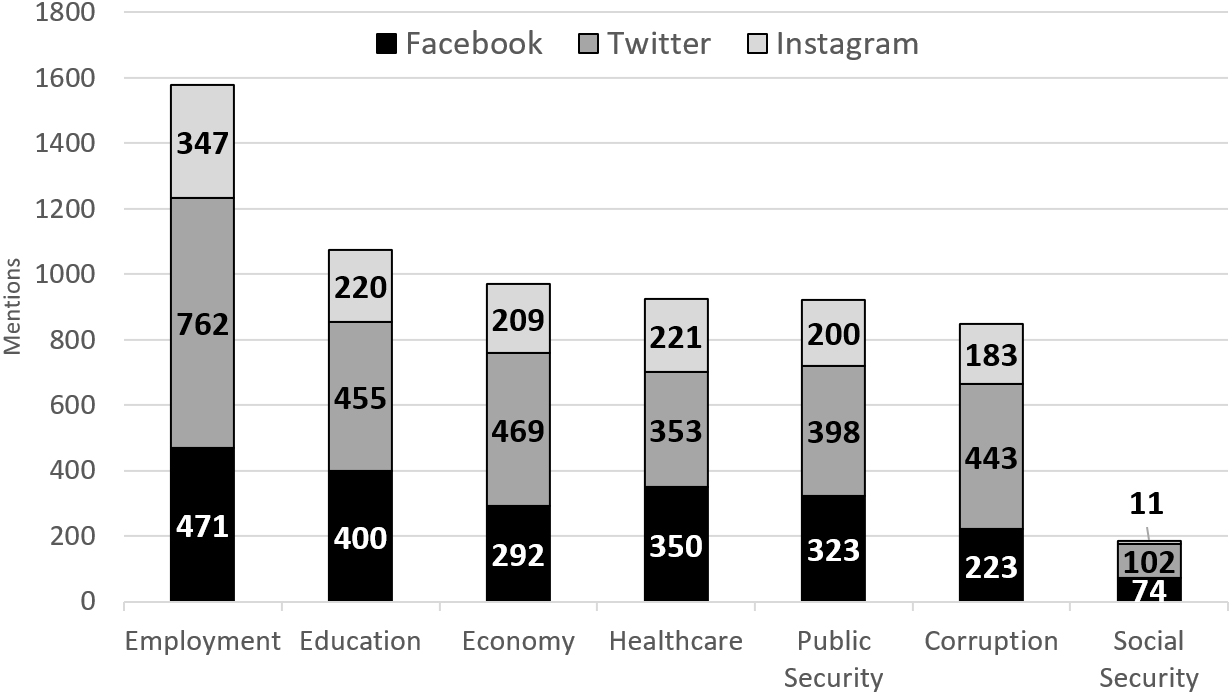
Posts about contentious topics, by candidate.
Overall, the number of posts was well balanced among topics, with two exceptions: employment was the most discussed, while social security reform was almost forgotten, as shown in Figs 3 and 4. Analysis indicates that the main candidates, Jair Bolsonaro and Fernando Haddad, posted little about contentious topics. Fernando Haddad focused on education and employment, and Bolsonaro on corruption, public security, education, and the economy. In fact, we now know that one of Bolsonaro’s first actions at the beginning of his term was social security reform, but this topic was not discussed at all in his SM posts. On the extremes, Alvaro Dias focused mainly on corruption, and candidates associated with economic liberalism (Geraldo Alckmin and Henrique Meirelles) focused on employment and the economy.
This result is compliant with (Bronstein, 2013), which concluded that “campaigns wanted to retain control
This research question aims to identify how Brazilian citizens interacted with candidates’ official profiles in two ways: (i) by the number of followers in each social network, and (ii) by the reach of posts issued by each candidate, as a means to measure their impact and ability to mobilize voters. As described in Section 4, we collected the number of candidates’ followers from the first day of campaigning, as well as the number of citizens’ interactions (likes, shares, comments and related metrics) on posts that the candidates made since January.
The number of followers of candidates’ accounts increased from 21 million on the first campaign day to 30 million on the last campaign day, an increase of 44%. Instagram presented the highest rate of increase (147%), followed by Facebook (34%) and Twitter (16%). Ciro Gomes (136%) and João Amoêdo (128%) received the most noticeable general increases in followers in relative numbers, while the president-elect, Jair Bolsonaro, increased his number of followers by 49% and Fernando Haddad by 67%. However, in absolute numbers Jair Bolsonaro was the candidate with the most new followers (4.1 million); Fernando Haddad had only the fourth-greatest total amount of new followers (733,000). João Goulart also presented a high increase in percentage terms (213%), but he started from a very small voter base compared to the main candidates.
The most noticeable network-specific increases occurred on Instagram for João Amoêdo (326%), Fernando Haddad (282%), Ciro Gomes (230%) and Jair Bolsonaro (143%). This data suggests the beginning of a behavioral change in Brazil, with people who use Instagram becoming more interested in political content. At the other end, the candidate with the second most followers in total, Marina Silva, presented an increase rate of only 3%, and Alvaro Dias also presented a small increase rate (4%). Their lesser performances may be explained because both of them already had large bodies of followers at the beginning of campaign (Marina Silva was the 3
Candidates’ posts generated 290 million interactions, by considering the sum of the number of likes, shares, and comments – 143 million on Facebook (49%), 32 million on Twitter (11%), and almost 116 million on Instagram (40%), showing that Facebook was the social network with the most impact. Despite the higher number of posts on Twitter, as indicated in Section 5.2, the performance of all candidates was low on this social network, obtaining a maximum of 20% of interactions. Moreover, two candidates performed better on Instagram: Jair Bolsonaro and Ciro Gomes. All other candidates performed better on Facebook. Nevertheless, the fact that the first and third most voted-for candidates performed better on Instagram supports the previous conclusion that Instagram may be gaining greater relevance in the Brazilian political context.
The most important finding in this analysis is that the profiles of the most voted-for candidate, Jair Bolsonaro, were responsible for receiving more than half (55%) of the interactions received by all the candidates. Since he had almost no time on official TV propaganda (1% of the time, as shown in Table 1), this data supports the assumption that his online campaign was the main determinant of his election.
| Candidate | FBIncrease | FBIncrease% | TTIncrease | TTIncrease% | IGIncrease | IGIncrease% | FollowIncrease | FollowIncrease% | ||||
|---|---|---|---|---|---|---|---|---|---|---|---|---|
| Alvaro Dias | 35 | ,561 | 3% | 4 | ,813 | 1% | 19 | ,535 | 57% | 59 | ,909 | 4% |
| Cabo Daciolo | 184 | ,542 | 84% | 45 | ,473 | 84% | 134 | ,819 | 84% | 364 | ,834 | 84% |
| Ciro Gomes | 354 | ,152 | 111% | 177 | ,086 | 89% | 414 | ,692 | 230% | 945 | ,930 | 136% |
| Eymael | 9 | ,251 | 69% | 1 | ,721 | 8% | 851 | 65% | 11 | ,823 | 32% | |
| Fernando Haddad | 326 | ,167 | 89% | 94 | ,038 | 15% | 313 | ,294 | 282% | 733 | ,499 | 67% |
| Geraldo Alckmin | 172 | ,494 | 18% | 21 | ,126 | 2% | 18 | ,740 | 16% | 212 | ,360 | 10% |
| Guilherme Boulos | 175 | ,286 | 51% | 65 | ,299 | 66% | 120 | ,004 | 85% | 360 | ,589 | 62% |
| Henrique Meirelles | 51 | ,437 | 26% | 11 | ,503 | 21% | 10 | ,310 | 49% | 73 | ,250 | 27% |
| Jair Bolsonaro | 1,499 | ,310 | 27% | 340 | ,639 | 27% | 2,289 | ,777 | 143% | 4,129 | ,726 | 49% |
| João Amoêdo | 1,532 | ,670 | 109% | 109 | ,987 | 99% | 480 | ,551 | 326% | 2,123 | ,208 | 128% |
| João Goulart Filho | 11 | ,630 | 213% | 1 | ,057 | 190% | 1 | ,179 | 202% | 11 | ,630 | 213% |
| Marina Silva | 54 | ,236 | 2% | 27 | ,976 | 1% | 47 | ,065 | 43% | 129 | ,277 | 3% |
| Vera Lúcia | 7 | ,049 | 42% | 1 | ,326 | 271% | 497 | 79% | 8 | ,872 | 50% | |
| Total | 4,413 | ,785 | 34% | 902 | ,044 | 16% | 3,851 | ,314 | 147% | 9,164 | ,907 | 44% |
Variations in the number of followers during campaign
Number and percentages of interactions in each network
Table 8 shows the sum of interactions received by the posts of candidates. All detailed metrics related to interactions throughout the year and during the campaign are shown in Appendix.
Interactions only during the campaign and throughout the entire year.
Among 290 million interactions on candidates’ posts, 193 million (67%) took place during the campaign, as illustrated in Fig. 5 (which shows the total number of interactions in both periods). From this data, we can observe that (i) the impact of candidates Fernando Haddad (92%), Ciro Gomes (87%), and Eymael (75%) mainly occurred during the campaign, while other candidates, such as the winner Jair Bolsonaro (64%), started their campaigns and mobilized their networks beforehand. It is also worth highlighting the results of Alvaro Dias, whose campaign interactions were only 39% of the total. As with the small variation in the number of followers, this finding can be explained by the fact that he was already a senator, and his SM impact while in that office was not very different from his impact during the campaign.
Number of interactions per post
Table 9 shows the number of interactions per post in each platform and the average number considering all posts of candidates. sBecause the number of posts made by candidates is different in each platform, the average value is a weighted average. This data indicates that for the most prominent candidates, the impact of a post on Instagram was higher than any other type of post; that is, although the use of Twitter was higher than any other SM platform, Instagram was more effective. Another unexpected result was the interaction rate of Cabo Daciolo. He was the candidate with the fewest number of posts (as shown in Fig. 1), but he received the second-best interaction rate by post. This outcome can be explained by the fact that Cabo Daciolo was perceived as a “comic candidate.” Most of his posts were also humorous, and people often viewed his posts as a pleasant escape from the extremist duality observed in the election period. Many of Daciolo’s posts became memes (Taecharungroj & Nueangjamnong, 2015).
A common hypothesis regarding a direct relationship between interactions on SM and received votes cannot be easily observed. Although the most voted-for candidate was also the one with more interactions on SM than others, the candidate with the second most interactions (João Amoêdo) only received the fifth most votes. Also, the second most interacted-with candidate by post (Cabo Daciolo) was the sixth most voted for. This lack of direct correlation, but other possible correlations, is better presented and discussed in the next subsection.
To find possible correlations between SM performance and electoral results, we performed a correlation analysis by calculating the Pearson correlation coefficient (PCC) of all measures presented in Section 4.1 and the numbers of votes received. In addition to the defined metrics, we also calculated the coefficient considering posts with mentions contentious topics, as discussed in Section 5.2. We considered two periods: campaign only, and the entire year.
Pearson correlations between candidates’ behavior and votes
Pearson correlations between candidates’ behavior and votes
Table 10 presents the Pearson correlation coefficient regarding the candidates’ behavior and votes. We found no correlation between the absolute number of posts on SM platforms and the number of received votes, as the resulting correlations (r) varied from
Pearson correlations between followers’ metrics and received votes
The correlations between followers’ metrics and received votes are presented in Table 11. Despite higher number of followers on Facebook, the highest correlations with votes were related to the absolute increase of followers on Instagram, as well as to the number of followers at the end and beginning of the campaign in this SM platform. Thus, this data once again reinforces the importance of the Instagram platform in Brazilian elections. The absolute increase of followers on Twitter also presented high correlations, but all other metrics regarding Twitter presented small correlations. In addition, the rates of follower increases had no, small, or even negative correlations, varying from
Pearson correlations between interaction metrics and received votes
Regarding citizens’ interactions, we found strong correlations among all the defined interaction metrics and votes, as shown in Table 12. All metrics presented correlations equal to or higher than
It is important to highlight that correlations do not mean causality. Although the theory that inspired the definition of the set of performance metrics used in this study suggests a causality relation between exposure and enhancing of attitudes regarding an individual, the objective of this study was to find whether correlations – not causality – existed. Finding correlations among SM metrics and votes does not necessarily mean that SM impacts votes. Offline events, the behavior of candidates in debates, the effectiveness of their propaganda or many other facts may equally impact both electoral results and SM performance, leading to such correlation. In this sense, we think that measuring SM performance may be a quick and easy way to measure public opinion, complementing traditional polling methods.
As a natural consequence of finding these correlations, the next step is trying to predict electoral results based on SM data. As presented in Section 2, there are already many studies trying to correlate SM performance and electoral results (Chauhan et al., 2020), but most of them try to correlate the volume of people talking about a candidate (by measuring the number of posts on Twitter mentioning a candidate) and electoral results. In this study, we tested the defined performance metrics with a linear regression model in a very preliminary approach.
Despite the high correlations, it was not possible to find a linear model to precisely describe election results based on defined metrics. By applying a linear regression algorithm (Yan & Gang Su, 2009) on all metrics combined, the best model produced a mean absolute error (MAE) of 24 million votes (22.5% of total votes). By applying the same linear regression using each metric individually, the best model presented an MAE of 9 million votes (8.8% of total votes). These results are far from acceptable, but such margins were expected due to the characteristics and simplicity of the tested model. The model with all metrics contained more than 50 highly correlated features and only 13 samples. We did not expect good results with this setup. When each variable was considered individually, we had already concluded during data analysis that the high correlations between SM and electoral performance were not linear correlations. Thus, nonlinear approaches should be defined for an adequate modeling of this problem.
Our analysis indicates that, despite high correlations between SM performance and received votes, further studies are needed to create a prediction model based on these metrics, especially nonlinear models. In this sense, our proposed metrics may be used as input data for such future models.
This paper presented a study on the relationship between SM and the electoral performance of candidates running in the 2018 Brazilian presidential election by analyzing how candidates used their SM profiles and the ways in which citizens interacted with them. We tried a new approach to find a correlation between candidates’ SM performance and votes received by using metrics from the three major social networks: Facebook, Twitter and Instagram. For this effort, we collected data about all 44,265 posts from candidates within these networks from January 1, 2018, to October 6, 2018, one day before election day. This study is novel in that it defines a new set of SM performance metrics based on data of the three major social networks, which contrasts with most studies’ focus on only Twitter data, and we used a wider data collection period.
Regarding RQ1 (How did candidates use social media in 2018?) we summarize our findings as: (i) The candidates used SM very heavily, with an average of 4.1 posts every day on each platform, totaling 12.3 posts per day. (ii) The most-used platform was Twitter, receiving 53% of total posts. (iii) The candidates who received the most votes were not the candidates with the most posts. (iv) The main hashtags used were identified as “team posts,” or campaign slogans. (iv) The most-used words were engaging words. Contentious topics (e.g., employment, education, and healthcare) were not prominent, and the controversial topic of social security was almost forgotten, especially by the candidates who received the most votes.
Considering RQ2 (How did citizens interact with the official profiles of candidates during the year and during the campaign?) we conclude that: (i) Instagram users are increasing the attention given to political content on that platform. During the campaign, the rate at which the number of followers increased was 147%, while on Facebook it was 34% and on Twitter only 16%. (ii) Most interactions occurred on Facebook, because there were more posts on this social network than on Instagram. However, considering reactions by post, Instagram was more relevant for all main candidates, even those with fewer followers. (iii) Although Twitter was the most-used network for posting, its impact was very low, with the lowest rate of interactions. (iv) Some candidates’ performance was very concentrated during the campaign period, including the candidate who received the second highest number of votes. Others, including the winning candidate, got citizens’ attention early. (v) The most voted-for candidate, Jair Bolsonaro, received more than half (55%) of the interactions received by all the candidates.
Finally, for RQ3 (Is there a correlation between social media performance and votes received by candidates?), we defined a set of metrics to measure SM performance, as well was seven specific measures for posts related to contentious topics. Our statistical analysis found several notable relations: (i) There were no correlations between the number of posts and received votes. (ii) There was a small negative correlation for posts about contentious topics. (iii) There was a strong correlation with respect to candidates’ numbers of followers, especially on Instagram. (iii) There were strong correlations with all variables related to interactions with posts, both during the entire year and only on the campaign. (iv) Despite strong correlations, further studies are necessary in order to create a nonlinear model to describe these relations.
This study analyzed an election held before the COVID-19 pandemic. The pandemic led to restrictive measures being adopted worldwide, such as lockdowns and social distancing (Bonaccorsi et al., 2020). Popular rallies and the concentration of supporters have not been allowed in many places. Thus, the online campaign was the main, and in some cases the only, way to campaign in 2020 and 2021, speeding up the adoption of SM by candidates. Consequently, it is expected to see the increase of SM use by candidates in coming years, as well as the correlations between citizens’ online behavior and electoral results, and this study is one of the pioneers in this subject.
In terms of future work, we highlight the objective of forecasting electoral results based on SM data. In this sense, the proposed metrics may be used as input data for future models. Also, new datasets may be included, such as campaign pools and demographic data, and specific approaches using data mining and machine learn methods may be promising. Further, as this study can only draw conclusions about one election that occurred in Brazil, future work is suggested to replicate this study with data from other elections around the world, especially the elections that occurred during the COVID-19 pandemic.
Footnotes
Supplementary data
The supplementary files are available to download from https://dx-doi-org.web.bisu.edu.cn/10.3233/IP-210315.