
Abstract
The technological advancement in the equipment used in ships and emission restrictions from the classification societies forces the ship owners to periodically perform retrofitting on their ships. Therefore, ship owners today plan to utilise the docking downtime of a ship at a shipyard to its maximum potential. During this docking period in the shipyard, they would plan to perform all the retrofitting activities as well as any maintenance activities required for the ship equipment. In order to execute all the activities within the minimum downtime, a thorough and careful planning of the activities is required. With the ship under continuous operation before its docking at the shipyard, it could be possible that all the required documents for planning activities are not available for the shipyards. In order to tackle this problem, in the European Commission (EC) funded project GRIP – Green Retrofitting through Improved Propulsion, the use of Simulation Tools and Reverse Engineering was executed and tested, and so to perform the retrofitting activities more effectively and efficiently. Of the different Green technologies accessed by the GRIP Consortium, the retrofitting of Pre-Swirl Stator Fins was selected as the prototype study for testing and validating the Simulation Tools and Reverse Engineering Technologies proposed in GRIP. Tools developed in the Simulation Toolkit for Shipbuilders (STS) and newly developed planning tool anteSIM were used by CMT to perform simulation of retrofitting activities and thereby provide planning recommendations to the shipyard. IMAWIS used Laser Scanning as the Reverse Engineering technologies studied in the project to perform measurements and dimensional accuracy comparison after the assembly process of the Pre-Swirl Stator Fins. The methodologies and results from the execution of the Simulation Tools and Reverse Engineering Technology are satisfactory in order to provide beneficial recommendations for efficient planning of retrofitting activities in the shipyards.
Introduction
The technologies used in the operation of a ship have undergone considerable changes in recent years, this is due to new, and successful, research activities performed into more efficient and effective propulsion technologies. These research initiatives are carried out either because of the out-of-date technologies or due to the increased emission and safety restrictions set by the classification societies. This continuous improvement in the technologies used in the operation of a ship forces the ship owners to perform regular retrofitting activity in their ships in order to remain competitive and also to be within the standards set by the classification societies. Compared to new building, the lead times for execution of retrofitting jobs is often particularly short, as ship owners are interested at minimising the downtime of their vessels, retrofitting can be to their benefit. The same applies for the lead-time available for preparation and planning, especially when considering repair, which cannot reasonably be planned in advance. When it comes to used and older ships, there is often little and unreliable information about the ship’s hull and systems available. This holds both for geometry and dimensions related information, and the general condition of the vessel, which sometimes leads to re-planning and re-work during the execution of a retrofit.
Retrofitting and repair shipyards are usually neither specialised in handling a certain ship type or ship system. Hence, these companies have to rely on planning and control methods that are fit for different ship types and a broad range of activities. Reverse engineering provides the technology that supports retrofitting shipyards in obtaining missing geometry information and transferring it in to a CAD model. Compared with a mere visual inspection and manual measurements, this part of the work can be done much more accurately and quickly. Simulation can be used to support (not to replace) existing production planning tools by checking and comparing various possible planning scenarios, helping to identify the best suitable one. Combining a simulation tool with a customised data management tool allows for preparing and executing simulation studies in an efficient way. The dimensional and product structure information that are required in order to simulate the execution of a retrofitting activity in a shipyard can be obtained from the shipyard data management systems. If there is no standardised data management system at shipyards (which is the case in most small and medium sized shipyards), then the Reverse Engineering technology could be used as a valuable tool to obtain the geometrical information. During the study of the GRIP project, the dimensions of the Stator Fins were compared for dimensional accuracy with this technology. The information with regards to the product structure of the system is at the moment not completely available via reverse engineering techniques, but actions have been undertaken to provide a solution for this issue as well.
Objectives
The objectives set by the GRIP consortium for the implementation of Simulation Tools and Reverse Engineering Technology during the execution of retrofitting activity at a shipyard is,
Develop a methodology to utilise Reverse Engineering Technologies to improve the Retrofitting activities in shipyard, Develop a methodology to utilise Simulation Tools for the planning of Retrofitting activities in shipyard, Test and Validate the proposed methodologies by implementation in a prototype case of Retrofitting activity.
Reverse engineering technologies
Problem definition
Product data, like CAD-files or drawings, are often not or only partially available for old vessels which are candidates for the retrofit process. Necessary or missing geometric information of retrofit candidates can be measured and transferred to the CAD-system of the shipyard or design offices by the use of reverse engineering technologies.
On the outside of a ship, many application cases are possible for modifications with Energy Saving Devices (ESD) or removing old components, like rudder, propeller etc., and installing new elements. A perhaps unexpected source of errors in retrofitting a ship with energy saving devices is the actual shape of the ship hull. The optimal energy saving device is very sensitive to the actual hull shape of the retrofit candidate. Unfortunately, many ship owners do not know the exact geometry of the ship hull. Ownership of the ships change quite often, diffusing existing information by only partly or not documented modifications. Furthermore, many shipyards do not disclose the actual ship geometry to the ship owner, enforcing the owner to return to the original shipyard for fitting Energy Saving Devices or other retrofitting works.
Therefore, measurement and CAD modelling of the actual ship hull and its appended systems are required as a basis for the efficient and effective retrofitting of a ship. Within GRIP project, a concept for determining the hull lines with digitising techniques was developed. Possible reverse engineering systems were identified and benchmarked with respect to various retrofitting scenarios of exterior components. Accurateness, robustness, flexibility, ease of use and required skills were among the benchmarking criteria. This allows the ship owner to order the device and have it fitted in any requested shipyard.
Methodology to implement reverse engineering technology
Energy Saving Devices (ESDs) are appendages to the ship hull, the rudder or the propeller which improve the inflow and outflow of the propeller. For the retrofitting process with an ESD it is necessary to determine the actual ship geometry. There are a number of different reverse engineering technologies which can be used to generate digital geometric information of the ship hull.
Within GRIP an initial overview of the state of the art was prepared. For the later benchmark it was initially necessary to consider the possible technologies regarding their properties for the use in this project.
Tachymeters are very precise technologies which are established in the industrial measurement, but they are very limited in their mobility and are normally high-priced.
Laser scanners are appropriate to measure large surface or complex objects in a short time with a high degree of detail as well as a good accuracy.
In-door GPS is a simple method for the detection of discrete points, if it is always measured in the same measurement environment and there is no shadowing.
Photogrammetry and Photo modelling allow a simple and flexible detection of many object points in a short time. In case of the Photogrammetry, there is also very good accuracy possible but each measurement point must be signalled with a target.
Panoramic photography is a very new field in the 3d object measurement and primarily applicable for the fast capture of complex geometries with relatively low requirements concerning the accuracy.
The use of a measurement system always depends on the specific demands of the ESD. In some cases, two or more systems can also be used to cope with a task. The different data must subsequently be merged with reference points in various measurement systems.
Within the benchmarking procedure, performance parameters from the measuring systems were compared with parameters from the retrofitting scenarios. The objective was to find an optimal solution to capture the needed product data and to transfer this data into the product model. Optimal solution means the achievement of the needed quality of data (accuracy, level of detail) of the retrofitting object with minimal consumption of time and costs.
The retrofitting process mainly depends on the availability and quality of geometric and functional information about the hull, propulsion components (rudder, propeller etc.) or interior outfit that has to be removed, substituted or modified. A 3D CAD model of the ship hull and appended propulsion components are essential for designing the ESD and the retrofitting process. Such a 3D CAD model is in many cases not available or modifications are only partly or not documented, because:
The ship was built before 3D CAD modelling techniques became standard in design offices and yards.
The shipyard does not release the 3D CAD model to the ship owner or other yards.
The ship was not built as designed, because of production limitations or problems.
The ship was appended with devices for increased stability or for specific operations.
During the life cycle of ships, intermediate modifications of the hull, propulsion components, machinery or other outfit have to be done.
Many of the important data are available in several sources of design documents (drawings, bills of material). But the level of detail can be very different from only a few dimensioning parts to a full CAD model. Reverse engineering will generate the missing geometric information by the use of suitable measurement systems to create a 3D virtual model of the actual ship hull and appended systems as a basis for the efficient and effective retrofitting of a ship.
A critical point in the evaluation of geometric data is the transfer of the product data into the various CAD-systems or other evaluation software. By the use of different software for measuring and evaluating, the number of the used formats is very high. This has the consequence that during the transfer between the formats, information or the structure of the data can be lost as data can be stored and reloaded in very different ways. In the course of the practical investigations it showed that the file formats, STEP or IGES, showed the best potential. Because of the standardisation of both formats, they are suitable for data exchange between different systems.
A concept for the full scale experiments with reverse engineering technologies is given in this chapter. The recommendations were incorporated in order to grant a smooth process as possible.
Validation experiment for the methodology developed for reverse engineering implementation
A major aim of the GRIP project was the development, installation and testing of an ESD as a full scale experiment. The developed ESD was a system of three fins placed in front of the propeller. It was installed on a bulk carrier named ‘VALOVINE’ at the Viktor Lenac Shipyard as part of the Uljanik Group in Rijeka, Croatia. The docked vessel is shown in Fig. 1. A 3D measurement (Laser scanning) of the installed fins was carried out for checking and documentation. On the one hand the captured data was used to control whether the ESD was installed in the designed assembly parameters, on the other hand a new model of the actual status of the aft ship should be prepared for new hydrodynamic calculations by the project partner HSVA.

Bulk carrier ‘VALOVINE’ in dry dock at Viktor Lenac Shipyard.
The most of the potential problems can be minimised or prevented by executing a precise planning beforehand. The prepared concept for full scale experiments were used to plan the measurement. The focus was on organisational matters, selection of the equipment as well as requirements of the evaluation and coordinate system.
Already during the planning phase it needs to be clarified whether or which specific coordinate system should be used. This choice influences the further way of proceeding and whether additional instruments are needed. Moreover, points with known coordinates of the object have to define to transform the measured data into the selected system. Furthermore, it was necessary to clarify with all partners which form the later results should have – only a measurement report, specific dimensions of the object, a point cloud or a whole 3D model. This can affect the choice of the coordinate system. It was decided with HSVA to measure in the ship coordinate system so that the CAD model can be directly imported into the existing data.
After these points were clarified, the measuring system could be selected. For this, the benchmarking procedure was used. The selected technology was Laser scanning. A fast detection of large surfaces could be performed with this system. This was necessary to detect all structures with a high degree of detail as well as a good accuracy. For all these requirements a Laser scanner system is the best solution also under the expected conditions at site. Additionally to increase the accuracy, a Tachymeter was used to measure the tie points of the scanning system. The following section describes the basic principle and measurement sequence of Laser scanning systems.
Laser scanning
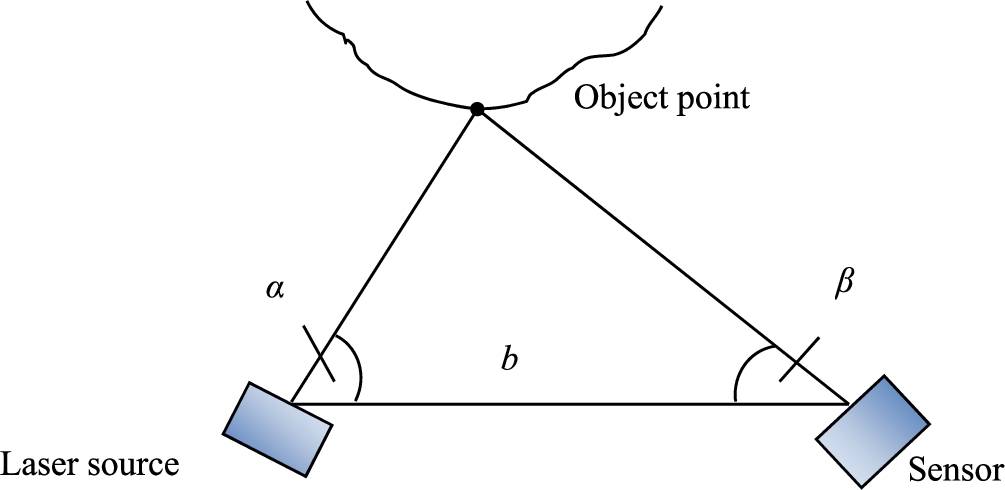
Laser scanners can be distinguished into two types. On the one hand there are laser scanners which use the laser light directly. This means distances will be determined with the laser light as the measuring medium. On the other hand there are the scanners which measure only the image of the laser light without a distance measurement. These scanners use the triangulation method to determine the position of a measured point (Fig. 2).
The triangulation principle means that a laser source projects an illuminated spot under the known angle α onto the measured surface. The projected point is observed under the angle β on the sensor. With the two observed angles, and the known/fixed base b, the position of the spot can be evaluated. Instead of an emitted spot it is also possible to use a projected line which maps a profile of the object surface onto the sensor.
The main advantage of this scanning method is the high accuracy which can be reached. It is possible to measure in sub-millimetre range and better. However, the triangulation scanners have a limited measuring range of some metres which is their biggest disadvantage. This means that the areas which are measured are only small sections of the measured object but these sections have a very high accuracy.
Principle of laser scanners with triangulation method.

Principle of laser scanners using laser light directly.
The scanners, which use the emitted light directly for the distance measurement, work similar to a total station (Fig. 3). There are observed angles in vertical (z) and horizontal (t) direction and a measured distance D for every emitted spot. The 3D coordinate of the unknown point can be calculated by these three pieces of information.
The distance measurement can be done in two ways. On the one hand the time of flight method is used. This means to measure the time which an emitted laser pulse needs to move to the target and back. With the known speed of light and an accurate time measurement, the distance can be calculated. This technique allows the measurement of distances up to several hundred metres with an average accuracy in the range of centimetres.
On the other hand the phase measurement method is used. There, the phase shift between the outgoing and the reflected incoming laser beam is analysed and the distance can be calculated. The measuring range is restricted to one hundred metres and the achieved accuracy amounts to some millimetres.
The used Laser scanner in this project was also high-speed phase-based Laser scanner (Zoller + Fröhlich Imager 5010i). A big advantage is the fast detection of large surfaces and complex objects with a high point solution around 1 mm. For scanning details, like the fins, the opportunity of higher solutions is also feasible.
The procedure for generating measuring values is similar for all scanning methods. First, the laser scanner is positioned in front of the measuring object. Then, the measurement is started and measuring values are collected automatically. As a result, a point cloud of all measured points is generated. During the measuring time it is essential that there is no motion between the laser scanner and the measured objects.
Normally, it is not possible to get all information with only one point of view, for example there are shadowing effects such as a scaffold. That means there are several viewpoints required to measure large objects. To get the correlation between the various measurements, tie points or spheres are used. With these references, all measured point clouds can be transformed into the same coordinate system, so that the result is a big consistent point cloud which represents the whole measured object.
The measurement campaign was carried out on 16th and 17th of April 2014 at the docked vessel. On the first day, the installation of the ESD was examined with HSVA to clarify all open questions and to find out the conditions at site. Since apart from the Laser scanner also a Tachymeter was used, the light conditions had to be good. This was not a problem since the measurements were carried out in broad daylight. During the first inspection welding work was still performed on the fins and they were covered. A measurement was not possible in this way and had not made sense in an uncompleted state. So the measurement campaign was moved to the next day.
All work regarding the ESD was done the next morning. The fins were installed and painted. All disturbing elements were removed, so that good conditions prevailed for the measurements. First, all connection targets for Laser scanning were attached. These were distributed on the ship hull and the rudder as well as on the dock. The arrangement was documented by a sketch and several photos. This can be helpful for connecting the different scans together in the post-processing. Then the scanning from several points of view could be started.
Eight points of view were used from different angles. Scanning from one point of view on the ground of the dock is shown in Fig. 4. The tie points were also measured with Tachymeter to increase the accuracy. Furthermore, three points on the dry dock, which were marked by the measurement team of ULJANIK during the installation, were measured as one option to transform into the ship coordinate system. Additionally, discrete points on the ship hull and the rudder were determined with the Tachymeter as another option.
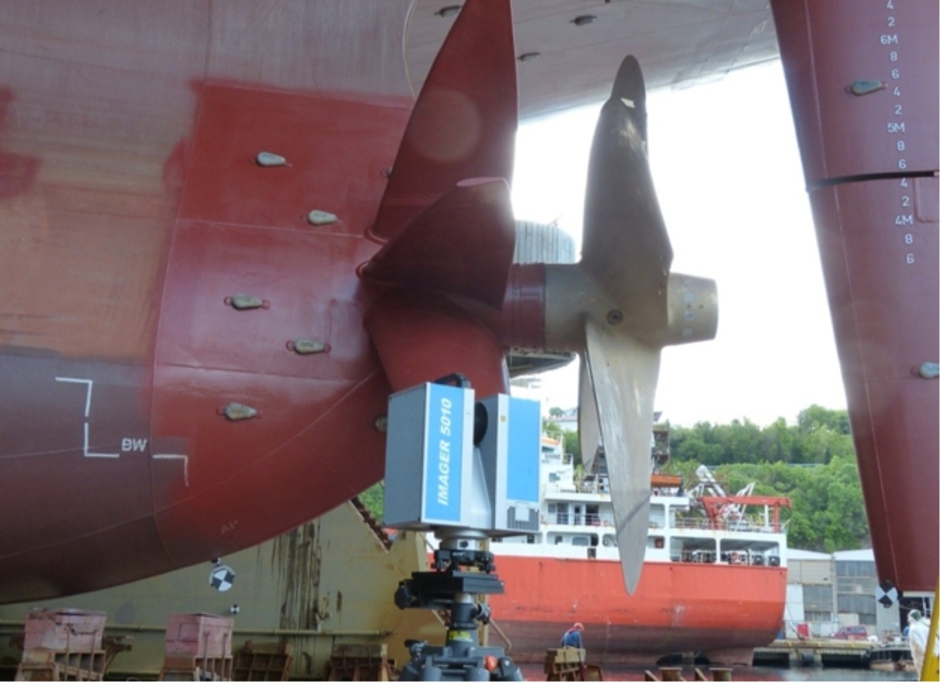
Laser scanning from the ground of the dry dock.
Lastly, two scanning points on the side walls of the dry dock were chosen to have elevated points of view and to determine the upper surface of the highest fin. This can be seen in Fig. 5. After the measurements were complete, all data was copied from the scanner to a USB flash drive.
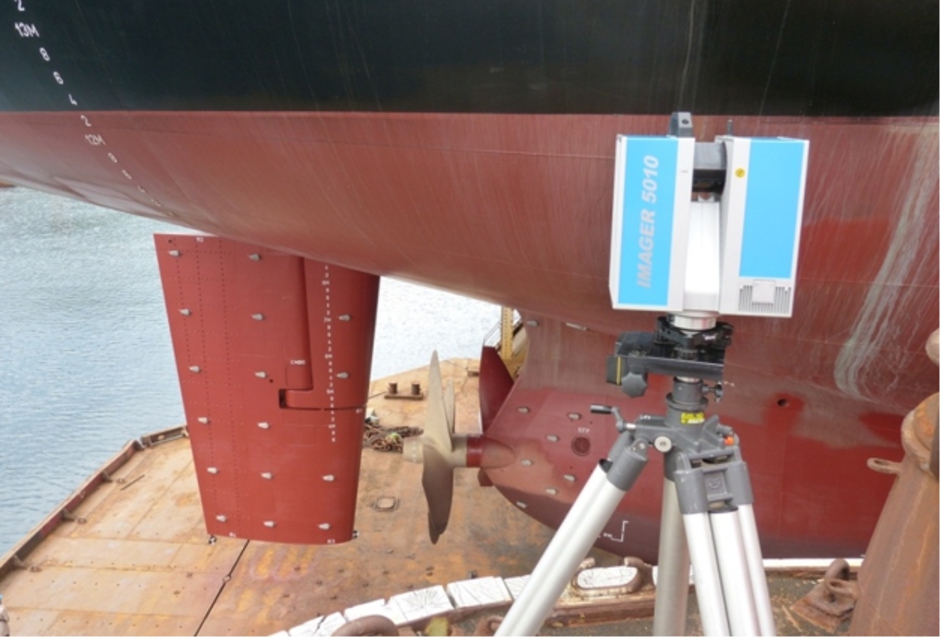
Measurement from an elevated point.
At first, all several scans had to be cleaned of incorrect points. Moreover, areas which were not necessary for the project, were eliminated. For this work and to transform the several scans into one coordinate system the software

Eliminated points (green) with Mixed-Pixel filter.
The software

Complete point cloud (top) and point cloud with excluded areas (bottom).
For further processing, the software package PolyWorks was used for modelling and specific evaluations. As all scans were in the same free defined coordinate system they could be imported into the software without any additional work. At this time it was not yet necessary to merge the point clouds into one. First of all the further considerations were carried out with the several scans. The imported point clouds are shown in Fig. 8.

Imported point clouds.
The definition of the coordinate system was implemented by using a best fit transformation. This means the measured data were optimally moved regarding a CAD model. This model of the vessel as well as the installed fins was provided by HSVA as the target state. Then the alignment was optimised in the x-direction by moving the data 50 mm backwards with particular attention to better results in the range of the fins and the rudder. All further evaluations were done in this coordinate system. For the visual illustration of the deviations between the point cloud and CAD model a coloured comparison was prepared. The comparison between the reference data (CAD-Model) and the measured data (point cloud) aligned into the used coordinate system can be seen in Fig. 9. This represents the best solution for finding the alignment of the coordinate system with the focus on the fins.
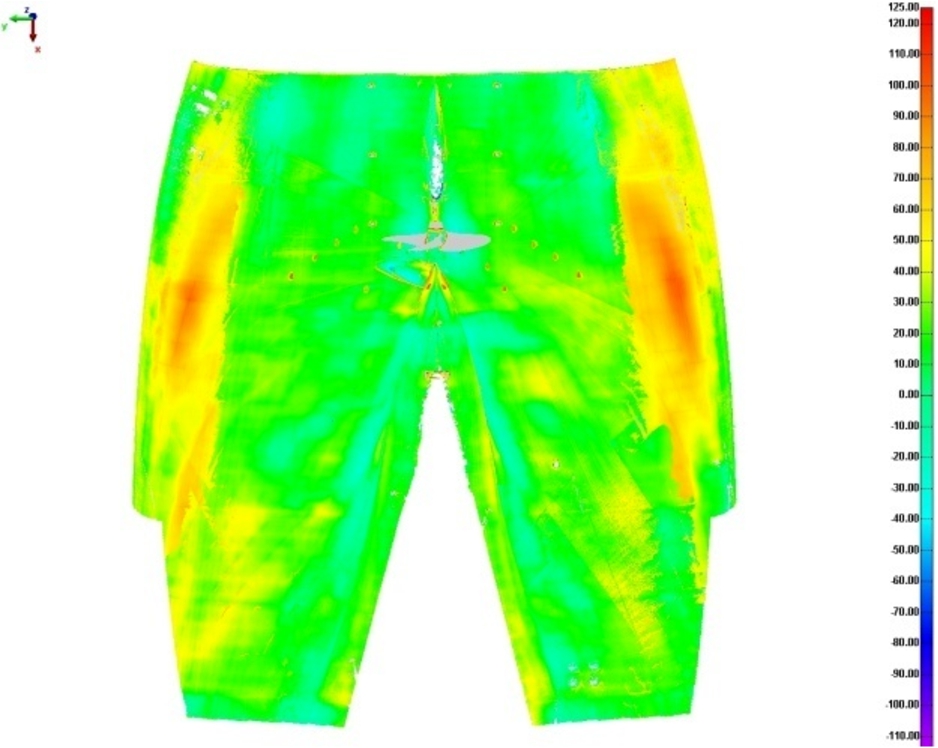
Comparison of measured data with CAD (View from bottom).
Besides the above mentioned solution other options of finding a coordinate system were carried out. These were the use of the points marked by ULJANIK and the discrete points of the ship measured with Tachymeter. However these options did not reveal such a good solution.
In a further step, the angles between the three fins were determined (Fig. 10). The angles were calculated between the two end points of each fin and the axis of the propeller shaft as origin.
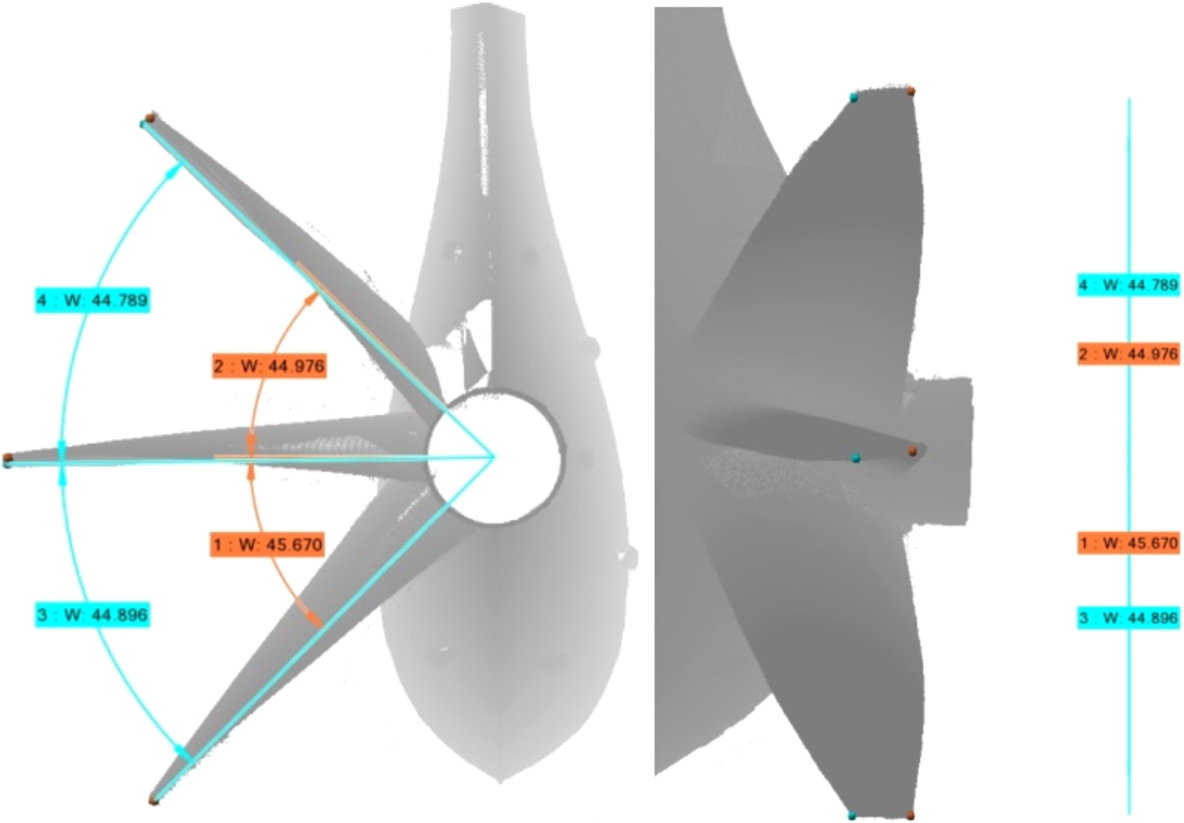
Angles between the end points of the fins.
Moreover, every fin was adjusted by a best fit regarding the CAD data into a local coordinate system to control the manufacturing accuracy. Thus, the deformation and deviation from the actual design could be determined. Also coloured visualisations were used to illustrate the deviations. This is shown for the lower side of the middle fin in Fig. 11. As seen in the figure, the highest deviation is located at the doubling. This was not designed before. The installation was decided later for more stabilisation. So the CAD data did not contain also this section, this explained the large discrepancy at this part of the fins.

Best fit comparison of measured data of the middle fin with CAD.
The measurement data of the fins in the ship coordinate system was also compared with the CAD model (Fig. 12). Thereby, the correctness of the installation of the fins could be checked in regard to the aft ship. The calculation shows that the fins are too far ahead (orange and yellow) and have a contortion (blue).
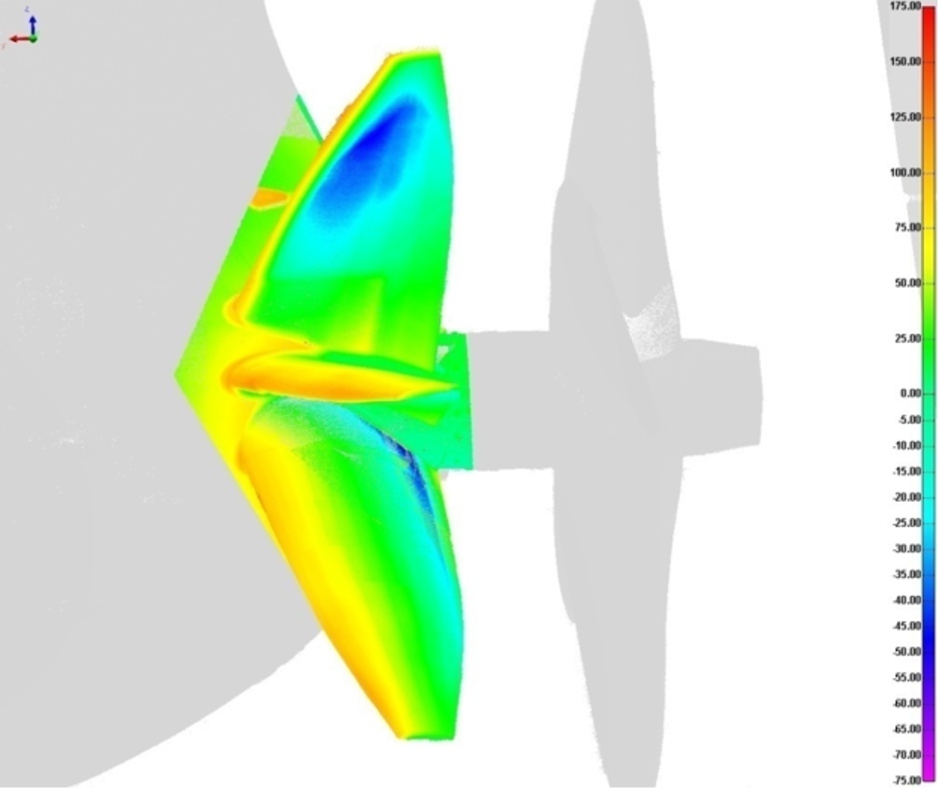
Comparison of measured data of the fins with CAD.
Because of the partially large deviations to the initial CAD model, it was decided to generate a new model of the aft ship with the collected data, especially for new hydrodynamic calculations. Thus, a cross section model with 1 m gaps in the x-direction of the aft ship was prepared (Fig. 13). Diverse profiles can also be generated in this way through cutting the measured point cloud in other directions. The results are curves, in this case frames, which can be exported as spline curves in STEP or IGES format for possible further processing in another CAD software. In this case, the curves were used by HSVA to generate a new CAD of the aft ship with data of the current hull.

Cross section model of the aft ship with 1 m sections in x-direction.
Furthermore, the actual data of the fins and the rudder were needed for the new calculations done by HSVA. Therefore, CAD models of these objects were prepared in the upper described coordinate system. At first the several point clouds were imported into the modelling module of PolyWorks. In this step, they were also merged to one point cloud. The important parts for the further processing, in this case the fins and the rudder, were then separated from the other data. By using the modelling module, polygon models were created out of the remaining point clouds, the created models were then optimised. This means holes were closed or the triangulation structure was smoothed. NURBS models were then generated with the help of the triangulated models, these are mathematical models which describe the surface of an object in a flexible and precise way. The NURBS model is produced from the polygonal model. A network of curves is put over the triangulations and re-gives the surface at best. The resulting CAD model of one fin and the rudder is shown in Fig. 14. These models can be imported and processed further in several CAD systems as STEP or IGES files. The created CAD model only includes the geometric information of the measured objects. In some cases it is also desirable that the model contains product information, like material or date of manufacture. This information has to add in cooperation with respective engineering offices.
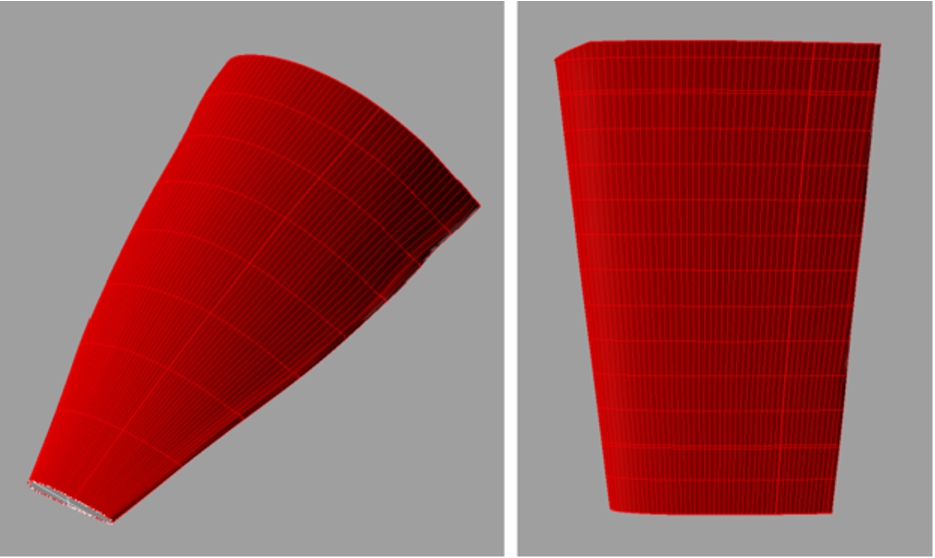
CAD models of one of the fins (left) and of the rudder (right).
The cross section model as well as the new CAD models were used by HSVA to generate a new full CAD model for the hydrodynamic calculations. The result is shown in Fig. 15.

CAD model of the vessel with fins for hydrodynamic calculations.
Background
According to Grant (1988) [1], “Historically, simulation techniques have been highly successful and used extensively for the planning and analysis of current operations and proposed designs”. Center of Maritime Technologies (CMT), Flensburger Schiffbau GmbH & Co. KG (FSG) and other partners founded the Simulation Cooperation in the Maritime Industries (SimCoMar) in order to continuously develop the simulation toolset STS (Simulation Toolkit for Shipbuilders) so that more shipyard activities can be simulated in the simulation environment. STS is the simulation toolset that is developed so as to be used in the Plant Simulation Environment. Plant Simulation is the discrete event simulation environment developed by Siemens. STS helps planners in the shipyards to analyse different process sequences and resource allocations and to analyse their impact on lead time before a planning decision is made. Simulation can also be used to control and reschedule the work in the event of unforeseen delays. In effect, the shipyards and ship owners’ risk of extra costs due to bad planning is reduced. In previous project and other commercial activities, CMT have utilised the Simulation Tools in order to perform analytical studies on different stages of the planning process. Some of the phases of the implementation of Simulation Tools in planning and the benefit that was achieved from the implementation have been provided in Table 1.
Application possibilities of Simulation Tool in planning process
Application possibilities of Simulation Tool in planning process
For the process of utilising the Simulation Tools in the planning of retrofitting activities, the necessary information required in order to simulated the retrofitting processes are to be collected and provided to the simulation environment. CMT have developed, during the German national research project GENESIM (Generisches Daten- und Modellmanagement für schiffbauliche Produktionssimulation) [2], and further developed in the EC funded research projects BESST (Breakthrough in European Ship and Shipbuilding Technologies) [3], RETROFIT (Retrofitting ships with new technologies for improved overall environmental footprint) [4] and GRIP, a generic relational database model for shipyards. As it could be seen from Fig. 16, based on the study of Acél [5], the most time consuming phase for modelling and implementing simulation in planning process is the data collection with the bandwidth between 12 and 50% and the median of 18%.
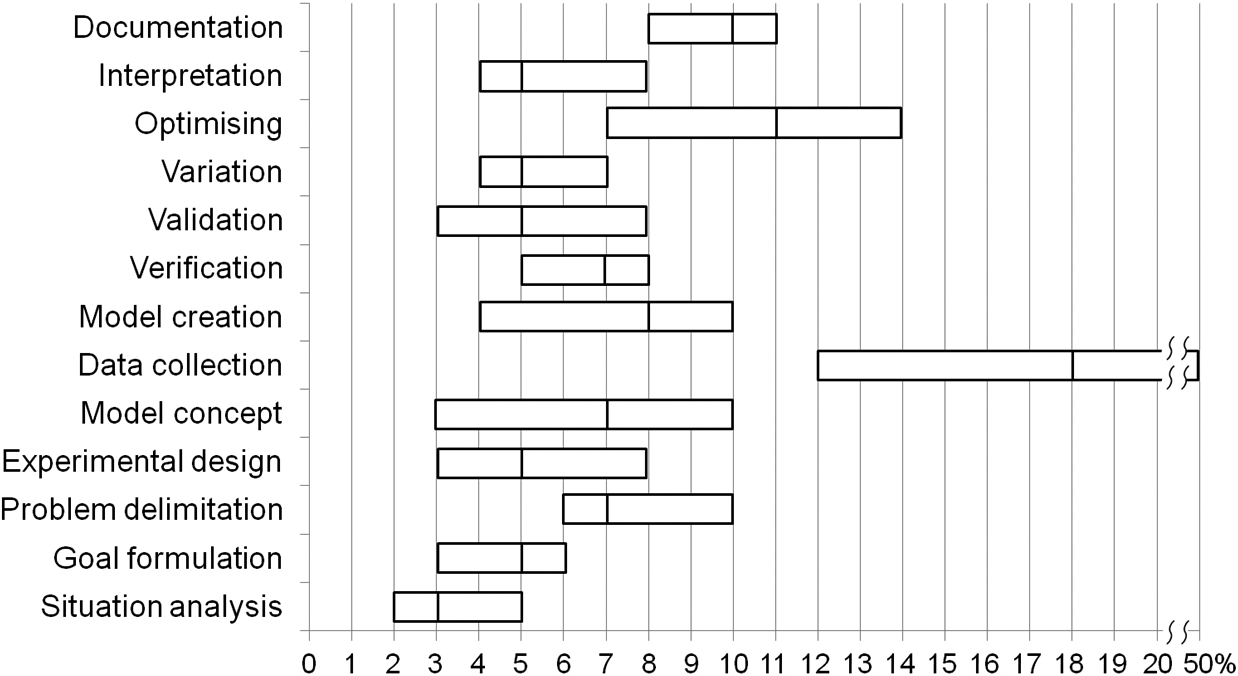
Effort distribution for simulation projects with an effort >20 man-days [1].
For simulation of the Retrofitting or any Shipyard activity using the Simulation Tools, a simulation model representing the shipyard resources is a pre-requisite. The modelling of Shipyard resources in the Plant Simulation environment requires considerable simulation knowledge as well as knowledge on the functionalities of the different Simulation Tools available in the STS Toolset. The probability for a shipyard to have a discrete event simulation expert already in their personnel books could be minimal. This was the case with the two shipyards in the GRIP consortium (Uljanik – Croatia and Fincantieri – Italy). Considering the versatility in operating styles, sizes and business strategies of different types of shipyards and the request of the shipyard partners in the project to provide a solution to be utilised with less simulation expertise, CMT’s two stage simulation concept would provide the shipyards with the possibility to decide the level of detailed result that they can obtain from the simulation studies. With this concept, the shipyard planner can select either of the two stages as their mode of operation for planning. Figure 17 shows the concept that was developed to satisfy this purpose.

Two stage simulation concept for planning and control with anteSIM and Plant Simulation.
The concept consists of Simulation of retrofitting/shipyard activities at two different stages. The differentiation between the two stages lies in the level of detail of the data input and output that can be obtained at the end of the simulation. In the first stage of the simulation study, the simulation will be executed in anteSIM, a software tool executed under a java platform. In the second stage of the simulation study, the simulation will be executed in combination of anteSIM and Tecnomatix Plant Simulation platforms.
The three main components that are involved in the execution of the two stages of the simulation concept are
anteSIM – Planning Tool,
Simulation Database,
Plant Simulation.
The interaction between the components mentioned above is depicted in Fig. 18. A brief introduction for each of the component is provided below.

Interaction between the main components of the simulation concept.
For the execution of either of the stages developed in the simulation concept, it was necessary to develop a tool interface to handle the data that is required for simulation. CMT developed the planning tool anteSIM (screenshot of the tool is shown in Fig. 19), which could handle the transfer of data between the shipyard user and Plant Simulation environment. AnteSIM is a software tool that initially was developed in the java platform in cooperation with SimoFIT. SimoFIT is a cooperation work in performing outfitting simulation studies in the maritime and civil industry. Its predecessor was a tool dedicated to planning and simulation in civil engineering, the so called SiteSimEditor from Ruhr Universität Bochum (RUB). Later on, developments in the platform have been performed by CMT in order to meet the needs of utilising the tool for shipbuilding industry. In the anteSIM tool, there are different perspectives which provide different functionalities.

Screenshot of the GUI in the developed anteSIM tool.
Some of the activities that can be performed in the perspectives of the anteSIM tool are
Definition of the elements constituting the product structure,
Definition of configuration details for a specific simulation study and scenarios are defined,
Definition of shipyard resources,
Definition of the list of processes that are to be executed on any element of the product,
Definition of the constraints between the processes.
During the development of the anteSIM platform, the scope and further functionalities that could be provided by anteSIM were further developed. Some of the objectives of anteSIM at the moment are to perform data collection, data preparation, data communication with simulation environment (if required), perform low level simulation studies (internally) and presentation of the simulation results obtained internally or externally. One of the many future objectives of anteSIM is to develop product structure by importing data from MS Excel or STEP format. In either of the stages opted for simulation from Fig. 17, the information required for the simulation study will be provided into the anteSIM format and this information will be saved into the Simulation Database.
The Simulation Database will be utilised to save all the information that would be required and provided in the anteSIM for performing simulation studies. The simulation database will be used as a platform to develop the libraries for Process patterns, resources, product structure, etc. Development and populating such information in the libraries of the simulation database would aid in fast accessing of the information required for simulation and thereby performing the simulation studies as fast as possible. It has always been considered that the data collection is a time consuming part of the whole simulation concept. If such libraries would be used to shorten the time for data collection, the benefits and utilisation of the simulation concept can be visualised manifold.
Utilisation of Simulation Database with process patterns library.
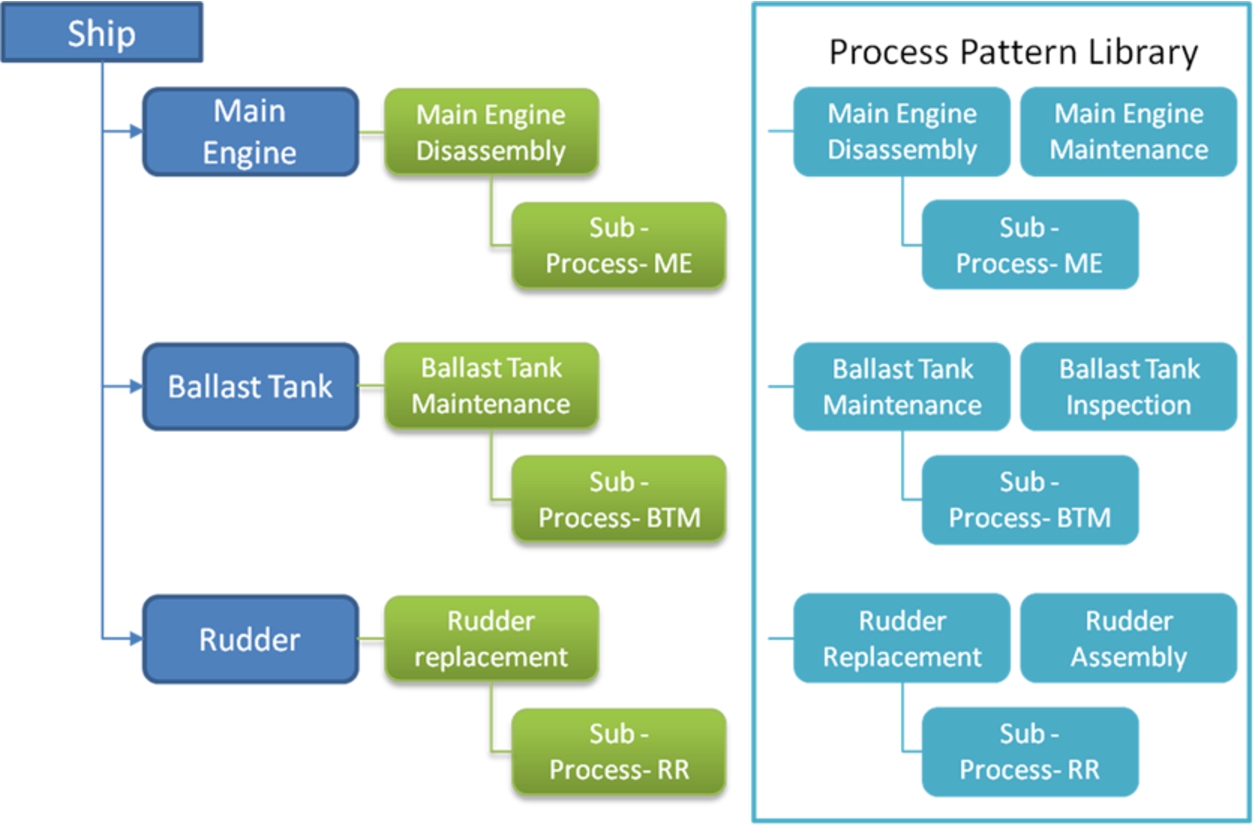
Figure 20 shows the methodology by which the one such library (process pattern) which could be used from the simulation database during the development of a study in anteSIM. The library shown in the figure is that for Process patterns. Process patterns is a pre-defined list of processes that are to be executed in a particular sequence for the completion of the activity. This library would be populated with already pre-defined process patterns for some activities that are frequently performed in the shipyard. While developing a plan for new order, the shipyard planner could just access the pre-defined process pattern templates from the library and add/edit the templates according to the new order. All the planning information (product structure, resource information, process patterns, simulation studies, etc) could be saved as their respectively libraries. Thereby, faster configuration of simulation studies could be possible for future projects.
Plant Simulation is a discrete event simulation software developed by Siemens – Tecnomatix. To incorporate the software in the shipbuilding industry, Center of Maritime Technologies (CMT), Flensburger Schiffbau GmbH & Co. KG (FSG) and other partners founded the Simulation Cooperation in the Maritime Industries (SimCoMar) which is dedicated to continuously developing the simulation toolset STS (Simulation Toolkit for Shipbuilders).
In the simulation concept explained in Fig. 17, the Plant Simulation software would be utilised only in the second stage of the simulation concept. It is to be noted that the level of accuracy and presentation that would be available from the utilisation of the Plant Simulation and anteSIM combination will be considerably high. With more accurate and precise results obtained from the second stage simulation concept, it could be assumed that the efficiency of the planning and execution operations in a shipyard can be considerably increased.
While performing simulation studies either only in anteSIM or in combination with Plant Simulation, for a precise analysis on the situation of the processes in a shipyard, simulation studies should be performed with multiple projects and multiple orders executed at the same time in a shipyard. The results obtained in a simulation run wherein only the particular retrofitting order is being simulated, will not provide the exact situation that would prevail in the shipyard. It will deceive the planners from depicting the actual situations in a shipyard. Only by simulating all orders on stock along with the currently being planned process (retrofitting order), a correct understanding on the availability of resources and flow of process constraints can be visualised.
Validation results of simulation technology implemented
The Simulation Methodology explained in the chapter above have been tested and validated during the assembly of the Pre-Swirl Stator Fin Assembly, at the VIKTOR LENAC shipyard at Rijeka – Croatia, under the supervision of the Uljanik Shipyard personnel.
In order to perform the validation of the Stator Fin Assembly, only the assembly process of the Stator fin assembly was considered for validation using simulation. The logistics involved in the retrofitting process in the shipyard is not considered in the simulation scenario studies, as its significance would be small and also logistics planning of Uljanik is being done on rough estimation. The flow of activities, resources required, constraints in execution of activities, positional information and other required details were provided to CMT. The list of processes that are to be executed during the retrofitting process of a Pre-Swirl Stator fin was defined and utilised in the simulation (see Table 2). With the initial set of information, the Simulation Model required for the validation of the assembly process was modelled and tested. Figure 21 shows the flow of activities performed in the anteSIM and Plant Simulation platform so as to perform simulation studies for the Pre-Swirl Stator Fin Assembly.
List of processes considered during the simulation of the retrofitting process
List of processes considered during the simulation of the retrofitting process
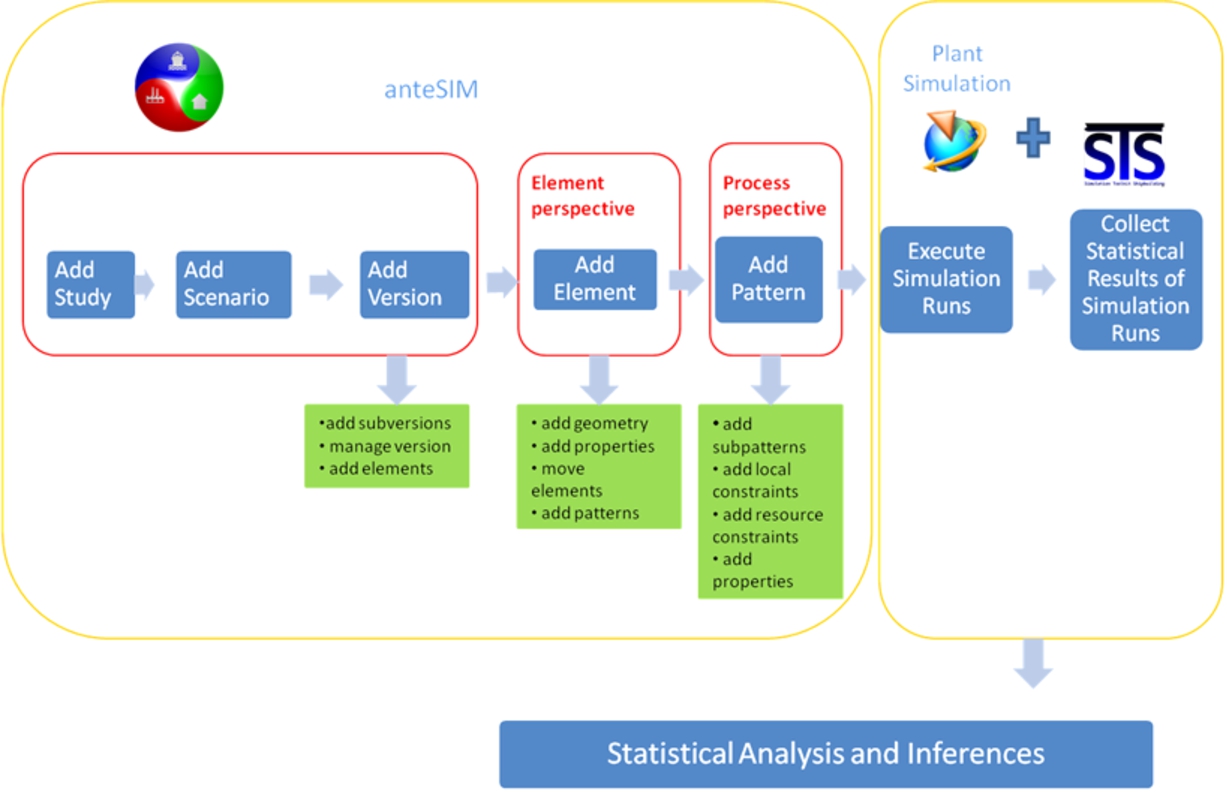
Activity flow during validation of simulation concept during stator fin assembly.
The information collected via the anteSIM tool are saved in the Simulation Database, which are then exported to the different tables of the Plant Simulation platform via table specific “view” codes. The “view” code aids in transferring the information from the Simulation Database to the tables in plant simulation by coding the information requirement for each column of the table. By performing the validation task of the Stator Fin Assembly, the developed planning tool and developed simulation model were tested and were able to be validated them during the process.
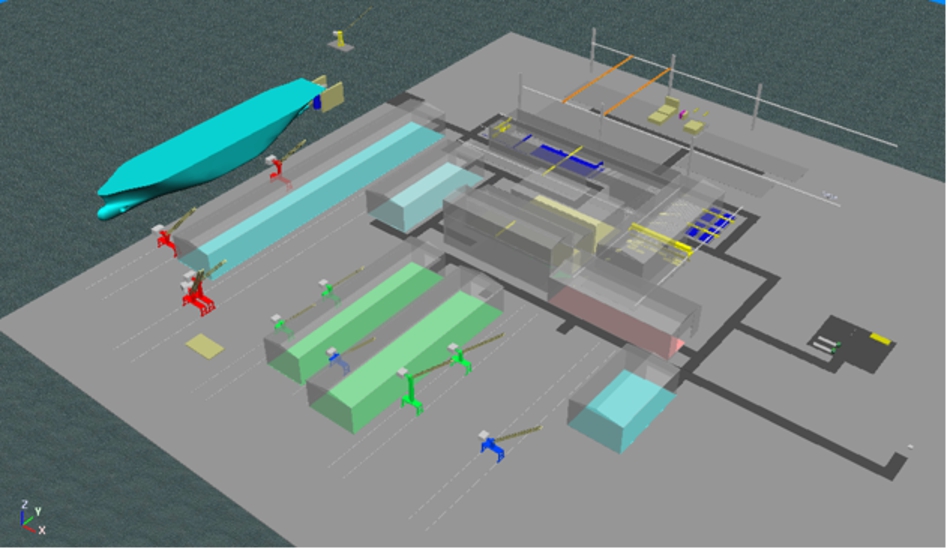
The simulation model wherein the Simulation Studies were performed, has been modelled specifically to the definitions of the Uljanik Shipyard, who is a partner in the GRIP consortium. Figure 22 shows the overview of the Simulation model developed. During the modelling of the Simulation Model, the resource specification and shipyard personnel availability were collected and correspondingly defined in the simulation model.
3D representation of ULJ shipyard simulation model.
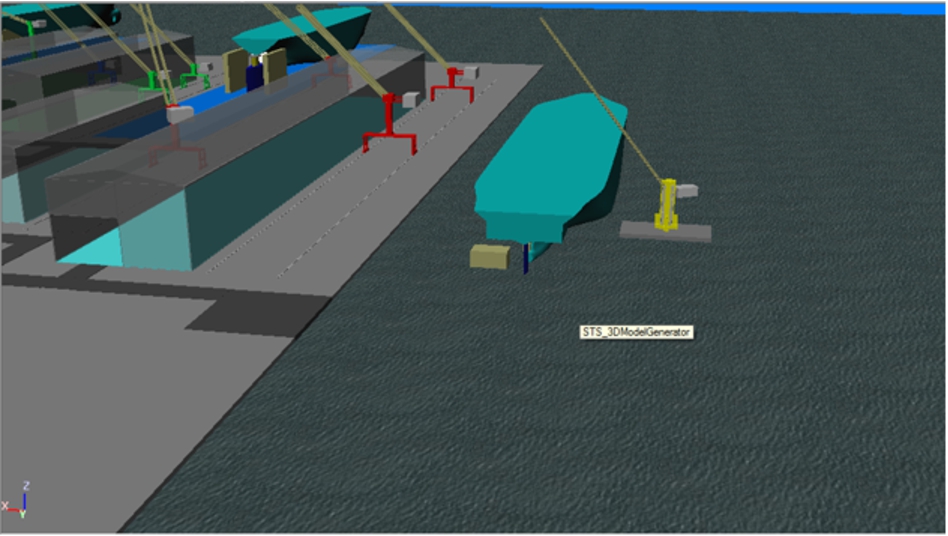
The simulation tool “Experiment Manager” was used in order to perform continuously the Simulation studies. During each simulation run, the Experiment Manager would change the process parameters of the simulation run and then execute the simulation of the Fin Assembly based on the newly defined process parameters. For each Simulation Run, the statistical information about the starting and ending of a particular process, the resource utilisation of the each personnel and status of each personnel were collected. Based on these collected information inferences were analysed, Fig. 23 shows the execution of the Fin Assembly in one of the docks at the Shipyard during one of the Simulation Runs.
Screenshot of the fin assembly process executed in simulation model.
The STS_Statistics tool in the simulation model logs all the important statistical information required to perform study analysis on the different scenarios during a retrofitting process. The STS_Statistics tool uses the data registered in the tables to develop a Gantt chart history of the particular element. By defining a particular order to be the element of observation, the Lead Time of an order can be obtained from the Gantt chart.
From the logs of the Statistical tool in the Simulation tools, the state of a particular element at any period of time in the simulation can be identified. The definition of a state of an element depends on the type of element under observation. During the observation of resources such as Personnel, Vehicles, Cranes and so on, the significant states that could be defined are paused, working, blocked, waiting, failed, loading and reserved. The STS_Statistics tool notes down the duration of time the element is under any particular state. Based on this time log, a Utilisation chart for the element can be generated in the simulation model. It is possible to group some of the states together in order to provide a more generic overview of the utilisation chart.
Summary of the optimal results from the best simulation runs conducted in GRIP
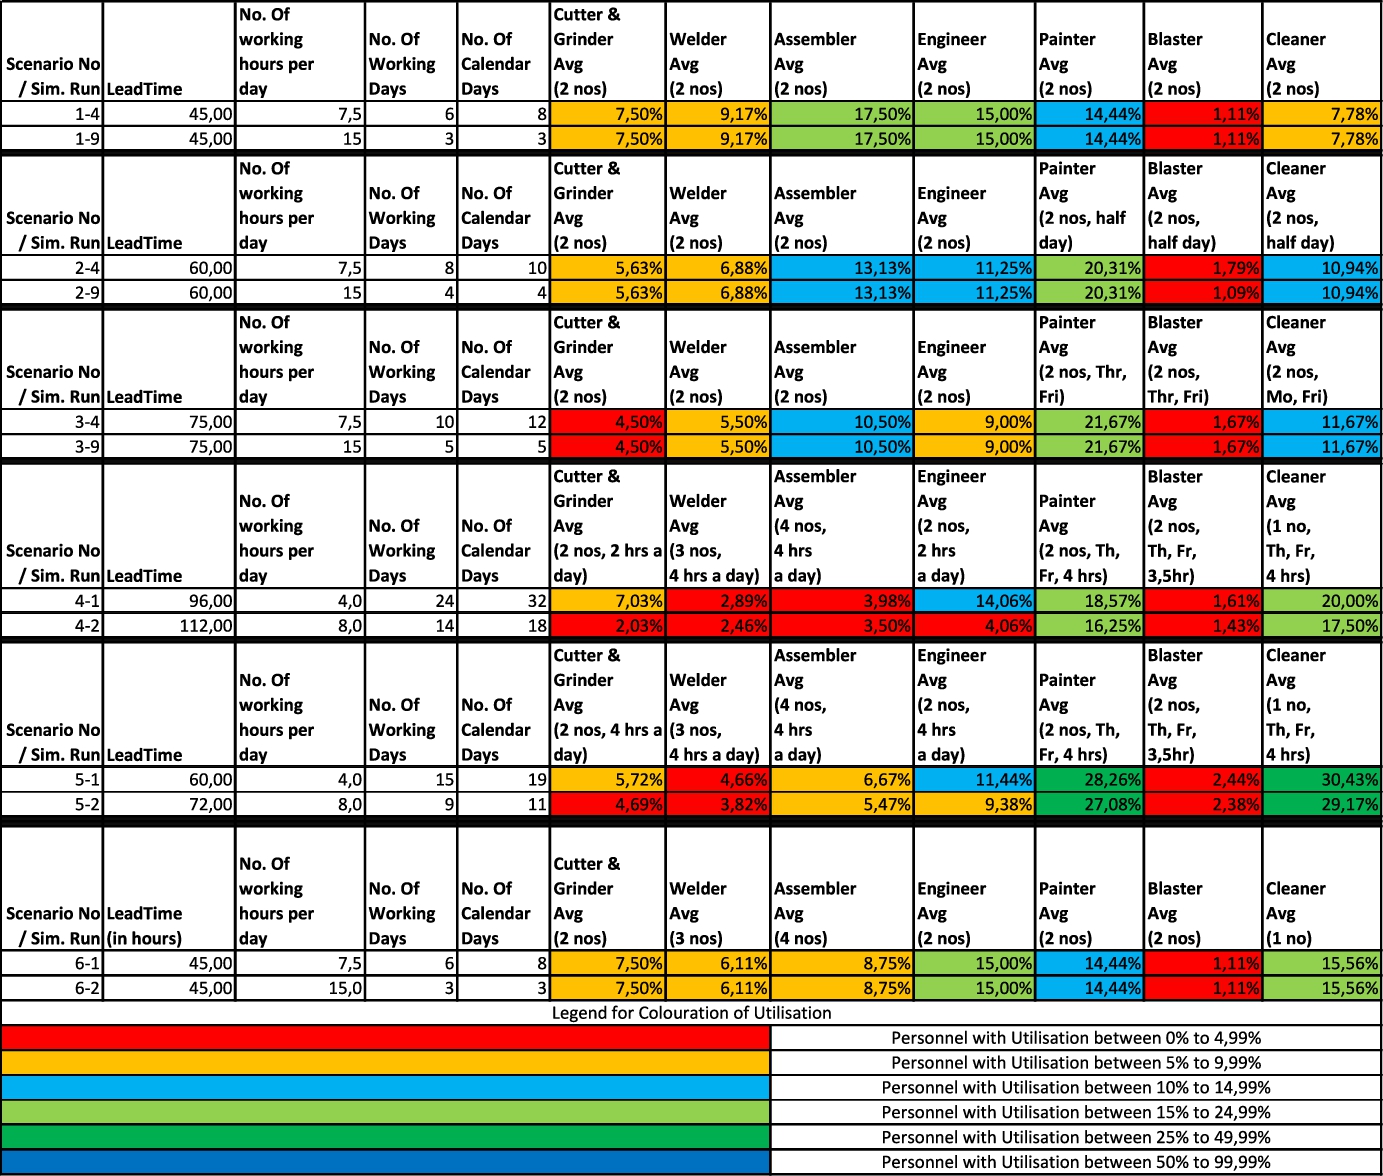
Summary of the optimal results from the best simulation runs conducted in GRIP
Comparison on the required shipyard personnel between Scenario 1 and Scenario 6
In the GRIP project a total of 36 simulation runs for 6 different scenarios were performed. Table 3 shows the summary of the 12 best simulation runs of the conducted simulation study. It could be noted that the utilisation rate of the different shipyard personnel were different in the different scenarios. The lead time and the number of working days and calendar days for the completion of the retrofitting activity were also different for the scenarios. These differences in the study parameters are due to the different configurations that were defined in the simulation scenarios. Based on the number of calendar days that it would take to complete the Stator Fin Assembly process the results of simulations runs were further filtered. These filtered simulation run amounts to 12 simulation runs out of the 30 simulation runs that were performed. These 12 simulation runs were performed under different configurations of shipyard personnel availability and shipyard working time (number of shifts and days of operation in a week). Based on the lead time for completion of Scenarios 1 and 6 being the least and the definition of the number of personnel available and the number of shifts in these scenarios, being close to the representation of the shipyard, the results of simulation runs in Scenario 1 and Scenario 6 were taken for further analysis. As shown in Table 4, the retrofitting process can be completed with less number of Welders (one) and Assemblers (two), but would require one additional cleaner. Even with this reduced total number of required personnel, the retrofitting process can be completed in the same number of calendar days (eight days with single shift, three days with two shifts). It could then be concluded that the configurations of the scenario 1 is beneficial for the shipyard, as it can be assumed that the personnel cost of 1 welder and 2 assemblers would be higher than the cost for 1 cleaner. The lead time estimated from the simulation studies in principle is corresponds to the actual lead time at the shipyard (eight-ten days). It is to noted that during the actual retrofitting of the pre-swirl at the shipyard, the lead time of the process was affected by varying factors such as, unforeseen technical troubleshooting in assembly parameters directly done at the dock, switching between one and two shift operation depending on the resource available and also the execution of other maintenance operations in the ship requested by the ship owner. If such unforeseen situations are defined with an accepted factors as simulation input, then the simulation results will represent very closely to the actual execution process in the shipyard.
Additionally, it is to be noted, that the statistical data which were obtained from the simulation studies were as a result of simulating only the stator fin assembly in the shipyard. In order to analyse the benefits of the simulation, it is imperative to have multiple orders to be simulated at the same type, in order to have a realistic complete overview on the use of resources in a shipyard. Based on the operational strategy, order book and planned utilisation of the shipyard, the results obtained from such simulation study aids in performing a better planning of the shipyard resources for a particular retrofitting activity, even during the order negotiation phase of a retrofitting order.
Production planning on retrofitting shipyards can benefit from the anteSIM tool, as it provides methods for efficient generating and editing of data needed for production planning. By feeding such data into simulation tools such as STS, doing simulation studies becomes possible. Thus, various planning scenarios can be compared virtually, allowing for the completion of numerous analyses, like lead time, utilisation of resources, and robustness of plans. Simulation results can be analysed by means of the anteSIM tool, but alternatively, use can also be made of dedicated statistical software tools which support Design of Experiments and parameter optimisation. These can support shipyard planners when sophisticated planning scenarios need to be handled.
Using a Laser scanning system to collect geometric data from complex or large structures is a fast and easy method. In this case, the system was ideally suited to capture the geometry of the aft ship as well as of the several fins and the rudder. The Laser scanner could be applied in a flexible way since a direct marking of the measured points is not necessary as well as the operator does not have to stand next to the instrument during the measurement. However, the instrument has to be absolute stationary for the time of scanning. Thus, the conditions should be constant during the whole scanning process. Connections of the scanning system with other technologies are also possible by using tie points as seen in this case with Tachymeter. Photo modelling and Laser scanning can also be used together. The separate measurements can be connected with spherical targets. The evaluation of Laser scanning data can be enormous, but this is dependent upon the aim of the evaluation: is only a point cloud needed or a complete CAD model? All in all a large knowledge and learned skills are needed by the operator during the handling of this kind of data. Furthermore, the right software and hardware is needed to use the large amount of data. A benefit of Laser scanning data is the fact that all objects, which were scanned secondarily, can also be evaluated later if required.
The planning and the simulation tool developed require the product data under consideration, in order to start the planning process for the particular order. As the data collection for the simulation tool is collected, edited, and structured in the anteSIM platform, a methodology to import the product structure in the anteSIM platform is necessary. At present, the idea under development in the anteSIM platform is to import STEP (International Standard for Product Data Exchange) files of the products in order to recognise the elements involved in the order. As explained before STEP expands to International Standard for Product Data Exchange and it is a widely used CAD format to exchange product manufacturing information. The reverse engineering CAD model generated by IMAWIS, till date have only the geometrical information of the product, i.e. the dimensional data of the product. The CAD model generated from the point cloud of the reverse engineering technology does not contain any product structure data. Therefore, a suitable reverse engineering process which could develop the product structure and thereby be capable to generate a CAD model in STEP format should be investigated.