
Abstract
After a long period in which the most attractive characteristic of a motor yacht was represented by her maximum speed, nowadays the target has moved towards comfort on board which became the fundamental parameter to deal with in the yacht design process.
Noise and vibration, together with seakeeping behaviour, became the fundamental subjects on which the research effort of shipyards and technical offices turned on. Since many years the Department of Electrical, Electronic, Telecommunication Engineering and Naval Architecture (DITEN) is involved in a research on the dynamic behaviour prediction of large motor yachts in cooperation with one of the most important Italian shipyards. In this perspective the assessment of the dynamic properties of materials used for the vessel construction, such as the damping coefficient, is an important step to perform preliminary analyses for vibration and noise levels.
This paper is focused on the definition of the damping coefficient of laminated glass, which is a complex material commonly used for windows in the current yacht market. As a matter of fact the actual trend of using larger and larger windows for owner’s cabins and saloons could represent a critical point in terms of noise and vibrations and makes the laminated glass dynamic characterization a fundamental issue to be investigated.
Different experimental modal methods to obtain the damping coefficient at natural frequencies are applied to laminated glass specimens, while the Reverberation Time test is proposed to assess the coefficient in the whole frequency range of interest. In the final part of the paper, a comparison between the results of different methods is presented.
Nomenclature
Damping Loss Factor Finite Element Method Statistical Energy Analysis Polyvinyl butyral Reverberation Time Sentryglass® Ethyl vinyl acetate Single Degree of Freedom Damping ratio Frequency Response Function Damping loss factor Half Power Bandwidth Method 3 dB bandwidth [Hz] Resonance frequency [Hz] Logarithmic Decrement Method mth peak in the response time signal nth peak in the response time signal Logarithmic decrement Circle Fit Method Phase of the frequency response function respectively former and subsequent the natural frequency 60 db Reverberation Time Method Early Decay Time Time for a 60 db decay
Introduction
Nowadays the strongest effort of shipyard technical offices is focused on the improvement of the quality of their products; comfort, in particular, is one of the main task in yacht design [3]. Especially for large yachts with a length over 30 meters, the objective is to lower noise and vibration levels in order to satisfy human’s necessity and to avoid difference between yacht and house day life.
Therefore, it is extremely important to perform predictive analyses in order to get information about the dynamic response of the structure and to compare different possible solutions. This can be done by a FEM analysis of the whole yacht, which allows investigating the modal properties of the structure. From the noise point of view, a Statistical Energy Analysis (SEA) is the most suitable approach to assess how the structure borne noise and the airborne noise propagate on board [2].
In both cases, it is essential to properly assign the specific dynamic properties of materials and structural solutions, such as the damping coefficient. In the framework of study, the use of new materials and complex structures, like viscoelastic layers, introduces some uncertainties in the calculation procedure [17].
This paper is focused on the investigation of the damping properties of laminated glass. It is composed by two or more glass plies bounded together with viscoelastic interlayers (for example polyvinyl butyral PVB). Windows made of laminated glass are particularly appreciated on board, thanks to their sound insulation properties; they are usually clamped and glued on the surrounding metal structure. Unfortunately, the current trend in pleasure yacht of using very large glass windows, especially for saloon and owner and vip’s cabins (Fig. 1), could lead to the occurrence of serious noise and vibration problems. In fact, their installing technique allows the vibrations to be transmitted from the aluminium frame to the glass, where secondary acoustical measures, normally applied for interior components, are not usable, as remarked by [21]. It is then fundamental to investigate the dynamic properties of this material in order to perform reliable predictive analyses of noise and vibration.
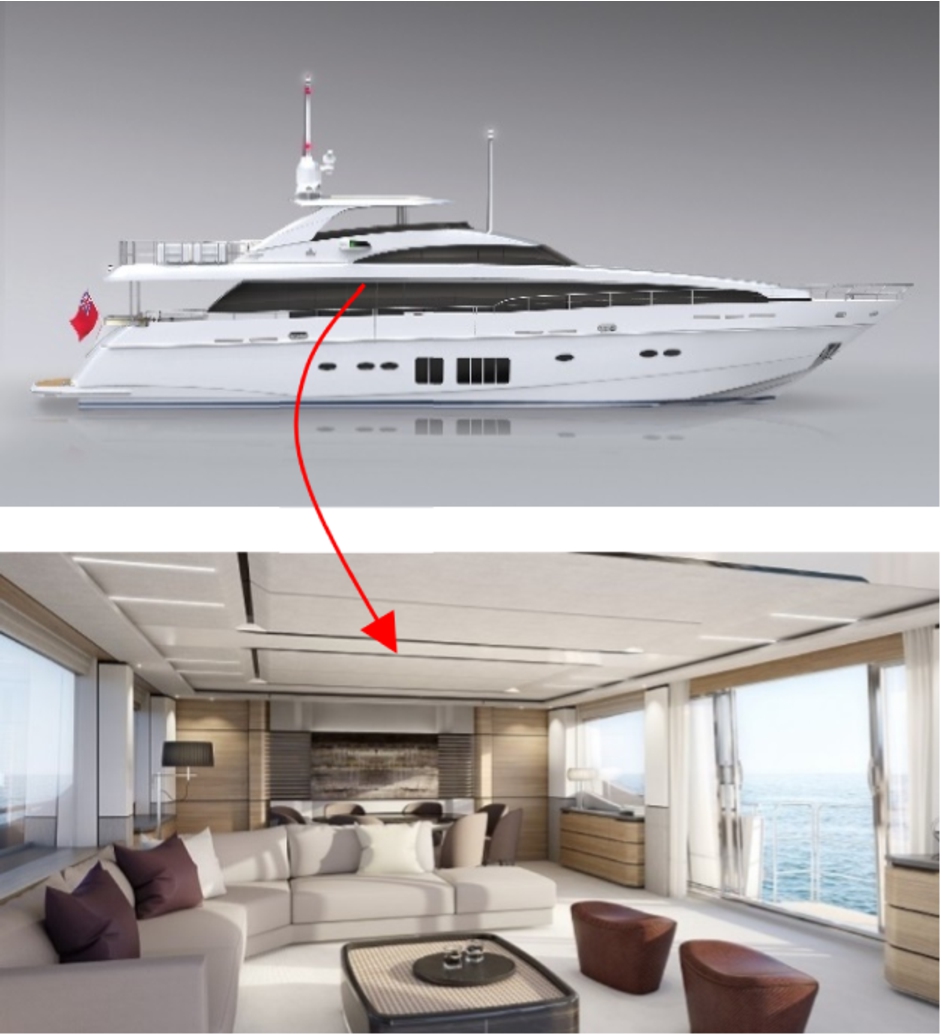
A representative example of very large glass doors and windows on a superyacht (by courtesy of Princess Yachts).
Tests were carried out on three plate samples of laminated glass. Three different experimental modal methods were applied in order to obtain the damping coefficient at natural frequencies, while the Reverberation Time test was performed to assess the coefficient in the whole frequency range of interest. In the final part of the paper, a comparison between the results of different methods shows a good agreement between obtained values.
A study case for the acoustic and vibration problem related to large glass windows has been identified in a 50 m long superyacht on which an extensive measurement campaign of noise and vibrations has been carried out (data kindly provided by RINA Service). This measurement was performed in order to assess noise and vibration levels in the owner’s cabin during a 16 kn sailing [16]. The window under consideration is a flat laminated glass window whose dimensions
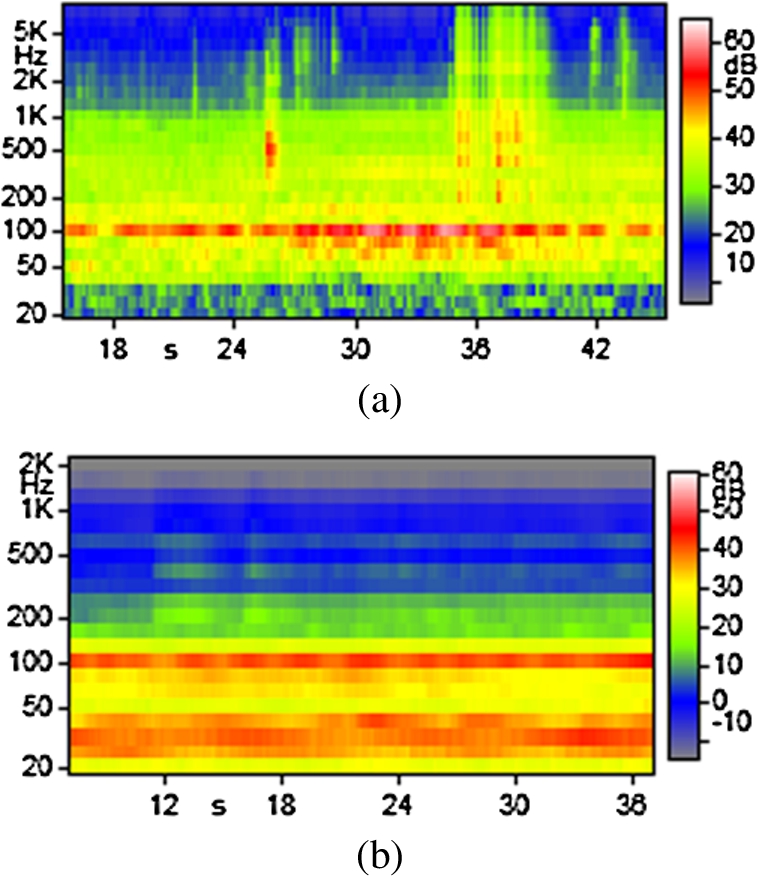
(a) Microphone’s sonogram and (b) accelerometer’s sonogram obtained by noise and vibration measurement on-board.
This example clearly shows that, even if the cabin under consideration is quite far from the exciting source, the airborne noise and the structural borne noise radiated by windows could critically contribute to the acoustic condition of the environment if the glass surfaces resonate with the on-board excitations. Moreover, the common practice of gluing glazing structure to superstructures amplify this phenomenon.
The determination of the damping properties of laminated glass is mandatory, especially when numerical analysis on noise and vibration are required. The more and more restrictive rules on noise levels on-board super and megayacht require deeper studies on the propagation of structural borne and air borne noise through numerical simulation, e.g. Statistical Energy Analysis.
In order to perform this kind of simulation, a complete knowledge on the dynamic response of materials have to be carried out.
As defined by [6], laminated glass is an assembly consisting of one sheet of glass with one or more glass ply joined together with one or more interlayers. The adhesive contact between the glass and the interlayer is made by high pressure and heat in an autoclave.
Laminated glass is used to increase the sound insulation rating of a window, where it significantly improves sound attenuation compared to monolithic glass panels of the same thickness. Moreover, laminated glass is considered a safety glass because when it shatters, its plastic interlayer keeps the pieces of glass in place. Interlayer materials also have to transfer shear stresses among glass plies [11]. The capability of interlayers to transfer shear stresses directly results into higher momentum of inertia of the panel, that can be estimate by using the enhanced effective thickness method [11].
The glass plates constituting laminated glass could be made of annealed glass, heat strengthened glass, tempered or heat toughened glass. From the mechanical point of view, glass is a homogeneous and isotropic material whose behaviour is linear-elastic until fracture occurs, for both tension and/or compression [11].
The interlayer is typically a soft polymer like polyvinyl butyral (PVB), ethyl vinyl acetate (EVA) and SentryGlass (SGP). The constitutive response of these materials isn’t linear and it is strongly affected by many factors like the operating temperature and the load duration as explained by [10].
PVB, the most common interlayer material for laminated glass, is a polymer that exhibits viscous behaviour as well as elasticity, i.e. hysteresis is present in the stress-strain curve, stress relaxation occurs (constant strain causes decreasing stress) and creep occurs (constant stress causes increasing strain).
Damping and damping measuring methods
Introduction to damping
A structure subject to oscillatory deformation contains a combination of kinetic and potential energy. In the case of real structures, there is also an energy dissipative component, given that a part of the energy is lost per cycle of motion. The amount of dissipated energy is a measure of the structure’s inherent damping. In simple terms, damping is the conversion of mechanical energy of a vibrating structure into thermal energy, which is then lost to the structure’s environment [7,8].
There are many forms of damping: Coulomb friction, fluid viscosity, air damping, particle damping, joint damping, magnetic hysteresis and piezoelectric damping, just to name a few. The most common form of damping employed to solve noise and vibration related problems is passive-based material (or viscoelastic) damping [15].
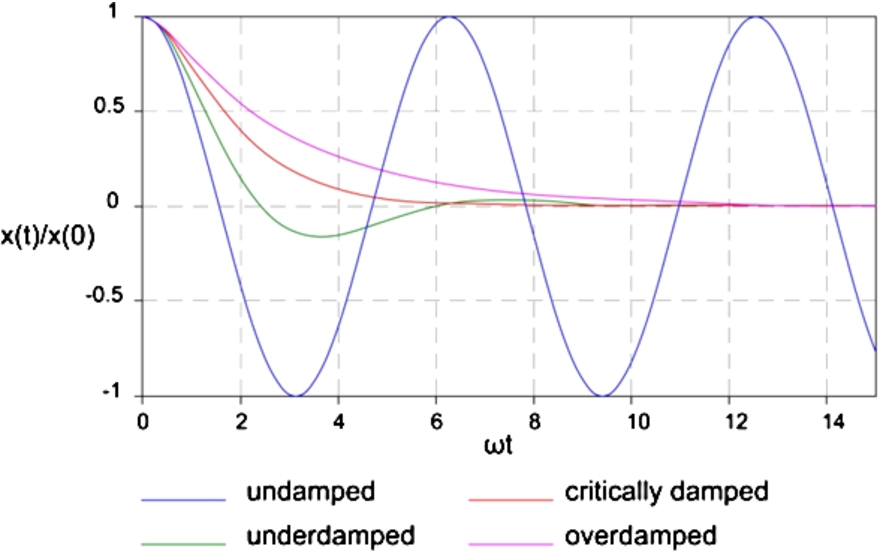
Response of a system with different damping properties.
The damping of a system can be described as being one of the following (Fig. 3) [1]:
overdamped: the system returns exponentially to equilibrium without oscillating;
critically damped: the system returns to equilibrium as quickly as possible without oscillating;
underdamped: the system oscillates (at reduced frequency compared to the undamped case) with the amplitude gradually decreasing to zero;
undamped: the system oscillates at its natural resonant frequency (
The simplified single degree of freedom (SDOF) model of a mass-spring-dashpot system can represent many real damped structures. In this analytical system, damping is represented by using a viscous model in which the damping element (a dashpot) is proportional to velocity. The classic complimentary solution to the transient, free vibration response of the SDOF yields the analytical representation of viscous damping as the damping ratio ζ, shown in the following equation [8]:
Then a system can be classified as:
underdamped if
critically damped if
overdamped if
There are also other coefficients to represent the damping of a system. According to many authors [5,8,15], the loss factor η is the most suitable index. It was originally introduced as a measure of intrinsic damping of viscoelastic materials calculated as the ratio between the imaginary and real parts of the complex modulus of elasticity. It can be successfully applied in case of nonlinear systems.
Several techniques are used to quantify the level of damping in a structure. For modal damping, the most popular methods are the Half Power Bandwidth Method, the Circle Fit Method and the Logarithmic Decrement Method [9].

Half Power Bandwidth Method.
Using the Half-Power Bandwidth Method, the loss factor η can be obtained from the amplitude plot of a FRF as explained by [5]. It can be demonstrated [5] that η is proportional to the distance in frequency between the two points (“a” after and “b” before the maximum) of the FRF featuring a value corresponding to the peak multiplied by
The method is very simple, but it relies very much on the accurate description of the peak (in the vertical as well as in the horizontal coordinate). Small errors can affect significantly the evaluation. A fine resolution in frequency is needed to describe correctly the shape of the peak, to define accordingly the accurate half power value and finally to identify the bandwidth.
The method is not suited for very sharp peaks, corresponding to small damping, where difficulties arise in the definition of the exact value for the peak, and for very flat ones (large damping), for which the half power level may not be reached.
Looking at the Logarithmic Decrement Method, in the time domain η is obtained for each peak frequency, analysing the logarithmic time decay of vibrations [8]. This method is based on the analysis of a time signal filtered by a pass-band filter centred on a given resonance frequency (SDOF method). The resonance frequency can be obtained by a preliminary test. The logarithmic decrement is defined as:
This method is particularly suited for measuring small damping values, while it has limitations in the cases of high damping values, which implies a rapid decay in time of the amplitude of the oscillation cycles and prevent the evaluation of the coefficient.
The Circle Fit Method uses the FRF representation called Nyquist plot (imaginary vs. real components) where each point is associated to a frequency, as explained by [14] In this representation frequencies around resonances yield very well identified points, describing a circle. It can be shown that the inverse of the so called sweep rate parameter (which represents the rate at which the point representing the FRF moves along the circle for increasing frequency) is maximum at resonance, where it provides an estimate for the damping:
This equation can be applied to all couples of points (one below, the other above the resonance frequency). A remarkable feature of the Circle Fit Method is that it provides an exact value of damping without approximations and it can be applied in a wide range of damping values.
These methods can only predict the values of damping at the natural frequencies. Therefore, to obtain the damping loss factor plotted against frequency, one should adopt the RT60 Method [4].
This technique is commonly used in acoustic rooms to evaluate the Reverberation Time (RT) of rooms, but it could be also applied in solid materials. The reverberation time is a quantity that describes the rate of decay of the sound level, and it is inversely proportional to the amount of sound absorption. The loss factor, which is a measure of the proportion of vibrational energy that is dissipated during one cycle of vibration, is inversely proportional to RT. The reverberation time may be assessed relatively easily and rapidly from the impulse response of the test specimen. Once the RT60 is obtained for each one-third octave band, the damping loss factor η can be calculated by using equation (5), as remarked by [18].
Consequently, there are many different parameters commonly used to express damping. Cross-reference [8] formulas are given in Table 1.
Cross formulas for damping coefficients
Test set-up
Tests were performed on three samples of laminated glass plates, composed by two glass plies and an interlayer, that have the same planar dimensions (
Sample 1:
Sample 2:
Sample 3:
The excitation device used in tests is an instrumented impulse hammer (PCB Impact Hammer model 086D0) with a medium tip and a weight of 0.32 kg [12]. For what the transduction system is concerned, piezoelectric accelerometers were used (PCB accelerometers model 353B03); they are uniaxial accelerometers mounted on the centre of samples by using a thin layer of bees-wax. The analyser is a four-channel SOUNDBOOK™ system and the acquisitions have been run by the software Sinus SAMURAI™ [19].
After the equipment selection, the next step in vibration testing is to prepare the required boundary conditions for the structure. Tests are performed in free boundary condition, i.e. minimizing the interaction with the surrounding environment, in order to exclude external interferences as much as possible. In this sense, samples have been tested supported on vertexes by very soft cushions made by polyurethane rubber supports (Fig. 5). The area of supports has been minimized in order to obtain a frequency response function (FRF) not affected by shear leg effect.
The hammer hits were given in the centre of samples for the modal analysis, in order to excite the 3rd and the 8th mode of the free plates, and in 7 different points so as to excite the maximum possible number of normal modes, as it can be seen in Fig. 5.
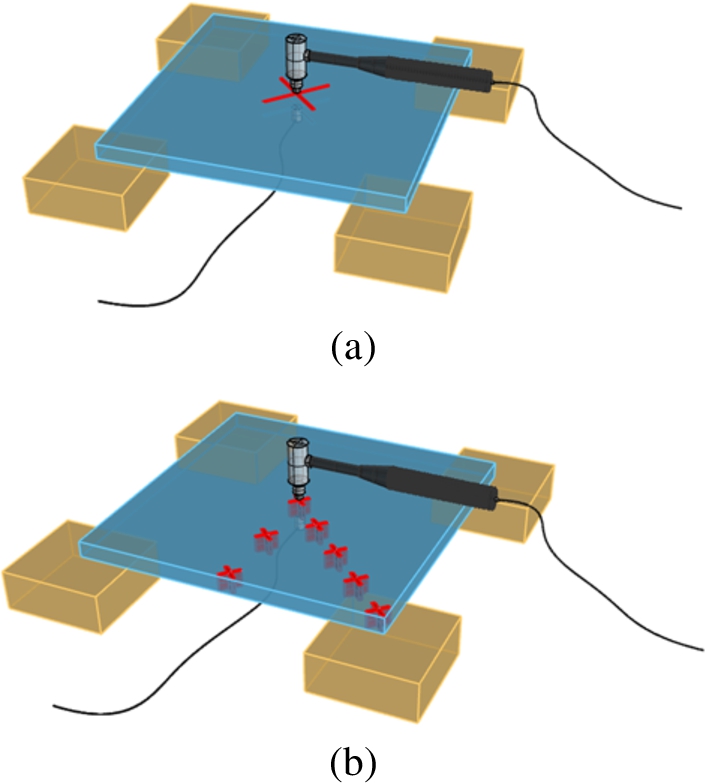
Configuration of modal tests (a) and reverberation time tests (b).
The first method utilized to investigate the damping properties is the Half Power Bandwidth Method. In order to apply it the graph of the Frequency Response Function (FRF) has been analysed.
The resonant frequencies have been estimated from the frequency response data by observing the frequency at which the magnitude of the FRF has a maximum, as it can be found in [20]. The unit of measure for the amplitude has been set in dB to facilitate the identification of the half power points. In general the application of this method has been quite simple because the peaks under consideration were really well defined by the FRF function, thanks to an accurate choice of the frequency range of the analysis and the number of spectral lines. This accuracy was reached after a series of preliminary tests. Figure 6 shows, as an example, the analysed graph for Sample 1. The full result set is summarized in Table 2.

Application of the Half Power Bandwidth method to Sample 1.
Results obtained with halfpower bandwidth method for Samples 1, 2 and 3
The second studied method is the Logarithmic Decrement Method [7]. In order to apply this method it is necessary to depict the history plot of the vibration amplitude of the sample picked up by the accelerometer.
The signal has been sampled into the time range of interest, i.e. into the hundreds of seconds immediately following the hammer hit, when vibrations are really easy to see. This method can be used for the evaluation of the loss factor only for the first natural mode. In order to avoid errors due to overlapping of different natural modes, the first mode natural period has been evaluated and only peaks with a distance in time which is exactly multiple of the natural period have been taken into consideration.
Unfortunately, the number of lines chosen for the data capture of Sample 2 was not able to pick up better the vibration peaks, so the result for this sample isn’t completely reliable. The resampling of the time signal for Sample 3 is shown in Fig. 7 while Table 3 summarizes the obtained results.

Resampling of the time signal of the accelerometer (Sample 3).
The third method under investigation is the Circle Fit Method [13]. The Nyquist plot was used to compute the damping loss factor for the three samples. In these plots two circles can be well visualized; the external circle refers to the first natural frequency while the internal one refers to the second natural frequency, as it can be seen in Fig. 8. Results are summarized in Table 4.
Application of logarithmic decrement method for the calculation of the damping loss factor for the first natural mode (Samples 1, 2 and 3)
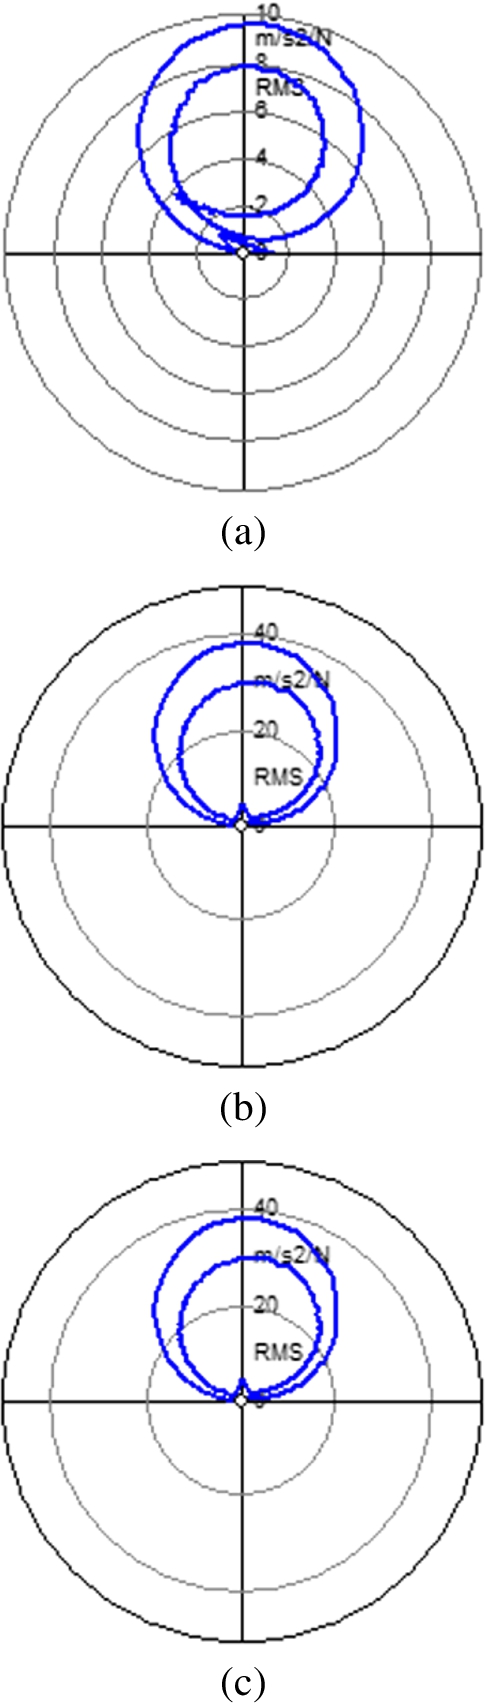
Nyquist plot obtained for (a) Sample 1, (b) Sample 2 and (c) Sample 3.
The last applied method is the RT60 Method. The structural damping loss factor in one-third octave bands from 50 to 10000 Hz has been evaluated for each sample using the Time Decay procedure based on reverberation time (RT60) measurements.
In order to ensure the correct evaluation of the time decay, measurements on shorter time signals have been performed. The decay has been considered linear and the time has been evaluated by a reverse integration method.
The time decay indicator chosen for evaluating the RT60 is the Reverberation Time 30 (RT30) that measures the time during the 30 dB of decay, from
Table 5 offers a comparison between loss factor values obtained by modal analysis and by reverberation time analysis.
As it can be observed the values of the loss factor obtained by different methods are really similar and the modal analysis gives, for the resonance frequencies, the same result as the reverberation time analysis. Of course, when possible, it is better to perform a reverberation time analysis than a modal analysis, in order to get the trend of the loss factor for the frequency range of interest [4]. These data could then be entered in the model of the laminated window to take into account the damping properties of the structure.
Application of the circle fit method for the calculation of the damping loss factor for Samples 1, 2 and 3
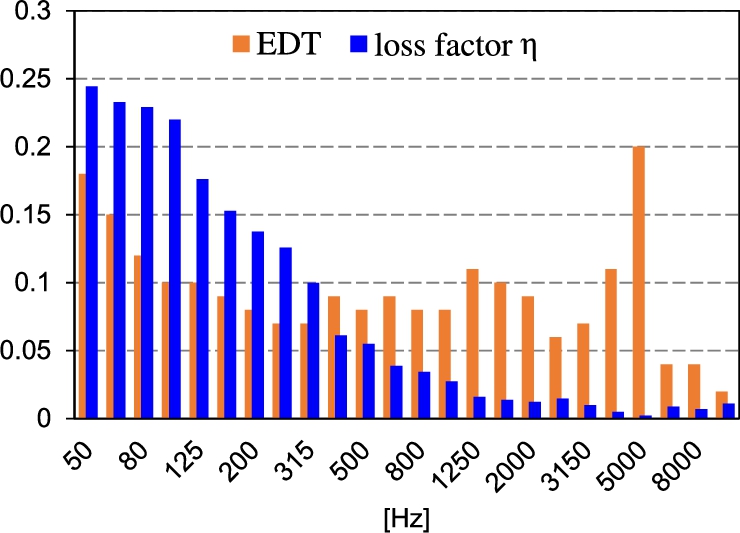
RT60 and loss factor values for Sample 2.
Damping loss factor η calculation with different methods for the first natural mode
Laminated glass is nowadays a common composite material in the construction of yacht windows thanks to its sound insulation properties. However, it has a very complex behaviour due to its composition and to the interaction between glass and PVB [11]. Looking at the actual design trend of using large glass surfaces to make cabins and saloons more attractive for guests, it is important to know their dynamic properties, such as the damping coefficient, in order to perform reliable predictive analysis for noise and vibration.
As a matter of fact, SEA based software requires, for each material, the dynamic behaviour in terms of damping coefficient for any third-octave band.
This paper presents several methods to evaluate, by the use of experimental techniques, the damping coefficient of laminated glass samples. To define the loss factor, tests on small specimens are particularly useful and the results can be quickly obtained with a good level of accuracy. Experimental modal analysis leads to the calculation of the loss factor at the natural frequencies while the reverberation time test extends the results in the whole frequency range of interest.
The non-linear behaviour of laminated glass in terms of shear stress transfer mechanism, as highlighted in [11] and remarked during experimental tests is one of the most influencing parameter dealing with damping loss factor.
It must also be noted the mounting technique (e.g. gluing, metallic or composite frames) modify the dynamic properties of glazed structures, but for the final aim of this work, i.e. the use of experimental data for numerical simulation of structural and air borne noise, the role of mounting system can be considered only by hybrid SEA–FEM approach and so the calculation of the damping loss factor is made directly during Finite Element procedure.
The results of these analyses highlight the congruence among the four different calculation techniques herein proposed and studied.
By the way, the RT method, commonly used for reverberant and semi-reverberant rooms, is not dependent on the input function, so a measured force input hammer is not required. Moreover, this method, alike the logarithmic decrement, allows the calculation of the entire spectrum of the damping loss factor, but is also suitable for high damping level, representing a quick time decay. So it is sufficient to be sure to excite the higher number of natural modes of the structure to ensure reliable results.
The proposed methods could be applied also on other structures, like deck specimens treated with viscoelastic layers, so they could be very useful in performing comparison between different products on the current market. This research is currently under development.