
Abstract
Throughout the years, many types of Energy Saving Devices (ESDs) have been introduced to the naval industry, each claiming to achieve several percent of power reduction. Although their commercial success is undeniable, there has always been much controversy regarding the assumed working principles of ESDs. Therefore, the basis of this paper is a comprehensive explanation of the hydrodynamic working mechanism of an Energy Saving Device known as the Blade efficiency improving Stator Duct (BSD). Using knowledge of this working principle, an alternative way of analysing propulsion efficiency dedicated to pre-swirl devices has been developed. The working mechanism of the BSD and the assessment of its performance is subsequently demonstrated at model scale by means of RANS simulations.
Another topic of discussion regarding ESDs are the scaling procedures used in model testing to predict the full scale performance, which possibly lead to exaggerated claims. The scale effect on the performance of the BSD is therefore addressed in the final part of this paper, also based on numerical simulations.
Introduction
Background
For more than 35 years, Energy Saving Devices (ESDs) have been designed, tested and built to improve the fuel efficiency of ships. Especially during the second oil crisis, new ESDs were rapidly introduced to the market. After the eighties, as the world economy recovered and the oil prices dropped, interest in ESDs slowly diminished, partially due the absence of clear evidence regarding their working principles and performance. However, reducing fuel consumption in the current challenging world economy, the restrictions regarding engine power with the upcoming EEDI regulations and the rise of Computational Fluid Dynamics (CFD) to improve the understanding of the working principles, the interest in ESDs has revived.
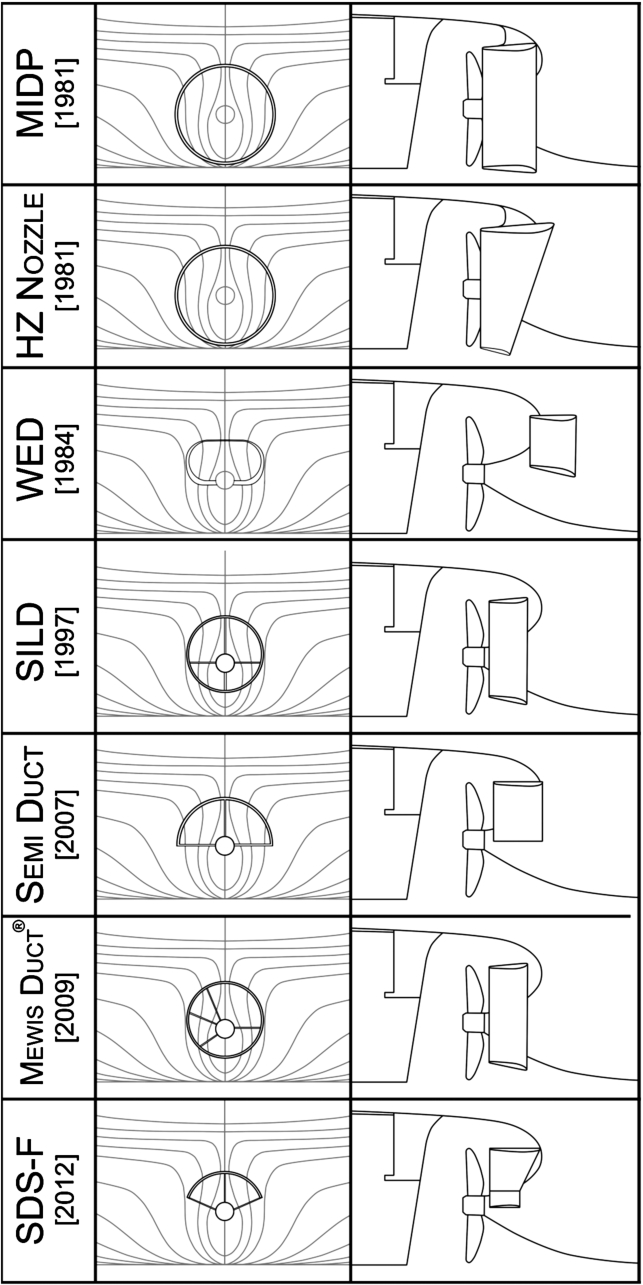
An overview of the evolution of the pre-duct.
A great many papers have been published over the years, introducing new ESD designs, their benefits and their working principles responsible for the energy saving. One of the first papers, describing a nozzle in front of the propeller to increase fuel efficiency, was published already in 1949 by van Lammeren [18]. To obtain a good overview of important existing ESDs developed over the last 30 years, a brief survey is given in the following.
Figure 1 presents the evolution of the upstream ducted ESDs. The first commercial ESD is the Mitsui Integrated Duct (MIDP) [11]. The MIDP is an annular steel nozzle, which is slightly non-axisymmetric and located immediately in front of the propeller. Almost simultaneously, the Hitachi Zosen Nozzle (HZN) [7] was developed. The HZN design is almost equal to the MIDP, with the exception of a larger deviation from axisymmetry.
In 1984, Schneekluth introduced one of the most famous ESDs up to now: the Schneekluth Wake Equalizing Duct (WED) [15]. The WED consists of two half ring ducts, which are fitted to the hull in front of the propeller.
A decade later, another ESD was launched, the so-called Sumitomo Integrated Lammeren Duct (SILD) [14]. This ESD is also geometrically similar to the MIDP, however, instead of fitting it directly to the hull, the non-axisymmetric duct is mounted using struts and positioned eccentric with respect to the propeller shaft.
In 2007, IHIMU published a paper describing the Semi-Circular Duct [6]. This concept is again very similar to the SILD design with only a semi-circular nozzle instead of a circular one.
In 2009, the Becker Mewis Duct was launched [10]. The Becker Mewis Duct is partially based on the SILD, but complemented with a modified mounting system. Instead of using simple struts to install the device to the hull, the struts act as a pre-stator.
In 2012, Kawasaki’s response to the Becker Mewis Duct was an ESD similar to the Becker Mewis Duct, called the Kawasaki Semi-Duct System with contra-Fins (SDS-F). Instead of using a fully circular duct with pre-swirl stators like the Becker Mewis Duct, a semi-circular duct was used, comparable to the Semi-Circular Duct published by IHIMU. The duct covers the top region of the propeller plane.
Despite the many types of pre-ducts, the working principles of these ESDs are still a matter of debate. This is probably caused by the fact that from model tests it is difficult to interpret the working mechanisms.
In 2013, a new ESD developed within the EU FP7 project GRIP [16] was added to this list: the Blade efficiency improving Stator Duct (BSD). The main function of the BSD is to enhance the performance of a propeller by generating pre-swirl. The BSD is of an asymmetric design, consisting of three pre-swirl stators connected by a semi duct. The BSD is positioned concentrically with the propeller shaft and the diameter is approximately equal to the propeller diameter. A 3D rendering of the BSD is presented in Fig. 2.
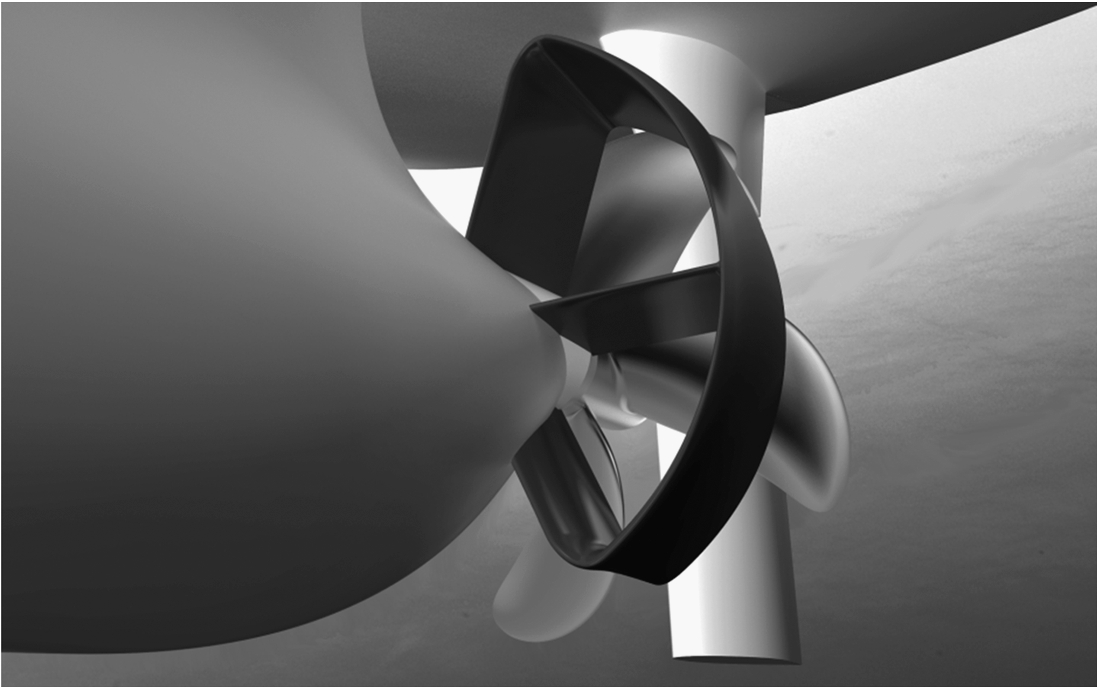
The BSD fitted on the STREAMLINE tanker.
Supported by the semi-duct, the three pre-stators generate the main pre-swirl, see Fig. 3. The redirection of the flow in axial direction by the semi-duct can be considered as pre-swirl. Apart from generating pre-swirl, the duct also suppresses the tip vortices from the pre-stators and adds strength to the structure.
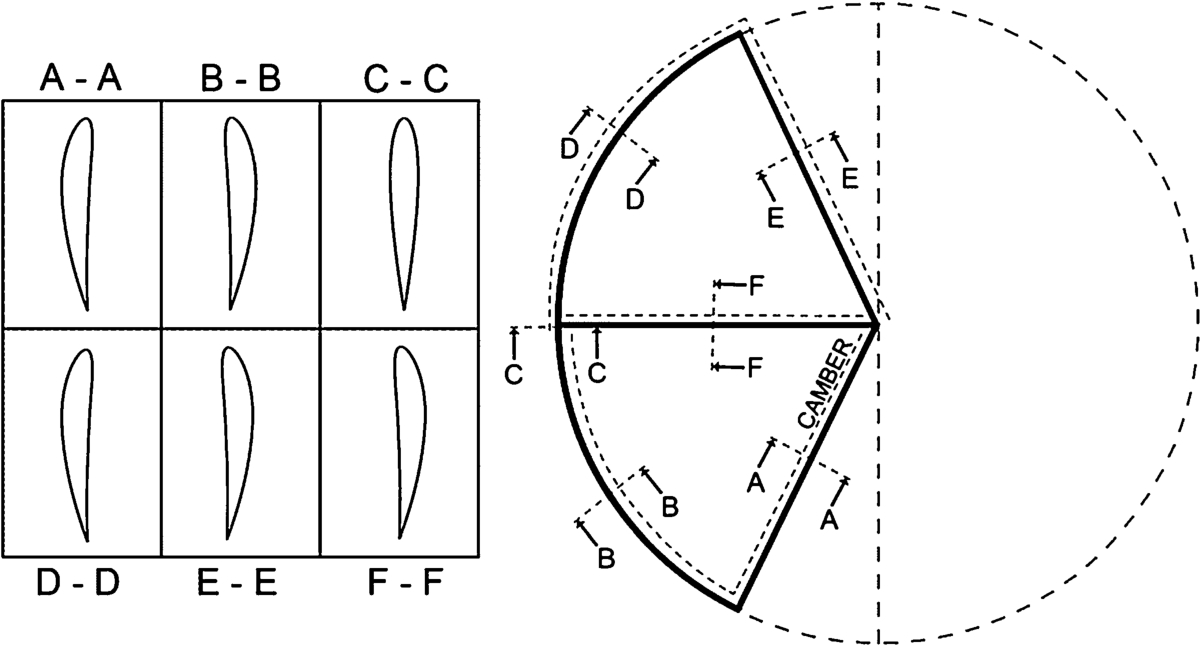
A schematic representation of the BSD.
In addition to the working principles of ESDs, there is another aspect leading to debate: the scaling procedure to be applied to model test results in order to obtain a full scale prediction remains uncertain, possibly leading to exaggerated claims. Therefore, also the scale effect on the performance of the BSD is included in this study.
The purpose of this paper is to give a clear description of the working principle of the BSD and through this, of any other pre-duct equipped with stators. This is supported by results obtained with Computational Fluid Dynamics (CFD) simulations. Furthermore, a new method for the analysis of the propulsion efficiency of pre-swirl devices is introduced to better express the effectiveness of an upstream pre-swirl device. The final part of this paper discusses the scale effect on the performance of the BSD, when it has been optimised for model scale performance.
Working principle of the BSD
Energy saving in general
To obtain a power reduction, other than by reducing the ship resistance, there are essentially two options. First, the required thrust of the ship can be reduced by improving the propeller-hull interaction, hence decreasing the thrust deduction. Secondly, the efficiency of the propulsor itself can be improved.
In the first case, the interaction between ship and propulsor is improved, leading to a lower required thrust and subsequently to a power reduction. It is also noted that the propulsor efficiency increases slightly due to the lower loading.
In the second case, improving the propeller efficiency can be accomplished in several ways. First, by reorienting the total force vector acting on a propeller blade in a more favourable direction. That is, a larger thrust component at a smaller torque component, or at least an improvement of the ratio of both. Furthermore, the efficiency can be increased by improving the radial loading distribution of the propeller. As a third option, reducing the hub vortex also leads to an improvement of the propeller efficiency.
The focus of this paper is the improvement of the propeller efficiency. The following section explains how this can be improved by generating pre-swirl.
Improving propeller performance by pre-swirl
The working principle of the BSD is the improvement of the propeller performance by reorienting the total force vector through pre-swirl. The effect of pre-swirl can be explained as follows. A propeller rotates at a certain constant rotation rate. In Fig. 4(A), a schematic of a representative blade section is given, where for the sake of simplicity the induced velocity components are neglected. This section experiences a certain angle of attack, which results in a total force vector acting on the blade. Behind the propeller, the velocity in the earth fixed reference frame (
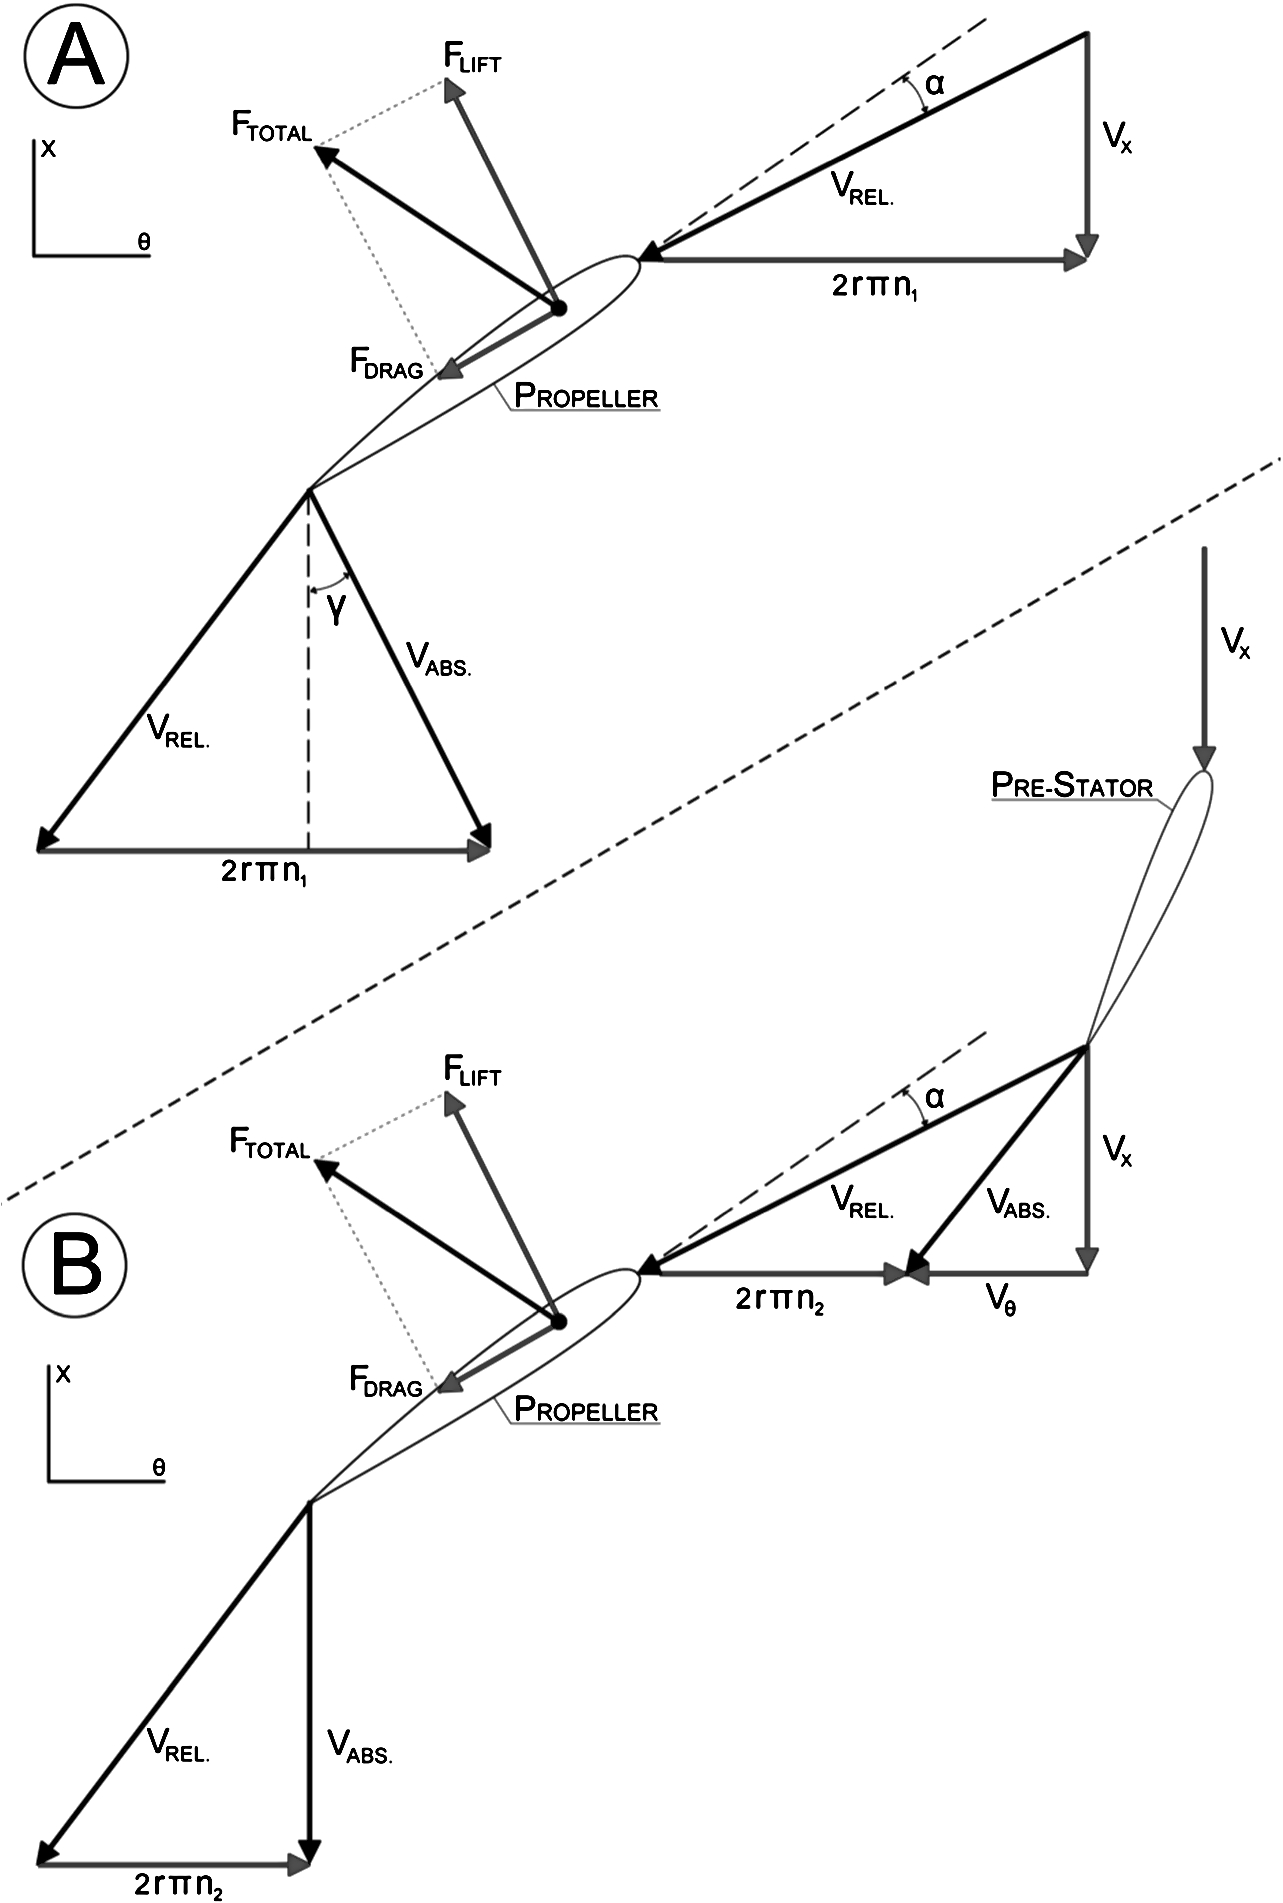
Velocity and forces for (A) a propeller section, (B) a propeller section with pre-swirl.
By fitting a pre-stator in front of the propeller, the rotation rate of the propeller can be reduced while still experiencing the same effective angle of attack, neglecting small deviations in axial velocity. The total force vector acting on the propeller remains therefore unchanged. The total force vector can be decomposed into a force in axial direction, representing the thrust, T, and in tangential direction, representing the tangential force. Multiplying the tangential force by the local radius of the blade section gives the torque Q.
In Fig. 4(B), the propeller can generate the same thrust at a lower rotation rate and hence consumes less power. Ideally, the flow behind the propeller does not contain any swirl anymore.
A propeller working behind a ship will experience a large variation in inflow and therefore in blade loading during a revolution. Besides the blade loading, also the blade effectiveness, defined as the dimensionless ratio of the thrust and torque coefficient,
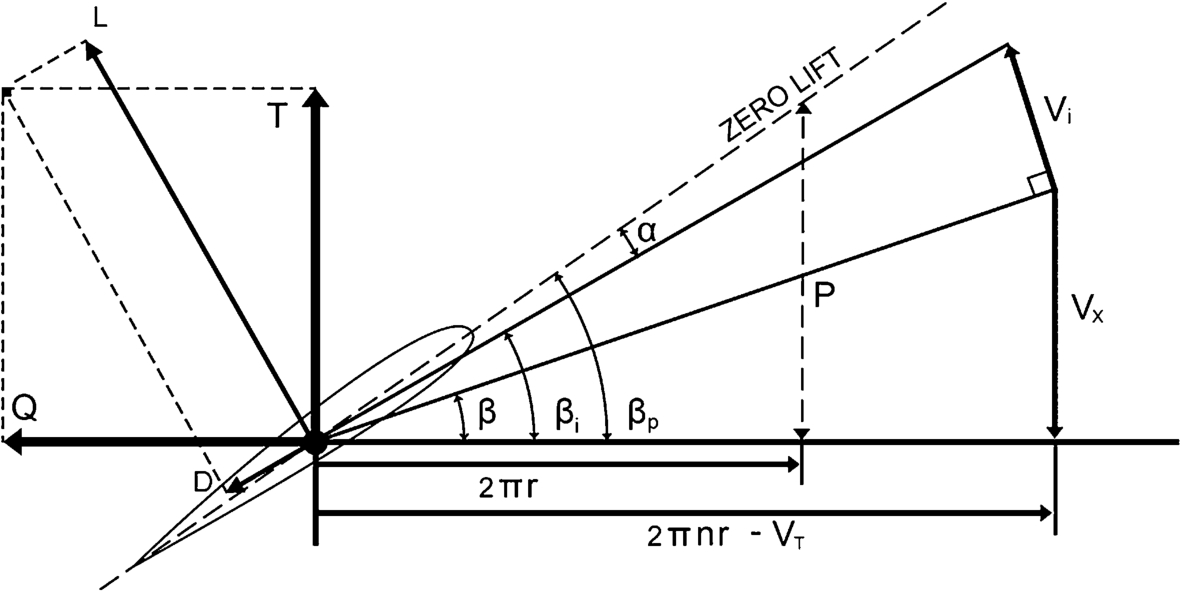
Velocities and Forces Diagram for a propeller blade at a constant radius.
Figure 5 presents a propeller blade section at a constant radius. It is first assumed that the propeller is operating in open water conditions; the axial velocity
Another important geometrical aspect of the propeller is the pitch angle,
Theoretically, the pitch angle should be close to zero to have an optimal orientation of the lift vector L in axial direction. The torque component of the total force is in that case almost zero. Since the pitch angle is the largest at the inner radii, the largest rotational losses occur there.
The radial distribution of the pitch can be optimized for the open water condition. However, when the propeller operates behind a ship, pitch optimisation becomes more complex.
Neglecting the induced velocities as before, the angle of attack α equals the hydrodynamic pitch angle β minus the propeller pitch angle
Using this equation, three conclusions can be derived. First, a change in
Summing up, to improve the blade efficiency, the angle of attack needs to be increased. By increasing the angle of attack, the total force vector tilts favourably, increasing the thrust component and reducing the torque. Especially at the inner radii the blade efficiency can be improved, because the largest variation in angle of attack occur there.
Besides a reduction of rotational losses, the BSD also makes the thrust distribution over the propeller more uniform. The pre-swirl reduces the variation in angle of attack and hence in thrust, resulting in a small reduction of the axial losses.
Next to a small contribution to the power reduction, equalizing the thrust will also have a positive effect on the cavitation behaviour of the propeller. Since a propeller is often a trade-off between efficiency and cavitation nuisance, generating pre-swirl can lead to a more efficient propeller while meeting the cavitation criteria.
Having explained the positive effect of pre-swirl on the propeller, unfortunately, its generation comes at a cost. For an open water condition, where the inflow is in the axial direction, the generation of pre-swirl will always induce a resistance force, which must be compensated by the propeller. For the ‘behind ship’ condition, the propeller inflow may have a strong tangential component depending on the shape of the hull. For a clockwise rotating propeller (as seen from behind the ship), pre-swirl at a blade position of
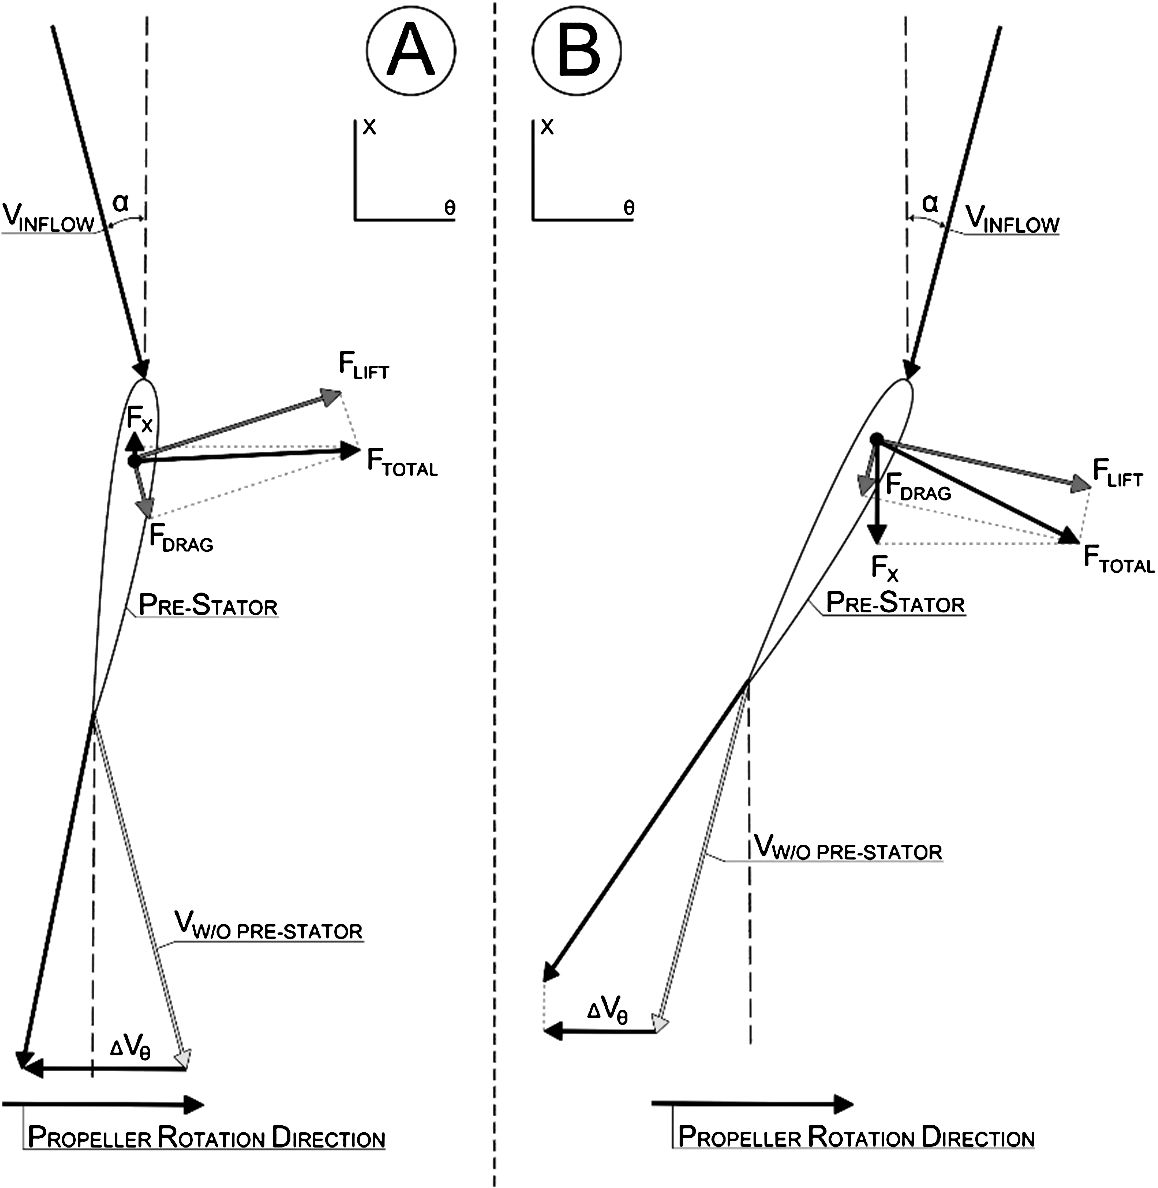
The generation of pre-swirl for a right handed propeller at (A) port-side [90°] and (B) starboard [270°].
In panel (A) of Fig. 6, the velocity diagram of the pre-stator positioned at the 90° blade position can be seen. The axial direction (x) corresponds to the sailing direction and the tangential direction (θ) to the propeller rotation direction. The velocity without pre-stator equals the inflow velocity. The difference between the inflow velocity and the velocity with pre-stator is the pre-swirl, denoted as
At
However, at
On the other hand, reducing the pre-swirl for blade position
Based on the working principle described above, a dedicated efficiency analysis is developed, which allows for a direct physical interpretation of the effect of pre-swirl. To make a proper distinction, first the conventional propulsion efficiency analysis will be briefly discussed.
The propulsion efficiency analysis of a ship is a difficult task, because there is always an interaction between the propulsion system and the hull. Since the early days of ship design, propeller and ship have been analysed as individual systems, using the open-water propeller characteristics as a reference.
The classical method to analyse the efficiency of a propulsion system is by evaluating the overall propulsion efficiency as built up from an open water component, a hull resistance component and an interaction term. The propulsive efficiency,
For example, suppose that an attempt is made to improve the propulsive efficiency by application of an ESD, in particular a pre-swirl device. Considering the combination of ESD and propeller as the propulsion system. In that case, the thrust increases and the rotation rate decreases, resulting in a higher thrust coefficient,
An alternative method to analyse the performance gain at constant speed is by using the ‘behind ship’ propeller performance without ESD as a reference,
The propeller efficiency can be again subdivided in two efficiencies, namely the blade loading and the blade efficiency, as expressed in Eq. (5). The change in blade loading efficiency, which is the ratio in rotation rates, is a measure of the total increase in thrust at identical rotation rate, as was explained in Section 2.2, using Fig. 4. By applying pre-swirl, the rotation rate can be reduced as otherwise the propeller thrust would be too high to maintain self-propulsion at that sailing speed.
The blade efficiency expresses the change in the orientation of the total lift vector and radial loading distribution. It can be seen that the change blade efficiency in Eq. (5) is identical to ratio of the blade efficiencies, presented in Eq. (1), for the ship with and without ESD, in case the propeller diameter is equal for both configurations.
Methods
The design case
The working principle of the BSD is demonstrated for the so-called STREAMLINE Tanker, a 7000 DWT chemical tanker with a reasonable high block coefficient of 0.762. The STREAMLINE Tanker was one of the test-case ships within the European project STREAMLINE [12].
The choice for the STREAMLINE Tanker as reference case is based on several reasons. First, like bulkers, tankers are low speed ships, often equipped with a conventional single-screw propeller. Fuel consumption is by far the most important performance aspect. Moreover, most of the ESDs on the market today are designed for these kind of ships.
Secondly, within STREAMLINE, many detailed model tests and numerical studies were performed for this test-case. These results obtained in the STREAMLINE projects can be used as baseline comparison.
The most important ship and propeller particulars are summarised in Table 1. The Reynolds and Froude number for the design condition for both model and full scale are presented in Table 2.
Ship and propeller particulars of the STREAMLINE tanker
Ship and propeller particulars of the STREAMLINE tanker
The dimensionless flow quantities
The RANS solver
The RANS solver used in this study is the MARIN in-house developed CFD code ReFRESCO. ReFRESCO is a viscous-flow CFD code that solves multiphase, incompressible flows using the RANS equations, complemented with turbulences models, cavitation models and volume-fraction transport equations for different phases. The equations are discretised using a finite-volume approach with cell-centred collocated variables, in strong-conservation form, and a pressure-correction equation based on the SIMPLE algorithm is used to ensure mass conservation. Time integration is performed implicitly with a second order backward scheme. At each implicit time step, the non-linear system for velocity and pressure is linearised with Picard’s method, using a segregated approach. The implementation is face-based, which permits grids with elements consisting of an arbitrary number of faces and if needed h-refinement (hanging nodes). Finally, the code is developed, optimized and validated exclusively for maritime applications [13].
The interaction between the ship, BSD and propeller is of great importance to correctly prediction the change in power demand. Therefore, the propeller geometry was included in the RANS simulation using the ‘Sliding Interface’ (SI) technique. The propeller is modelled in a small cylindrical shaped grid, which rotates inside the grid containing the ship, communicating by the interfaces which they have in common. One time step of the time accurate simulation corresponds to a propeller rotation of 2 degrees.
The turbulence model used for all simulations is Menter k-ω SST version from 2003 [9]. For the model scale simulations, the boundary layer is fully resolved. For the full scale ship, the boundary layer of the ship is solved using wall laws. The propeller blades are fully resolved for both model and full scale. The choice to fully resolve the boundary layer for the blades is not based on physical or numerical arguments, but difficulties in the grid generation process.
The second-order Quadratic Upwind Interpolation for Convective Kinetics (QUICK) is used for the convection term discretisation [8]. The second-order Backward Differencing scheme (BDF) is used for the implicit time integration [3]. A complete overview of the important numerical settings is presented in Table 3.
Important simulation parameters
Important simulation parameters
The rectangular computational domain can be found in Fig. 7. As can be seen, the minimum distance to all domain boundaries is equal to two times the length between perpendiculars (
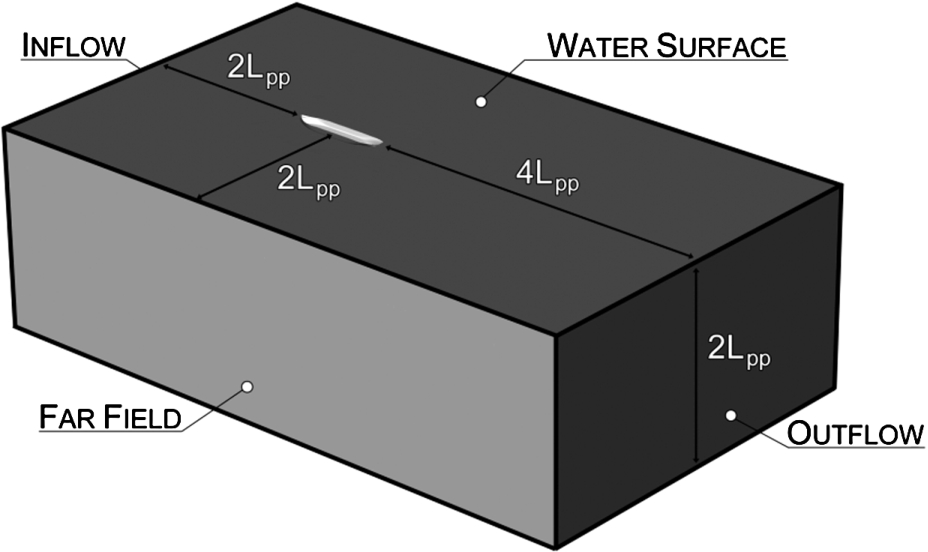
The computational domain.
As presented in Table 2, the Froude number of the STREAMLINE Tanker at the evaluated condition is 0.24. At this speed, it generates large waves which can have an influence on the performance of the BSD. For the sake of simplicity and accuracy, the water surface is determined with a different in-house RANS code called PARNASSOS [17] and subsequently included in the ReFRESCO by a fixed surface. The dynamic trim and sinkage of the ship has been fixed, taking the values from the model test for both configurations.
At the inflow boundary of the ship domain, uniform constant velocity is prescribed. At the outflow boundary, a Neumann boundary condition is applied, stating that the gradient of the velocity must be equal to zero. The far field boundary conditions are Dirichlet boundary conditions, prescribing the pressure to be zero. At the fixed water surface, a free-slip boundary condition is applied, requiring the normal velocity component to be zero.
To predict the performance of an ESD accurately, the interaction between ship, ESD and propeller must be as complete as possible. Therefore, as described in Section 3.2.1, both the ship and propeller are fully modelled in the RANS simulation using sliding interfaces.
The domain consists of two grids; a large unstructured grid containing the ship and BSD, made with the grid generation software HEXPRESS [5] and a small circular structured grid containing the propeller, generated with GridPro [4].
The amount of surface cells are identical for model and full scale. However, the difference in wall treatment results in far less cells for full scale. The grid characteristics of the model scale grid are listed in Table 4 and for the full scale grid in Table 5. A perspective view of the grid can be found in Fig. 8.
Grid characteristics model scale
Grid characteristics full scale
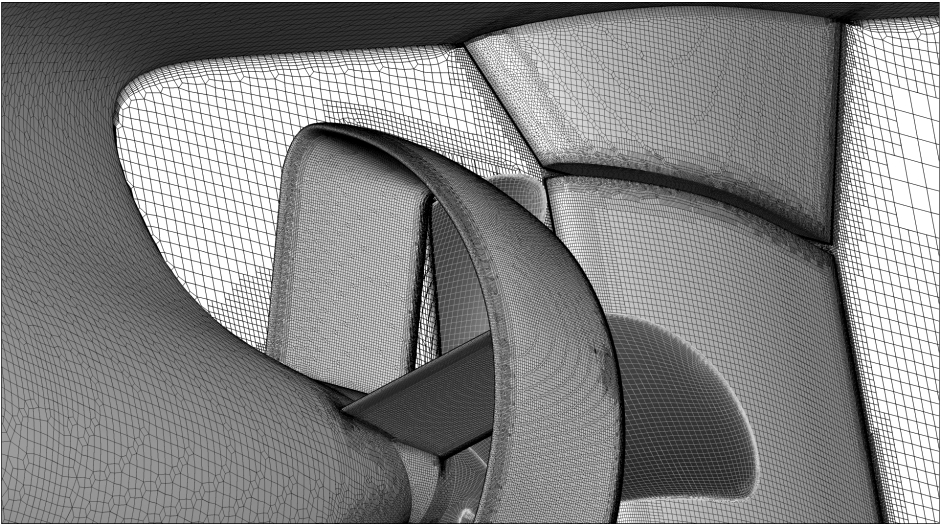
A perspective view of the grid including the BSD.
Since computation times for unsteady simulations can become rather high, in the order of weeks on
The pre-swirl generated by the BSD enables the propeller to generate more thrust at the same rotation rate. For a fair comparison, the BSD must be analysed at the self-propulsion point. One can adjust the propeller, or fit a new propeller with a lower pitch to run at the same rpm as the ship without BSD. The third option is to reduce the rotation rate of the propeller.
The first option, modifying the original propeller, can be attained in several ways. Probably the most beneficial option is a pitch reduction of the propeller blades. In that case, the propeller rotation rate will remain unchanged,
Often, the third option is preferred in the case of a refit, where the propeller rotation rate is reduced under the condition that the engines allow for it.
In the case of a new build however, it is better to directly alter the propeller design to the preferred working point.
In this paper, we have chosen the third option and accept the rotation rate reduction, keeping the original propeller design. To better understand the effect of the BSD on the propeller performance, the ship with ESD is also evaluated for equal rotation rate.
The result of the numerical propulsion test for model scale can be found in Table 6. The results for the STREAMLINE Tanker without BSD correspond quite well with the results obtained by Queutey [12].
The propulsion prediction for both without and with BSD on model scale
The propulsion prediction for both without and with BSD on model scale
In general, an ESD based on generating pre-swirl or recovering swirl behind the propeller, only performs as intended with a working propeller. Therefore, the BSD is assumed to be part of the propulsion system for the conventional analysis. From the conventional propulsive efficiency analysis, see Table 7, it follows that the propeller becomes less efficient, as was described in Section 2.4. The gain in propulsion efficiency is explained as an improved interaction between ship and propeller.
The conventional propulsive efficiency
The conventional propulsive efficiency
The alternative analysis, see Table 8, shows that the increase in propeller efficiency is responsible for the power reduction. Unfortunately, due to a less favourable interaction between the propulsion system and the hull, the propeller needs to generate more thrust, which suppresses the total increase in propulsion efficiency.
The alternative propulsive efficiency
As introduced in Section 2.4, the propeller efficiency can be subdivided into two efficiencies: the blade loading and blade efficiency. Both changes in efficiencies will be discussed in the following sections.
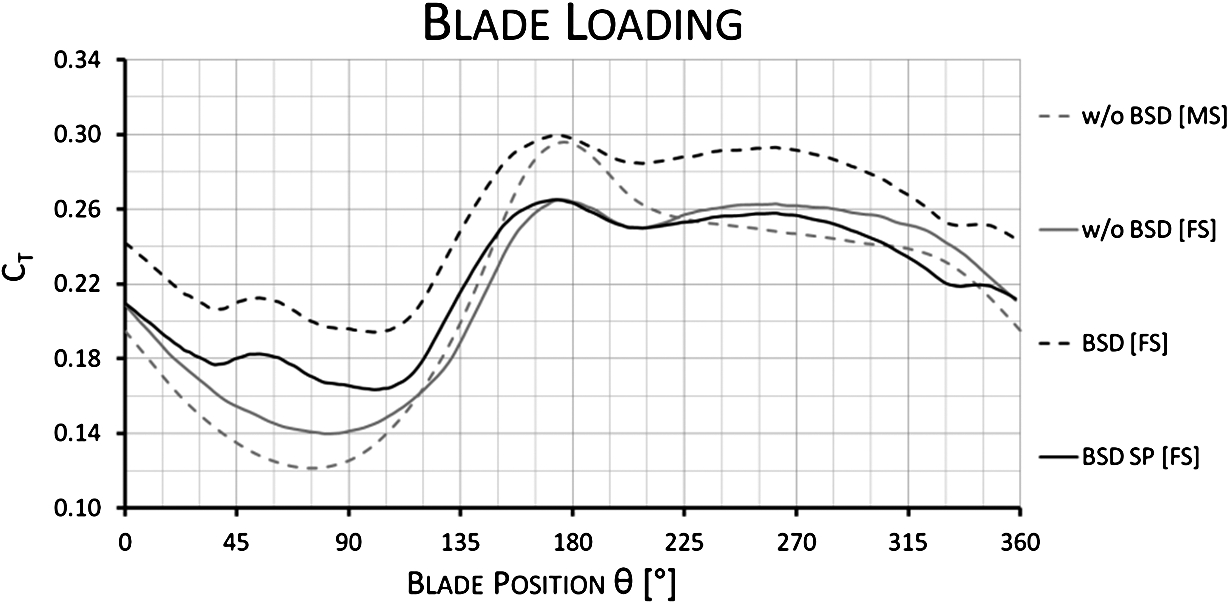
The blade loading
The blade loading efficiency, representing the reduction in rotation rate, can be analysed by observing the total increase in thrust at the original rotation rate. The delivered thrust of a propeller blade can be made dimensionless by dividing it by the undisturbed dynamic pressure times the propeller surface, known as the loading coefficient:
The loading coefficient is given in Fig. 9 for the configuration without with BSD for both the original (dashed line) and the corrected rotation rate (solid line) to obtain self-propulsion.
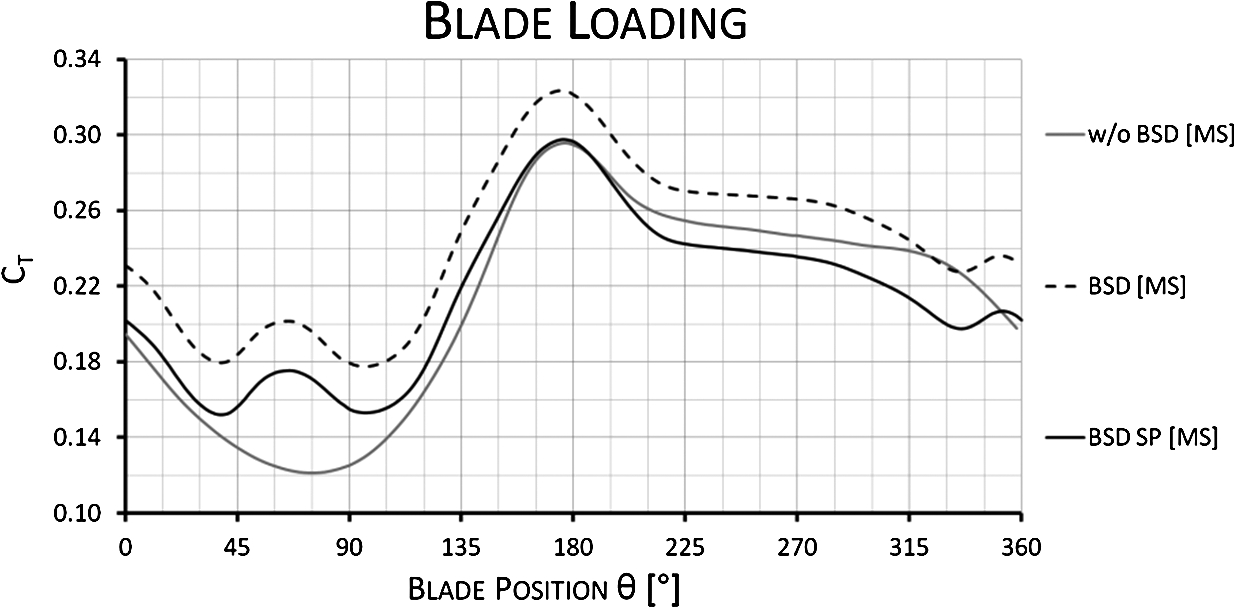
The blade loading coefficient during a propeller revolution.
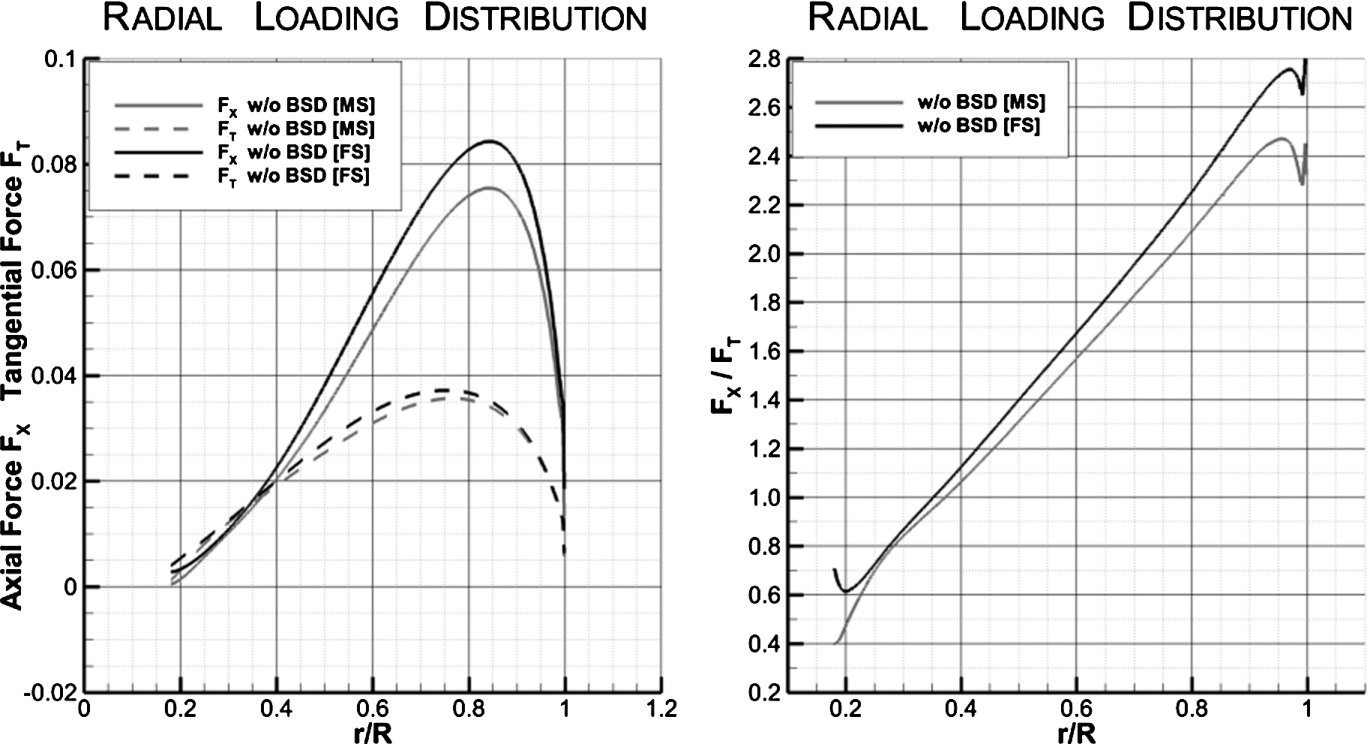
As can be seen in Fig. 9, the blade loading increases for every blade position; the induced velocities of the BSD are not restricted to a local region. Furthermore, the also loading increases over the complete propeller blade, see Fig. 10.

The radial loading distribution for the blade at 90°.
The total loading coefficient
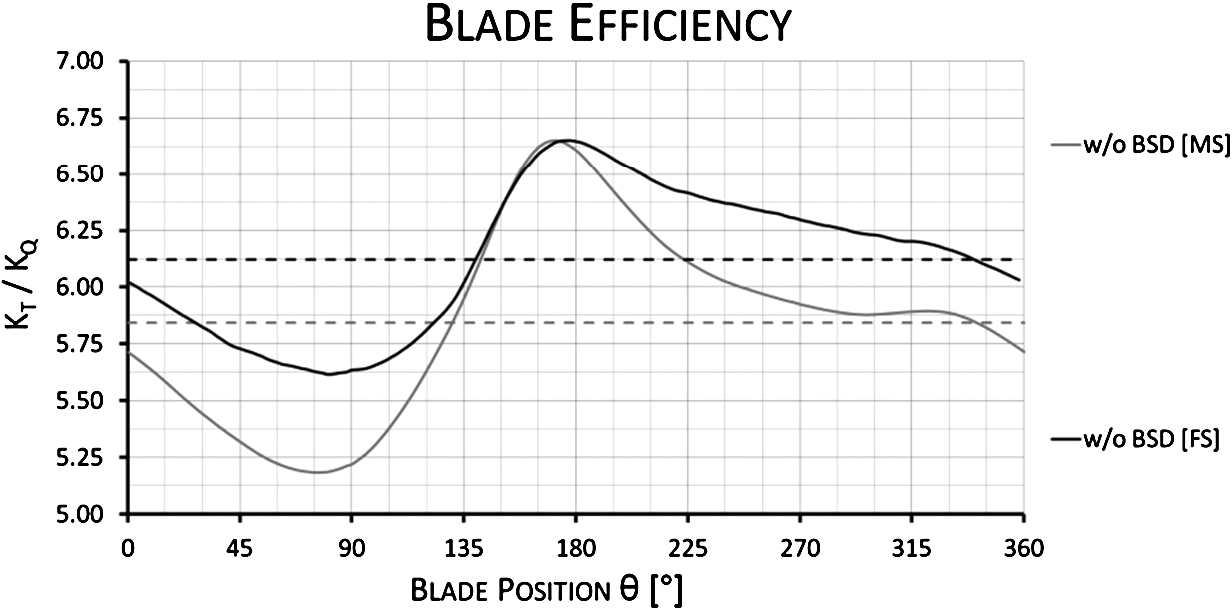
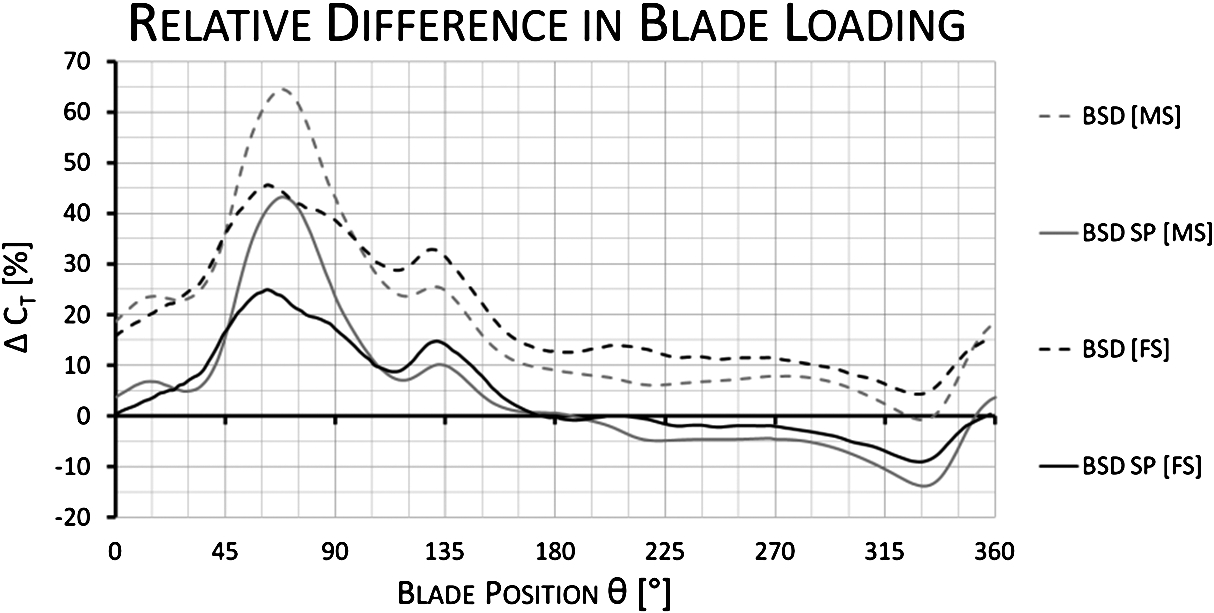
If the rotation rate is kept equal for both configurations, the blade efficiency increases over the complete propeller revolution due to the generated pre-swirl. The effect of the BSD is also experienced on starboard side. The effect in the wake peak is small, because the angle of attack and thus the blade efficiency is dominated by the axial velocity.
When the rotation rate is reduced, also the blade efficiency reduces; the lift vector tilts unfavourably and thus reduces the obtained increase in blade efficiency slightly, see Fig. 11.
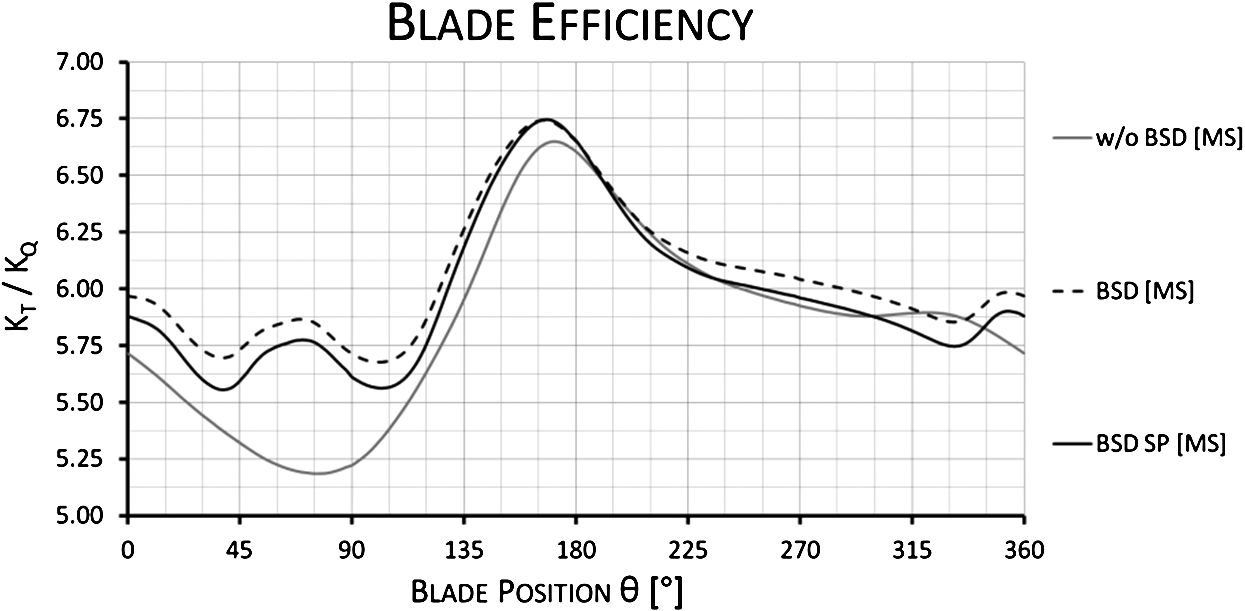
The blade efficiency as function of the blade position at model scale.
By reducing the rotation rate to bring the configuration with BSD in self-propulsion, although the blade efficiency decreases, the overall efficiency of the propeller increases; the positive effect of the rotation rate reduction is larger than the decrease in blade efficiency. In the end, the total increase in propeller performance is a considerable 6.0%.
As explained in Section 2.2, the greatest improvement of the blade efficiency occurs at the inner radii, especially at the blade position of 90° as can be observed in Fig. 12.
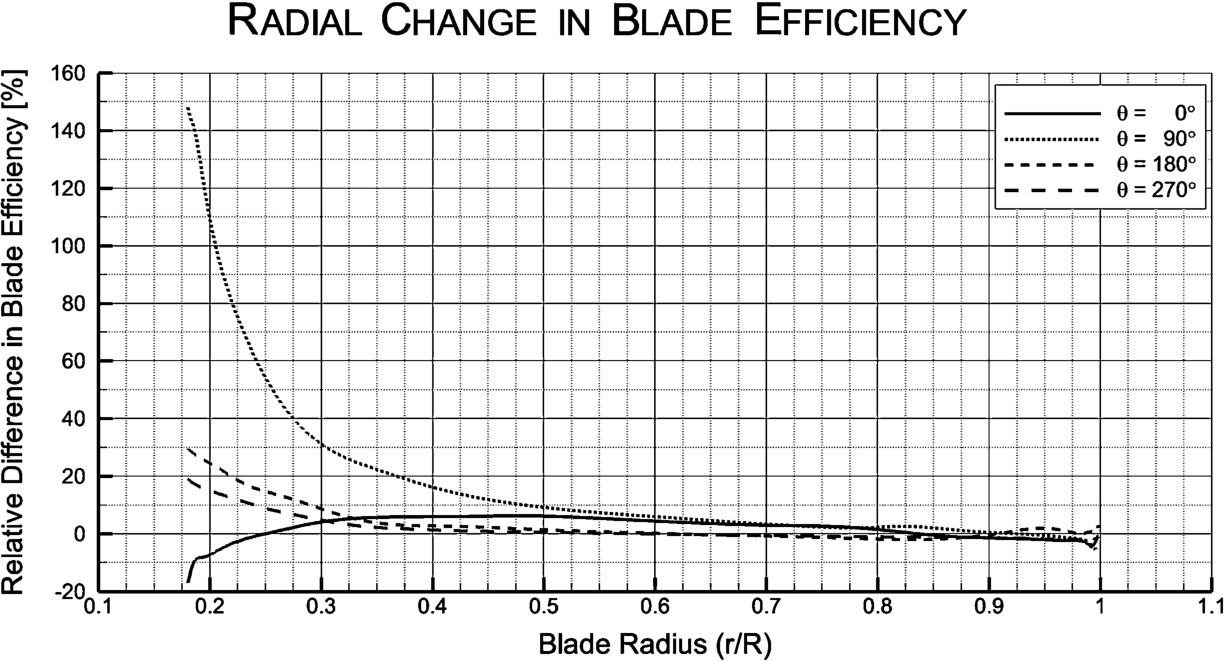
Radial distribution of the change in blade efficiency for all four propeller blades.
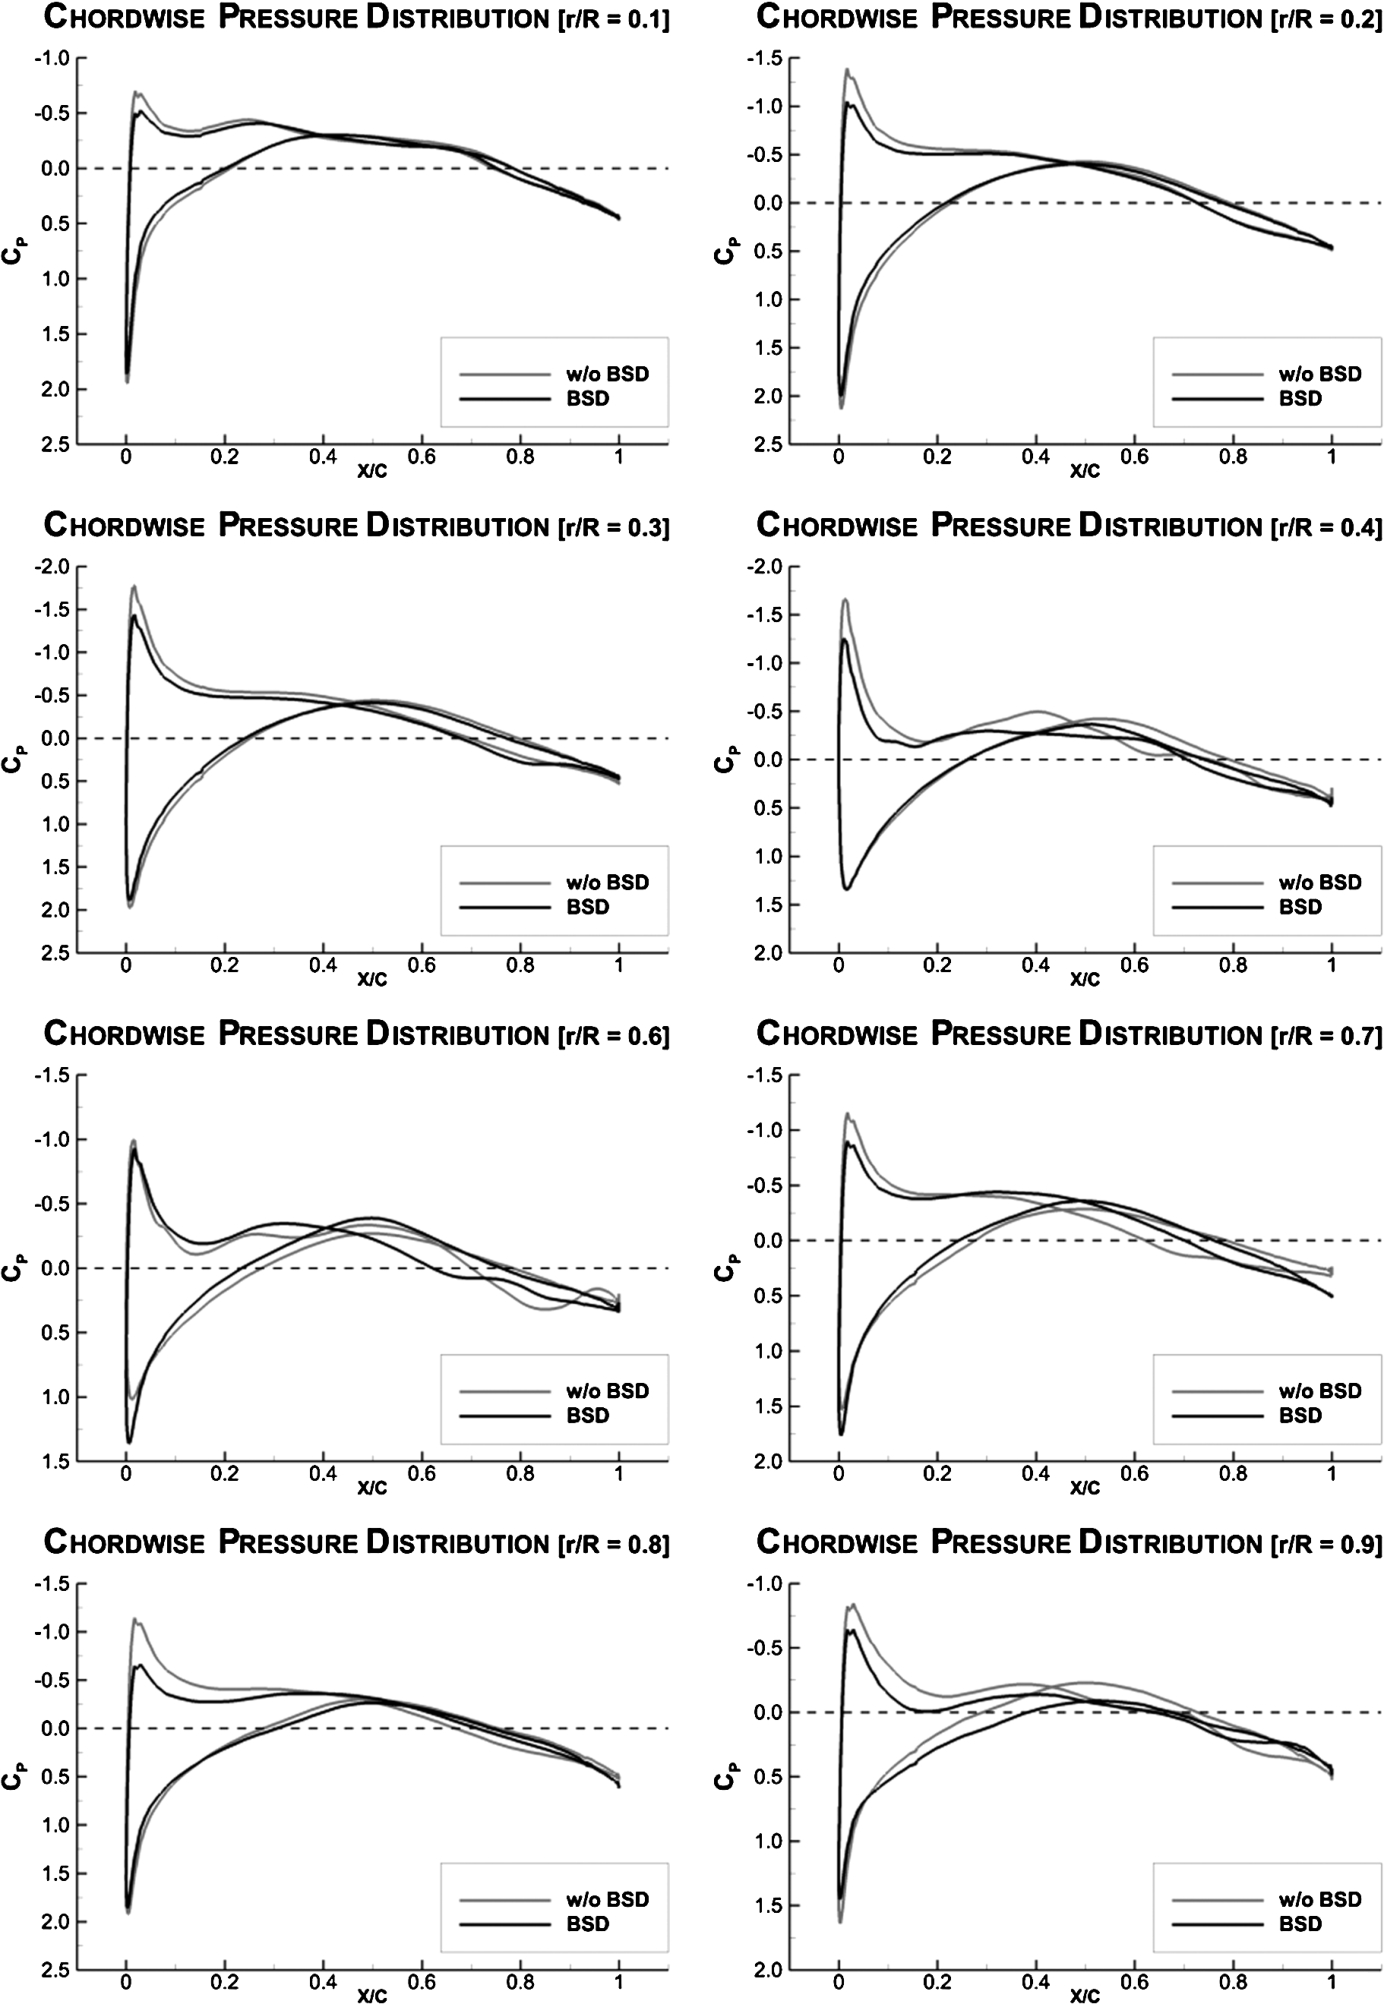
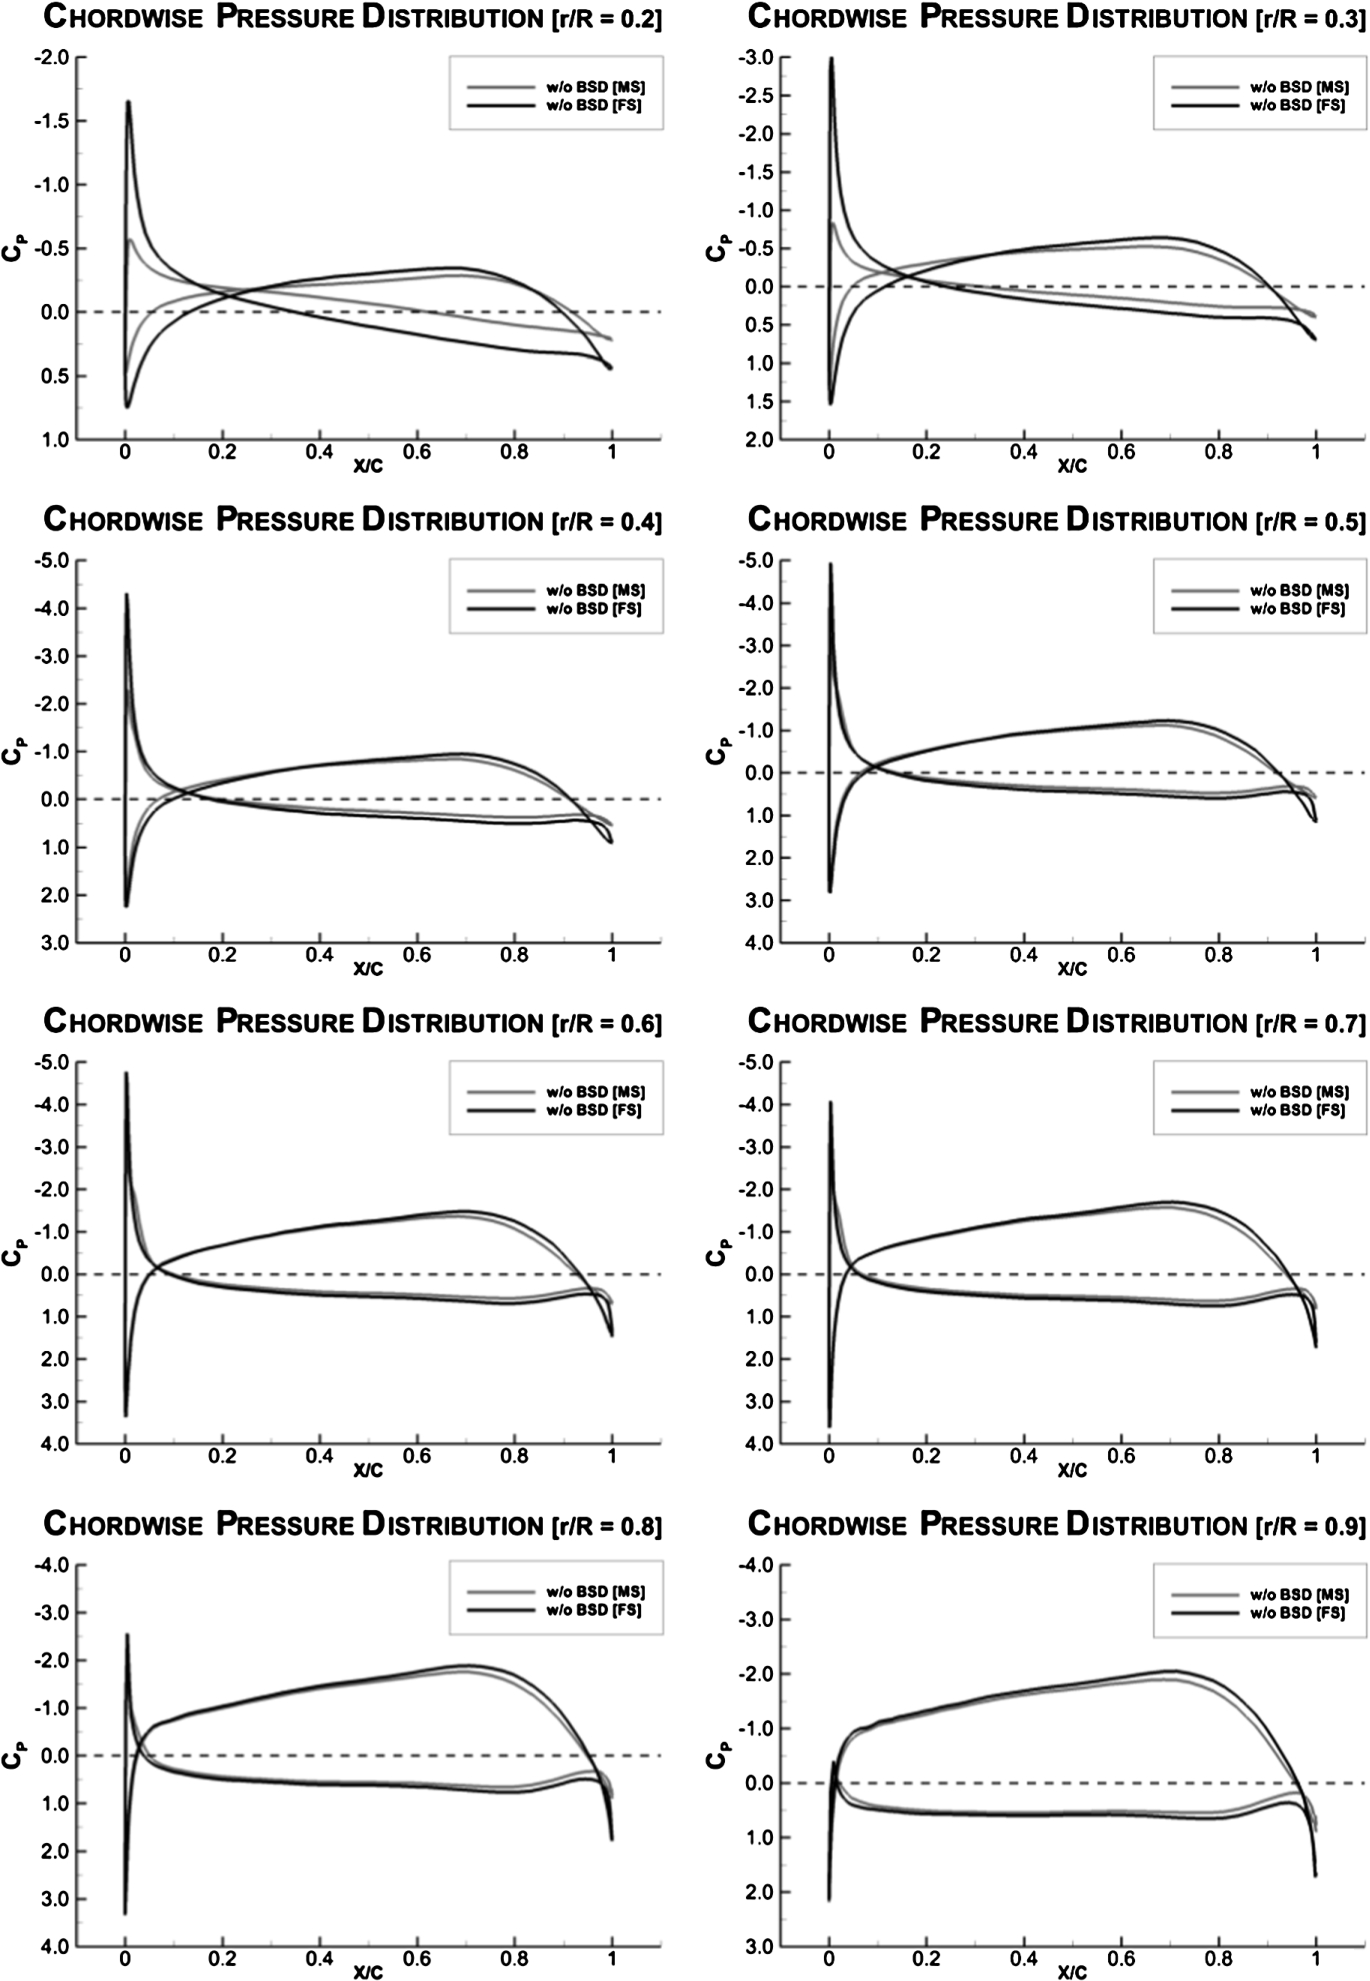
This efficiency gain is obtained by increasing the angle of attack. To illustrate the change in angle of attack, the chord-wise pressure distribution of several sections are plotted for the blade located at
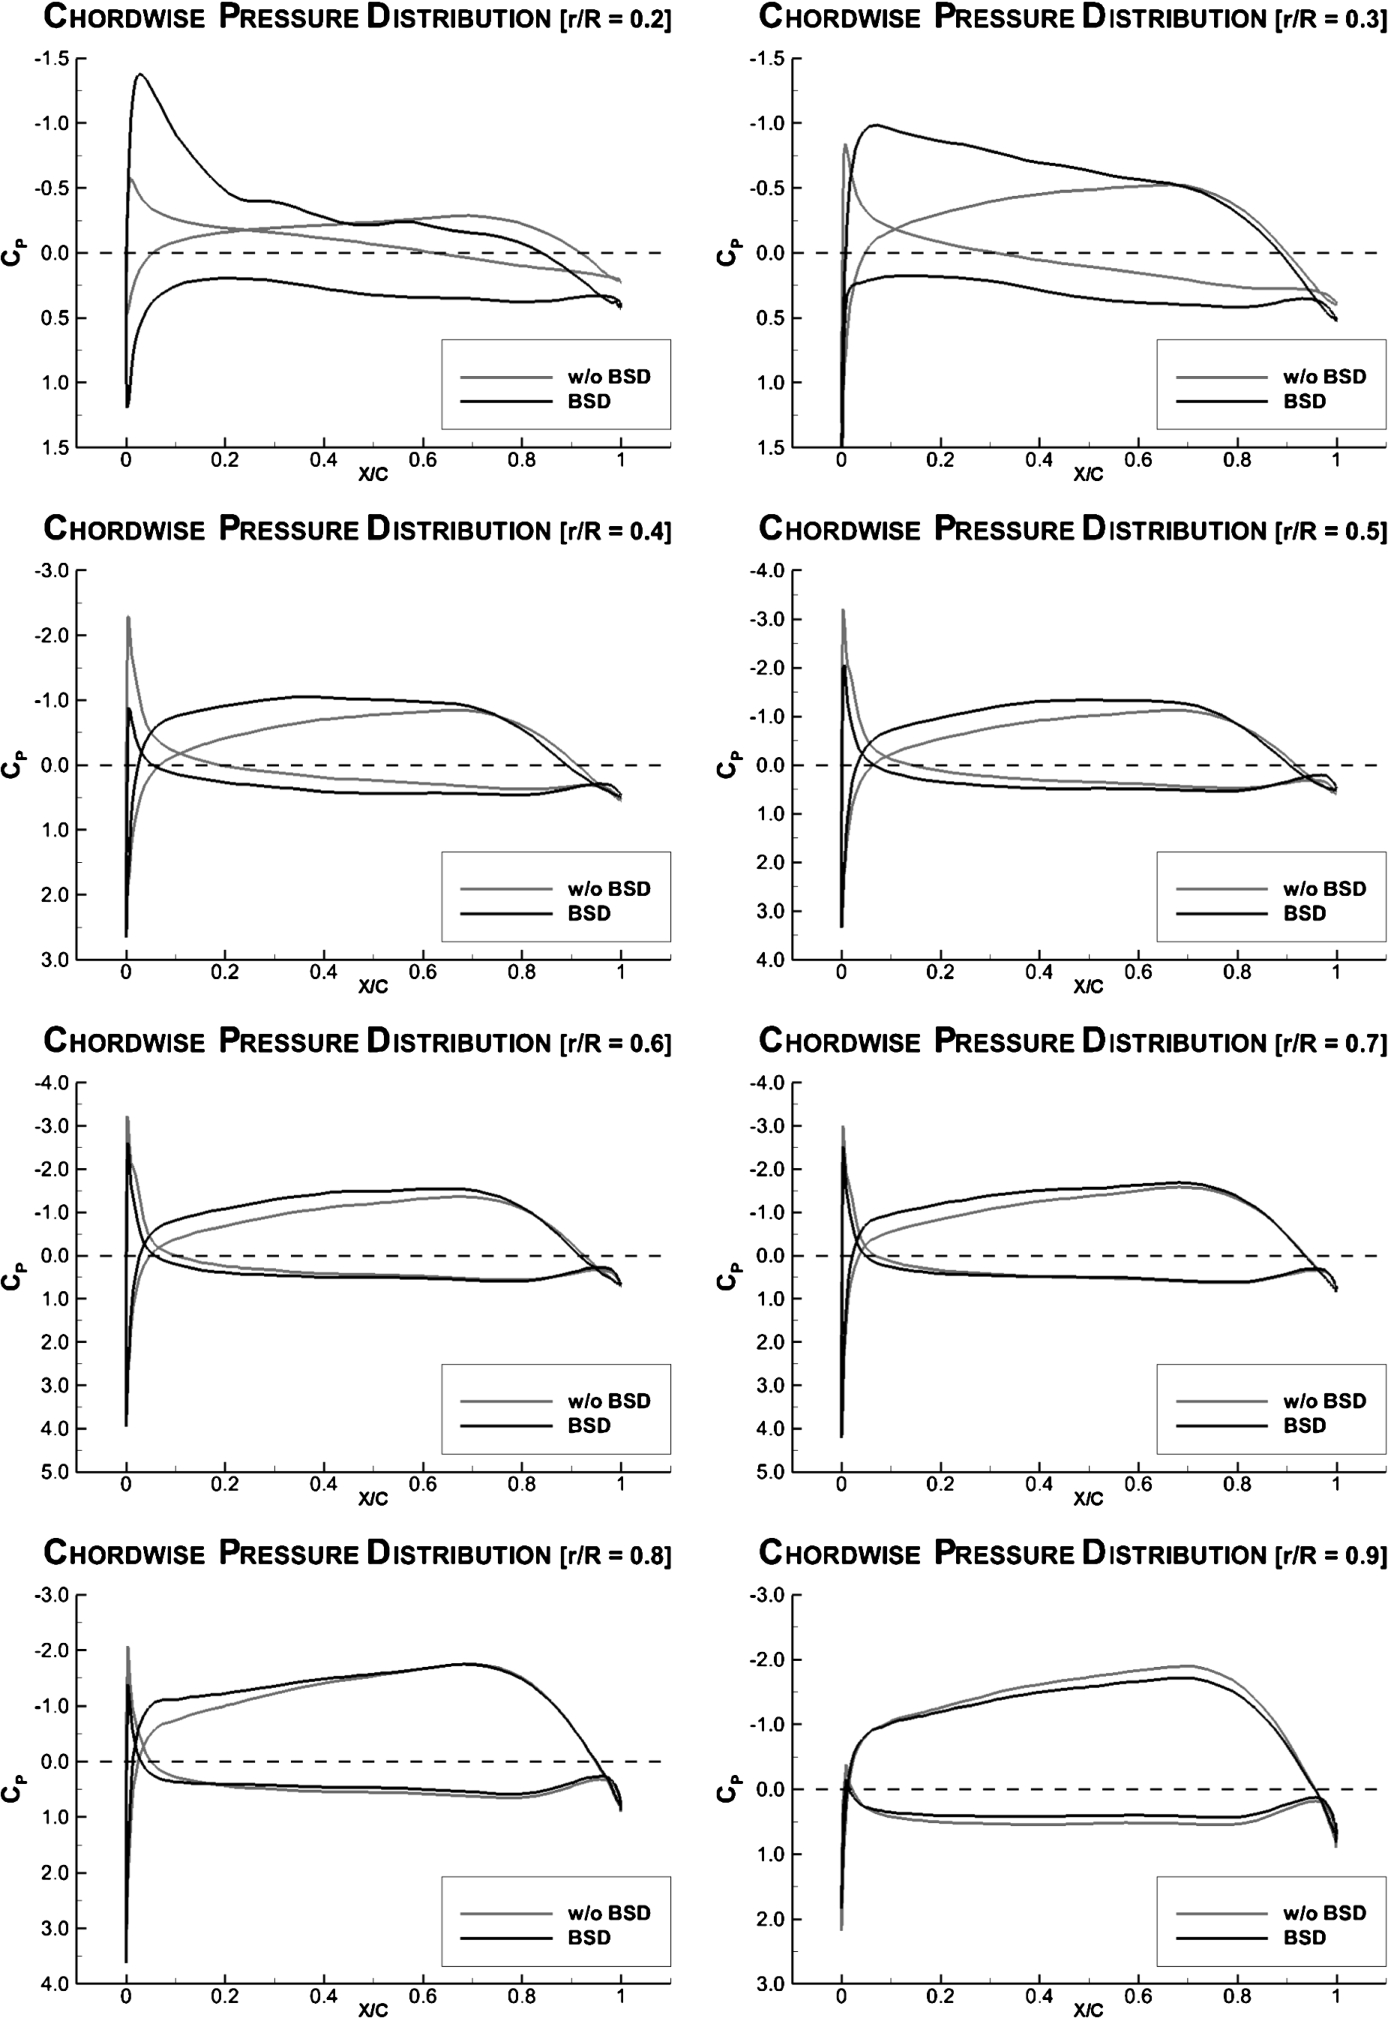
The chord-wise pressure distribution for different radii.
Of course, it is not preferred to have the stagnation point located at the suction side of the propeller. However, since a propeller is designed for a circumferential averaged inflow, the variation in wake velocities during a propeller revolution can result in suboptimal angles of attack.
Improvements at all radii have been obtained due to the presence of the BSD, although it is clearly visible that the effect reduces towards the tip of the propeller blade.
For the current configuration, the total required thrust of the propeller increases by 1.4% due to the presence of the BSD. This change in total force consists of both positive and negative different contributions. The largest contribution in resistance increase is caused by the change in ship resistance, while the resistance of the BSD itself is almost none. Figure 14 gives an overview of the different components. A negative force indicates an increase in resistance, while a positive force implies a reduction.

The relative difference in force with respect to the thrust without BSD.
As can be observed in Fig. 14, the increase of ship resistance is the largest component of the total resistance increase, followed by the drag of the rudder. The total force acting on the BSD is nearly zero. The following sections explain in greater detail the changes in force for the ship, rudder and hub.
The largest contribution to the increase in thrust originates from the ship hull. By positioning a lift generating device between the ship and the propeller, the influence of the propeller induction on the ship resistance becomes larger. Close to the ship, the flow undergoes a larger acceleration due the BSD, resulting in a lower pressure and thus higher pressure resistance. In terms of the efficiency parameters, the interaction between the propulsion system and the ship deteriorates. The friction resistance is not significantly affected.
Figure 15 shows the distribution of pressure differences due to the BSD. The pressure difference is obtained by subtracting the pressures of the ship with and without BSD. By visualizing the iso-surface with a constant difference in pressure, the negative effect on the pressure resistance of the ship becomes visible. Within the volume, indicated in Fig. 15, the difference in pressure coefficient is larger than 0.1.
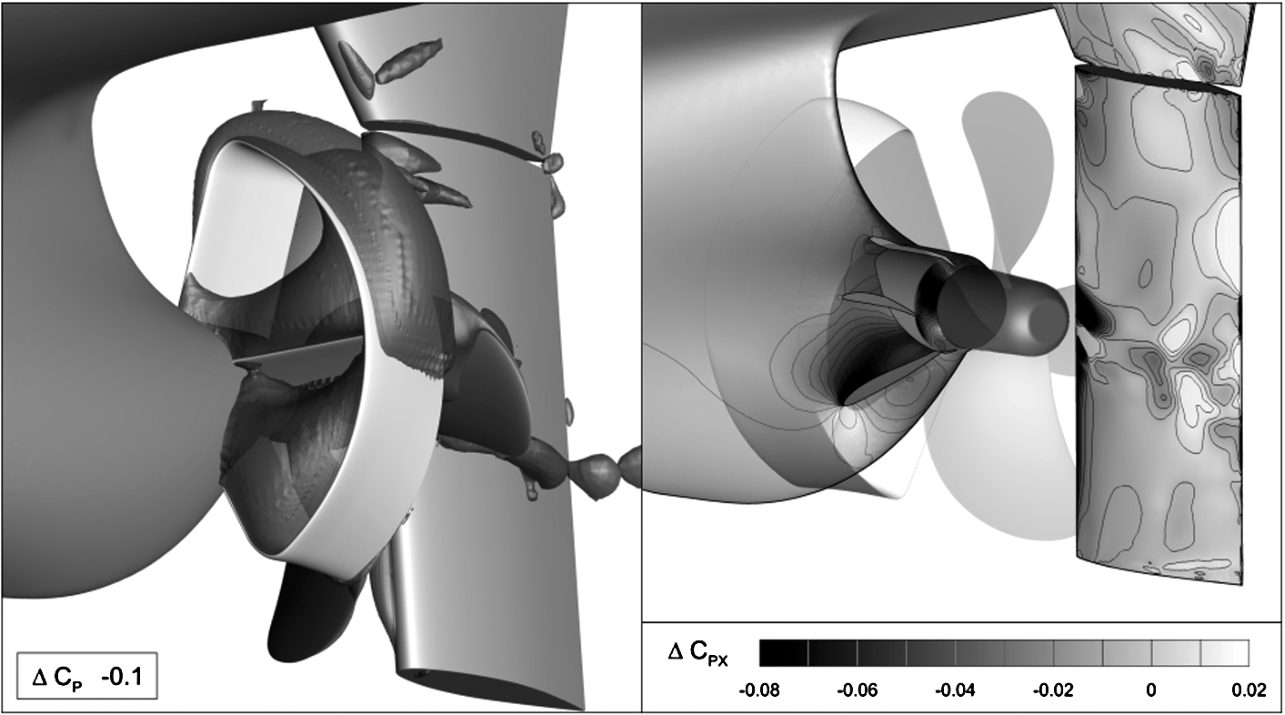
Left: An iso-surface of the difference in pressure coefficient due to the BSD. Right: The difference in pressure coefficient in sailing direction.
By plotting the magnitude of the dimensionless pressure force in sailing direction, the direct influence on the change in ship resistance can be seen. Especially the low pressure generated by the lowest stator has a large negative influence on the ship resistance.
It is important to emphasize that the low pressure also acts on the BSD. The negative effect on the ship hull is a positive effect on the BSD. Evaluating the effect of the propeller induction by only observing the change in pressure resistance of ship, without taking the BSD into account, is therefore not sufficient.
The BSD is located at a very sensitive position regarding ship resistance. For an optimal interaction, so that is a small resistance penalty, pre-swirl must be generated while hardly disturbing the flow at the aft ship. The STREAMLINE Tanker is relatively slender where the BSD is fitted to the hull. For a fuller ship, where the hull is closer to the upper stator blade, the resistance penalty will become larger, resulting in a larger thrust deduction fraction t or a decrease in interaction efficiency.
As can be seen in the diagram presented in Fig. 14, the force acting on the propeller hub becomes more positive. The pressure resistance of the hub is directly related to the strength of the hub vortex; the stronger the vortex, the lower the pressure in the vortex core, the higher the hub drag.
A generally accepted idea is that the hub vortex mainly depends on the actual loading or derivative of the radial circulation gradient of the propeller blade. However, from this study it follows that the strength of the vortex core is directly related to the direction of the downwash originating from the propeller and not only to the actual blade root loading itself.
For a propeller operating in open water, a higher loading of the inner radii will always result in a stronger hub vortex. The only way to increase the loading is by increasing the pitch of the lower radii. By increasing the pitch, not only the circulation increases, but also the component of the total force vector in rotational direction. In other words, more water is being accelerated in a swirling motion.
For the BSD, the blade loading at the inner radii increases, see Fig. 10, however the hub vortex strength reduces. By generating pre-swirl, the angle of the downwash reduces, as was illustrated in Fig. 4. Figure 16 illustrates that the swirl behind the propeller reduces.

The circumferential average downwash angle.
The reduction in swirl produces a weaker hub vortex, resulting in an increase in pressure and thus a decrease of the hub resistance. Using an iso-surface of the pressure, the difference in hub vortex strength can be clearly visualised, see Fig. 17.
Top view of the hub vortex in combination with a contour plot of the
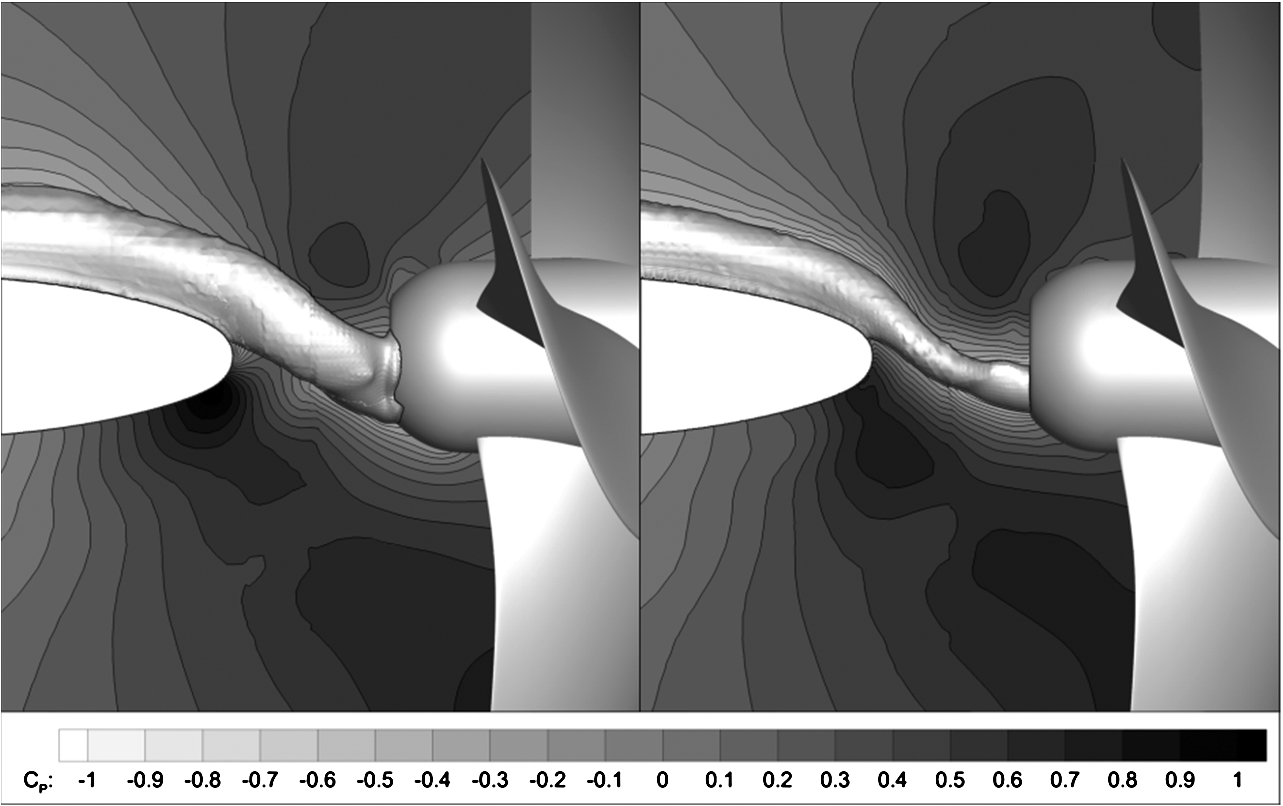
As explained earlier, the tangential velocities behind the propeller have reduced due to the presence of the BSD. An unwanted side effect of less swirl behind the propeller is the increase in rudder resistance, because it becomes less effective as a post-swirl stator. The relative increase in rudder resistance is 35%, which corresponds to 1% of the total propeller thrust.
By plotting the span-wise force distribution of the rudder, presented in Fig. 18, the area where the biggest difference occur can be identified. It can be seen that especially the upper half of the rudder experiences an increase in resistance.
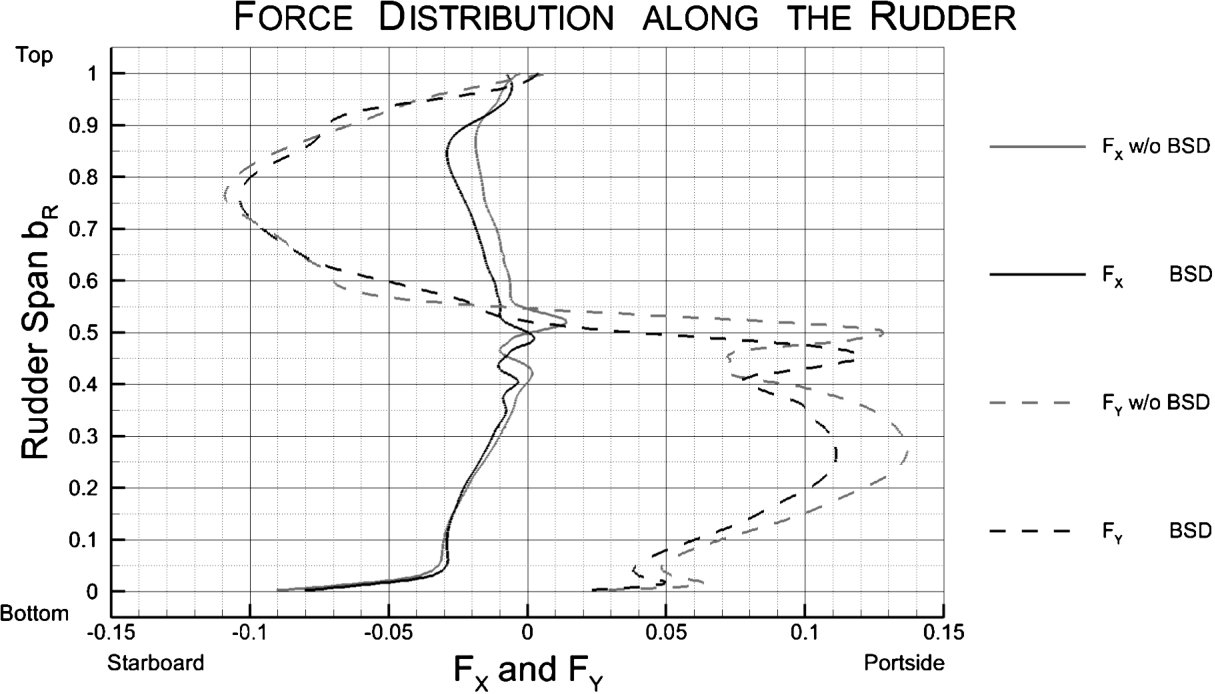
Span-wise forces distribution acting on the rudder.
Another difference can be found at position 0.55 of the dimensionless rudder span, where the propeller shaft is located. The pressure disturbance at this location is caused by the hub vortex. The reduction of the hub vortex strength by the BSD gives a small negative effect on the rudder resistance.
The chordwise pressure distributions for several rudder sections.
The increase in rudder resistance is caused by the difference in angle of attack. The angle of attack is larger for the ship without BSD. This reduction in angle of attack gives a reduction of the total lift vector and also its orientation becomes unfavourable. The difference in pressure distribution due to the change in angle of attack can be observed in Fig. 19.
This analysis illustrates that it is important take the presence of the rudder into account when evaluating the performance of a pre-swirl device. Neglecting the rudder can lead to an overestimation of the total power reduction.
Although the design has not been adjusted to correct for scale effects, the BSD still provides a power reduction of 3.4% on full scale according to the CFD simulations, as can be seen in Table 9.
Before the scale effects on the performance of the BSD are discussed in detail, first the scale effect on the propeller without BSD is treated. The reason is that due to the scale effects the difference in propeller efficiency is already significant, even without the presence BSD.
Scale effects on the propeller performance without BSD
The Reynolds effect on both the inflow towards the propeller and the flow over the propeller itself, result in an improvement in propeller efficiency between model and full scale.
Furthermore, the loading of the propeller becomes more uniform on full scale. The variation in axial inflow velocity is much smaller, resulting in a more constant angle of attack and blade efficiency. This can be seen in Fig. 20.
Apart from showing a more constant distribution over the entire blade revolution, the blade efficiency is also higher for the blades that are not positioned in the wake peak. Especially the propeller sections at the higher radii seem to perform better on full scale, as is shown in Fig. 21. It can also be observed, like was derived in Section 2.2, that the blade efficiency increases towards the tip of the blade.
The difference in propeller quantities between model and full scale for self-propulsion
The difference in propeller quantities between model and full scale for self-propulsion
Comparison in blade efficiency between model and full scale.
Left: The radial loading distribution for both model and full scale. Right: The radial blade efficiency for both model and full scale.
Apparently the higher radii are responsible for the increase in propeller efficiency. As can be seen in Fig. 22, the change in angle of attack between model and full scale is small for the higher radii, but the Reynolds effect on the pressure distribution from mid chord is larger. The most likely explanation is that the thicker boundary layer on model scale de-cambers the profile, resulting in a lower efficiency than on full scale.
Comparison in chord-wise pressure distribution between model and full scale.
At the lower radii, the blade efficiency remains unchanged. Also here a positive Reynolds effect occurs, but due to the higher axial wake velocities, the angle of attack is smaller at full scale. As mentioned, the difference in angle of attack diminishes towards the tip of the blade.
Since the angle of attack for the lower radii is less optimal on full scale without BSD in the first place, relatively more pre-swirl needs to be generated to obtain a similar increase in blade efficiency on full scale.
Table 10 presents a breakdown of the propulsive efficiency due to the BSD for both model and for full scale. Like on model scale, the positive effect is obtained by improving the propeller performance.
The dedicated efficiency analysis for both model and full scale
The dedicated efficiency analysis for both model and full scale
The total increase in propeller efficiency is similar, although the distribution over the various efficiency components is slightly different. The change in blade loading efficiency is slightly more positive, while the positive effect of the blade efficiency is lower for full scale.
Despite of an similar increase in propeller efficiency, the performance of the BSD at full scale is less than on model scale. This is caused by a decrease in the interaction efficiency.
The blade loading efficiency
Due to the Reynolds effect, the variation in axial inflow velocity is severely reduced on full scale, with as a result that not only the blade efficiency, but also the blade loading is more constant on full scale in comparison to model scale for the case without BSD, as can be seen Fig. 23.
The blade loading for without BSD on both model and full scale and with BSD with identical rotation rate and self propulsion on only full scale.
The total
The relative difference in blade loading due to the BSD for both model and full scale.
In Section 5.1, it was shown that there is already an improvement in blade efficiency due to scale effects. Nonetheless, the BSD increases the total propeller efficiency with the same amount as on model scale, although the increase in blade efficiency is marginally smaller.
On model scale, the angle of attack is dominated by the axial velocity deficiency in the wake peak. The effect of pre-swirl is therefore in this region only marginal. However, on full scale the blade efficiency also increased in the wake peak at identical rotation rate. This can be observed in Fig. 25.
The blade efficiency.
Since the reduction in rotation rate to obtain self-propulsion is larger on full scale, the blade efficiency also decreases relatively more, as can be observed in Fig. 26.
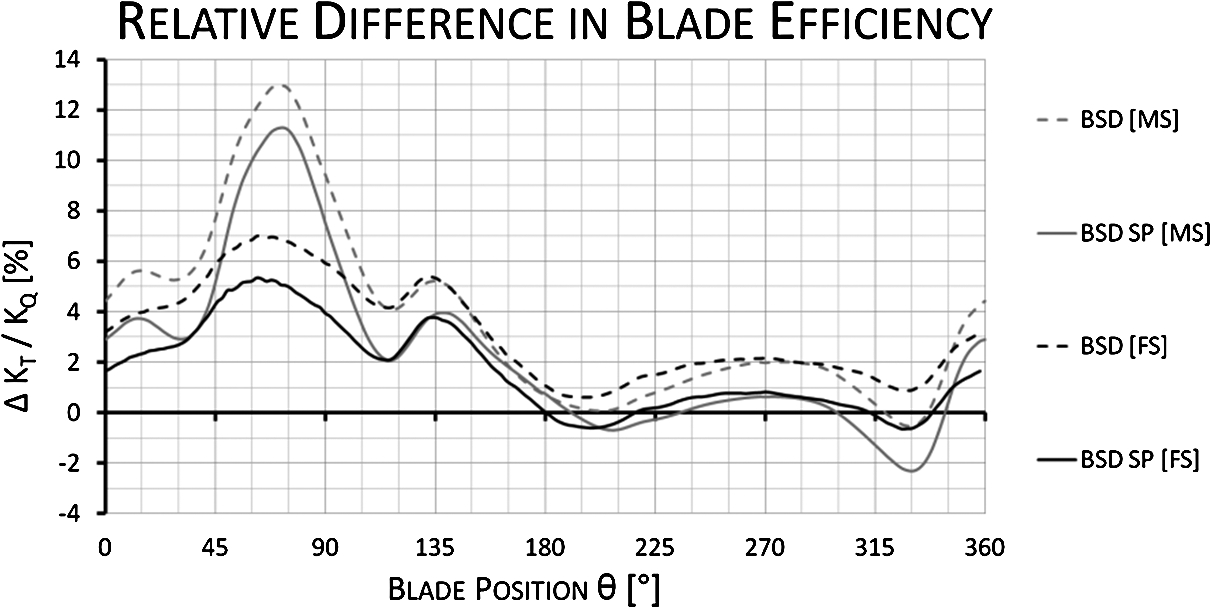
The relative change in blade efficiency due to the BSD for both model and full scale.
As was observed in Section 5.1, the angle of attack is smaller for the smaller radii in the first place on full scale. The consequence is that the increase in blade efficiency is smaller on full scale, especially for blade positions
That effect of the BSD on the angle of attack is more optimal at model scale can be seen in Fig. 27. For both model and full scale, chord-wise pressure distributions are presented for several inner radii. At model scale, the stagnation point shifts from the pressure side to the suction side between dimensionless radius 0.3 and 0.4. However, on full scale the stagnation point is already located at the suction side at a radius of 0.3.
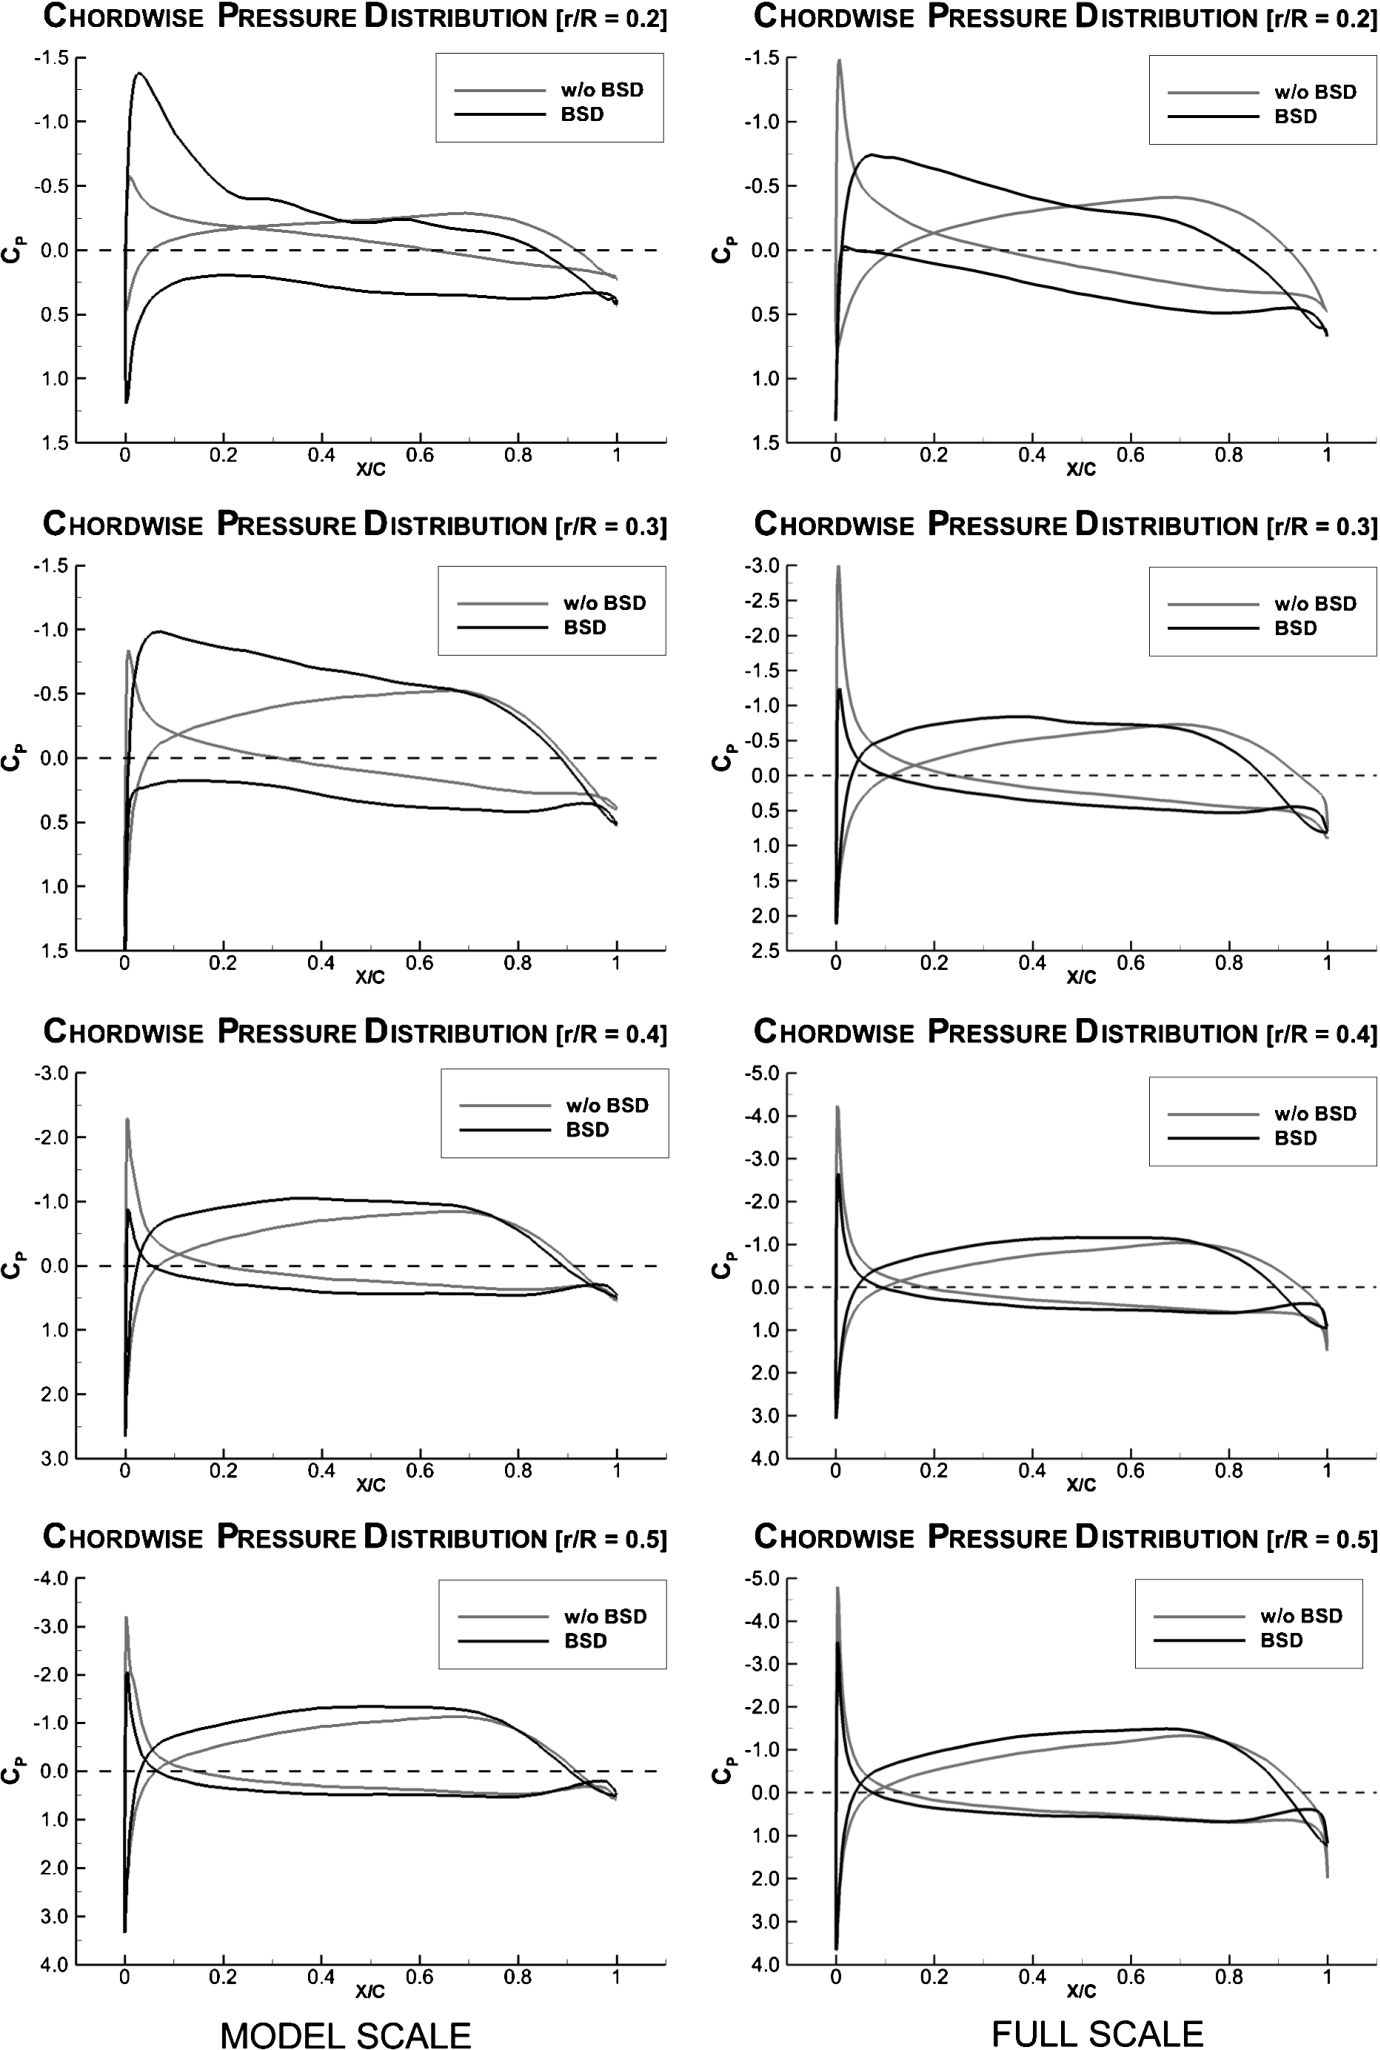
Comparison in CP for the blade in 90 for model scale (left) and full scale (right) for several radii.
The resulting slightly less efficient sections at full scale can be observed in Fig. 28. The difference between model and full scale disappears for the higher radii.
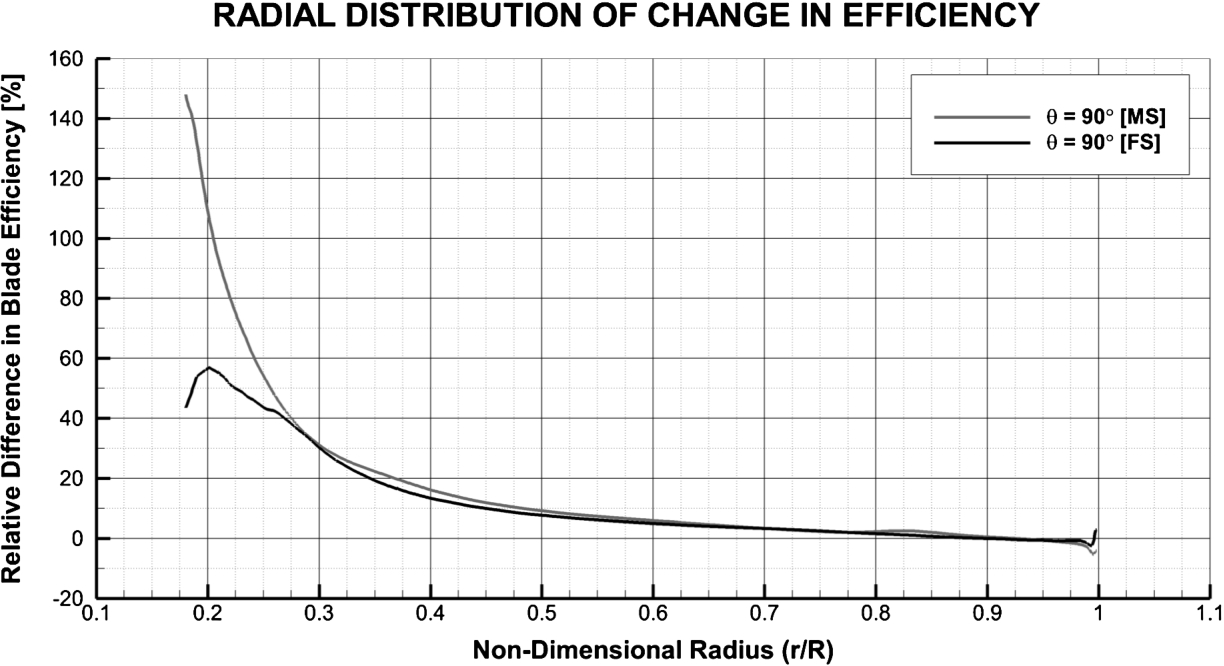
The radial distribution of change in blade efficiency for blade position
The gain in performance by the BSD at full scale is lower due to the decrease in interaction efficiency; the propeller needs to generate relatively more thrust with the BSD in comparison to model scale. Figure 29 highlights the differences in forces for both model and full scale.
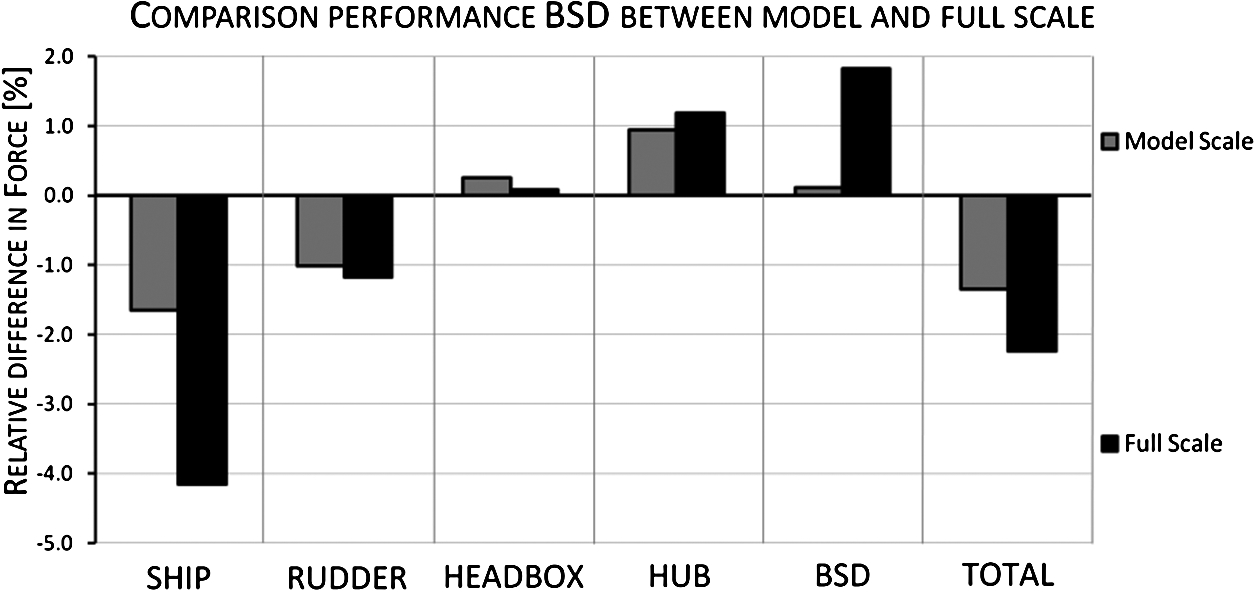
The relative difference in force with respect to the thrust without BSD for both model and full scale.
The most prominent differences occur in the changes in ship resistance and force acting on the BSD. As explained in Section 4.3.1, the force acting on the BSD and the change in ship resistance are strongly related to each other. A higher positive force acting on the BSD leads to a higher resistance force acting on the ship. The sum of the changes gives an increase of 0.8%.
Qualitatively speaking, this can be explained by the fact that the induced forces on the BSD and thus the induced resistance on the ship are not directly influenced by viscous effects. So on full scale, the contribution of the BSD would be relatively more. Furthermore, the higher velocities at the lower radii of the pre-stators result in a higher loading. This gives a lower pressure, which leads to an increase in pressure for the resistance, while a positive force for the BSD.
The positive hub effect, due to a change in hub vortex, is slightly larger. Unfortunately, this positive effect is counteracted by a small increase in rudder resistance.
The maritime industry has a rich history of Energy Saving Devices (ESDs). Although working principles were not always completely understood, the promise of significant energy saving convinced many ship owners to install such a device. In this paper, we have numerically demonstrated that the power demand of a ship can indeed be reduced by improving the propulsive performance with an ESD. An energy saving can be obtained by generating pre-swirl at the cost of only a small additional resistance.
The BSD, an ESD concept based on generating pre-swirl, is designed for the STREAMLINE Tanker with a resulting total computed reduction in power of 4.1% at model and 3.4% at full scale.
The principle of pre-swirl is that the angle of attack on a propeller blade section is increased. Not only will this result in the increase of the total force vector acting on the propeller blade, it will also be directed more in thrust direction. As a consequence, a significant higher thrust will be generated at identical rotation rate. For a fair comparison, the ship with BSD must be analysed at the self-propulsion point. One can modify the original propeller pitch or allow a reduction in propeller rotation rate. Both cases will result in a power saving, which could not be obtained by merely modifying the propeller. The aim of the design is to generate pre-swirl in such a way that the increase in required thrust at the self-propulsion point is minimal, as the increase in resistance due to the BSD can possibly diminish the obtained power saving.
Probably one of the reasons why it has been so difficult in the past to fully apprehend these ESDs, is that the traditional propulsive efficiency analysis is prone to misinterpretations of the physics. Using the insight obtained with CFD during this study regarding in the working principle, a more physically consistent efficiency analysis method is introduced in this paper.
The insight in the details of the flow also allows for a more rigorous study on scale effects. Due to the Reynolds effect on the propeller, the propeller performance increases between model and full scale. The increase in efficiency is mainly caused by the higher radii, because the angle of attack reduces at the lower radii due to the wake scale effect.
The increase in propeller performance due to the BSD is quite similar on model and on full scale. However, a small distinction should be made here. At full scale, the reduction in rotation rate is slightly higher, while the local blade efficiency is lower. Unfortunately, the interaction efficiency decreases at full scale, caused by a higher resistance penalty at full scale. As a result, the total power saving due to the BSD reduces by 0.6% due to the scale effects.
Although more case studies are needed to allow for a generic statement on scale effects, the general conclusion from this scale effect study is that a small reduction in performance due to scale effects is likely.
The main conclusion from this study is that it is possible to obtain a significant power reduction for a single screw vessel with a relative simple device, which cannot be acquired with a conventional propeller design. Furthermore, the equalizing effect on the loading distribution has a positive effect on cavitation behaviour, which is positive for reduced radiated noise as well as for on-board comfort.