
Abstract
Wind-assisted propulsion has recently attracted attention as one viable option to drastically reduce pollutant emissions produced by ships. Despite its potential, there is still a substantial lack of understanding of the physical aspects proper of wind-assisted ships, leading to unreliable fuel-saving claims. In the context of the development of a performance prediction program for such type of hybrid ships, the research presented herewith deals with the aerodynamic interaction between two rigid sails. Wind-tunnel experiments were carried out on a single sail and on a two-sail arrangement, during which force and pressure measurements were taken on each sail. For the two-sail arrangement, two gap distances between the sails were investigated and the tests were performed at apparent wind angles ranging all typical sailing conditions. The results show that for an extended interval of moderate apparent wind angles the aerodynamic interaction has a positive effect on both sails. On the contrary, at smaller and at larger angles the interaction effects are detrimental for the downstream sail. The outcome of the present work indicates that the number of sails employed and their gap distance are important parameters to determine the aerodynamic interaction effects.
Introduction
In recent years, wind energy as an auxiliary form of propulsion for commercial ships has regained momentum to respond to volatile fuel prices and to comply with the increasingly stringent environmental regulations as reported in a recent study published by the Lloyd’s Register [1] in 2015. Nevertheless, the same research emphasizes how a reliable performance prediction, i.e. how much fuel can be expected to be saved given a certain weather condition, is one of the key prerequisites necessary for the further development and for the uptake of this promising technology.
The soundness of the performance prediction of a wind-assisted ship lies in the fact that all the complex effects caused by the aerodynamic force acting on the ship are considered. Such effects comprise the sailing behaviour of the ship (e.g. sailing at a constant heel and leeway angle) as well as the fact that the engine and the propeller are operated in a lightly loaded, off-design, condition. From an aerodynamic perspective, one of the main challenges is to accurately estimate the amount of thrust that can be generated considering the effects caused by the interaction of the several wind-propulsion systems (sails, wing sails, Flettner rotors, etc.) that might be installed on the ship. While in any Velocity Prediction Program (VPP) for sailing yachts the sail interaction effects are taken into account, in the performance prediction of wind-assisted ships, assumptions are generally made to simplify or neglect altogether any effect of the aerodynamic interference occurring between the installed wind-propulsion systems [2–7]. Arguably, the main reason to be so is that, differently from sailing yachts, for which within a certain yacht category (e.g. a sloop) different yachts have a similar sail plan (one single mast with a mainsail and a headsail), the wind-propulsion systems that could be installed onboard of commercial ships might vary considerably in terms of type (e.g. sails versus Flettner rotors), in terms of quantity and in terms of their relative distance and position on the deck. All these degrees of freedom make it necessary to study each case by means of dedicated wind-tunnel experiments or CFD simulations.
The concept of wind assistance for commercial ships is not new. In fact, already in the 1980’s, in order to take action against the high fuel prices of that time, several studies on different wind-assist devices were conducted. Among the numerous studies on the topic published in that time, arguably, the most relevant to the present work are the publications of Bradbury [8] and Ingham and Terslov [9]. Bradbury carried out a two-dimensional analysis using potential flow as well as wind-tunnel experiments on a ship with a rig composed of eight identical NACA 0018 wings. During the experimental campaign, only the total forces acting on the ship and on the rig were measured. The author concluded that a graduated sail trim gave considerably better performance than a parallel one. On the other hand, Ingham and Terslov conducted a wind-tunnel campaign on a bulk carrier equipped with six wing sails. Once again just the total forces acting on the ship and on the rig were measured and no details about the performance of each wing sail were given.
The first thorough analysis of the physics behind the aerodynamic interaction effects of sails is attributable to Boeing engineer Arvel Gentry. He was the first one to analyse by means of CFD tools the effects of the interaction between the jib and the mainsail of a sailing yacht. In [10,11] the yacht under consideration had an overlapping jib (the jib leech was laying at half chord length of the mainsail) and the boat was considered to be sailing closed hauled (the sails were set at a small angle of attack) so that flow separation could be neglected. In such condition, it was proven that there is a beneficial interaction between the two sails, i.e. the two sails together are more aerodynamically efficient than the sum of the two single sails. More precisely, the mainsail generates an upwash on the jib causing its stagnation point to be shifted windward, thus the boat needs to be sailed closer to the wind to prevent the jib to stall. The trailing edge of the overlapping jib (leech) is in a high flow speed region, meaning that the Kutta condition needs to be fulfilled at a higher speed and this increases the efficiency of the whole sail. From the mainsail perspective, the downwash generated by the jib causes the peak suction velocities on the lee side of the main to be strongly reduced. The reduced pressure gradient allows the mainsail to be operated at higher angles of attack without stalling.
In [12], a third sail was introduced, i.e. a staysail between the jib and the mainsail, and the yacht was again sailing in such a way that the sails were set at a small angle of attack so that separation could be ignored. The most relevant result about the aerodynamic behaviour of a three-sail arrangement is that whether there is a positive or negative interaction strongly depends on the relative position of the sails and their trim. The author points out how in case the sails were wrongly trimmed the advantage of adding extra sail area would be wasted by the efficiency loss of the whole sail plan. On the contrary, if the sails are properly positioned and trimmed, a so-called bootstrap effect may occur: the mainsail increases the efficiency of the staysail that, in turn, it increases the efficiency of the jib. Gentry underlines how, theoretically, the bootstrap effect could occur also when a much larger number of sails is used. Still in the context of sailing yacht aerodynamics, it should be mentioned the work of Chapin et al. [13]. The work deals with the optimization of a double-rig in terms of sail camber and sail trim angle by means of CFD RANS. Similarly to the results of Gentry, the outcome of this study underlines the importance of a proper sail setting in order to take advantage of the interaction effects.
Another field of research that deals with the aerodynamic interaction of sails is that one of competitive sailing for which it is important to understand how two yachts interfere with each other during a match race. In this case, the mainsail and the jib of each yacht are considered as one large sail and the interference (change in driving force) generated by each boat on the other is studied in terms of change in velocity field (wind angle and wind speed). Typically, the velocity field around the flow-perturbing boat is calculated with a CFD software [14,15] or measured with wind-tunnel experiments [16] at several positions. Once again, the boats were assumed to be sailing close-hauled so that separation could be neglected. Using the computed (or measured) change in wind angle and wind speed, it is possible to calculate the change in driving force the second boat would experience at all considered positions in space. The assumptions behind the application of this procedure are that the boat affected by the perturbation does not respond (adjust its sails) to compensate to the change in velocity field and that there is no mutual and simultaneous interaction between the two boats. These assumptions limit the applicability of this type of analysis to the study of interaction effects occurring between sails installed on a same ship.
In the context of wind-assisted propulsion for commercial ships, the first relevant study that tackled the aerodynamic interaction between several sails is the work presented by Fujiwara et al. in [17]. In this research, the performance of a single soft sail, expressed in terms of driving force coefficient, is compared to the performance of a sail plan composed of four equal sails. The sails tested had a rectangular or a triangular shape and, for each sail shape, two different arrangements were used: a) the four sails were aligned along the centreline of the ship and they were all trimmed with the same angle of attack, b) the four sails had a goose-winged arrangement (they were zig-zag shifted about the centreline) and each sail was trimmed independently during the wind-tunnel experiments in order to increase the driving force of the whole sail plan. The tests were carried out at apparent wind angles ranging from 20° (sailing upwind) to 180° (sailing downwind) and the forces were measured on each sail and compared to the results of the single-sail experiment. The results show how, in general, the aerodynamic interaction occurring between the four sails has a negative effect on the efficiency of the sails. This is particularly so for large apparent wind angles (150°–180°) at which the downstream sails are in the wake of the upstream ones, the former experiencing a reduced wind speed. The goose-winged arrangement, on the other hand, largely reduces this negative effect. Regarding the tests conducted at smaller apparent wind angles (20°–90°), whether the effects of the aerodynamic interaction are positive or negative, it depends on the position of the sail under consideration relative to the others and on whether the sails are all trimmed equally or independently with the aim of increasing the driving force. For both cases, only the most upstream sail (the first one from the bow) experiences an increase in driving force compared to the single sail. Conversely, the performance of the other sails is decreased, and this effect is stronger moving towards the most downstream sail (the last one from the bow). Trimming each sail independently has an overall positive effect: the increase in driving force experienced by the first sail is enhanced and the decrease in performance of the remaining sails is reduced. Another interesting output of the research is that the multiple-sail bootstrap effect as suggested by Gentry did not occur for any sail arrangement tested in [17].
More recently, the research inspired by the University of Tokyo “Wind Challenger” project [18,19] gave more insights into the interaction effects occurring between two or more wing sails. In the work of Nakashima et al. [20] and Li et al. [21], the authors studied by means of wind-tunnel experiments as well as by means of CFD simulations the performance of a cascade of wing sails. In [20], the sail under consideration was a wing sail 50 m in span, 20 m in chord length and its wing section was a NACA 0021 profile. The rig was composed of three of such sails set 23.6 m apart from one another. Wind-tunnel experiments were carried out on a 1:100 scale model and the forces were measured on each sail. The apparent wind angles tested varied between 30° and 150° and the angles of attack of the three wing sails were kept constant for all conditions at AoA = 15°. In these conditions, the authors found that the upstream wing sail increased its lift compared to the single wing sail up to AWA = 60°, whereas the second and third sails decreased their performance due to the aerodynamic interaction. For larger apparent wind angles, all sails showed a lower lift coefficient compared to the single sail. To understand the effect of the trim angle on the performance of each sail, the authors also tested two wing sails set at different angles of attack. Interesting to mention is the case in which the apparent wind angle was AWA = 30° and the sails were set at AoA = 15° (upstream sail) and AoA = 20° (downstream sail). In this condition, both sails showed an increase in lift compared to the single sail set respectively at the same angle of attack. Unfortunately, no results were reported about the change in drag. In [21], the sail design was improved to a wing sail with a foldable flap named “Variable-Camber Sail”. Once again, three identical sails were tested, this time at three different distances between them, namely 1, 1.5 and 2 chord lengths. The apparent wind angles tested ranged from 30° to 150° and the angle of attack of each sail was first set the same and then set in order to maximize the driving force coefficient
The works of Jo et al. [22] and Lee et al. [23] are also related to the sail cascade concept proposed in the “Wind Challenger” project. In these studies, the authors made use of a CFD code connected to a genetic algorithm to optimize the angle of attack, the flap length and the flap deflection angle of three identical wing sails set 1.5 chord lengths apart. As reference case the wing sails were all set at the same angle of attack and the results of the optimization referred to such condition. Compared to the reference case, the optimized wing sails were modified in order to increase their lift while preventing flow separation. For example, for AWA = 45°, the results of the optimization process show how the angle of attack, the flap length and flap deflection angle increases moving from the upstream sail to the downstream one. The optimization process does increase the thrust generated by the sail cascade compared to the reference case, but it is still worse than the single wing sail.
The output of the studies above summarized indicates that the aerodynamic interaction occurring between two or more sails might strongly affect the performance of the whole sail plan. Moreover, the same studies suggest that design parameters such as the number of sails and their gap distance and relative position, and operational parameters such as the apparent wind angle and the sail trim, play a fundamental role in the determination of the strength of the interaction effects and whether they have a positive or negative influence on the performance.
In the framework of the development of a performance prediction program for commercial wind-assisted ships, it was decided to carry out a series of wind-tunnel experiments on a single sail and on a two-sail arrangement. The work presented herewith deals with the aerodynamic interaction of two similar rigid sails exposed at apparent wind angles covering the typical range of sailing conditions of a ship (AWA = 20°–180°). For similar conditions, the force and the pressure measured on each sail of the two-sail arrangement were compared with the results of the single sail.
Sail design and experimental method
The sail type chosen for the experiments is a square sail mounted on a self-standing mast with horizontal yards often referred to as Dynarig or, less commonly, Prolls rig (Fig. 1). The reason for choosing this type of sail is that it has become one popular option for wind-assisted ship propulsion due to its ease of operation. In fact, differently from soft sails typically employed on sailing yachts, the Dynarig allows for only one trimming option, that is the rotation about its vertical axis in order to change its angle of attack with respect to the wind.

Sail model used during the experiments.
The span of the chosen sail was 1.3 m, its chord length was 0.7 m (leading to an aspect ratio of 1.85) and its camber was 10%. The total height of the sail, including the mast, was 1.5 m. The sails were manufactured using carbon fibre sandwich, making it a rigid construction. Although full-scale Dynarigs are made of soft sails, the sails are constrained to the yards in such a way that deformations in terms of sail camber are minimized. Under high loads, other deformations like mast bending and torsion might occur, but otherwise, the carbon-fibre model and a full-scale Dynarig can be considered to behave similarly.
Within the two outer carbon fibre skins, in the core of the sail, 128 pressure taps were located (Fig. 2). Each pressure tap had two holes, one on each side of the sail, allowing to measure the pressure at the extrados and at the intrados simultaneously. Due to the presence of the inner pressure taps, the thickness of the sail reached 10 mm. Although its edges were smoothed to compensate as much as possible its oversized dimension, it is conceivable that it had a negative effect on the performance of the single sail compared to soft-sail Dynarigs. More specifically, it is likely that for small angles of attack the larger thickness of the sail might cause leading edge separation to occur and that would reduce the suction area on the extrados of the sail. This issue was not further analysed since the present research focuses on sail interaction rather than on the performance of the single sail.

Assembly of the pressure taps in the sail.
The pressure taps were divided into eight rows, i.e. sixteen taps per row, and they were more densely distributed at the leading and at the trailing edge as well as at the top and at the bottom of the sail (see Fig. 2). The diameter of the mast was oversized to allow to accommodate all the pressure-tap tubes in its interior.
Considering the scarcity of published results on the topic of sail interaction on board of wind-assisted ships, it was decided to carry out wind-tunnel experiments keeping the number of sails to the minimum (two sails) and to investigate the influence of only one design parameter on the results. The design parameter that was deemed more interesting to be studied was the sail gap distance, that is the horizontal distance between the two sail masts’ vertical axis (Fig. 3). The single-sail experiments, used as the reference for the two-sail tests, included the test of the single Dynarig at angles of attack ranging from 0° to 90°. Conversely, in the two-sail experiments, the Dynarigs were aligned on a table that mimicked the ship’s deck and they were trimmed independently to maximize the driving force of the whole sail plan. This procedure was repeated for apparent wind angles varying between 20° to 180° and for two different gap distances between the sails.

Definition of gap distance between two sails.
During the single-sail experiments, the velocity field near the Dynarig was sampled by using four Cobra probes mounted on a vertical bar connected to a toothed belt that, by activating an electric motor, could laterally move the probes to a maximum of ±1.5 m from the centre of the Dynarig. The probes were positioned at 250 mm, 650 mm, 1050 mm and 1450 mm above the ground. Tests were carried out for three angles of attack, AoA = 5°, 45°, 90°, and for three distances, namely 1.5, 2.5 and 4 chord lengths downstream the sail. The results of such tests, reported in [24] and no further discussed in this article, were aiming at understanding the magnitude of the wake and of the upwash and downwash generated by the Dynarig. The study of the velocity field for the cases above mentioned, could not be directly used for the analysis of the results of the present work since it only covered a limited number of conditions. Nonetheless, it did provide support for the reasoning on which the conclusions of the present work were derived.
The experiments were carried out in the boundary-layer test section of the Polytechnic University of Milan wind tunnel. The test section is 13.84 m wide and 3.84 m high (Fig. 4) and the maximum reachable wind speed is 16 m/s.

Wind tunnel boundary layer test section.
The test section has a large turn table of 13 m diameter that can be manually adjusted to change the angle of incidence of the tested model. For the single-sail experiments, the Dynarig was positioned in the middle of the turn table and it was mounted on a balance fixed to a platform laying below the wind-tunnel floor in such a way that the total height of the sail from the floor was 1.5 m (Fig. 5). Rigid aluminium foils were used to cover the hole in the floor to prevent air leakage (see Fig. 1).

Single sail mounted on the force balance.

Two-sail arrangement used during the experiments.
For the two-sail experiments, a different setup was adopted. The two sails were mounted on a table that was positioned in the centre of the wind-tunnel turn table (Fig. 6). Each sail was mounted on an independent balance that was connected to an electric engine that was remotely controlled to rotate each sail around its vertical axis (Fig. 7). Similarly to the single-sail setup, also in this case the sails were mounted in such a manner that the total height of the sails from the table was 1.5 m.

Electric engine connected to the balance and to the Dynarig.
The balance used throughout the experiments was a RUAG 192 whose design loads are: Fx = 1500 N, Fy = 1000 N, Fz = 5000 N, Mx = 500 Nm, My = 1000 Nm and Mz = 600 Nm. In both the single-sail and the two-sail experiments the X axis of the balance was aligned with the sail’s chord while the Y axis was perpendicular to it. The Z axis of the balance was positive pointing upwards.
All the experiments were carried out at a nominal wind speed of 10 m/s, however, during the single-sail experiments, two different wind speeds (6 m/s and 12 m/s) were also tested to check the influence of the Reynolds number on the lift and drag forces generated by the sail. This procedure was repeated for angles of attack AoA = 5°, AoA = 45° and AoA = 90°. The three chosen wind speeds correspond to Reynolds numbers
The declared boundary-layer height of the wind tunnel is 0.2 m and the turbulence intensity index is IU = 2%. Before the beginning of the experiments, however, four Cobra probes were placed in the centre of the wind-tunnel turn table in order to check these quantities. The probes were mounted on a vertical support as described in Section 2. The difference in mean longitudinal velocity Ux between the lowest (250 mm) and uppermost (1450 mm) probe was found to be 7% whereas the difference between the uppermost probe with respect to the second (650 mm) and third (1050 mm) probe from the ground was 1% and 3% respectively. This indicates that the measured wind-tunnel boundary-layer height was slightly larger than the declared one, but nonetheless comparable to the height of the mast of the single Dynarig measured from the wind-tunnel floor to the bottom of sail planform (0.2 m). It can be concluded that during the single-sail and the two-sail experiments the Dynarigs were tested in a comparable wind profile. Furthermore, the values of turbulence intensity measured by the four probes were: IU = 1.99% (at 250 mm), IU = 1.55% (at 650 mm), IU = 1.23% (at 1050 mm) and IU = 1.19% (at 1450 mm). This leads to an averaged turbulence intensity index IU = 1.49%, that is slightly lower than the declared one.
Given the Dynarig sail area (0.91 m2) and the wind tunnel cross-section area (53.14 m2), the blockage ratio was 1.71% for the single-sail tests and 3.42% for the two-sail tests. For both cases, the blockage ratio was deemed small enough not to adopt any correction factor.
The experiments of the single Dynarig began starting with angle of attack AoA = 0° and after every run, the angle of attack of the sail was increased by manually turning the wind-tunnel turn table. During this operation, the wind was switched off. Before and after every run, zero measurements (wind switched off) were taken. The two zero-measurements were then averaged and subtracted from the measurements taken during each corresponding run.
For each angle of attack, the forces and the pressures on the sail were recorded during 60 seconds at a sampling frequency of 500 Hz, leading to 30000 samplings per run. The air temperature and the air density were constantly recorded during the experiments. The wind speed was measured by two different Pitot tubes, one fixed to the wind-tunnel ceiling (see Fig. 4) and one positioned in front of the turn table (see Fig. 6). The Pitot tubes had a vertical distance of 1.0 m and 1.2 m from the ground and from the ceiling respectively. The wind speed used to calculate the force and pressure coefficients was the average of these two measurements. The single Dynarig was tested at the following angles of attack: AoA = 0°, 2.5°, 5°, 7.5°, 10°, 12.5°, 15°, 17.5°, 20°, 22.5°, 25°, 30°, 35°, 40°, 45°, 50°, 60°, 70°, 80°, 90°.
For the two-sail experiments a different procedure was used. First, the wind-tunnel turn table was rotated to the desired angle of incidence that, in fact, corresponds to the apparent wind angle the ship would sail at. For each apparent wind angle the sails were remotely trimmed via a computer connected to the electric engines used to rotate the balances and the sails bolted on top of them. The computer was placed in the control room outside the wind tunnel and it displayed in real time the nominal angle of attack, the lift and drag forces and the driving and heeling forces of each sail. After having switched the wind on, the upstream sail was trimmed to maximize its driving force and subsequently the same was done with the downstream sail. Before taking the measurement, the trim of both sails was carefully perfectioned to check whether the driving force of the whole sail plan could be further increased. A wool tell-tale placed at half span at the trailing edge of each Dynarig helped during the trimming process of the sails. Once the sails were deemed properly trimmed, the forces and the pressures on each Dynarig were measured in the same manner used for the single-sail tests. The two-sail arrangement was tested at the following apparent wind angles: AWA = 20°, 30°, 35°, 45°, 60°, 75°, 90°, 105°, 120°, 135°, 150°, 165°, 180°. For each apparent wind angle the experiments were carried out at two different gap distances between the sails, namely 2.5 chord lengths (i.e. 1.75 m) and 4 chord lengths (i.e. 2.8 m).
Scale effects on single-sail performance
The study of the influence of the Reynolds number on the lift and on the drag coefficients of the single Dynarig is reported in Fig. 8. The Reynolds number was decreased by 40% and increased by 20% respect to the reference Reynolds number (

Influence of Reynolds number on single sail lift and drag.
The forces measured during the experiments had to be transformed from the balance reference system into lift and drag and successively into driving and heeling force. To do so, the nominal angle of attack, i.e. the angle of attack of the sail with respect to the undisturbed flow, had to be derived from the apparent wind angle, that is the angular position of the turn table with respect to the wind direction, and the brace angle, that is the angular position recorded by the electric engines and it is the angle of the sail chord with respect to the central axis of the “ship” (Fig. 9). The actual angle of attack of the sails, i.e. the angle of attack considering the effects of upwash and downwash on the local velocity field, is unknown.

Apparent wind angle (AWA), brace angle (BA) and nominal angle of attack (AoA).
Let
The driving force (Df) was considered to be aligned with the central axis of the fictitious ship and positive pointing towards its bow. The heeling force (Hf) was perpendicular to the central axis of such ship and positive pointing towards its starboard (Fig. 10). The forces were then transformed into non-dimensional coefficients according to:
The wind speed used to calculate the non-dimensional coefficients was the averaged wind speed measured by the ground Pitot tube and by the ceiling Pitot tube during each run. On average, the wind speed measured by ground Pitot tube was 1% higher than the wind speed measured by the Pitot tube fixed to the wind-tunnel ceiling and the lowest and highest wind speeds measured during the whole experimental campaign were 10.00 m/s (ground Pitot tube) and 10.16 m/s (ceiling Pitot tube) respectively. Likewise, the air density ρ measured during each test was used for the calculations.

Lift and drag, driving and heeling force.

Nominal angles of attack, gap distance 2.5.
The results of the nominal angles of attack for all considered apparent wind angles and for gap distances 2.5 and 4 chord lengths are reported in Fig. 11 and Fig. 12 respectively. For the same gap distance, the results show how, in general, the sails were set at different angles of attack. More precisely, up to AWA = 120°, the stern sail (Dynarig at the stern of the fictitious ship) is trimmed at larger angles of attack to compensate the effects of the downwash (reduction in apparent wind angle) generated by the bow sail (Dynarig at the bow of the fictitious ship). This trend, clearly visible for gap distance 2.5, it becomes less noticeable when the gap distance between the sails is increased to 4 chord lengths. This indicates that the effect of the downwash becomes less pronounced with the increase of the separation between the sails. For both gap distances analysed, the bow and the stern sails are trimmed at moderate angles of attack up to AWA = 120°. This means that up to such apparent wind angle the flow on the sails is predominantly attached and that most of the driving force is generated by the lift. From AWA = 135°, the angle of attack of both sails rapidly increases and at AWA = 180° it reaches the value of AoA = 90°; the ship is sailing fully downwind and the sails are set perpendicular to the wind direction. For this range of apparent wind angles, flow separation plays a fundamental role and the driving force is generated almost exclusively by the drag.
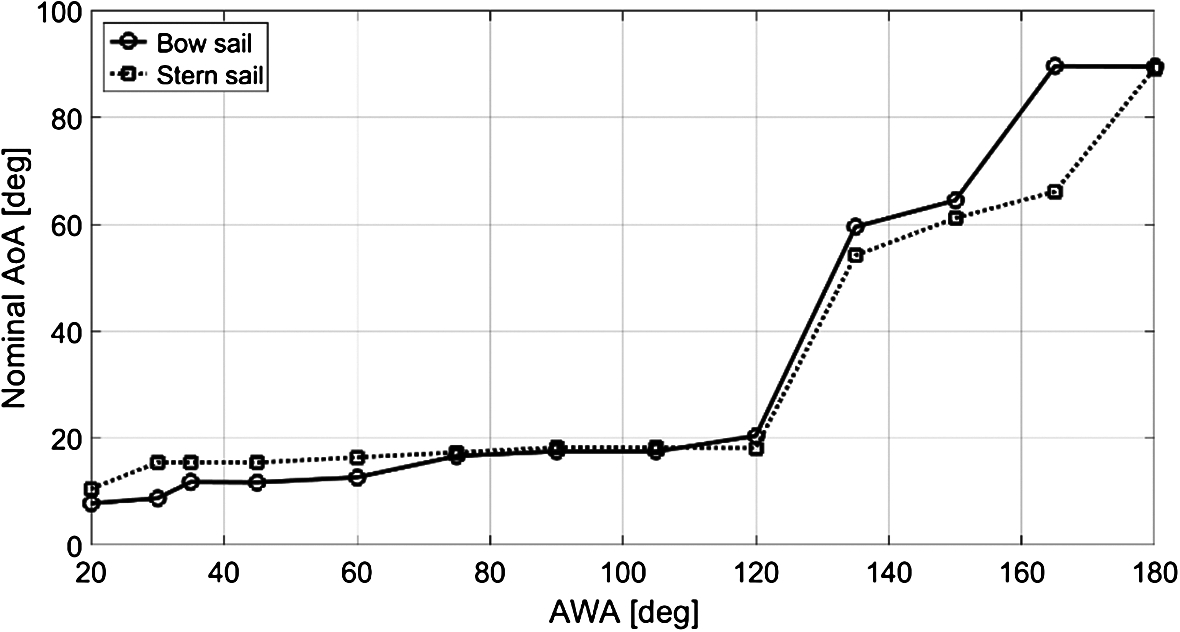
Nominal angles of attack, gap distance 4.
The results obtained during the two-sail experiments were compared with the results of the single-sail tests in terms of lift and drag and in terms of driving force and heeling force, generated at the same nominal angle of attack. The nominal angles of attack given in Fig. 11 and Fig. 12 were used to linearly interpolate the results of the single-sail tests in order to derive the values of lift and drag corresponding to the desired angles. The driving and heeling force were then calculated according to Eqs (3) and (4). Using this procedure, a fair comparison between the results of the single-sail experiments and the results of the two-sail experiments could be achieved.

Lift: Double VS Single sail – gap distance 2.5.

Drag: Double VS Single sail – gap distance 2.5.
In Fig. 13 and Fig. 14 the lift and drag coefficients of the single-sail and of the two-sail experiments, obtained during the tests with gap distance of 2.5 chord lengths, are given. In general, there is a considerable difference between the coefficients of the two-sail arrangement compared to their single-sail counterparts. More precisely the following differences are identified.
For AWA = 20°,
In the range 35° < AWA < 120°, the two sails are no longer in each other’s wake, they only experience the upwash and the downwash generated by the stern sail and by the bow sail respectively. This change (increase and decrease) in angle of incidence has a positive effect on both sails: the lift is increased with respect to the single Dynarig. In turn, the lift increase also produces a raise in lift-induced drag (see Fig. 14).
For 135° < AWA < 180°, it is more difficult to identify a clear trend, although it appears that the drag generated by the stern sail, that for this range of apparent wind angles is the upstream sail, is moderately increased.
At AWA = 180°, both sails are set at AoA = 90°, i.e. they are perpendicular to the wind direction to maximize their drag. In this situation, the flow separates and recirculates, and this causes the bow Dynarig (that for this AWA is the downstream sail) to generate a negative drag force (Fig. 14).
Driving force: Double VS Single sail – gap distance 2.5.

Driving force: % change Double VS Single sail – gap distance 2.5.
The effects caused by the aerodynamic interaction on the lift and on the drag generated by the two sails also affect their driving and heeling forces. Apart for the very small (20° and 30°) and very large (180°) apparent wind angles, at which the downstream sail is penalized for being in the wake of the upstream one, for all the other angles, both sails show an increase in driving force due to the positive effect of their aerodynamic interaction (Fig. 15). As reported in Fig. 16, for apparent wind angles between AWA = 20° and AWA = 75°, the bow Dynarig increased its driving force up to 40% and in the range 90° < AWA < 120°, the sails show a similar increase of about 15–20%. For larger angles, the increase is further attenuated or, in some cases (bow Dynarig, 135° < AWA < 165°), there is practically no difference between the two-sail and the single-sail results. Regarding the heeling force, in the range of apparent wind angles in which it plays a significant role for the sailing behaviour of a ship (20° < AWA ≈ 90°), the aerodynamic interaction between the two sails has the effect of increasing

Heeling force: Double VS Single sail – gap distance 2.5.

Lift: Double VS Single sail – gap distance 4.

Drag: Double VS Single sail – gap distance 4.

Driving force: Double VS Single sail – gap distance 4.
In Fig. 18 and Fig. 19 the results of the lift and drag coefficients of the larger gap distance are presented. In general, the results follow the same trend outlined for the shorter gap distance, nevertheless a few differences should be mentioned.
In the range 75° < AWA < 105°, there is practically no difference between the lift coefficients of the stern and of the bow sail. The same holds true for the drag coefficients. However, the coefficients of the two-sail arrangement are greater than their single-sail counterparts. This result indicates that both sails are affected by the aerodynamic interaction to a similar extent.
At AWA = 180°, due to the greater gap distance, the effects of flow separation and recirculation are strongly reduced. The bow sail is able to generate a positive drag force although it is still considerably lower than the force produced by the stern sail.
The differences above presented also reflect in the driving force and heeling force coefficients. The results reported in Fig. 20 and Fig. 21 show how for apparent wind angles varying from 75° to 105° there is practically no difference in

Heeling force: Double VS Single sail – gap distance 4.

Driving force: % change Double VS Single sail – gap distance 4.
During the experiments, pressure measurements were taken along with the force measurements discussed in the previous section. The pressure was measured at the intrados and at the extrados of the sails at the positions indicated in Fig. 23. For the sake of conciseness, only the results of the pressure taps of row 5 (see Fig. 23) are herewith discussed. The sixteen pressure taps of row 5 were located about 120 mm below half sail span and, apart from the rows at the upper and lower edges of the sail that were influenced by the tip vortices, the pressure distribution at the selected row could be deemed representative of most of the sail planform.

Distribution of pressure taps on the Dynarig.
The pressure distribution over the single sail and over the two sails of the double-Dynarig arrangement was compared in terms of pressure coefficient defined as:
The results of
Pressure distribution comparison: cases analyzed

Pressure distribution – AWA = 45°, gap distance 2.5. Bow sail.
The results given in Fig. 24 to Fig. 29 show the beneficial effects of the aerodynamic interaction on the bow and on the stern Dynarig for a variety of apparent wind angles and for both the considered gap distances. The most significant result is the suction increase, i.e. a lower

Pressure distribution – AWA = 120°, gap distance 2.5. Bow sail.

Pressure distribution – AWA = 60°, gap distance 4. Bow sail.

Pressure distribution – AWA = 45°, gap distance 2.5. Stern sail.

Pressure distribution – AWA = 75°, gap distance 2.5. Stern sail.

Pressure distribution – AWA = 120°, gap distance 2.5. Stern sail.
About the pressure distribution on the intrados, the abrupt pressure drop around x/c = 0.5, that occurs for all cases reported in Fig. 24 to Fig. 29, is caused by the shielding effect of the sail mast on the nearby pressure taps. Moreover, up to an apparent wind angle of 120°, it seems that the difference between the single-sail and the two-sail results is much less pronounced compared to the differences measured at the extrados. At AWA = 180°, the flow separation and the wake generated by the upstream sail causes the downstream sail to have a dramatic pressure decrease at its intrados (Fig. 30). On the other hand, for the same apparent wind angle, the upstream sail (the stern Dynarig in this case) is practically unaffected by the interaction effects (see Fig. 31). Another situation in which the interaction effects are detrimental for the downstream sail occurs at AWA = 20°. For this apparent wind angle, the downstream sail is adversely affected by the (small) wake and by the disadvantageous downwash generated by the bow Dynarig. This can be seen in Fig. 32 looking at the pressure distribution near the leading edge of the sail.

Pressure distribution – AWA = 180°, gap distance 4. Bow sail.

Pressure distribution – AWA = 180°, gap distance 4. Stern sail.

Pressure distribution – AWA = 20°, gap distance 4. Stern sail.
In Section 4.2 and Section 4.3 the bow and the stern Dynarig of the two-sail arrangement were compared to the single Dynarig to investigate the performance difference when the sails were set at the same nominal angle of attack. In the present section, the focus is on the performance difference between a ship with two Dynarigs and a ship with one Dynarig expressed in terms of driving force and heeling force coefficients. To do so, the single sail had to be trimmed to maximize
In Fig. 33 and Fig. 34 the nominal angles of attack of the sails of the single-Dynarig ship and of the double-Dynarig ship are presented for gap distance 2.5 and 4 chord lengths respectively. For the shorter distance (Fig. 33), it can be seen that, for 30° < AWA < 105°, the nominal angle of attack of the single Dynarig lays in between those of the bow and of the stern sail of the ship with two Dynarigs. When the gap distance is increased to 4 chord lengths, this trend becomes less visible and, for 75° < AWA < 105°, there is practically no difference between the compared nominal angles of attack (see Fig. 34). The results here presented agree with the reasoning on the effects of upwash and downwash on the sail angles of attack elaborated in Section 4.2.

Double VS Single Dynarig – nominal AOAs, gap distance 2.5.

Double VS Single Dynarig – nominal AOAs, gap distance 4.
The comparison of the driving force coefficient

Driving force: double Dynarig VS single Dynarig ship.

Heeling force: double Dynarig VS single Dynarig ship.
In this section, the discussion about the performance of the ship with one Dynarig and of the ship with two Dynarigs was based on the driving force coefficient that each rig was able to achieve in the wind conditions considered. Nonetheless, it should be mentioned that to conclude on which solution is the best in terms of ship performance, the side force and its effects on the sailing behaviour of the ship (e.g. leeway angle and heel angle) should also be taken into account. For this purpose, a thorough balance of all the aero/hydrodynamic forces acting on the ship should be evaluated.
During the experimental campaign it was possible to a carry out a limited number of test repetitions in order to check the precision of the measurement setup. The only case considered was the single Dynarig set at AoA = 20° (that is the stall angle). For this condition, three repeated tests were conducted at the same nominal wind speed of 10 m/s and before each measurement the angle of attack of the sail was set anew by turning the wind-tunnel turn table. Due to a measurement problem, unfortunately, only the pressures relative to one of the three experiments were recorded, whereas the forces were measured for all repetitions.
To increase the population of the uncertainty analysis, it was decided to include the results relative to the study of the Reynolds number effects on the single Dynarig performance. This is justifiable since it was proven that for a given angle of attack, the influence of the Reynolds number on the sail aerodynamic coefficients is marginal. The experimental uncertainty was determined according to the ISO Guide to the Expression of Uncertainty in Measurements [25]. In Table 2 the data set used to the estimate the precision of the measurement setup is given.
Measurement uncertainty data set
Measurement uncertainty data set
The pooled variance of the data set is calculated according to:
The standard uncertainty
Regarding the bias errors of the measurement instruments, as per specification, the accuracy of the RUAG 192 force balance is
Moreover, the standard uncertainties of
Finally, the expanded uncertainty with 95% confidence level is calculated as:
The results of the measurement uncertainty analysis are reported in Table 3, and they should be assumed to hold true for both the single-Dynarig as well as for the two-Dynarig experiments.
Measurement uncertainties with 95% confidence level
The effects of the aerodynamic interaction occurring between two rigid sails were analysed by comparing the performance of a two-sail arrangement and of a single sail. The performance difference was investigated for two gap distances between the sails and for apparent wind angles covering all typical sailing conditions. Two different methods were used for the comparison: in one case, the aerodynamic coefficients of the single sail were obtained at the same nominal angles of attack at which the two Dynarigs were trimmed during the experiments to maximise their driving force. In the other case, also the single sail was trimmed for maximum driving force, leading to a performance comparison between two fictitious ships with one and with two Dynarigs. Regardless the method applied, for a large interval of apparent wind angles, both the bow and the stern sail of the two-Dynarig arrangement benefited from their aerodynamic interaction in terms of driving force. This finding, validated with force and pressure measurements taken on each sail, is in agreement with the results relative to the interaction of two wing sails reported by Nakashima et al. in [20]. On the other hand, the side force generated by the two-sail arrangement also appears to be larger than the single sail. Arguably this could be detrimental for the overall performance of the ship during upwind sailing. Considering the outcome of the current research and the results of previous works, it can be concluded that the strength of the aerodynamic interaction effects, and whether they have a positive or negative impact on the sail performance, it is considerably influenced by the number of sails employed and by their gap distance.
Footnotes
Acknowledgements
This research is part of the Sail Assist project and it is supported by: Sea Axe Fund, Fatherland Fund, MARIN and Dykstra Naval Architects. The author would like to thank the project partners for their kind support.