
Abstract
The linear relationship between the pressure and the relative wave elevation on the hull surface is a prominent factor to be reconsidered in relation to the uncertainty of the added resistance. An evaluation method is proposed to access the nonlinear relationship between the hull pressure and the relative wave elevation, which has a decisive influence on the added resistance evaluation. This method is used to experimentally investigate the effect of bow-wave breaking of the fast displacement ship in waves. The results show that the nonlinearity between relative wave elevation and hull surface pressure due to the plunging breaking of a bow wave is intuitively detected using the proposed analytical tool. The effect of bow-wave breaking is deduced by comparing the integral of the local pressure. This study provides important insight into the nonlinear relationship between relative wave elevation and added resistance. In addition, the findings provide a better understanding of the process of plunging breaking of bow waves. The procedure of plunging type of bow-wave breaking is defined in three stages considering the relationship between pressure and wave height: bow-wave developing stage, pile-up and breaking stage, and bow-wave absent stage.
Introduction
The publication of the Energy Efficiency Design Index (EEDI) by the International Maritime Organization (IMO) has recently stimulated the accurate assessment of actual sea performance of ships, which is evaluated as added resistance in waves [7]. However, a satisfactory consensus on the evaluation method has not yet been reached owing to uncertainty in wave added resistance. This uncertainty can be improved by developing analytical methods that recognize nonlinearities. A typical factor contributing to the uncertainty of added resistance is the breaking of the bow wave.
The hydrodynamic interaction between the hull and the incoming wave is complex. Thus far, the model test has been regarded as the most reliable method for evaluating added resistance. The biggest advantage of the model test is that realistic modeling can adequately simulate significant physical phenomena. Alternatively, a comparative solution in computational fluid dynamics can be obtained using a solver based on the Reynolds-averaged Navier-Stokes (RANS) equation, which includes the viscosity of the fluid and the nonlinear free-surface effect [6,13].
Nevertheless, neither method is cost-effective in the preliminary design stage. Model tests require much care in preparation and data measurement, and the RANS technique is time-consuming to generate proper grids to capture the detailed phenomena and perform the calculations. Therefore, a more suitable method for treating added resistance regarding nonlinearity is sought. The linear potential theory method, which has a small calculation requirement, can be used to determine the character of the added resistance quickly. Although the accuracy of the linear potential theory method is limited, it is suitable for grasping the tendency of the added resistance [21]. This is because the motion response of the ship can be estimated relatively accurately [24,26]. A ship’s motion response is a major factor determining the added resistance of the ship navigating in waves. Furthermore, the reflection of waves by the hull plays a significant role. In the linear potential theory method, the influence of a wave reflected on the hull is regarded as a linearized diffraction effect. The added resistance is obtained by integrating second-order pressure estimated in consideration of the motion response and the diffraction.
While the linear potential theory method is attractive because of the promptness of its calculation, it has a drawback that it does not take into account the influence of viscosity. The effect of viscosity is generally neglected because it hardly contributes to the ship’s motion response or the reflected wave [25]. Therefore, many studies based on the linear potential theory have ignored the influence of viscosity on the added resistance. However, when the influence of reflection of waves by the hull is dominantly nonlinear (e.g., owing to breaking), the added resistance cannot be calculated accurately by the linear potential theory method. Therefore, if the added resistance can be estimated more accurately by taking into account the generation of nonlinearity between the hull pressure and the incident wave, the linear potential theory method can still be attractive.
The effect of the reflected wave of the hull, especially the wave breaking part, is a typical issue that has hardly been considered in the past in the context of wave added resistance. Therefore, understanding the phenomenon of bow-wave breaking, which appears in a complicated form, can improve the evaluation method of added resistance. In order to investigate the effect of the complex wave phenomenon of added resistance, the research subject needs to be confined to a specific breaking phenomenon by clearly defining the influence factors. Moreover, it is necessary to improve a method to evaluate the added resistance based on the understanding of the breaking phenomenon.
Wave systems are often described with potential theories. However, the waves of a ship are complex fluid motions that cannot be fully explained by the potential theory. In particular, the bow wave is difficult to model theoretically because the bow wave changes continuously through the interaction of air and water with significant differences in properties (e.g., density and viscosity).
In fact, bow waves around the hull are difficult to simulate with numerical algorithms. Reliable experiments from this standpoint are necessary for developing mathematical models to understand and simulate the characteristics of bow waves. Advances in computer performance are promoting the development of CFD and the ability to simulate complex waves numerically.
Olivieri et al. [19] researched the bow-wave breaking generated by a naval combatant (INSEAN model 2340). The velocity field was measured using a 5-hole pitot tube downstream of the bow wave. Olivieri et al. [20] observed a bow and shoulder wake of a model ship in a subsequent study. The mean velocity measurements showed a complex vortex structure beneath the free surface generated by the breaking waves. The measured data were used to verify the CFD simulation results of the flow. CFD simulation and observations show that high free-surface r.m.s. values are correlated with bubble generation.
Karion et al. [10] investigated the size and velocity distribution of the bow-wave breaking generated by a simple wedge-shaped bow through high-speed video analysis. Measurements were made under various Froude, Reynolds, and Weber number conditions. The results show that wave breaking occur when the Froude and Reynolds numbers exceed a threshold. The study also showed that there exists a critical Weber number to generate the spraying of bow waves. The results are used to examine scaling issues related to bow-wave breaking.
Maxeiner et al. [17] investigated the characteristics of a bow wave by using a two-dimensional plus time (2D + T) approximation method using a flexible wave board designed to simulate one side of bow waves for an advancing ship with a simple bow shape. The characteristics of the bow wave were investigated considering the height of the bow wave and shape of the crest. Wave parameters such as maximum wave height and wave velocity were found to correlate strongly with the motion of a wave generator simulating the shape and speed of the ship.
This paper examines the nonlinearity between the relative wave elevation of the bow wave and the hull pressure that is caused by plunging breaking for the fast ship, which is known to have a relatively small influence on viscosity. This paper presents a method for evaluating the nonlinearity between the relative wave elevation and the hull surface pressure due to breaking of bow wave in a fast displacement ship. This method is motivated by the realization that the numerical analysis assuming the linear relationship between the relative wave elevation and the hull surface pressure can not adequately evaluate the nonlinearity caused by the breakage of the bow wave. Analysis templates are proposed to intuitively evaluate the nonlinearity of the elevation of the bow wave and the pressure distribution on the hull surface, which significantly influence the added resistance estimation, and the nonlinearity of the fast ship is analyzed using these tools.
The effect of the bow-wave breaking is reviewed in Section 2. The fast ship model is used in the experiment and a video observation of the model test are introduced in Sections 3 and 4, respectively. Section 5 proposes a technique to evaluate the breaking effect by investigating the relationship between the pressure on the hull surface and the relative wave elevation of bow waves. Section 6 assess the effect of bow wave breaking. Section 7 defines the process of plunging breaking considering its nonlinear effect on the added resistance. Section 8 assesses the cause of the nonlinearity due to plunging breaking and its influence on the added resistance. The conclusions of this paper are presented in Section 9.
Effect of the bow-wave breaking regarding added resistance
Nonlinearity of bow waves
A phenomenon that can affect the added resistance is the nonlinear behavior of the bow wave. Pile-up and swell-up are important phenomena to be considered in the analysis of added resistance as they affect the increase of the relative wave elevation of the bow wave.

Nonlinear height increase of bow wave.
Pile-up, shown in Fig. 1(a), is a phenomenon in which water splashes up when a wedge is dropped into the water. Pile-up is described by Payne [22] as a function of the hull bow’s deadrise. It is an important concept related to the nonlinearity of the bow wave with respect to the flare angle of ships. Pile-up occurs when the relative motion between the incident wave and the bow increases and is connected to the breaking of the bow wave. A similar phenomenon can occur in the case of a relatively high wave steepness and rapid variation of the relative wave elevation.
Swell-up, shown in Fig. 1(b), is an increase in the relative wave elevation compared to undisturbed incident waves, and it occurs even when considering a stationary bow wave. The peak wave height measured in a model test is greater than the sum of the undisturbed incident wave height and motion response [3,4]. Swell-up is caused by the increase in waterline entrance angle with increasing draught. This can be understood from the fact that the stationary bow wave increases at high draught in general. The increase in bow-wave amplitude also affects the estimation of added resistance [2].

Classification of the bow-wave breaking by stability on the crest.
Bow-wave breaking occurs on most ships operating in waves with different strengths and types. The type of breaking is divided into plunging and spilling depending on the stability appearance at the crest, as shown in Fig. 2. Plunging is a stable type of breaking that appears as an overturning detachment on the crest of the bow wave. This type is mainly found in a hullform with a narrow waterline entrance angle. Spilling is an unstable type of turbulent form that disturbs the adjacent flow field. This type is predominant in a hullform with a blunt waterline entrance angle.
In the study by Maxeiner et al. [17], the breaking type of the bow wave was estimated to be significantly influenced by the waterline entrance angle and the ship’s speed. Moreover, in a narrow range of regions, a transition region were found where two types of breaking overlap. The transition region of the bow wave with the change of speed was also found in Karion’s experimental study using a simple wedge shape [10].
Noblesse et al. [18] has analytically approximated the type of bow wave by Bernoulli’s equation and experimental approximation to wedge-shaped ship without a bulbous bow in calm water. The parameters that affect the stability of the bow wave crest are the draught-based Froude number (
From these studies, it can be deduced that the characteristics of the bow wave can be changed dynamically when the speed of the ship or the relative wave elevation of the ship is changed.
Some previous experimental studies provide a link between the resistance and the type of wave breaking. Rapp and Melville [23] analyzed the loss of momentum due to the breaking of deep-water waves through an experimental approach. They showed that the loss of momentum depends on the type of wave breaking, and plunging breaking causes more energy loss than spilling breaking because of the large difference in wave height before and after breaking. This study shows that energy dissipation depends on the type of breaking.
Kayo and Takekuma [12] described the increase in resistance of a ship with a blunt bow by controlling the shear flow of the free surface. They showed that an increased shear flow of the free surface of the ship in the advancing direction induces a high residual resistance. This study clarifies the resistance change due to the shear-flow change of spilling breaking. In addition, Ali et al. [1] investigated the bow wave for a ship moving at a slow speed, typically the wave in front of a bow. They described the correlation between wave resistance and energy dissipation by the breaking of the bow wave and the disturbance of the free surface for a hullform with a large block coefficient. The goal of that study was to investigate the relationship between free-surface disturbances and bow-wave breaking, which can be used to determine parameters for numerical analysis. The results of that study show that the wave-breaking area increases with the increase of the Froude number and block coefficient and with the increase of the surface integral of the square of the free-surface disturbance function.
An experimental study was also reported on the nonlinear effects of bow-wave breaking on the added resistance. Kashiwagi et al. [11] performed model tests to find the nonlinearity of the bow wave using the unsteady wave analysis method at various wavelengths for the modified Wigley model. They showed that, as the ship’s motion response is increased in intermediate waves, the added resistance can be significantly different between direct measurements and wave analysis because of nonlinear local waves. This nonlinearity is prominent near the forefront of the ship.
The added resistance has secondary characteristics. According to the analytical approach of Maruo [16], the added resistance is proportional to the square of the wave amplitude function (Kochin function), which is given as a superposition of the diffraction wave (
Blok [2] showed that the vertical relative motion response of the ship is the dominant factor contributing to the added resistance. This is confirmed by the non-dimensionalized added resistance based on the square of the relative motion through experimental and mathematical modeling. He also showed that the upper part of the bow’s waterline greatly contributed to the added resistance, while the lower part and stern part have small contributions.

Profile and bodyplan of FDS-5.
The waterline contribution significantly influences the added resistance estimation in the linear theory method. It is important to estimate the waterline contribution accurately since it is calculated as the square of the relative wave elevation, which consists of the radiated wave resulting from the ship’s motion response and the reflected wave.
In addition, the added resistance is relatively small compared to the amplitude of oscillating forces acting on the ship since it is the average of the forces. A deviation in the prediction for the relative wave elevation or motion response generally causes a deviation in the added resistance prediction. Therefore, a high accuracy is required for the predictions regarding the non-linearity especially for the fast displacement ship.
In the previous review, it is confirmed that the behavior of the relative wave elevation is important to understand the effect on added resistance. To clarify this relation, measured signals of the Maritime Research Institute Netherlands (MARIN)’s model tests is analyzed and the results are reported in this paper. The model tests with a fast ship were performed at MARIN’s Seakeeping and Maneuvering Basin (SMB), which has a length, width, and depth of 170 m, 40 m, 5 m, respectively. The model ship has a length of 6.7 m, the hullform has a simple triangular V-shaped front part and a nearly flat bottom stern, as shown in Fig. 3. The hullform used in the experiment is the parent hullform of the systematic series of fast displacement ships (FDSs) of the Joint Industry Project from 1979–1989 [3,8,9]. The main parameters of the model are listed in Table 1, and the scale factor is 15.0. The model test was performed with the ship in the free-running mode and equipped with the propeller, rudder, and autopilot system at three speeds (
Main particulars of FDS-5
Main particulars of FDS-5
As shown in Fig. 4, the model ship is equipped with resistance-type wave height transducers at five stations (16, 17, 18, 18.75, and 19.5) and diaphragm-type pressure transducers vertical intervals of 0.525 m at the same stations. The relative wave elevation were measured with resistance-type probes at 200 Hz in model scale and pressures were recorded by diaphragm-type transducers at 1 kHz in model scale. Technically, there is a distance difference of 0.1 stations between the two types of transducers installed on the model ship. However, this difference, corresponding to 3.3 cm in model scale, is ignored because it does not play a decisive role in determining the effect of unsteady bow waves. The relative wave elevation and pressures on the hull surface are measured for the ship advancing at a constant speed in calm water and regular waves (
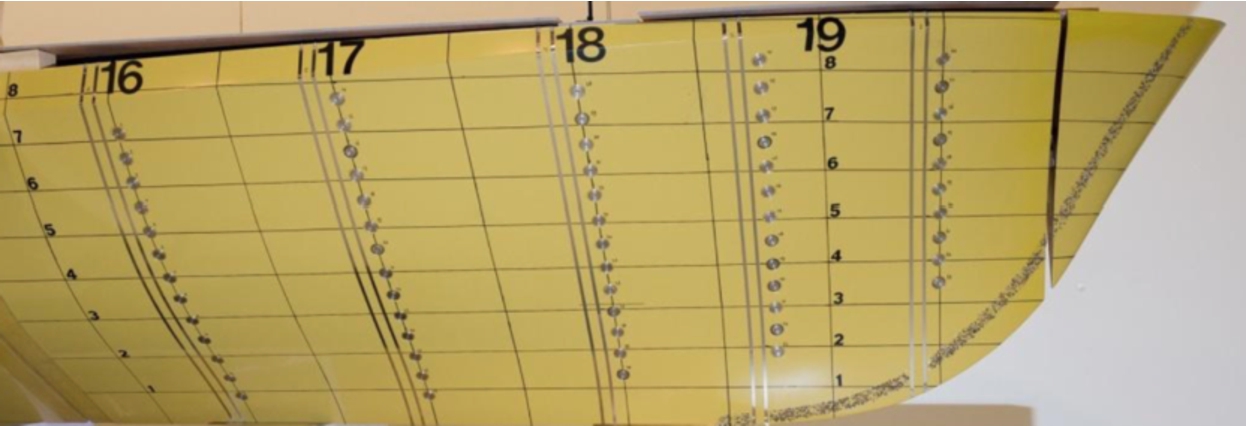
Photograph of the model ship.
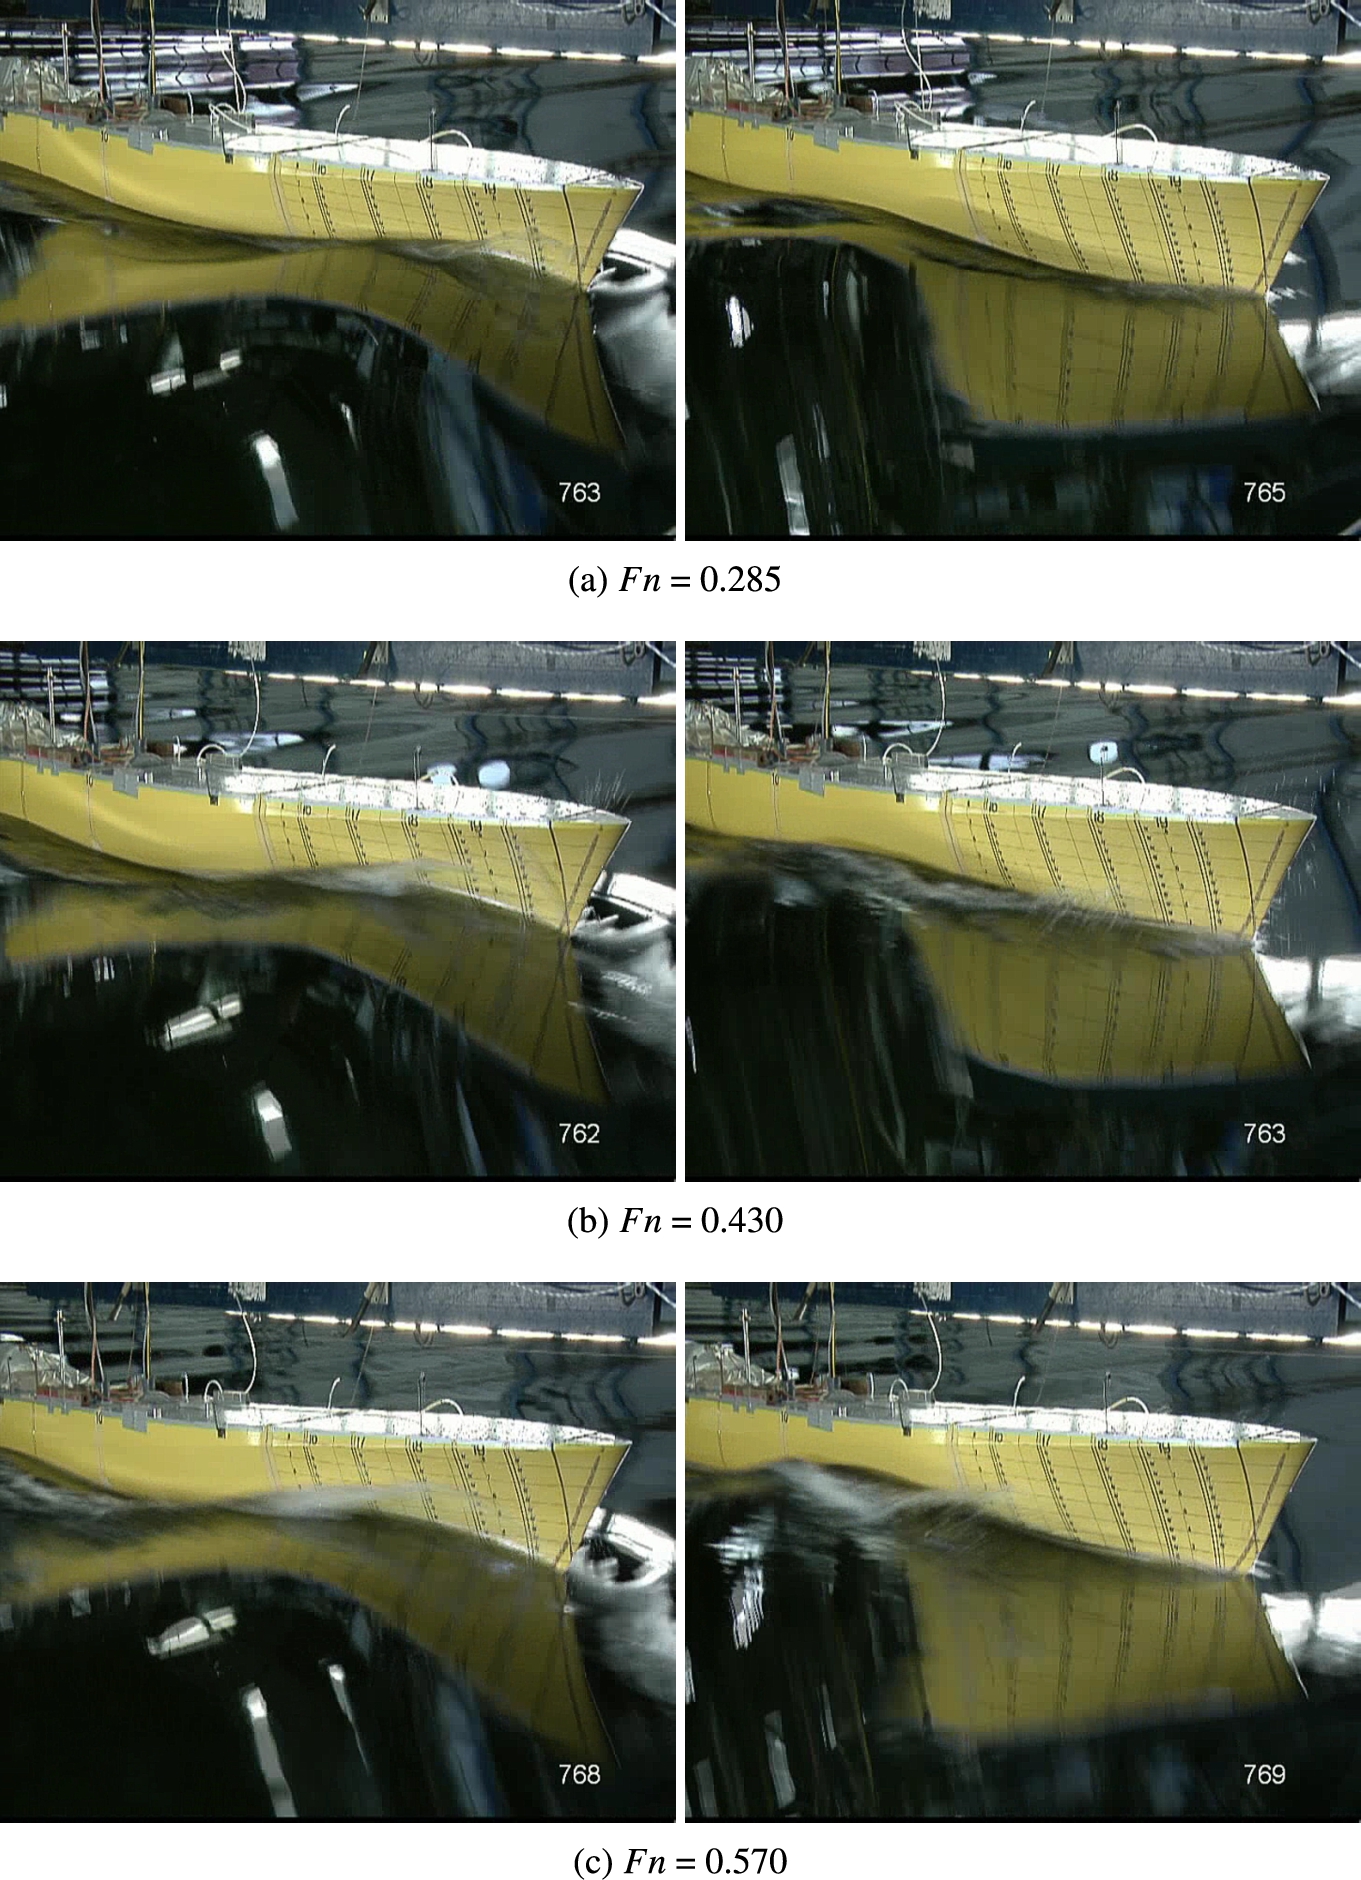
Videos of the model tests are captured to show the behavior of the bow waves. Figures 5~8 show the instantaneous bow waves at three speeds in calm water, short waves (

Stationary bow waves in calm water for three speeds.
Instantaneous bow waves for three speeds in short waves (

Instantaneous bow waves for three speeds in intermediate waves (

Instantaneous bow waves for three speeds in long waves (
Bow waves appear as sheet-shaped overturning detachment because the ship is fast and has a simple fine bow shape with a small waterline entrance angle. Model tests on the fast ship can focus on the influence of wave elevation on the hull-surface pressure due to the bow-wave breaking, in contrast to conventional ships (e.g., blunt bow or bulbous bow), which are known to be influenced by viscosity [13].
In Figs 5~8, an overturning thin sheet of the plunging breaking of bow waves is observed. As the speed of the ship increases, the size of the sheet increases. At
The left-hand side of Fig. 6 shows the highest wave height of the bow wave in short waves. It is observed that the overturning detachment of the bow wave is greatly increased compared to that at the same speed in calm water. At the right-hand side of Fig. 6, which shows the lowest wave height, the stationary wave, which is a fundamental element of the wave resistance of the ship, disappears.
The left-hand side of Fig. 7 shows the highest wave height of the bow wave in intermediate waves. The bow wave is significantly broken. It is observed that the breaking area also increases as the speed increases. In the photographs on the right-hand side, where the wave height is the lowest after the bow wave breaks, the bow wave has disappeared.
In the left-hand side of Fig. 8, the overturning detachment is also observed in long waves. At each speed, however, the breaking form of the bow wave is milder than in the short-wave condition of Fig. 6, in which the ship shows no motion response.
The plunging breaking in the fast ship is observed as two phenomena. The first is the overturning detachment on the crest of the bow wave. The second is the disappearance of the stationary bow wave. These breaking phenomena of the bow wave are more clearly observed as the speed of the ship increases.
Although various studies successfully simulated the dynamics of the bow wave. However, little research has been performed on basic physical models to help understand the impact of bow-wave breaking on the added resistance.
It is important to evaluate the relative wave elevation accurately. In addition to accurately evaluating the relative wave elevation, it is necessary to pay attention to the particular changes in the hull pressure when the bow wave is breaking. In particular, it is important to evaluate the relationship between the relative wave elevation and the unsteady pressure of a ship concerning the nonlinearity of the wave added resistance.
Pressure measurements are needed to identify physical phenomena that affect the added resistance. In the analysis of the measured signals, it is difficult to correlate the time-domain signals of each pressure gauge and wave transducer. The measurement of the hull-surface pressure in waves is an expensive experiment, which involves difficult-to-install pressure gauges and signal processing. The measured results should be carefully analyzed and evaluated. It is necessary to develop an efficient method for processing a large amount of measurement data.
This section presents an analytical template to evaluate the effect of the bow-wave breaking by using the relative wave elevation and the pressure of the hull surface measured in the model test. the pressure and relative wave elevation diagram (P–R diagram) of the bow wave. The template proposed in this section have the advantage of capturing the relationship between the time series of pressure and the relative wave elevation into a simple synthesized form.
An analysis tool called pressure and relative wave elevation diagram (P–R diagram) is proposed. The pressure measured by the fixed pressure gauge and the relative wave elevation measured by the wave height transducer at a specific location on the hull show a repeated signal in the same period.
The measured pressure is non-dimensionalized by the square of the speed in Equation (1).

Schematic drawing of the pressure and relative wave elevation diagram (P–R diagram). The development and disappearance of the bow wave and the instantaneous pressure contribution on the hull surface are indicated by the order of the numbered dashed-line arrows. The number ‘1’ is the process of linearly increasing the pressure as the relative wave elevation increases. The number ‘2’ is the process where the relative wave elevation increases but the pressure decreases. The number ‘3’ is the subsequent process where the relative wave elevation and pressure are reduced.
Figure 9 shows a schematic X–Y plot for three cycles, with the smoothed pressure on the x-axis and the corresponding relative wave elevation on the y-axis. The P–R diagram shows a closed shape by directly matching these two terms but not the time term. In the P–R diagram, the center of the graph is the origin
Figure 9 depicts the periodic history of the development and disappearance of the bow wave and the instantaneous pressure contribution on the hull surface in the order of the numbered dashed-line arrows. The number ‘1’ is the process of linearly increasing the pressure as the relative wave elevation increases. The number ‘2’ is the process where the relative wave elevation increases but the pressure decreases. The number ‘3’ is the subsequent process where the relative wave elevation and pressure are reduced. At the end of this process, pressure absence is observed. This P–R diagram shows the hysteresis of the repeated signal at the same time.
In the linear theory, a linear relationship exists between the pressure and the relative wave elevation. If the linear theory is valid, a linear relationship between these two signals should be identified about the origin of the P–R diagram. Otherwise, if a nonlinear relationship occurs between the two signals, the P–R diagram will have a distorted shape due to the discrepancy between the maximum points of the pressure and the relative wave elevation. Therefore, the distortion can be considered evidence of nonlinearity.
In regular waves, the pressure and relative wave elevation signals in the time domain at station 18 for three periods are shown in Figs 10~12. The measured time-domain pressure signals are smoothed with a time-based moving average filter of a five-point span. Figures 10~12 show the smoothed pressure data with a solid line, the raw data with circles, and the relative wave elevation with a dashed line. The figures show that the smoothed pressure signal removes the local high-frequency signal and preserves the response of the original signal well. Each measured value in calm water is subtracted from the measured signals (pressure and relative wave elevation) in regular waves to focus only on an unsteady bow wave. Therefore, the subtracted signal represents the unsteady phenomenon in regular waves. As the ship’s speed increases, it is observed that the sinusoidal tendency of the signal decreases.
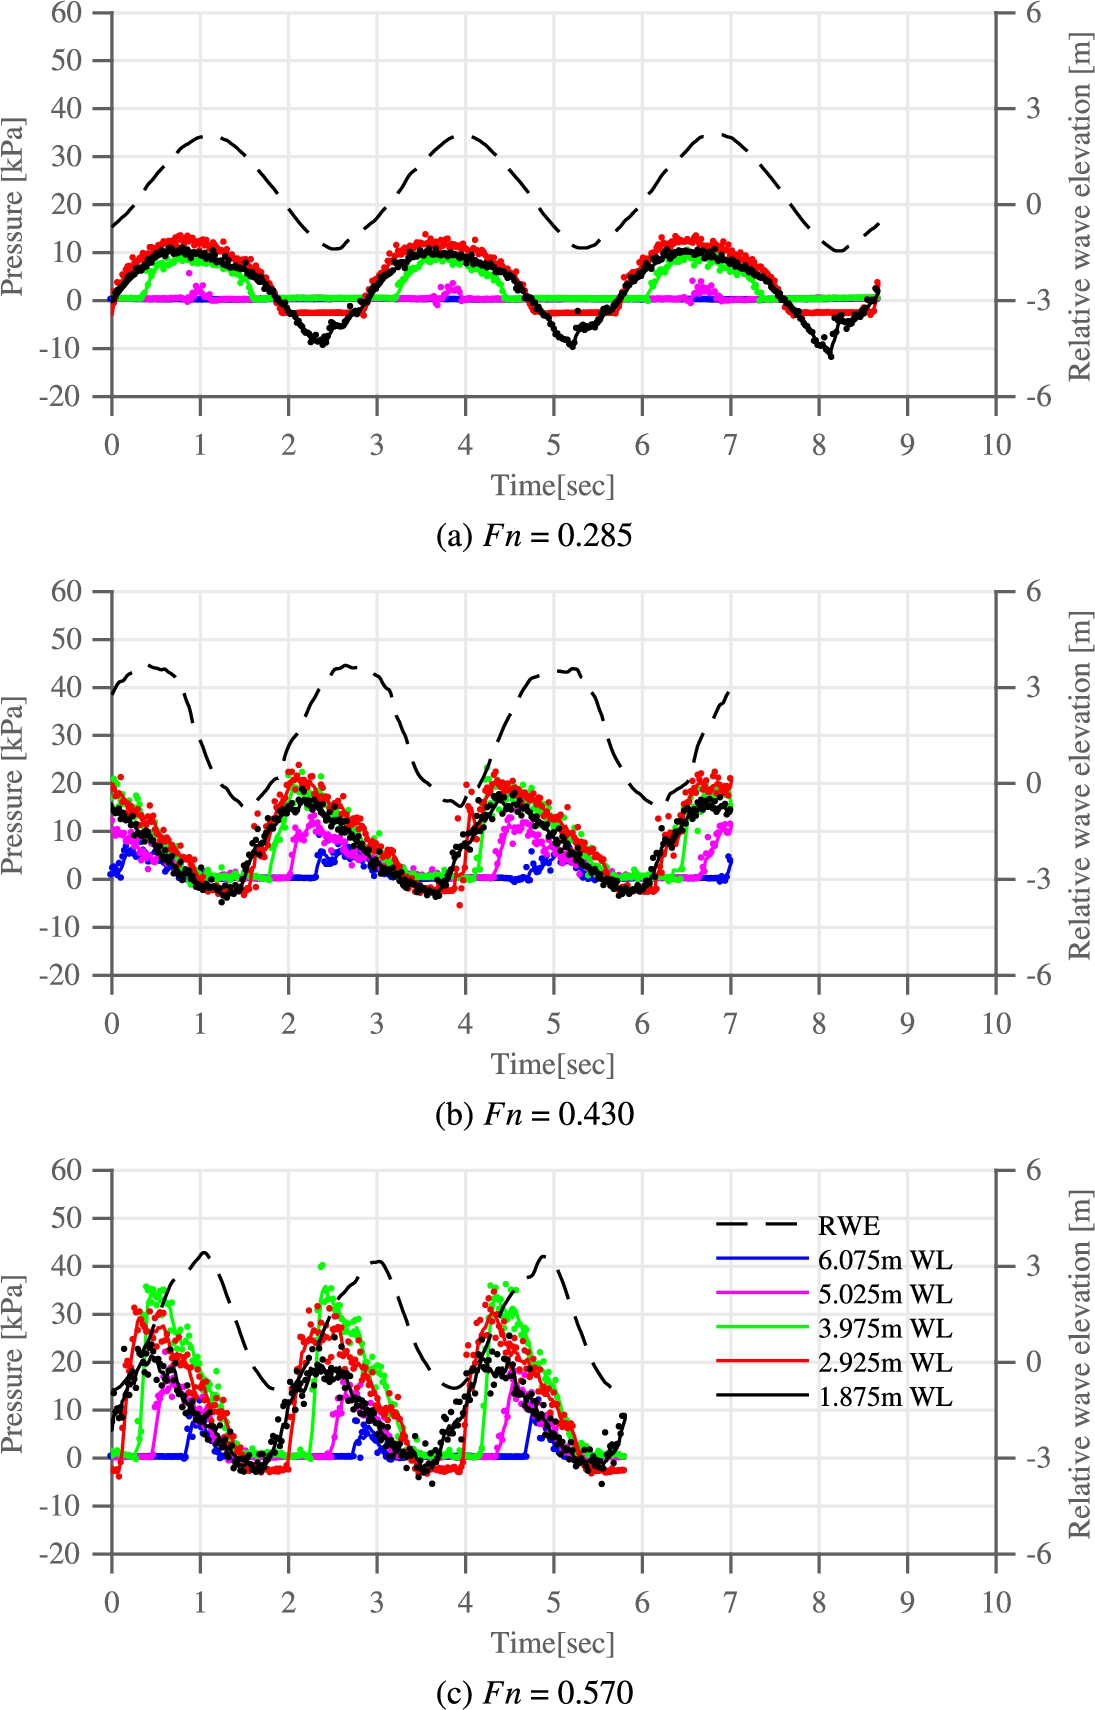
An example of relative wave elevation (RWE) and pressure signals for three cycles. Pressure signals are smoothed with a time-based moving average filter of a five-point span over three speeds at station 18 in short waves (
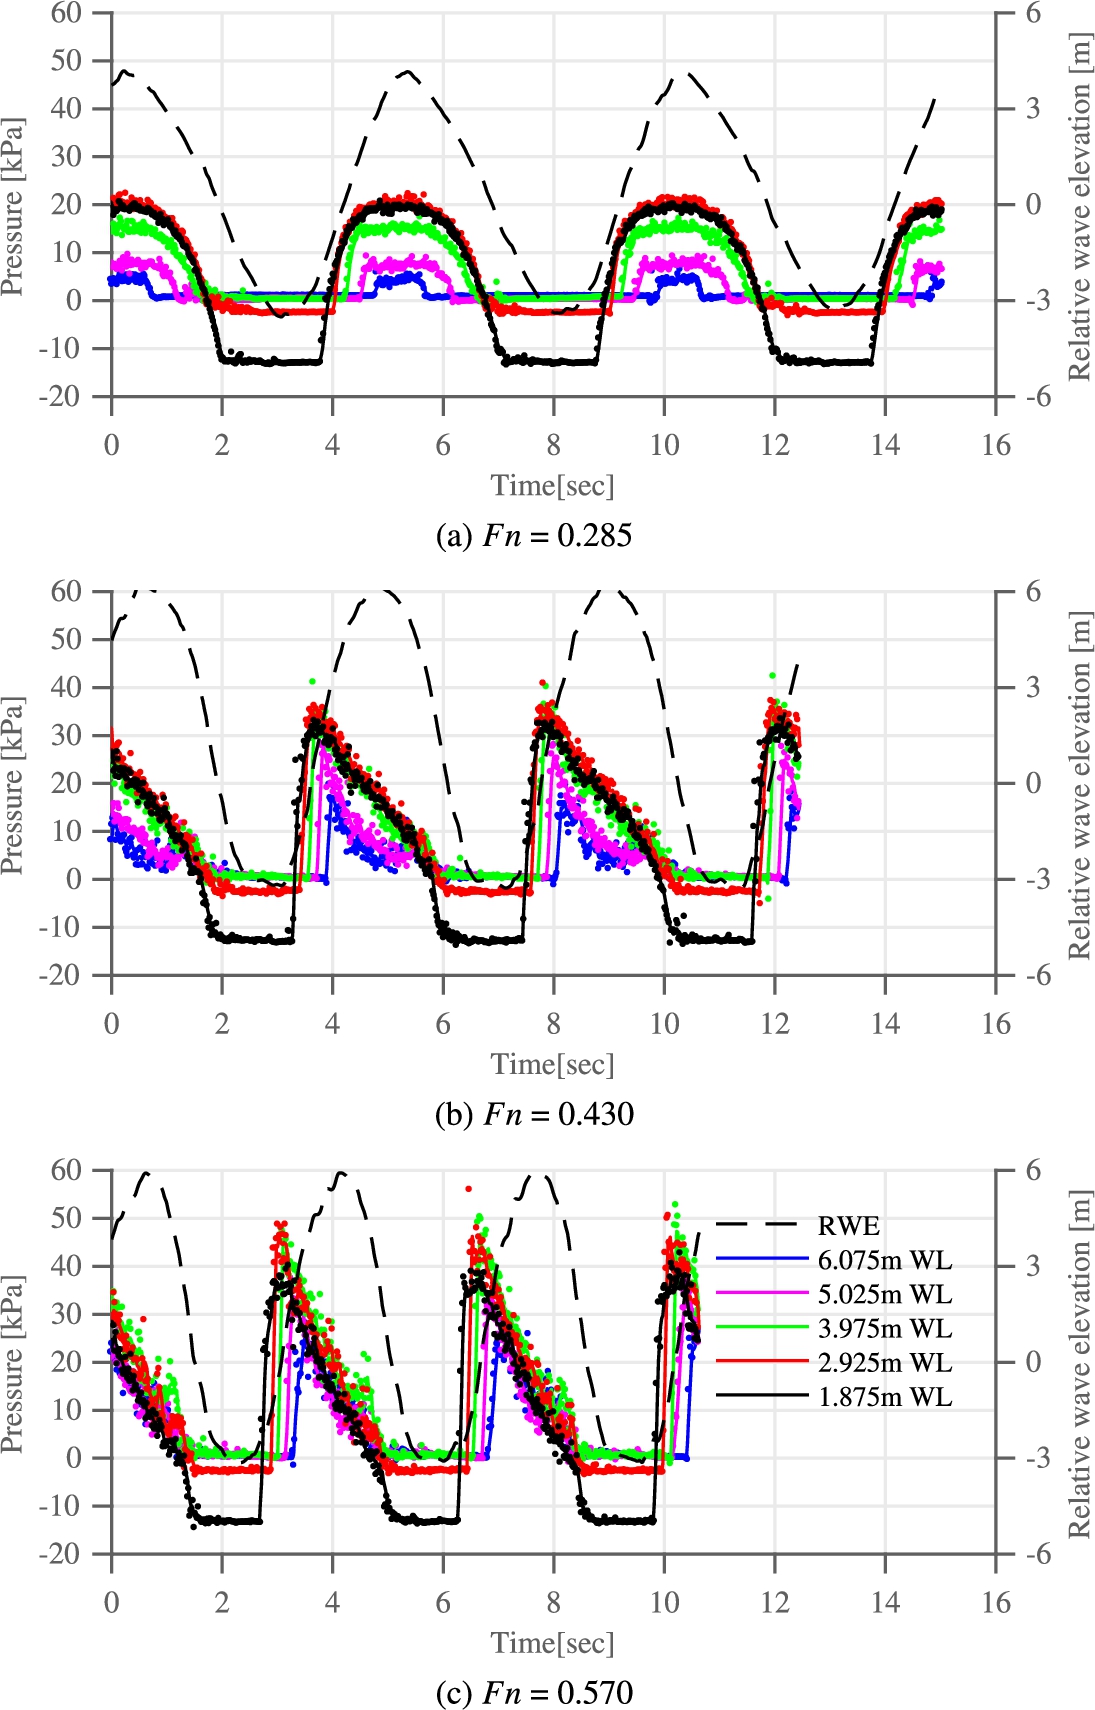
An example of relative wave elevation (RWE) and pressure signals for three cycles. Pressure signals are smoothed with a time-based moving average filter of a five-point span over three speeds at station 18 in intermediate waves (
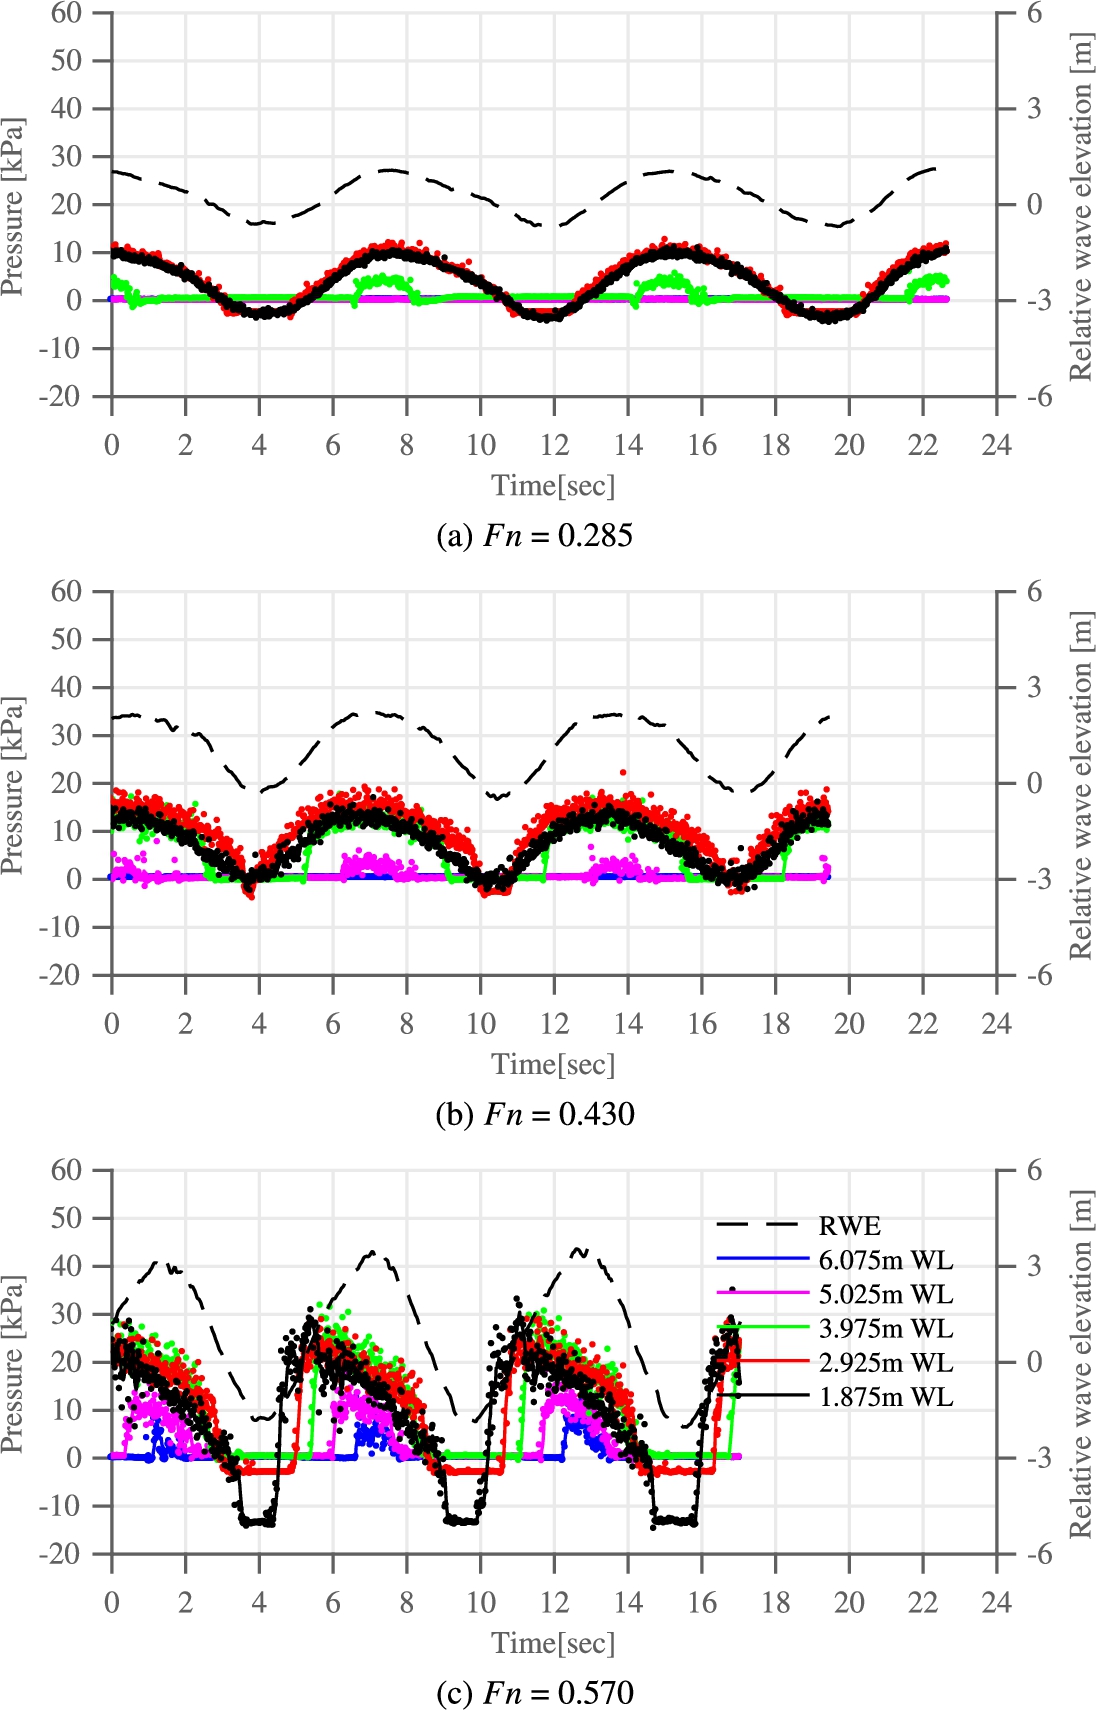
An example of relative wave elevation (RWE) and pressure signals for three cycles. Pressure signals are smoothed with a time-based moving average filter of a five-point span over three speeds at station 18 in long waves (
Results in short waves
Figure 13 shows the relationship between the pressure acting on the hull and the relative wave elevation measured at five stations at three speeds (
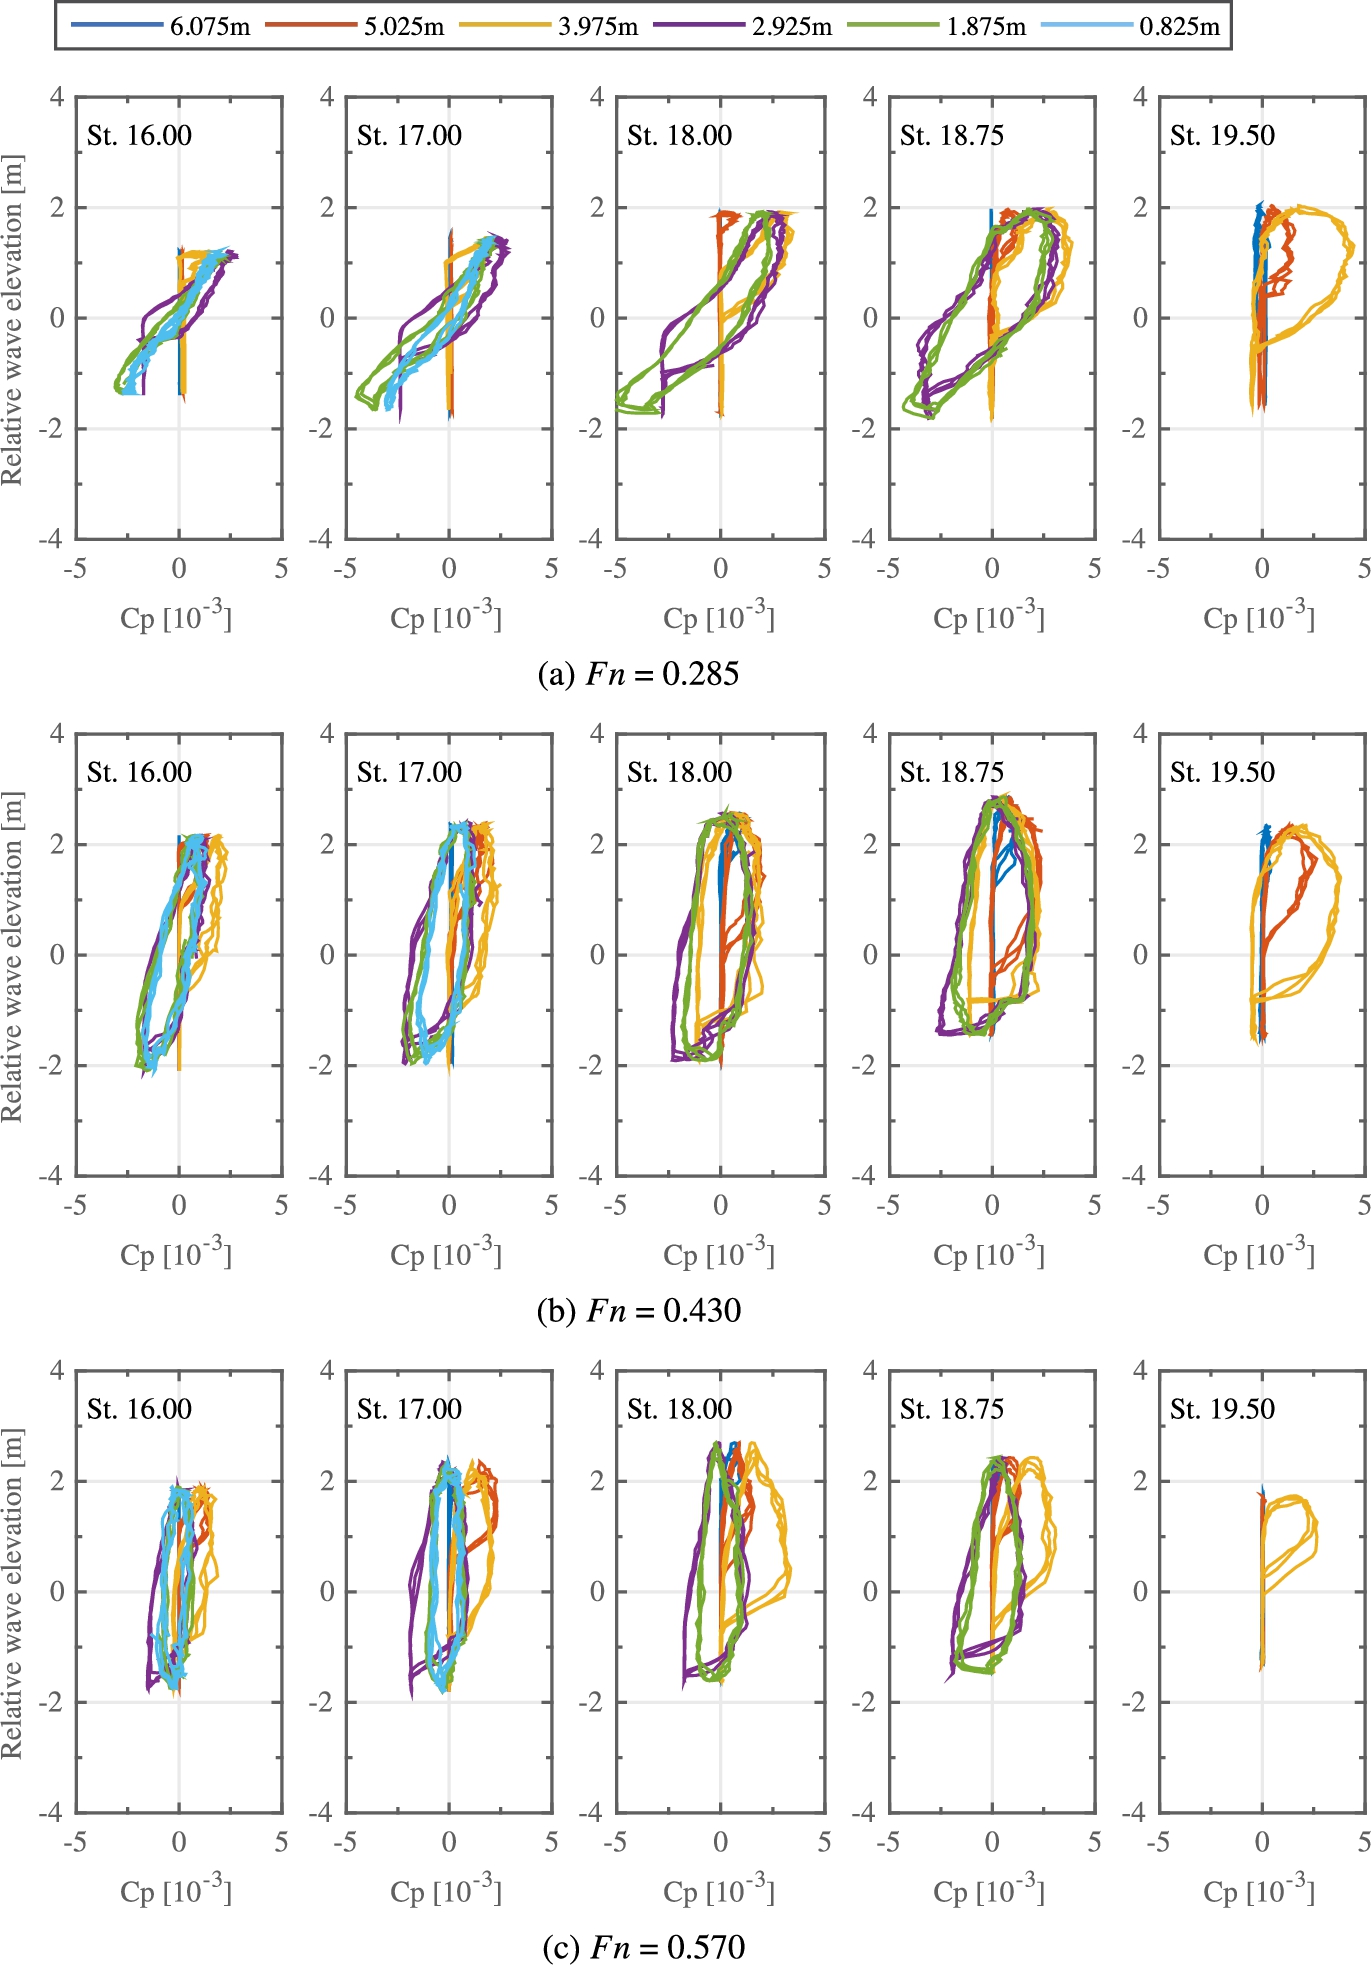
The pressure and relative wave elevation diagram (P–R diagram) for three ship’s speeds in short waves (
As the ship’s speed increases, the longitudinal position where the highest pressure drop occurs during the growth of the bow wave is shifted to the rearward of the ship. This phenomenon occurs at station 19.5 for
Figure 14 shows the relationship between the pressure acting on the hull and the relative wave elevation measured at five stations at three speeds (
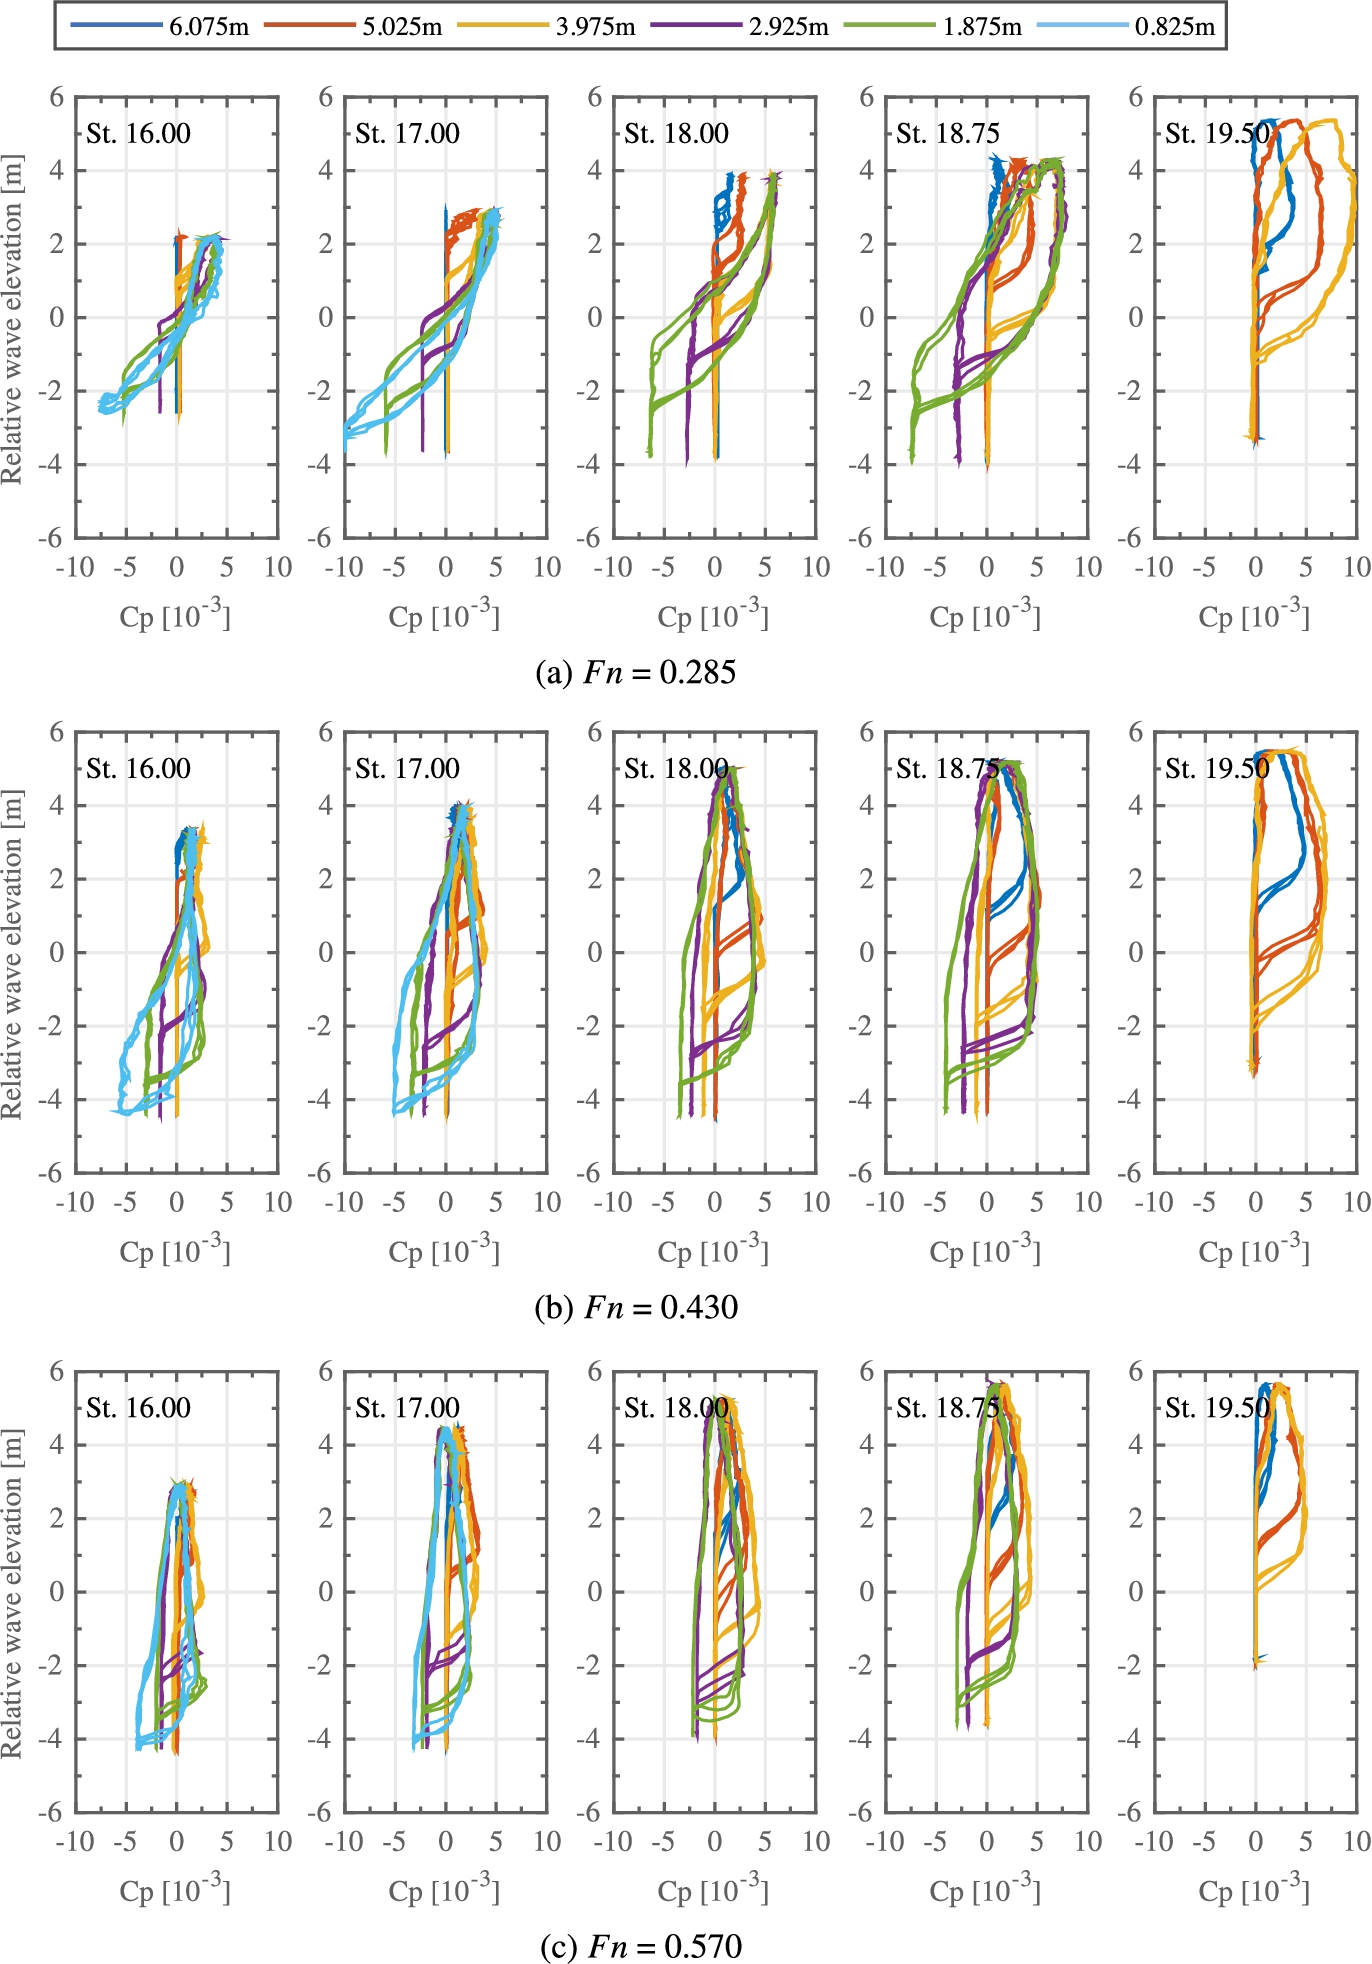
The pressure and relative wave elevation diagram (P–R diagram) for three ship’s speeds in intermediate waves (

The pressure and relative wave elevation diagram (P–R diagram) for three ship’s speeds in long waves (
The bulging of the P–R diagram is also increased. In contrast to the short-wave condition, the bulging shape of the P–R diagram at the representative stations 16 and 17 is obvious at intermediate waves, as shown in Fig. 14. A pressure drop is clearly observed in the process of increasing the bow-wave height.
This difference is explained by the greater vertical motion response of the ship. Owing to the larger response, the increased relative velocity in the flow field around the hull induces a stronger breaking of the bow wave. On the other hand, this is also the result of an interaction of the incoming waves with the local geometric features of the hullform, such as a flare that changes the dynamic waterline entrance angle.
Figure 15 shows the relationship between the pressure and the relative wave elevation measured at five stations at three speeds (
The shape of the P–R diagram in this wavelength condition shows a more linear relationship at all speeds compared to the previous wavelength conditions (
In summary, the generation and disappearance of the bow wave have been effectively shown and analyzed by the P–R diagram at three wavelengths (
Process definition of plunging breaking
Taking into account the behavior of the pressure and the relative wave elevation investigated through the P–R diagram proposed in this paper, the process of plunging-type breaking of waves can be divided into three stages. The first (the number ‘1’ in Fig. 9) is the bow-wave developing stage, in which the ship’s surface pressure increases with the relative wave elevation. The second (the number ‘2’ in Fig. 9) is the pile-up and breaking stage, in which the height of the bow wave increases but the surface pressure of the hull decreases. The pile-up of the bow wave occurs, but the pressure starts to decrease owing to the detachment of the bow wave. This process is skipped when the bow wave is not breaking. The third (the number ‘3’ in Fig. 9) is the bow-wave absent stage, in which the pressure and relative wave elevation drop rapidly. It may be a natural phenomenon related to the generation and disappearance of the bow wave, but when the bow wave breaks in the previous stage, the bow wave that acts as a resistance to the hull disappears. This process is clearly detected when the breaking of the bow wave is evident.
The second step, in which the pressure drop is found, can be explained based on Bernoulli’s equation by the pressure suction due to the increase in amplitude of the incident wave. However, this pressure drop is also related to the detachment of the bow wave, which is the cause of the disappearance of the stationary bow wave, observed in the photographs on the right-hand side of Figs 6~8.
The detachment of the bow wave is indicated in the P–R diagram (Fig. 9) by different pressures at the same wave height. When the height of the bow wave returns to the same height after detachment, the pressure acting on the ship, indicated as the number ‘3’ in Fig. 9, is significantly reduced compared to the maximum pressure of the development stage, indicated as the number ‘1’ in Fig. 9. A pressure that is not proportional to height is another perspective for interpreting the nonlinearity of added resistance.
Non-linear influence on added resistance
The previous section investigated the nonlinear relationship between the pressure and the relative wave elevation due to the plunging breaking of the bow wave. This section compares integrated pressures to determine the effect of the breaking waves on the added resistance.
Time average of pressure
The periodic pressure measured in a specific area of the forward part of the hull is time averaged by Equation (4), and a contour plot is constructed. This distribution represents the mean pressure acting on the ship advancing in waves.
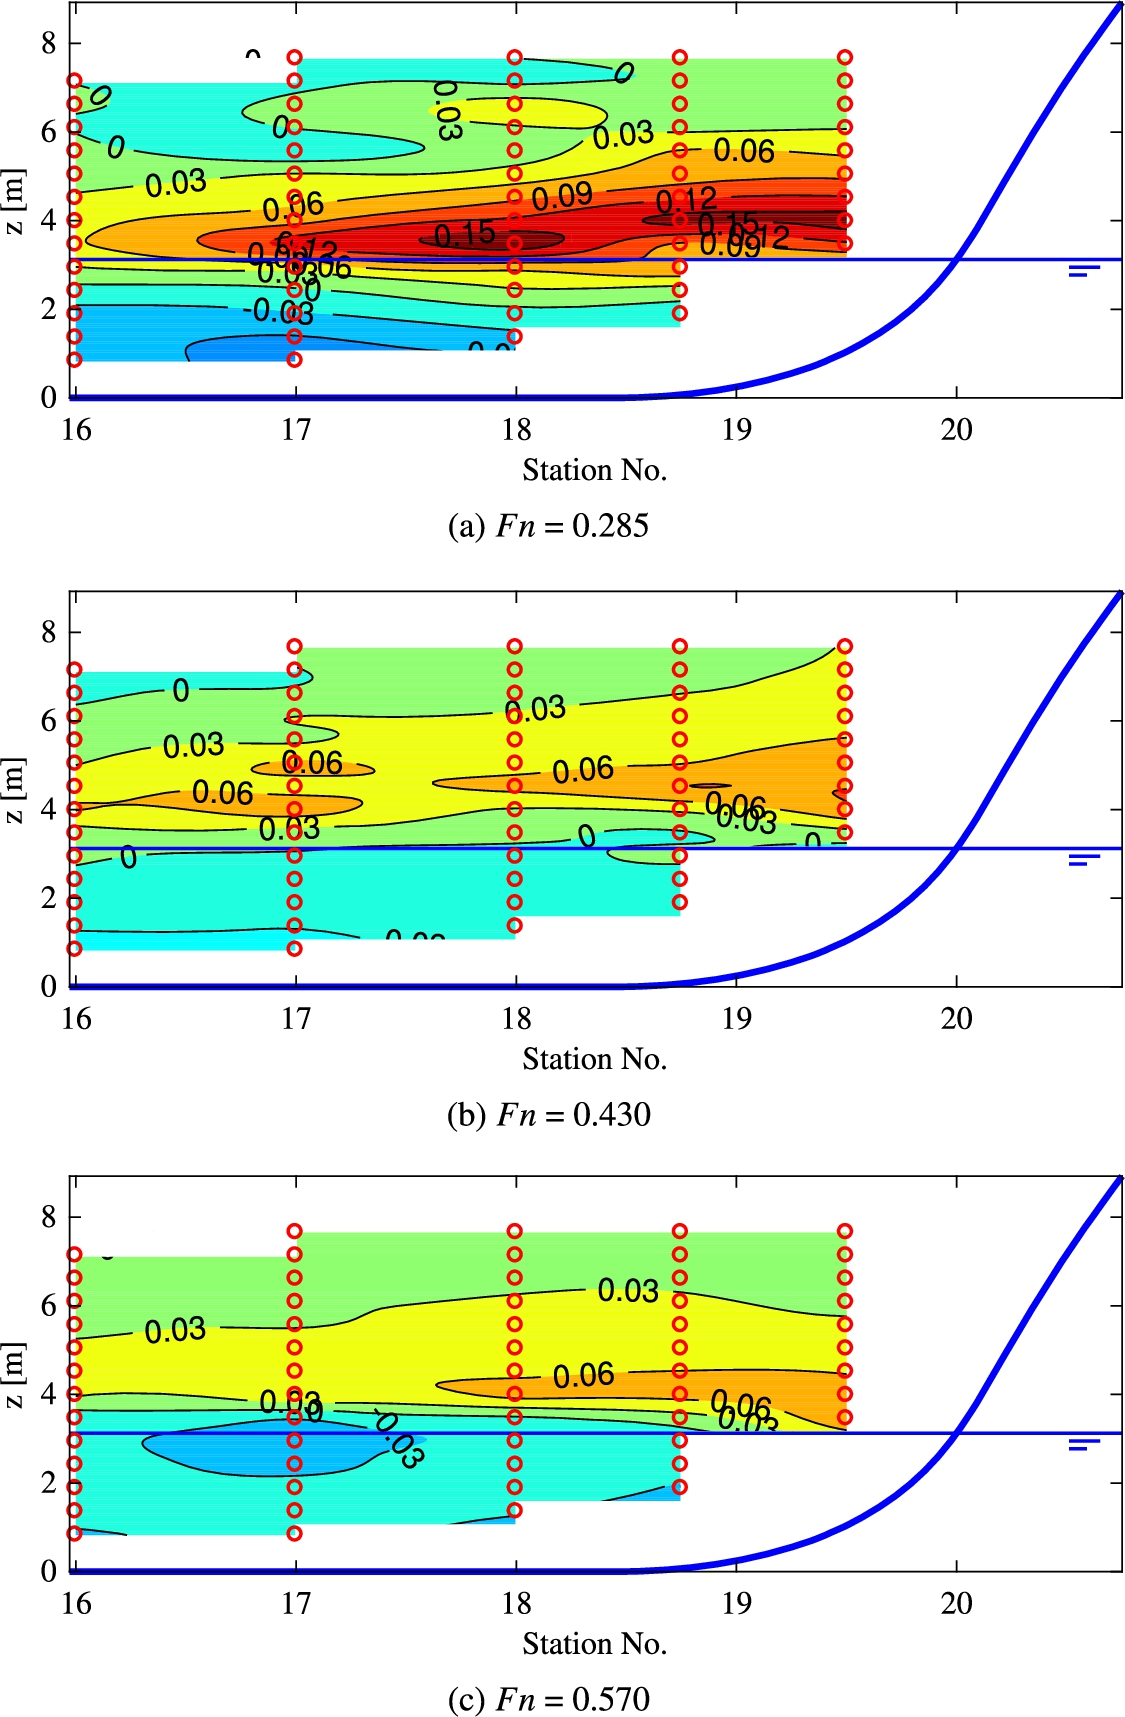
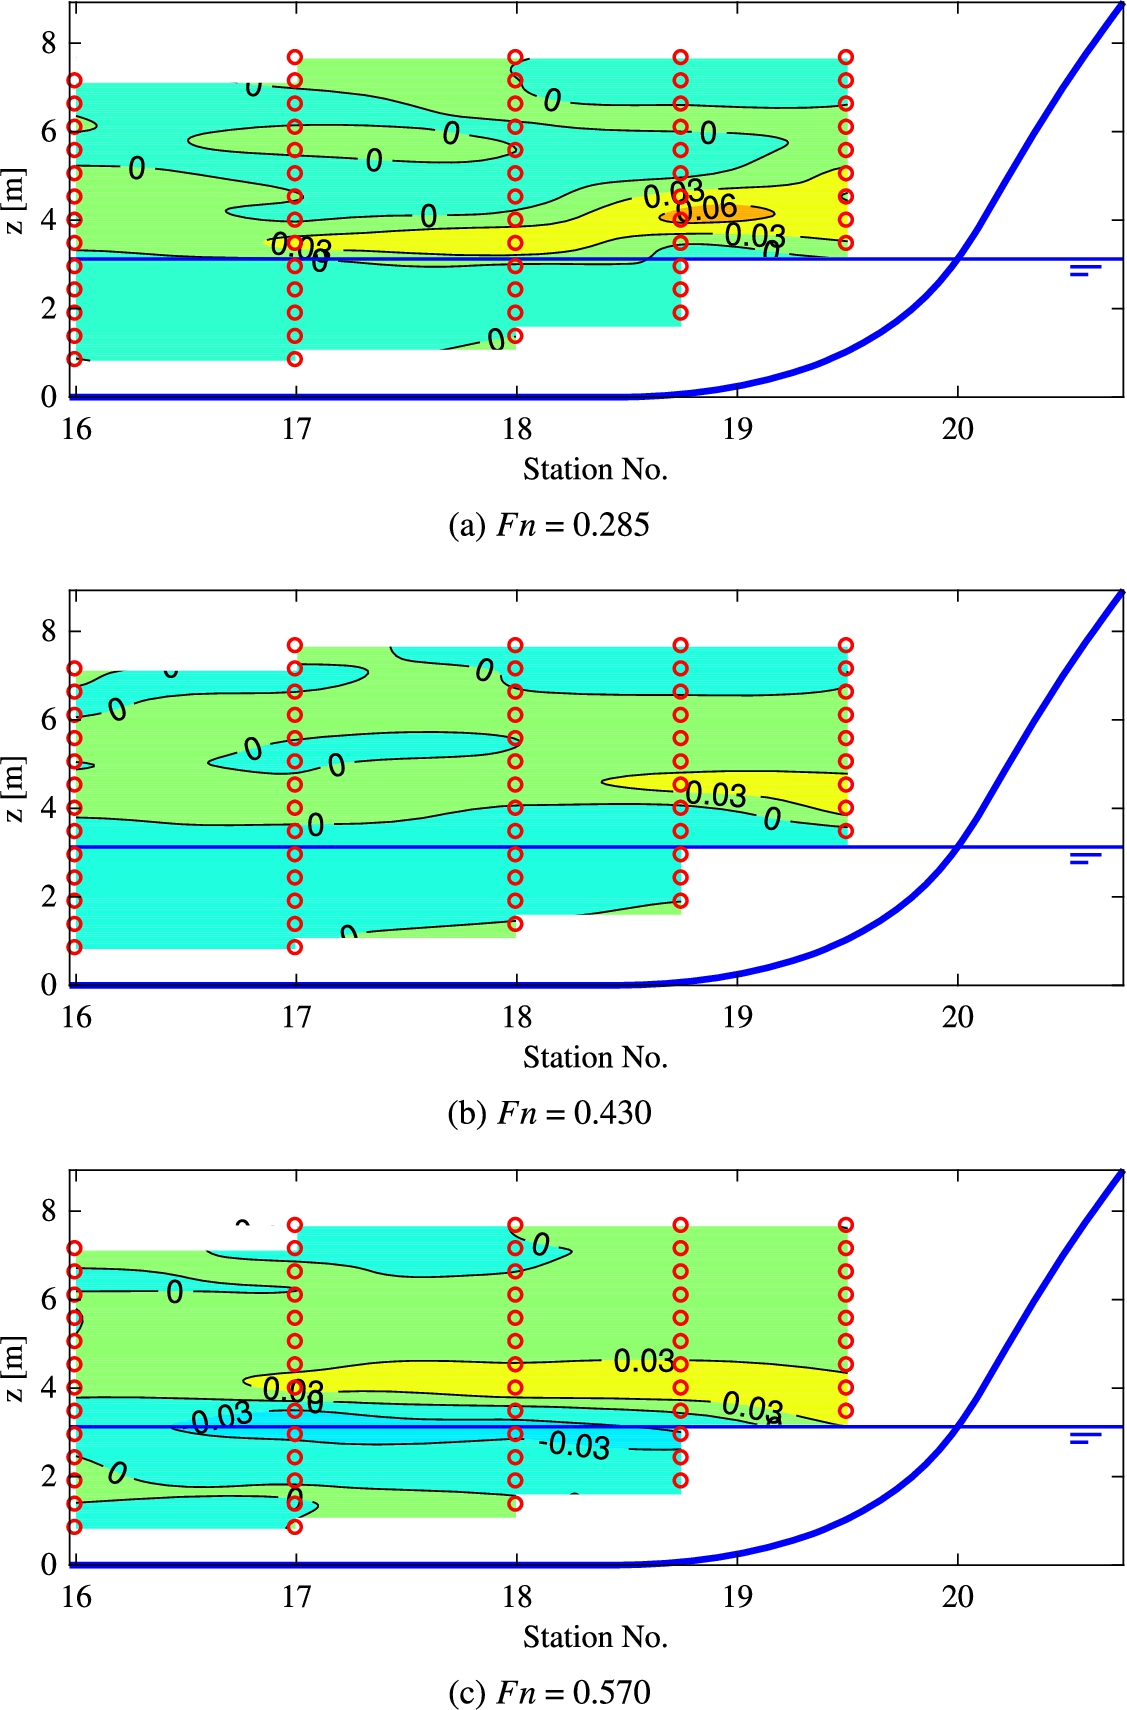
Figures 16~18 show the time-averaged distribution of pressures in short, intermediate, and long waves. Each figure shows the results at three speeds of
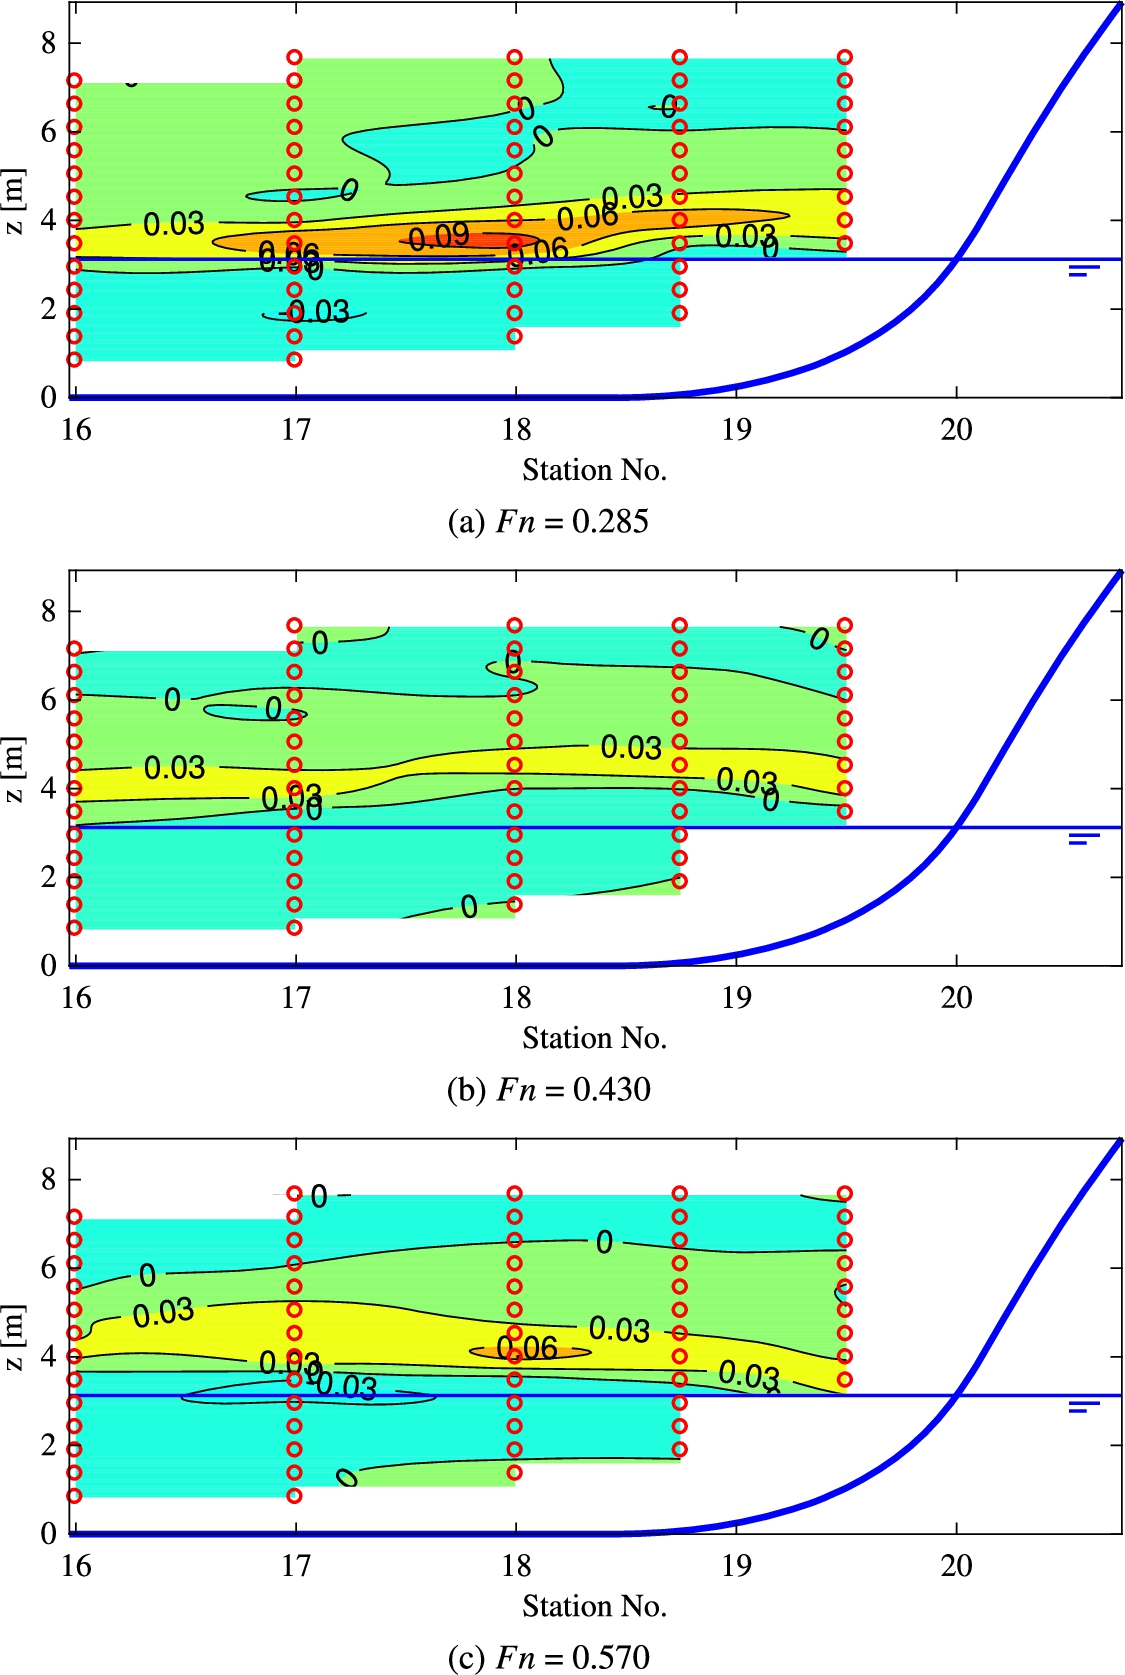
Contours of mean unsteady pressure
Contours of mean unsteady pressure
Contours of mean unsteady pressure
Positive averaged pressures are concentrated in the upper vicinity of the still waterline (3.125 m) under all conditions. The averaged pressure of the intermediate waves of Fig. 17 appears larger in a wider area compared to the other wavelength conditions. This is primarily due to the large motion response. The average pressures of the short waves are greater than that of the long waves. This is because the incident waves act more strongly on the hull in the case of short waves, for which the relative motion of the ship is small.
The pressure at
The time-mean pressures by Equation (4) are integrated vertically upwards according to the trapezoidal rule at each station.
The integrated values for each station, given by Equation (5), are shown in Fig. 19. The values corresponding to
Figure 19(a) and (c), corresponding to the short and long waves, respectively, are less likely to confirm the effect of bow-wave breaking because the variation in the integrated pressure value is small. However, Fig. 19(b), corresponding to the intermediate wave condition, shows a large variation in the integrated pressure. Especially at stations 18 and 19, the large integral value at
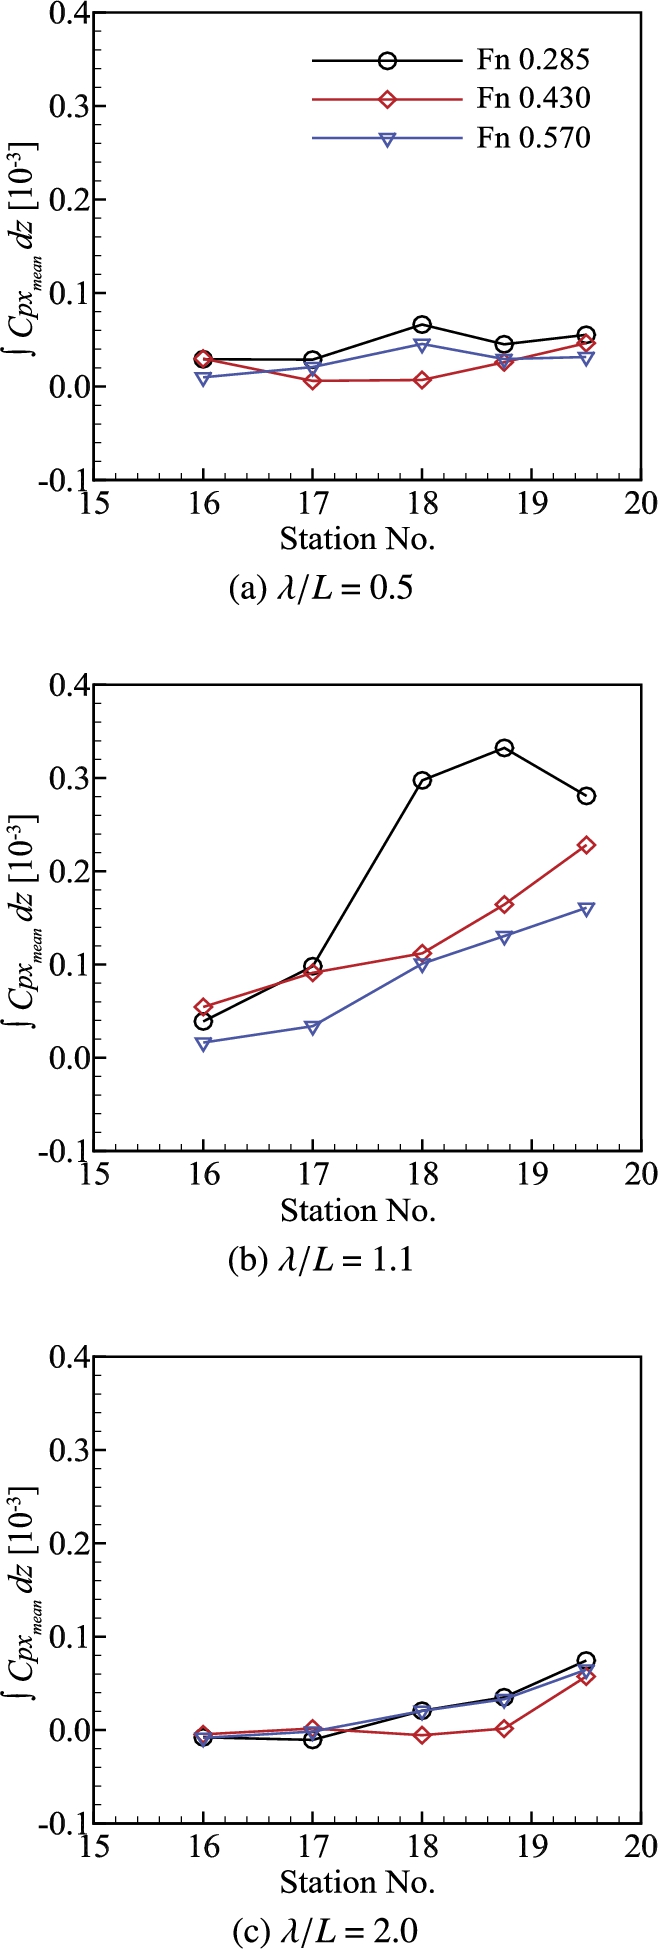
Mean unsteady pressure acting on the stations for three ship’s speeds.
Pressure integral acting on a specific area of the forefront part of the hull for three wavelengths.
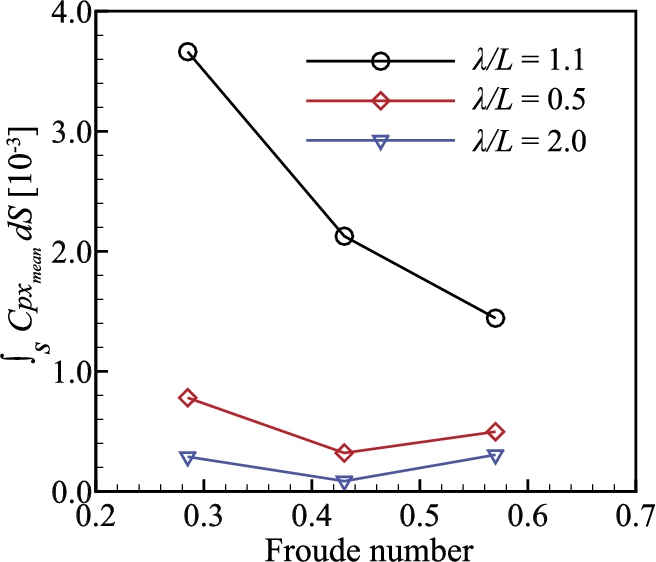
Figure 20 shows the integral value according to the trapezoidal rule in the longitudinal direction of the ship with the values shown in Fig. 19. The pressure integrals acting on the hull in the intermediate, short, and long waves are represented by circles, diamonds, and gradients, respectively. These values, expressed by Equation (6), represent the pressure acting on a particular area and are interpreted as the force acting on the hull.
The added resistance can be obtained by numerically integrating the second-order pressure acting on the entire surface of the hull. The integrated pressure in Fig. 20 is the force acting on a particular area of the hull’s bow surface. Although these values are not representative of the entire surface of the hull, they can reveal the effect on the added resistance by comparison. This is because most of the added resistance occurs at the front part of the hull [5]. Therefore, Fig. 20 clarifies that the nonlinearity of the added resistance depends on the wavelength of the incident wave or the speed of the ship.
In intermediate waves, as indicated by the circles in Fig. 20, the integrated pressure progressively decreases as the speed of the ship increases. Under this condition, the plunging breaking appears to become stronger as the speed increases, as confirmed by the P–R diagram of Fig. 14. The pressure drop occurs during the relative rise of the wave height. Therefore, the declining tendency of integrated pressure can be interpreted to be the result of the pressure drop due to the plunging breaking. In this regards, the added resistance can be overestimated if the added resistance is calculated without a special damping in the term associated with the relative wave elevation. However, it is difficult to determine the effect under the short and long wave conditions because the integrated values are small. Furthermore, it is not possible to completely exclude other influences, such as the effect of viscosity and stern shape [13–15].
Conclusions
The aim of this paper was to identify the nonlinear effect of the bow-wave breaking on the added resistance estimation for a fast displacement ship. Model tests of the fast ship were conducted to investigate the influence of the hull pressure and the relative wave elevation of the bow wave caused by the plunging breaking. This paper proposed templates that can be used to intuitively evaluate the nonlinear relationship between the pressure and the relative wave elevation, which significantly influences the wave added resistance.
Using the P–R diagram proposed in this study, this paper confirmed that the overturning detachment of the bow wave induces a pressure drop during the rise of the relative wave elevation. The nonlinearity occurring between the pressure and the relative wave elevation is closely related to the speed of the ship. Furthermore, it is concluded that the plunging breaking of the bow wave induces less wave added resistance compared to that calculated from the linear consideration owing to the pressure drop caused by the detachment of the bow wave. In addition, the process of the plunging breaking of the bow wave can be divided into three stages at which different physical phenomena occur: the bow-wave development stage, pile-up and breaking stage, and bow-wave absent stage.
However, the results of this paper are not applicable to all types of breaking of the bow wave, as they are derived only for plunging-type breaking in the fast ship. In this regard, further research is necessary to establish the impact of spilling-type breaking on the added resistance quantitatively. The effects of turbulent generation and dissipation should be considered. If the understanding of the nonlinearity between the hull and the bow wave can be taken into account in a numerical analysis method, the reliability of the added resistance estimation can be improved.
Footnotes
Acknowledgements
The authors would like to thank the Maritime Research Institute Netherlands (MARIN) for making the model test results available.
Conflict of interest
None to report.