
Abstract
Background:
The wet-deck height and centre bow configuration in wave piercing catamarans are critical design factors which influence slamming occurrence and severity.
Objective:
In this paper, the wet-deck slamming loads and pressures acting on a 112 m catamaran with a centre bow were investigated in regular waves in two wave heights.
Methods:
A 2.5 m hydroelastic model with three alternate configurations of wet-deck vertical clearance was tested at a speed of 2.89 m/s (38 knots full-scale equivalent).
Results:
The results showed that at the instant of slamming the centre bow immersion depth relative to the undisturbed incident wave elevation was less than two thirds of the maximum immersion depth during the wet-deck slam event. The location of maximum slamming pressure was found to be in the range between 77% and 80% of the overall length from the transom. The relationship between the relative velocity at impact and slamming force indicated that slamming loads in the order of the vessel weight can occur for the parent design when the relative velocity at slam is about a quarter of the forward speed.
Conclusions:
Overall, increasing the wet-deck height was more beneficial for reduction of slamming loads and pressures in smaller waves than in large waves.
Keywords
Introduction
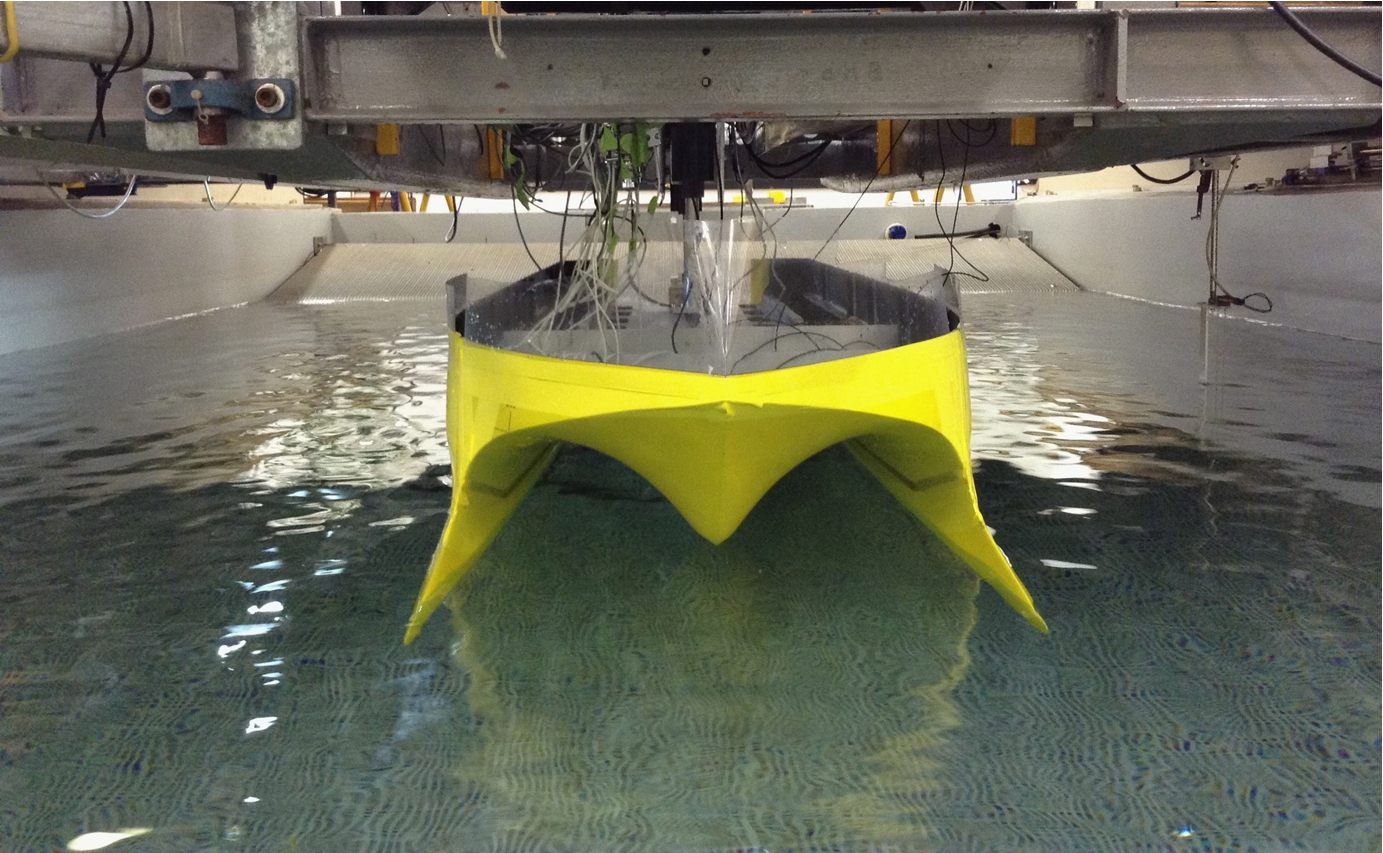
This paper reports on an investigation into the effect of the centre bow design and tunnel clearance on the severity of slamming loads and pressures acting on a Wave Piercing Catamaran (WPC) as shown in Fig. 1. Improving the seakeeping performance of high speed catamaran ferries was one of the earliest development stages of these vessels [4,12,15,37]. For WPC vessels, the role of centre bow is to provide reserve buoyancy in the forward area [20,24] where the demi-hulls are extremely slender to restrict pitch motions in extreme pitch-in scenarios. Therefore WPCs are less prone to deck-diving than conventional catamarans with a flat cross-deck bow structure [22,31]. However, wet deck slamming in the bow area [41,42] does occur for both conventional catamarans and WPCs. At high wave encounter frequencies, where hull motions are small, the centre bow can interact with the water contributing to full or partial arch filling resulting in bow loads which are typically of relatively small magnitude [20]. The arch filling or closure here is referred to as the short interval during which the water rises beneath the arch tops between the demi-hulls and the short centre bow and fills the cross section prior to the instant of slamming.

A 112 m Incat wave piercing catamaran (http://www.incat.com.au/).
Class societies have different approaches for the calculation of design slamming pressure for wave piercing catamarans. Lloyd’s Register rules for special service craft (SSC), for example, provide general empirical formulae to determine wet-deck impact pressure according to the operational conditions such as forward speed, wave height and relative impact velocity. These also include some centre bow design parameters, such as effective arch clearance in WPCs and protected centre bow area [25]. In contrast, Det Norske Veritas & Germanischer Lloyd (DNV GL) rules for high speed and light craft provide a general procedure to calculate slamming pressure acting on flat-wet deck catamarans, while the determination of local design impact pressure with special designs, such as WPCs with a centre bow, is referred to as other direct design methods such as model tests or full-scale trials [11].
The archway clearance (i.e. the vertical distance from the waterline to the top of the archway between the demihull and the centre bow) is a critical design factor influencing wet-deck slamming occurrence. The evaluation of slamming occurrence based on kinematic conditions is the classic approach [8,28,29]. For WPCs, Lavroff and Davis [20] provided a kinematic analysis for centre bow immersion and presented a two-dimensional criterion that indicates slamming occurrence in regular waves. This refers to the definition of a sectional arch filling height at which the water displaced by the centre bow and demi-hulls fills the gap between the arched wet-deck and the undisturbed waterline within the archways. Such a technique can be combined with seakeeping codes for high speed catamarans such as those developed by Davis et al. [7,17] to identify slamming occurrences in random waves as a consequence of extreme relative motion [5]. The design objective is elimination or minimisation of slamming occurrences at specified operating conditions. For WPCs and other catamarans, although increasing the vertical clearance between the water surface and the cross deck structure seems to be a possible solution to avoid slamming, the full elimination of slamming occurrence may not be expected because of the increased relative motions and water pile up in the enclosed parts of the cross deck structure between demihulls. For WPCs, the latter corresponds to the deck structure within the archways where the centre bow is surrounded by demihulls. Since relative vertical displacements in waves are also large in the centre bow area, it is less likely that slamming can be avoided when waves become larger [33,34]. If slamming cannot be avoided, the calculation of arch slamming pressure and evaluation of structural design with respect to the vessel’s operational conditions are necessary for class approvals [25]. However, it should be noted that the WPC design does virtually prevent deck diving which can lead to far more serious damage [22,24].
The published work for ship slamming loads and pressures is very broad, as reviewed by [18] and [40] and more recently by [43] and [10]. The most common theoretical approach for calculating slamming pressures is based on water entry models [14,44]. However, experimental techniques are still considered the best approach in the field while numerical CFD techniques are being developed. Examples of relevant studies for motion and wet-deck slamming in catamarans can be found in [1,2,6,9,13,16,26,27,35,38].
Despite the numerous investigations for WPCs as mentioned above, the variation of slamming pressure and loads due to the variations of wet-deck height and consequently archway clearance has not yet been fully investigated. Although it is evident from the relevant classification rules that the increase of the wet-deck clearance is a potential solution to reduce the impact pressure [11,25], such reduction, if achieved, cannot yet be quantified with certainty during the design process of WPCs with a centre bow. This is due to the lack of relevant experimental data or unavailability of any established theoretical/numerical approach in consideration of the effect of the wet-deck height on slamming loads and pressures. In this paper, the relationship between the relative velocity at impact and slamming force is investigated to provide experimental data to support early stage design considerations in WPCs.
The segmented catamaran model with an adjustable wet-deck configuration
A photograph of the 2.5 m catamaran model (with a scale factor of 1:44.8) used in model tests is shown in Fig. 2. Figure 3 shows a schematic view of the model showing the location and type of sensors installed, including load cells, accelerometers and pressure transducers in the centre bow area. The model displacement was set to 27.12 kg, equivalent to 2500 tonnes at full-scale. Table 1 provides the model specifications, and a full list of the instrumentation is given in Table 2.
The 2.5 m catamaran model (HSM02) of the 112-m INCAT wave piercing catamaran.

Schematic plan view of the 2.5 m segmented catamaran model including the forward, aft and middle segments and the locations of sensors used for instrumentation. * LVDT: linear variable differential transformers, PT: pressure transducers, LC: load cells, A: accelerometers.
As shown in Fig. 3, the demihulls of the catamaran model within the aft, middle and forward segments are connected with longitudinal backbone beams, while the centre bow (CB) segment is only connected to the forward segment demihulls by two transverse beams. The centre bow segment was mounted on these two beams with two ATI load cells placed on the centre line to measure load exchanges between the CB segment and each transverse beam. In addition to the two ATI load cells, to account for slamming loads, two Brüel & Kjær accelerometers and an array of 18 Endevco piezoresistive pressure transducers (8510C series) were installed on the CB segment to measure slamming accelerations and pressures acting on the CB segment. Four short elastic links made from aluminium with similar cross sections were used to connect the segmented demihulls. The dimensions of the links were designed so that the full-scale whipping response at approximately 2.4 Hz in wet mode could be simulated in the model with a scaled frequency of 13.8 Hz [21,23].
Two wave probes were fitted below the carriage to measure the variations of water surface at two positions during the test. The first point was aligned with the model LCG, and the second point was 1 m forward of the LCG. Both wave probes were offset from the model centerline by approximately 1.35 m on opposite sides. Using video recording and also the recorded data, it was found the measurements could mainly be used for wave phase rather than the amplitude. The moving wave probes consisted of two slender cylindrical rods supported by an aluminium backbone which was partly submerged. This resulted in unreliable wave profile in terms of amplitude and thus the amplitudes were assumed to be equal to that measured by a stationary wave probe [34].
Specifications of the model and full-scale catamaran vessel
Instruments used in catamaran model tests in regular waves
The wet-deck clearance of the model was designed to be adjustable, allowing an increase or decrease of the aft and middle deck segments, located between the transom and 33% of the overall length ahead of the transom and between 33% and 56% of overall length respectively. For wet-deck alignment with the forward segment, a new CB segment was designed and constructed according to the adjusted wet-deck height and centre bow design requirements [36]. The development and construction of the 2.5 m hydroelastic segmented catamaran model (HSM02) with the adjustable wet-deck feature followed broadly the work by Lavroff [19] and is fully described by Shahraki [30].
Three centre bow and wet-deck configurations were considered in this study. Figure 4 compares the cross sections of these configurations, designated as the high CB, parent CB and low CB. The CB was truncated at a longitudinal position of 76% of the length from the model transom. The keel of the centre bow is located slightly above the design waterline (DWL) shown in Fig. 4. The tunnel height is equivalent to the wet-deck height and the dashed red lines are given to show the variations of the centre bow in three parts (the first, second and last third, according to the arch top height).
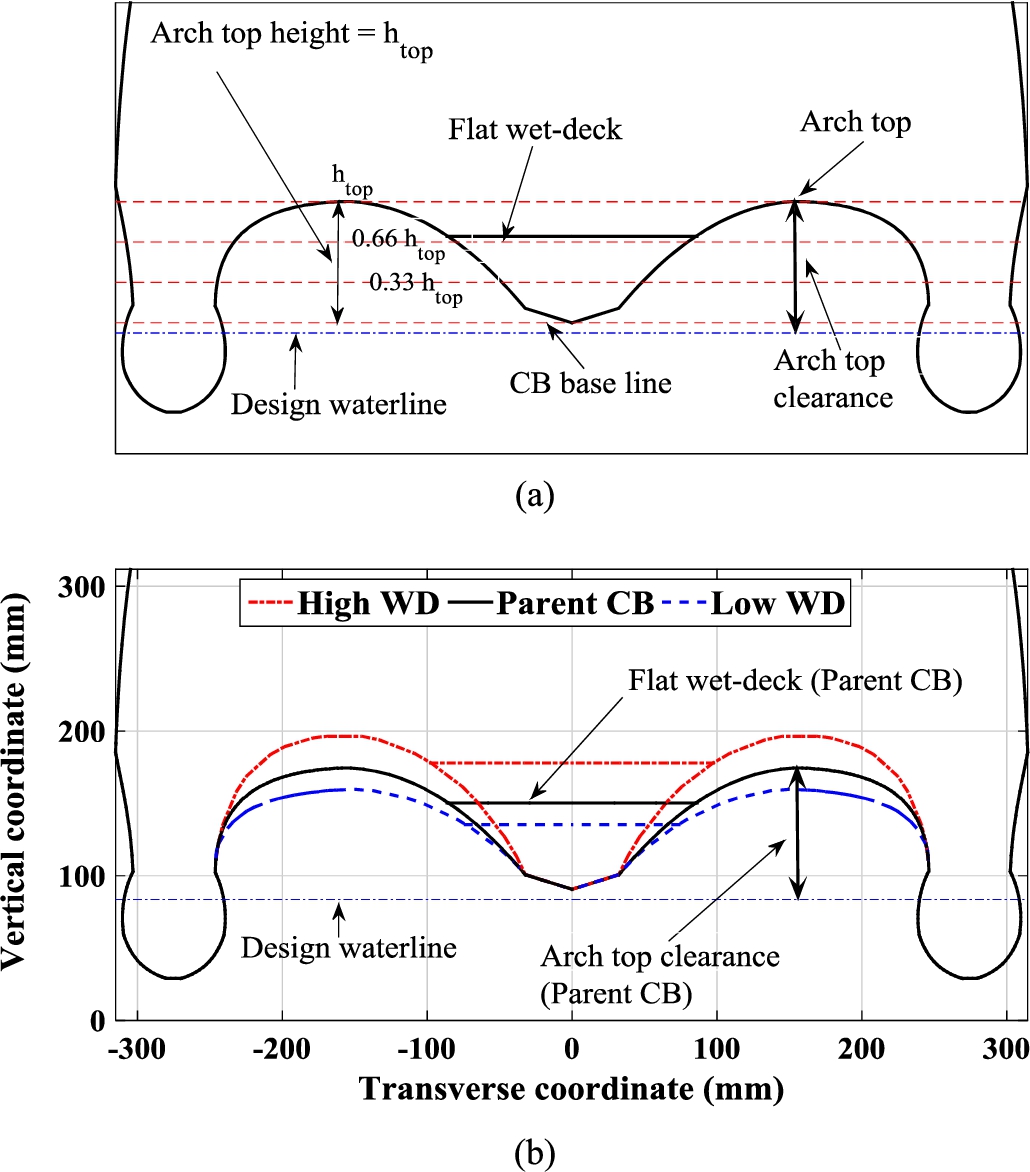
(a) schematic representation of a centre bow and wet-configuration, showing the flat wet-deck position, arch top clearance, arch top height (b) sectional representation at longitudinal position 1892 mm relative to the transom for the HSM02 model with the high, parent and low CBs.
As compared in Table 3, the three centre bows have the same length but different tunnel and arch top clearances relative to a still waterline located at DWL. The tunnel clearances of the high, parent and low CBs are defined at the longitudinal position of the centre bow truncation section and are full-scale equivalent to 3.5 m, 3.0 m and 2.3 m, respectively. From the transom to the centre bow truncation at 76% of the length, the catamaran has a flat wet-deck configuration connecting the demihulls, except for a small portion of the length just aft of the CB in which the arch configurations on both sides gradually become flat. Similarly, the arch top clearance is defined at the centre bow truncation section at the transverse location in which the arch clearance is highest. The tunnel clearance is constant for the main flat wet deck, but the arch top height increases from the centre bow truncation toward the forward sections of the centre bow. Therefore the reference section for the bow arch top clearance is the CB truncation.
Main characteristics of various centre bow and wet-deck configurations
*CB length: The longitudinal distance between the centre bow truncation surface and the centre bow forward tip.
**The CB length for all configurations is 30% of overall model length.
The vertical distance between the centre bow keel and the top of the arch is referred to as the arch height. The sum of the arch height and the centre bow keel clearance is also referred to as air gap (
Out of a total of 18 pressure transducers, 10 arch top pressure transducers were placed between 70% and 84% of the overall length from the transom while 4 inboard and 4 outboard transducers were placed between 76% and 80%. These locations are schematically shown in Fig. 3 in the plan view. Figure 5 also shows the vertical locations of the transducers for the parent CB. Longitudinally, the high and low CBs had similar transducer locations to the parent CB. Figure 6 shows the vertical locations of the arch top pressure transducers for different CB configurations, normalised by the draft at design waterline (DWL). In a transverse direction, the arch top pressure points are the horizontal tangent points, while the inboard and outboard pressure points have 10° deadrise angles.
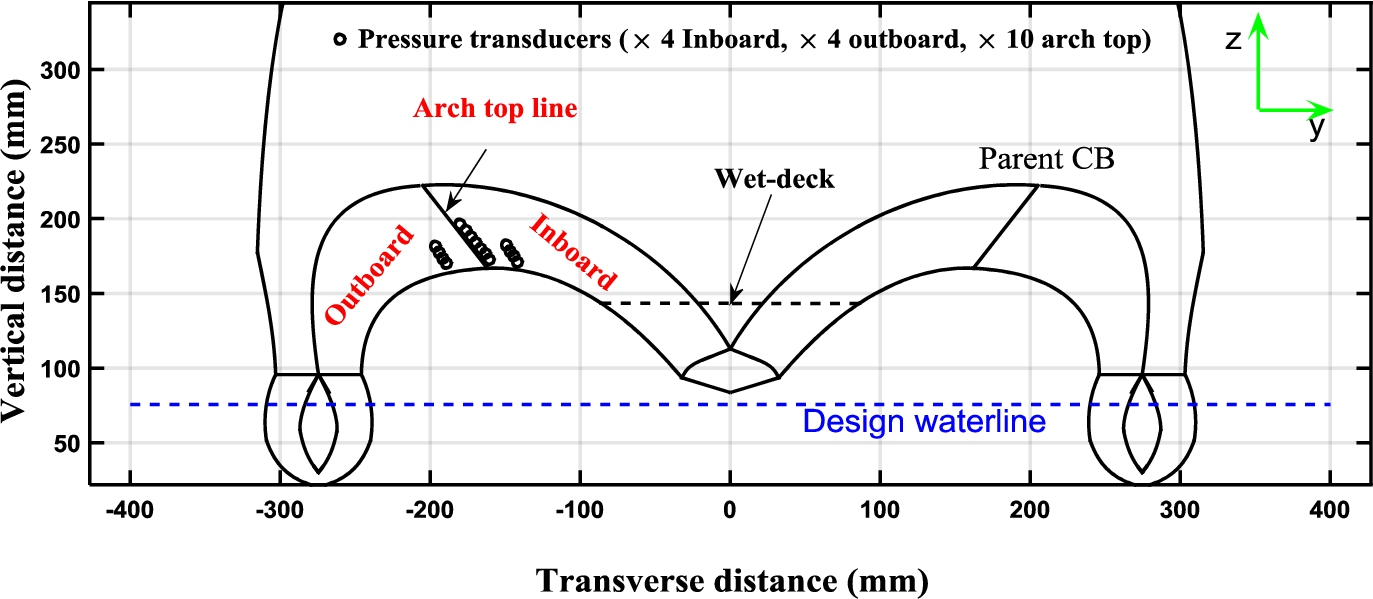
Locations of the outboard, arch top and inboard pressure transducers for the parent CB.
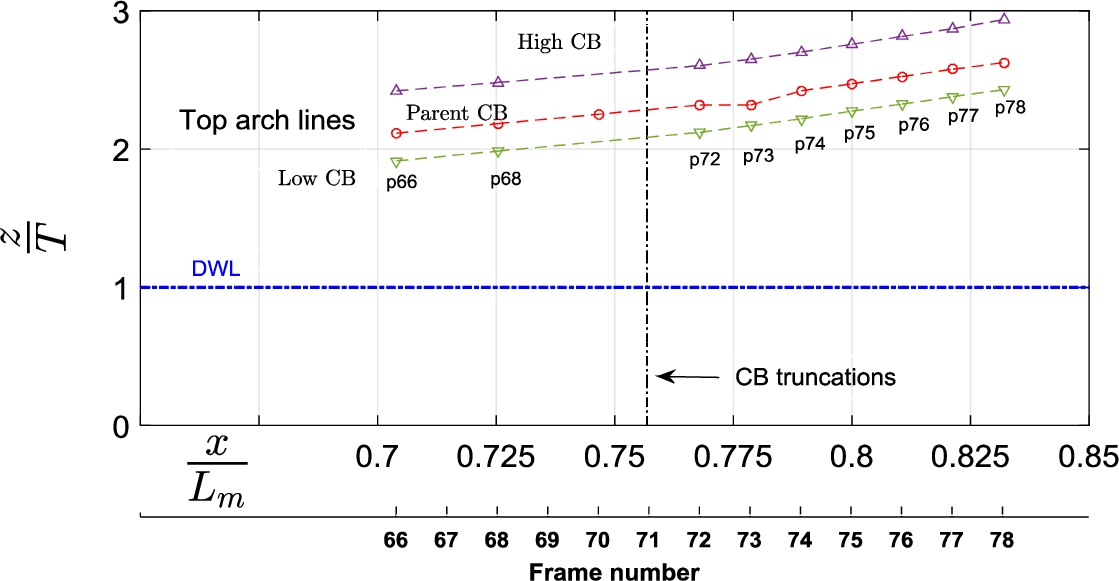
Vertical locations (z) of the pressure transducers for different CB configurations, normalised by the draft (T) at DWL.
Endevco DC amplifiers (model 136) were used for the signal conditioning of pressure transducers. These amplifiers have auto-zeroing and filtering features. The standard internal module (31875-1000) was used during the tests which uses a 4-pole Butterworth low-pass filter module with a corner frequency of 10 kHz. No software filtering was used when analyzing pressure data.
It is worth noting that Endevco piezoresistive pressure transducers have high sensitivity and high resonant frequency (320 kHz), making them appropriate for measuring dynamic pressures. They also have a stable characteristic over a wide temperature range and provide excellent linearity features. The face diameter of the pressure transducers is 3.8 mm. The effects of environmental factors, such as temperature, light sensitivity, air entrapment and water ingress on the measured responses were not investigated independently and further investigations are recommended. However, it is not expected that these matters would affect the performance of the transducers since the operational manuals make no reference to these aspects. Air entrapment may also affect the response of the pressure transducers, but this effect is not expected to be significant as the volumes of air would be small.
Model test conditions are listed in Table 4. Several model tests at various wave frequencies were performed for each test condition in the towing tank of the Australian Maritime College. Each condition here represents a series of tank tests at a given model speed and wave height and at multiple wave frequencies, ranging from 0.35 to 0.9 Hz. The data obtained from the stationary wave probe are analysed to obtain measured wave heights and wave frequencies which are listed in Table 5. Time records of heave, pitch and wave profiles, pressure and centre bow loads were used for peak data analysis. The number of recorded wave encounters for each run was between 10 and 30, depending on the frequency and the duration. Although different numbers of wave cycles were considered in the analysis for each run, the data analysis procedure included peak and trough variability for each single test, expressed by 95% confidence interval bounds of the mean value according to the sample number.
Model test conditions
Model test conditions
Number of runs, wave frequencies and wave statistics for each centre bow tank test
The tank is 100 m long, 3.55 m wide and the water depth was set to 1.4 m. Test conditions were sufficient to produce slamming. To measure rapid transient pressure pulses, a sampling rate of 15 kHz was initially used but this was reduced to 10 kHz because of occasional buffering issues during the tests. The 10 kHz rate, however, was deemed to be sufficient for measuring the transient slamming pulses according to previous experiments [3]. The buffering issues were possibly caused due to the limitation of the DAQ system when used in the multichannel scanning mode at a high sampling rate.

HSM02 catamaran (parent CB) model motions and centre bow immersion synchronised with slam loads for
Wet-deck slamming occurrence
In this section, the relationship between the centre bow immersion depth and wet-deck slamming occurrence in regular waves is investigated. Similar to previous work by Lavroff and Davis [20], the approach here is to evaluate the centre bow immersion relative to the undisturbed water surface
Figure 7(a) shows time records of the catamaran model heave, pitch, vertical bow displacement and encountered wave elevations at a reference section which is 77.6% of the overall length (1940 mm) from the transom, corresponding to the longitudinal location of the forward moving wave probe. The measured wave height is 89 mm and the dimensionless wave encounter frequency is
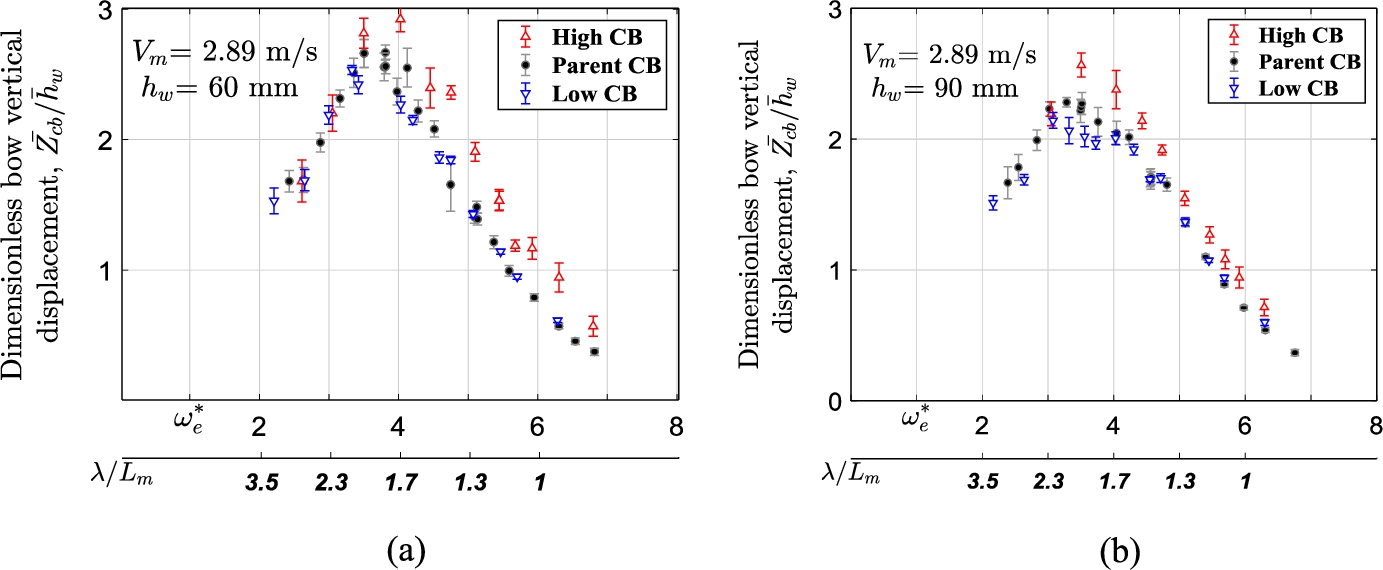
Dimensionless bow vertical displacement of the catamaran model with different bow and wet-deck configurations at a speed of 2.89 m/s in two wave heights: (a) 60 mm and (b) 90 mm.
Figure 7(b) shows time variations of the relative bow displacement to the undisturbed incident wave elevations at the reference section, followed by variations of centre bow immersion depth, arch top clearance and the total load acting on the parent centre bow. The bow immersion depth is derived by considering the undisturbed wave elevations above the keel of centre bow at the reference section. The arch top clearance is then derived by calculating the vertical distance from the bow immersion depth to the top of the archway between the demihull and the centre bow. More details can be found in [31].
The slamming instants, identified by considering the instants of peak CB loads, are shown by square markers in each subplot in Fig. 7(a)–(b). As can be seen, slamming instants are defined by the peak CB force, and correspond closely to the instants at which the pitch (bow down) and centre bow immersion are at a maximum or when the arch top clearance is at a minimum. The heave and wave elevation are out of phase at the slamming instants, heave decreasing and the wave elevation increasing. The CB peak loads show significant variation although the heave, pitch and wave elevations at the slam instants are quite similar. The variations of slam loads at a given relative velocity will be investigated in detail in Section 3.3.
Further analyses show that the increases in wet-deck and arch top heights from the parent CB to high CB do not result in slamming avoidance because the centre bow vertical displacement also increases due to increased pitch and heave motions. This is illustrated in Fig. 8, which shows the amplitude of vertical bow displacement (normalised by the wave height) as a function of dimensionless wave encounter frequency. The error bars show the 95% confidence interval for the normalised values, considering that the variation in non-dimensional bow vertical displacements is due to the variations in bow vertical displacements and amplitudes of waves. As can be seen, the dimensionless bow vertical displacements are larger in 60 mm waves compared to 90 mm waves. This indicates that the responses are nonlinear, which is quite typical. The amplitudes of dimensionless vertical displacement along the hull generally reduce with the increase of wave height due to the increase of local water-plane area.
In 90 mm waves, the range of wave encounter frequency at which slamming occurred was quite broad and similar for the three CBs tested, from
The analyses of vertical displacement at slamming with respect to the undisturbed incident wave surface can be extended from the LCG to other sections to identify slamming occurrences. This is shown in Fig. 9 which depicts the catamaran model and the longitudinal wave profile along its hull at arbitrary slamming instants at two wave encounter frequencies. In each subfigure, the curve labelled as “arch top” shows the highest point within the archways. The vertical distance between the wave profile and the arch top line therefore indicates the arch top clearance along the centre bow. As can be seen, the variation of the arch top clearance in the range from the centre bow truncation at 76% of the overall length up to aft jaw line point at 84% of the length is not significant.

Vertical model displacement and encountered wave profile at slamming instants for the catamaran model with the parent CB in
In addition, the minimum vertical clearance between the catamaran model cross deck structure and the wave profile occurs aft of the centre bow truncation. Therefore, both the wet-deck height and an effective arch height need to be considered in the slam identification process for WPCs relative to the undisturbed water surface. However, the effective arch height for slamming occurrence is frequency dependent.
Figure 10 shows that overall slamming can occur when the CB immersion depth at slam is in the range between 32% and 63% of the arch height. In this and subsequent similar figures, the boxes with their central line indicate the 25th, 50th and 75th percentile values, and the whiskers show the extreme observed values, excluding outliers, which are measured values that exceed three standard deviations from the mean. This outcome is broadly consistent with the approach of Lloyd’s Register rules for WPCs, which mentions that a maximum of two thirds of the arch height should be taken into account when using the design rules for slamming pressures. On the other hand, the observations by Swidan et al. [39] using high, constant vertical speed drop tests showed an immersion depth at slam just below 90% of the arch height for a bow section geometrically similar to the parent CB.
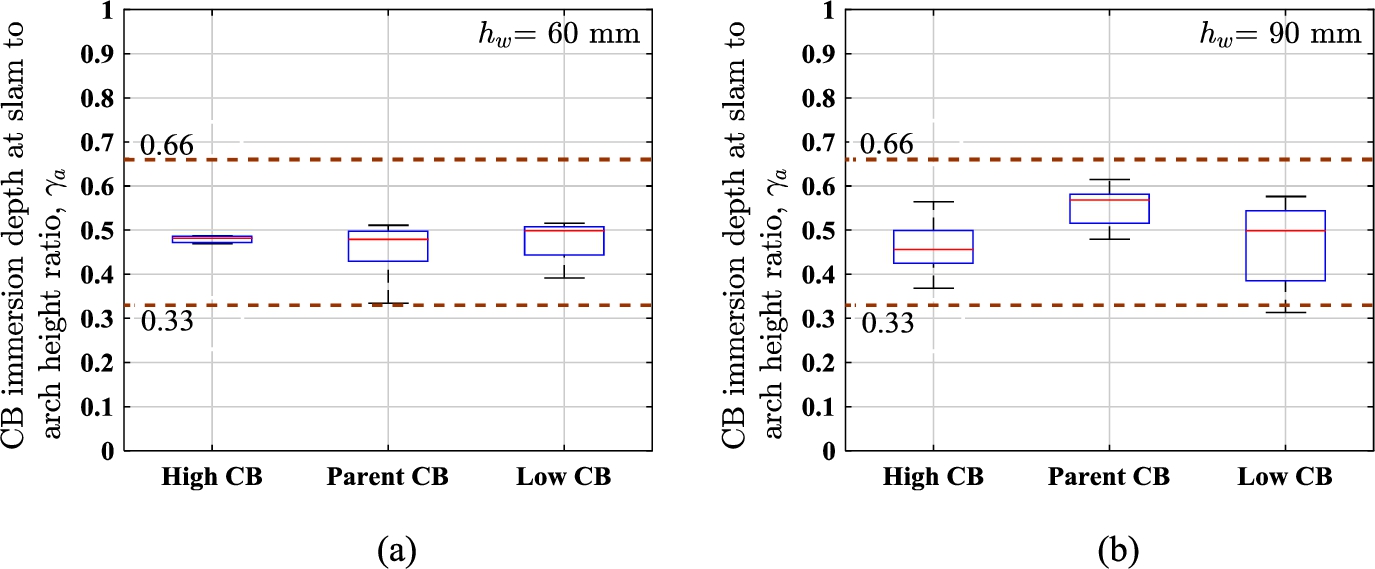
Box plot presentations of CB immersion depth at slam to arch height ratio, considering multiple wave encounter frequencies at each test conditions.
The discrepancy between the model scale tests and the drop tests for the immersion depth in which slamming occurs merits further investigations. The three-dimensional effects, high forward speed, the centre bow vertical velocity and wave-centre bow interactions are probably the main factors contributing to such discrepancy because the centre bow immersion and arch filling are strongly influenced by motion responses of the catamaran model as a function of wave encounter frequency [31].
Although the water pile-up and the bow wave have significant influence on the relative motion analyses for slamming computation, the analyses regarding the undisturbed linear waves were conducted here to show the centre bow immersion at slamming instants relative to the undisturbed wave profile. Since the slamming instants were identified using the external load acting on the centre bow, they are expected to be highly correlated with the time in which the pressure builds up under the arched wet-deck to reach a maximum. The time in which the measured arch slamming pressures begin to buildup depends on the location of the pressure transducers. However, the time differences between the starting of pressure buildup and slamming instants are expected to be very small and thus the centre bow immersion relative to the undisturbed wave obtained at slamming instants should be similar to that at the start of pressure buildups. The information regarding the centre bow immersion at slamming can be used in design in order to minimize slamming loads and pressures and also to maximize the centre bow buoyancy which reduces the risk of deck diving. More details on slamming kinematics and centre bow design can be found in Shabani et al. [31].
Sample time records of slamming pressures for the parent CB measured in 60 mm waves (
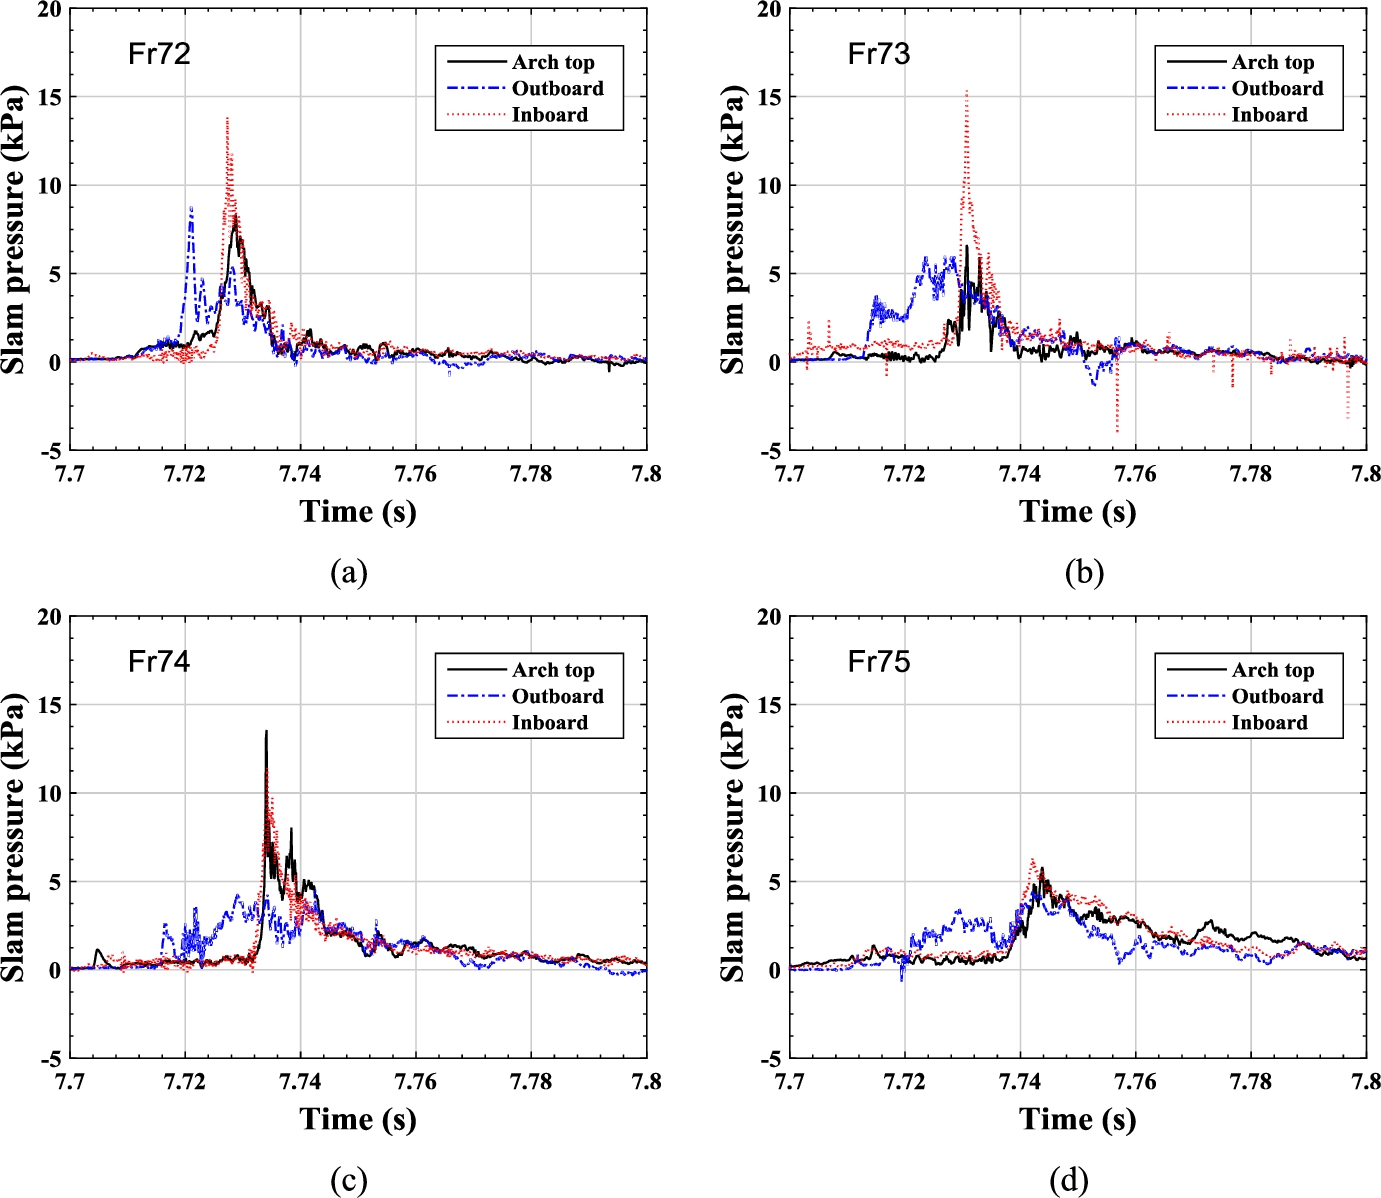
Sample time records of slam pressure at various arch locations (arch top, outboard, inboard) obtained for the parent CB configuration in 60 mm waves at 2.89 m/s model speed for dimensionless wave encounter frequency of
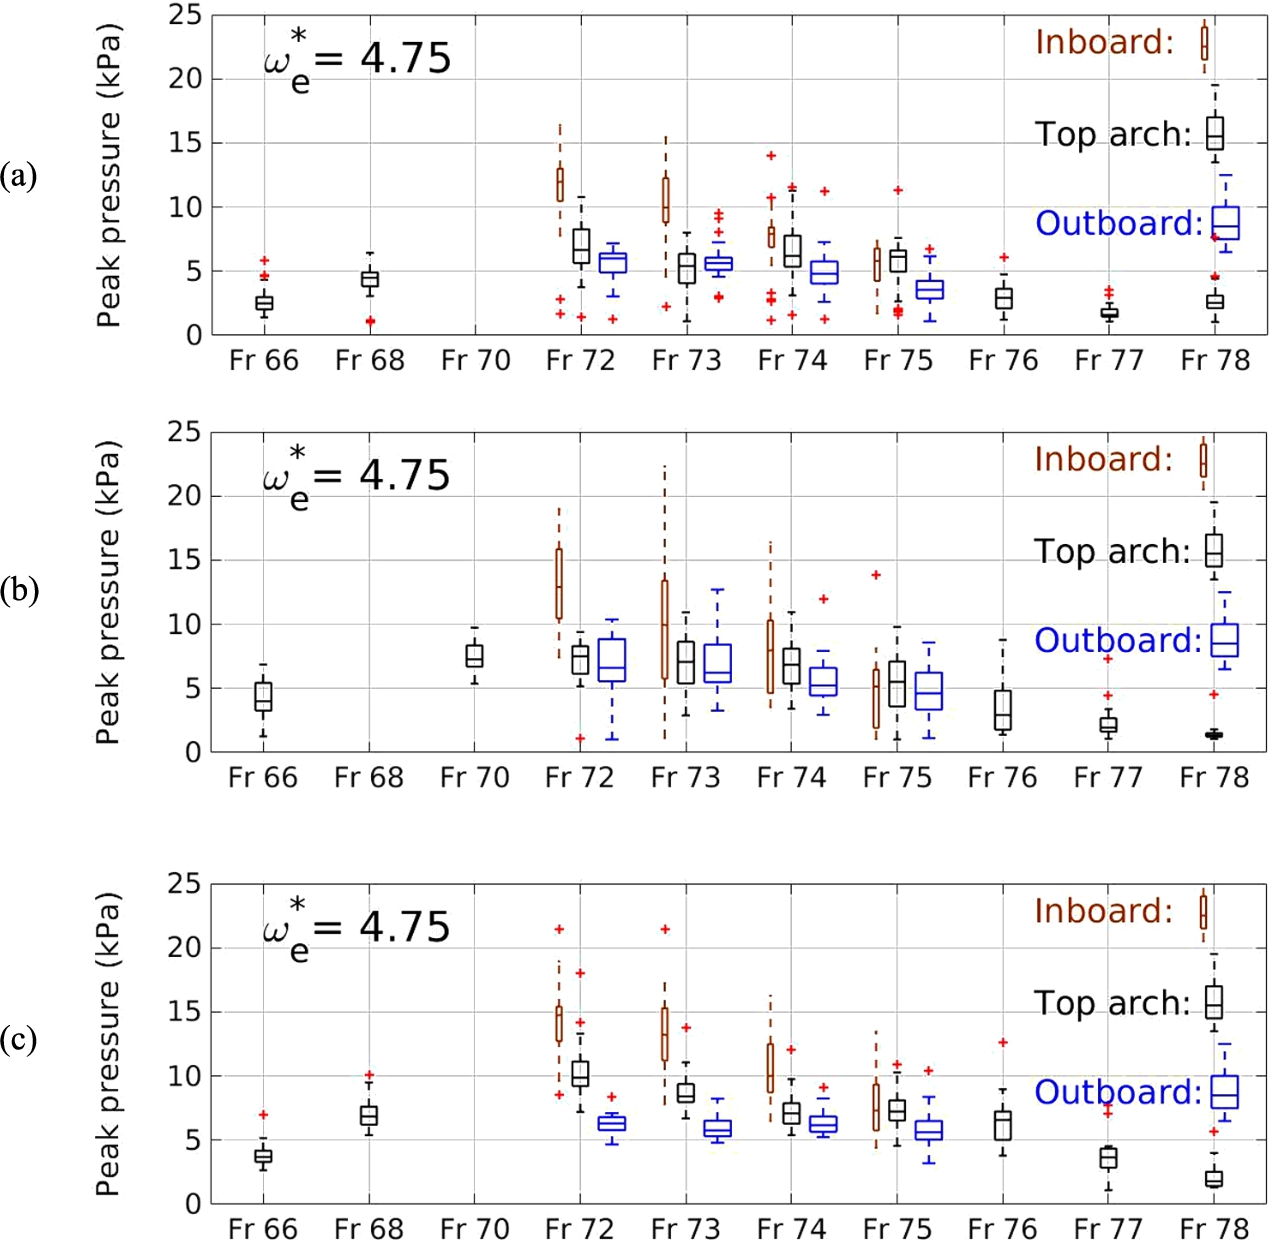
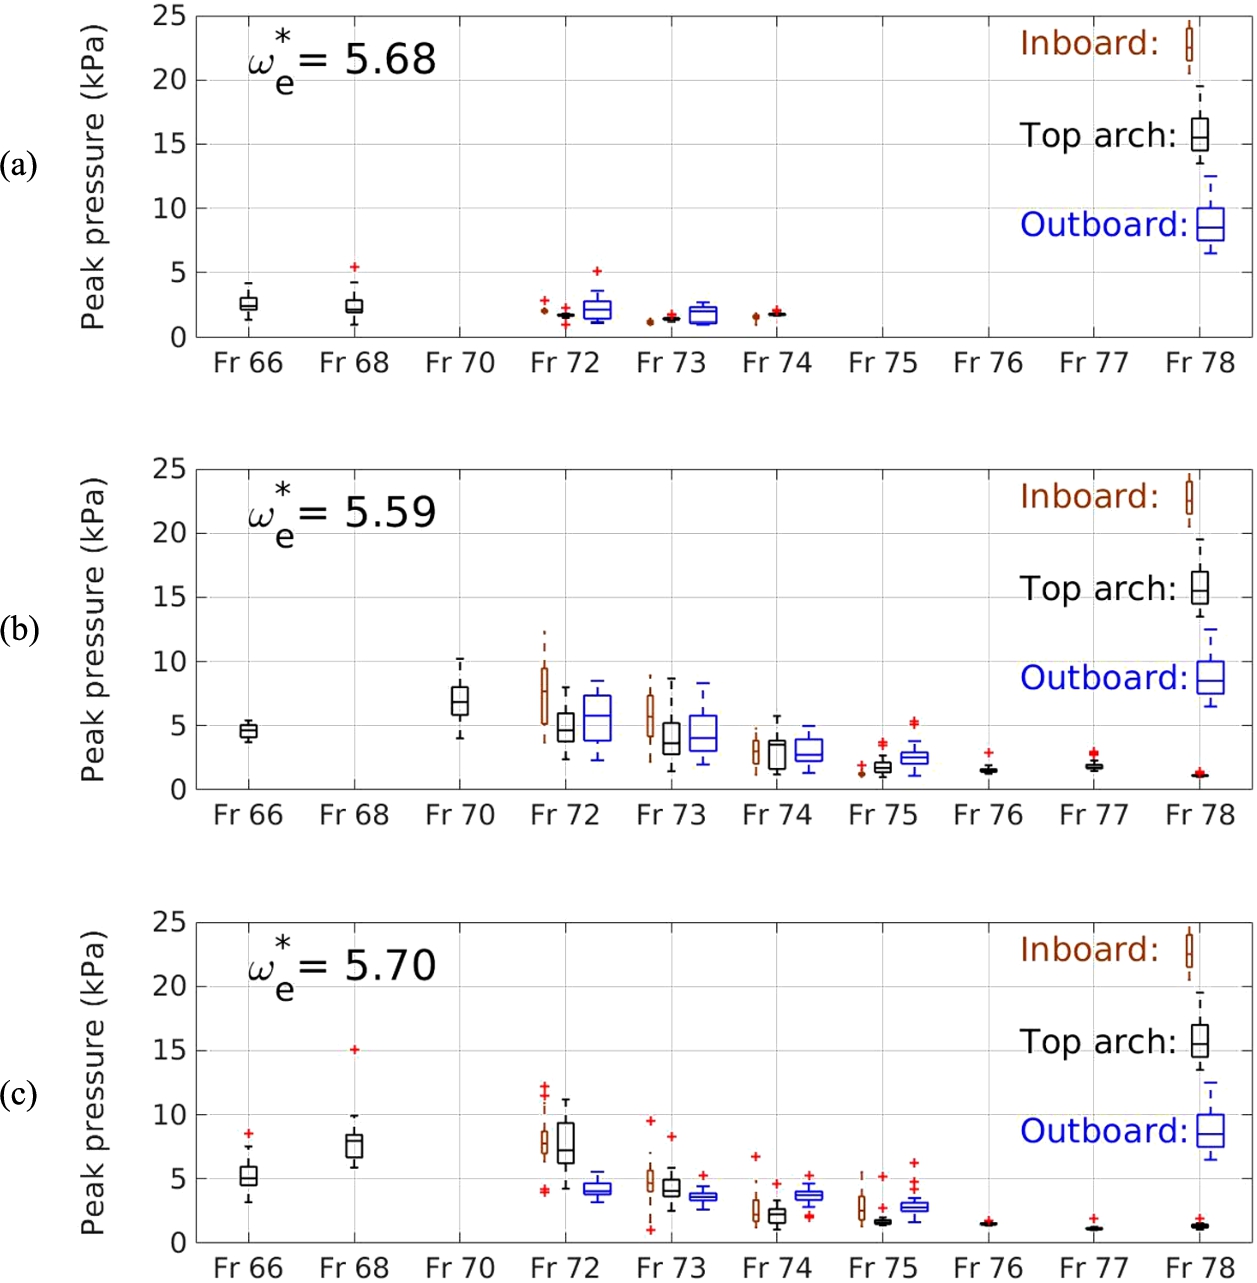
A wide range of variability in peak pressures was also observed across multiple slamming events in a single run. Figures 12 and 13 show the distribution of peak pressures for the high, parent and low CBs in 60 mm waves for
The locations of frames with respect to the centre bow truncation and the model’s transom
Positive (forward), Negative (aft).
As shown in Fig. 12, the high CB shows only a moderate reduction in slamming pressures compared to the other CBs at
As shown in Fig. 12(b) in nominal 60 mm waves, the parent CB experienced the highest peak pressure of 23 kPa, occurring at Fr73 (inboard) for the test at
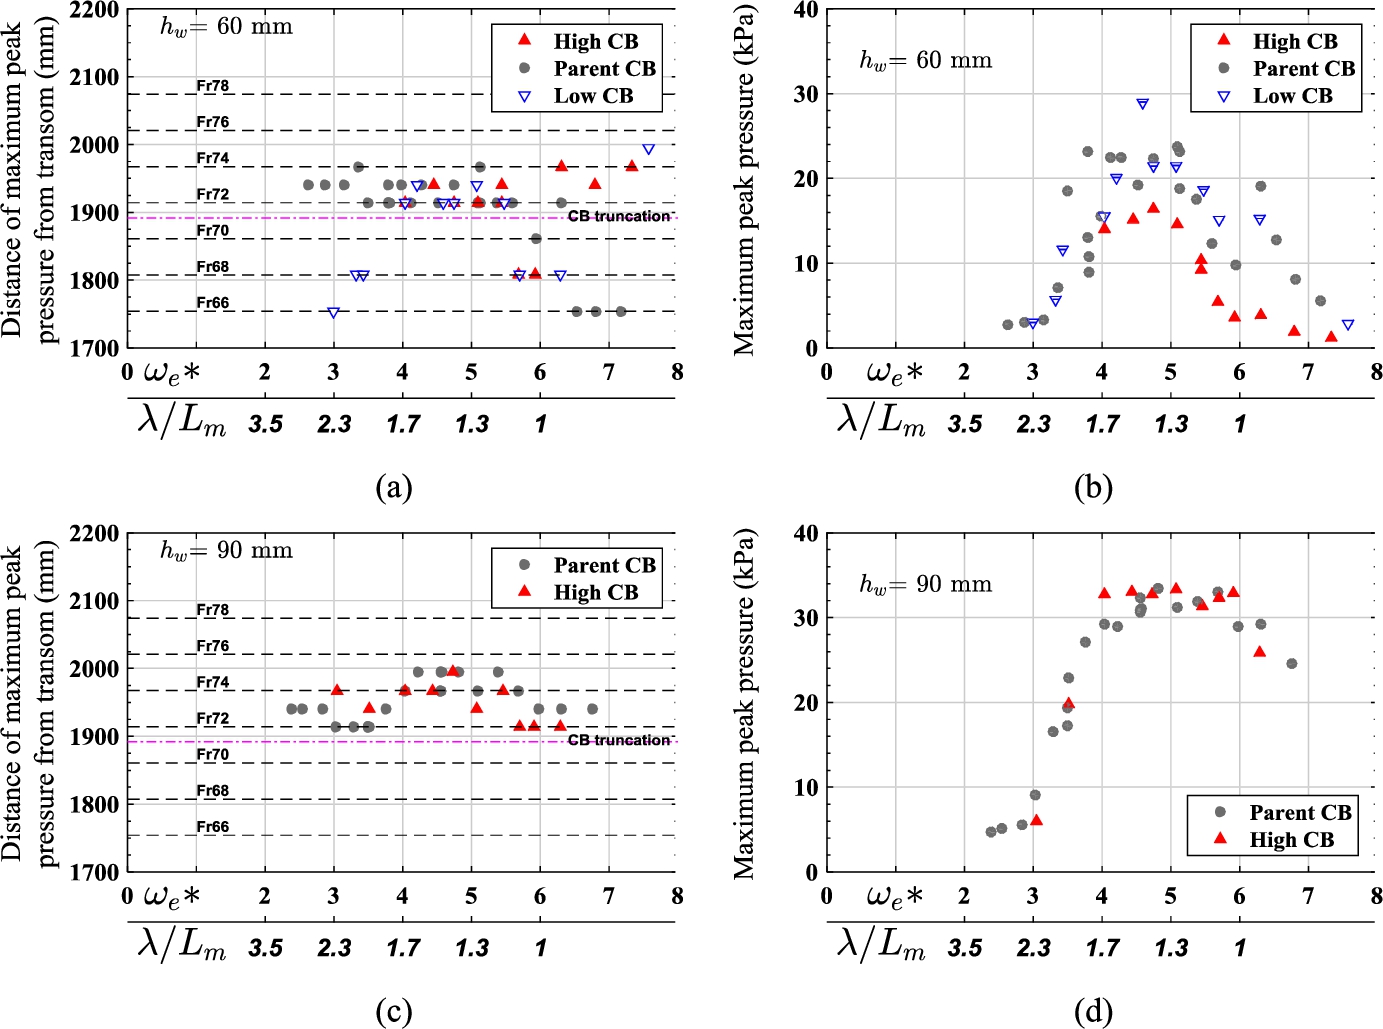
The location and magnitude of maximum peak pressures as a function of wave encounter frequency for various wet-deck and centre bow configurations; (a) and (b) the results in 60 mm waves for the low, parent and high CBs; (c) and (d) the results in 90 mm waves for the parent and high CBs. Fr 66 to 78 show the frame locations.
The results show that for encounter frequencies in the range
However, at higher frequencies the low CB did experience some slams aft of the CB truncation of around 15 kPa, which is not insignificant. The slamming aft of the centre bow can be explained by relative displacement analyses along the hull. In high frequency waves, i.e. short wavelengths, the wet-deck aft of the low centre bow was hit by incident wave crests, considering that the catamaran model heave and pitch amplitudes were small in short wavelengths. More details of slamming kinematics and the short-wavelength impact type are given in [31].
The maximum peak pressures for the high CB were significantly smaller than that of the parent CB in 60 mm waves. The difference in maximum peak pressure between the low CB and parent CB in 60 mm was not generally significant except for one specific point in which the low CB showed a slightly greater magnitude for encounter frequency in the range
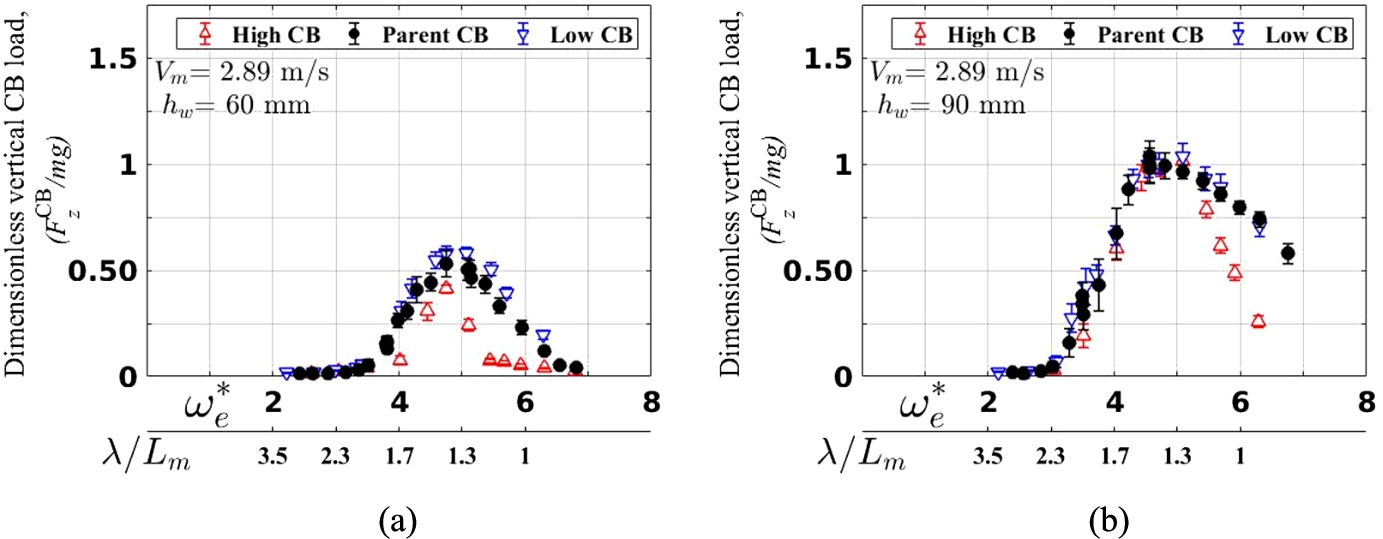
Dimensionless vertical forces acting on the centre bow segment of HSM02 catamaran model with different centre bows and wet-deck configurations at a speed of 2.89 m/s in 60 and 90 mm waves.
The CB segment acceleration due to global motions and local vibrations was calculated from data obtained by two Brüel & Kjær accelerometers. The acceleration signals were filtered using a 5th order low-pass Butterworth filter. After evaluation of the effect of the cut-off frequency on the mean peak acceleration, a low-pass Butterworth filter with 200 Hz cut-off frequency was applied to the raw accelerometers data. The CB acceleration then was used to calculate the CB inertia force that was required to determine the external force acting on the centre bow.
A similar filtering regime was also used for load cell data to maintain consistency. The effect of cut-off frequency on the mean peaks of the external force acting on the CB segment was evaluated and it was found that the mean peak force was stable for a filter range between 200 Hz and 300 Hz. A cut-off frequency above 300 Hz resulted in a slight increase in load peaks but a noticeable increase in acceleration peaks while a cut-off frequency below 200 Hz caused a notable reduction in peak values for both acceleration and load signals.
Figure 15 compares the total vertical loads acting on the parent, high and low CBs as a function of dimensionless wave encounter frequency in 60 mm and 90 mm waves. The total vertical loads, comprising slamming loads and the underlying (predominantly buoyant) CB force, are represented as a ratio model weight (
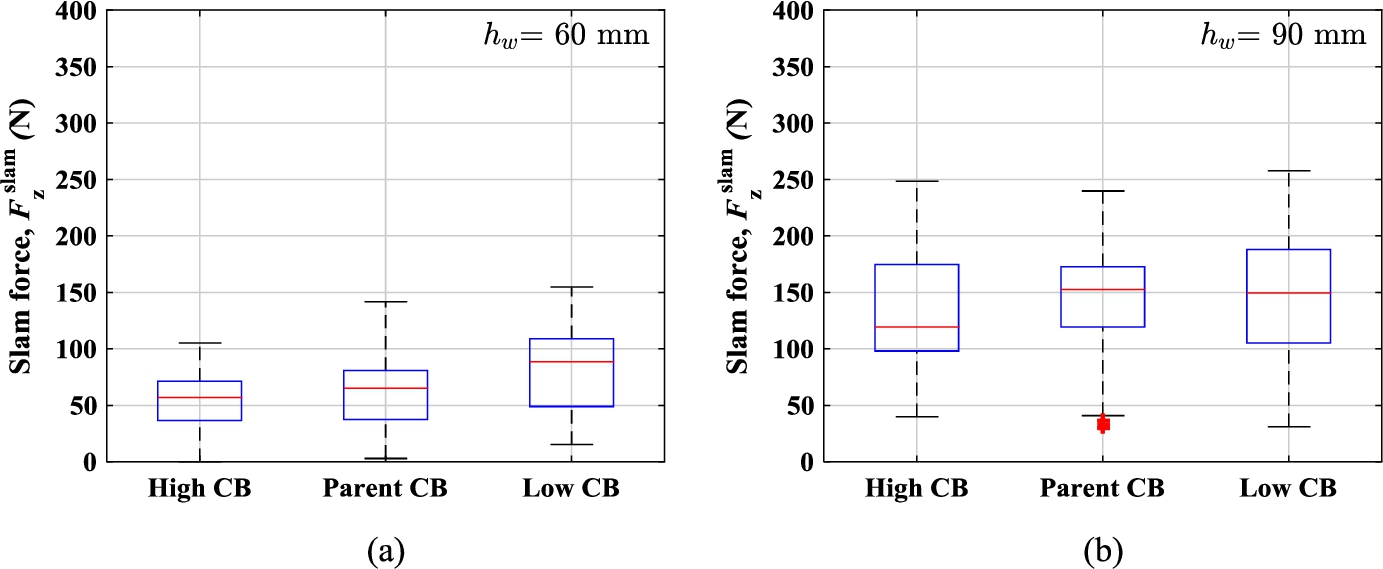
The distribution of vertical slamming forces identified for each CB in (a)
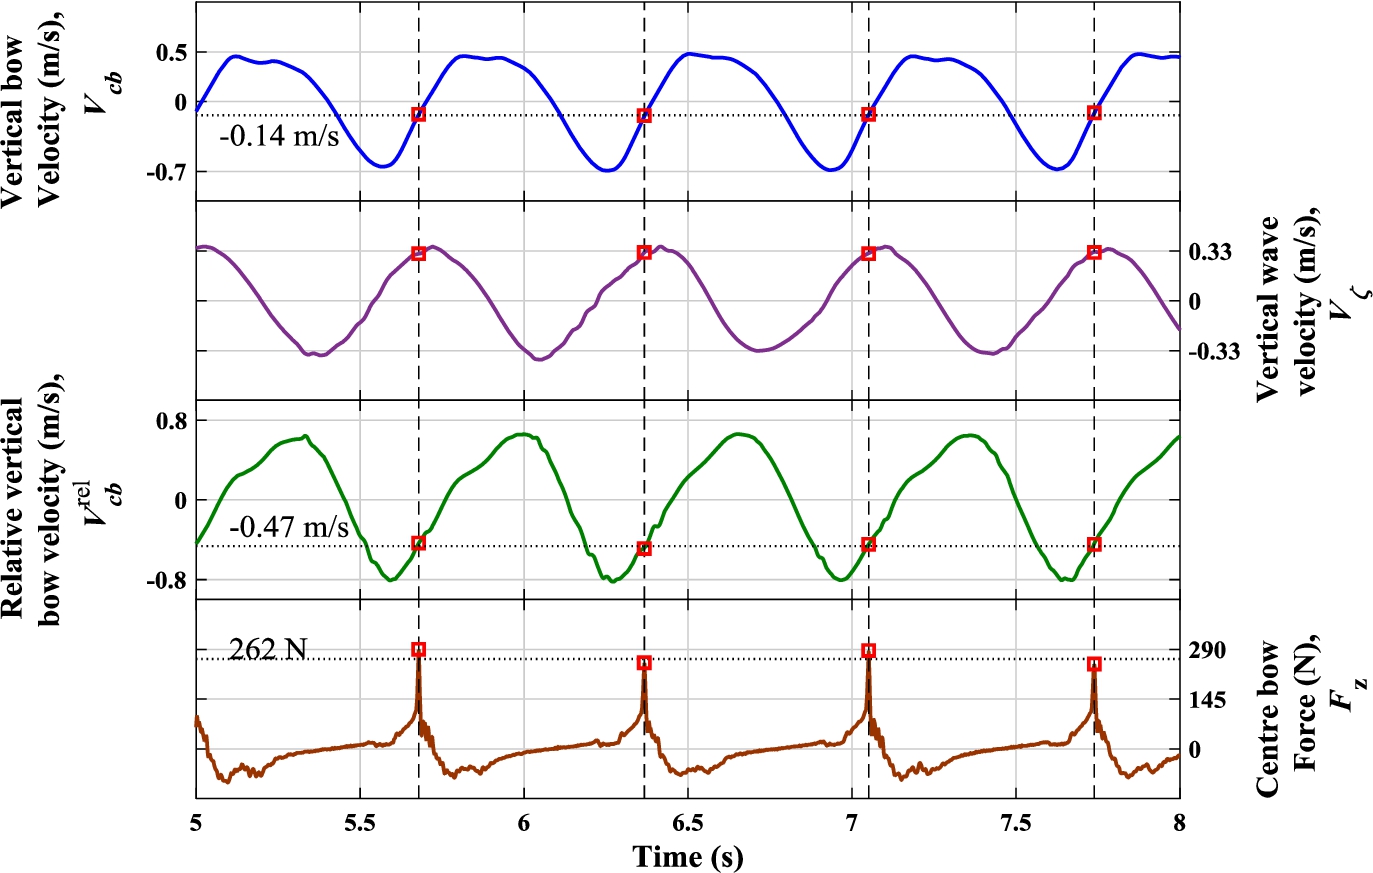
Vertical bow, wave and relative bow velocity for the parent CB for
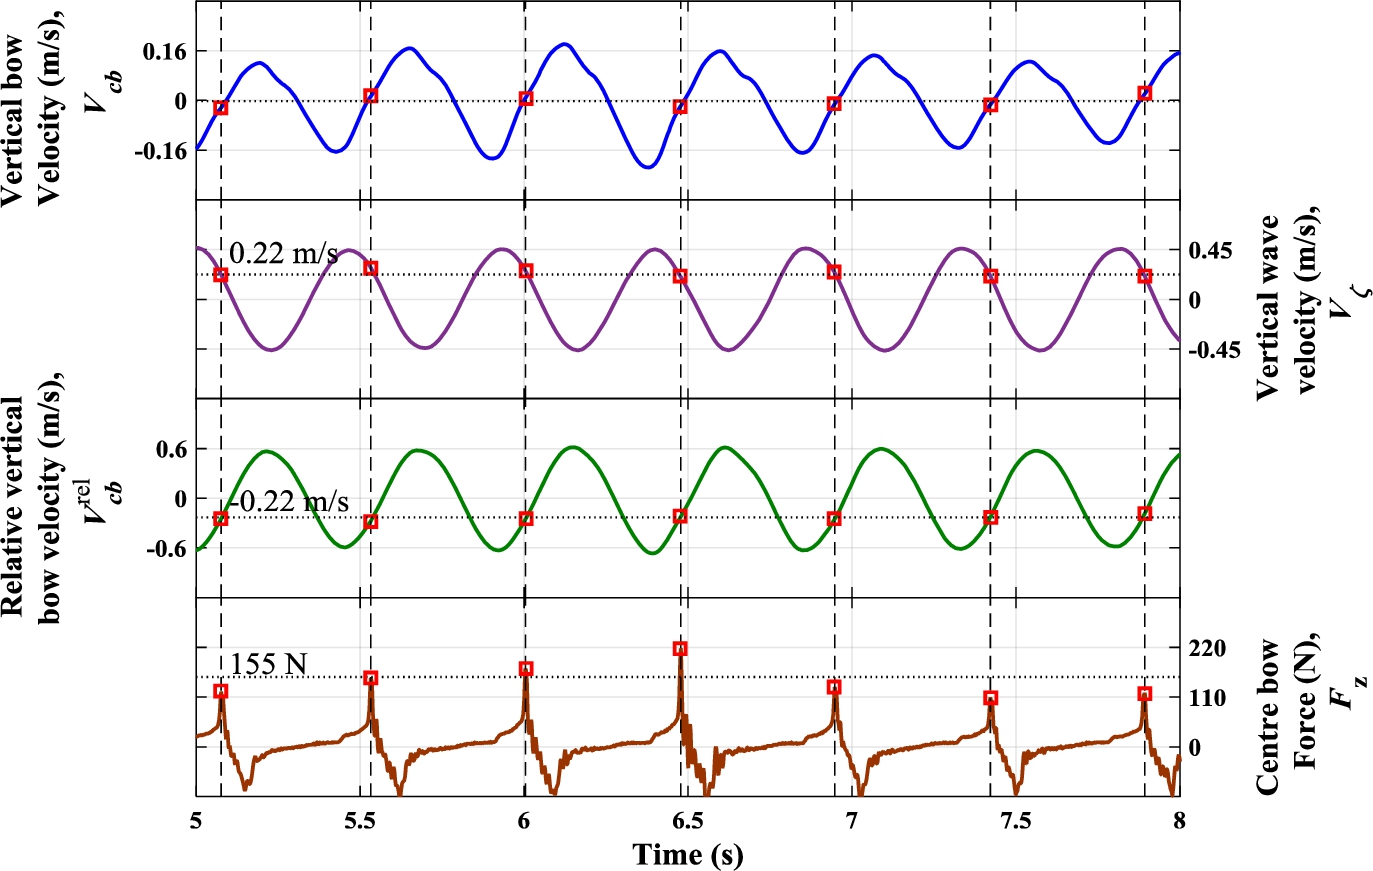
Vertical bow, wave and relative bow velocity for the parent CB for
Figures 17 and 18 compare the time records of the parent CB total forces with the corresponding centre bow vertical velocity, vertical wave velocity and relative vertical bow velocity at the position of the forward wave probe (77.6% overall length) for two dimensionless encounter frequencies
It is worth mentioning that the encountered wave profiles measured by the moving probes were corrected for mean level and amplitude based on the data collected by the stationary wave probe. The mean level error does not affect velocity, and phase error was negligible, but it was assumed that a reliable relative velocity, to a certain degree, was able to be derived from the measurements. More details on wave measurements are provided in Shabani et al. [31,34].
The application of the centre bow relative velocity at slam for the prediction of the slamming force can be valuable when, for instance, an analytical prediction code is available for the motions, and conditions leading to slamming occurrences are embedded in it [5]. An alternate approach is to use the maximum relative velocity prior to the slam instead of the relative velocity at the slam. This method eliminates concerns about the identification of the slam instants, and provides an opportunity to find the maximum relative velocity based on the amplitude of relative vertical displacement and the wave encounter frequency. The successful implementation of either relative velocity at slam or maximum relative velocity prior to slam requires a strong correlation between the slam loads and the relative velocity. A more detailed approach for estimation of slamming loads as a function of relative velocity at slam in random waves is presented by Davis et al. [5].
Considering the time records in Figs 17 and 18, it appears that neither the maximum relative velocity prior to slam nor the relative velocity at slam can describe the variability of peak CB loads within a single run. However, a good correlation may be found when considering multiple runs at the same condition.
Since slamming takes place almost instantly, the accurate measurement of the relative velocity and the choice of reference section where this is measured can be pivotal factors. Therefore, before investigating the degree of correlation between the CB slam forces and the relative velocities at slam, it is desirable to investigate the relative velocity at different longitudinal positions along the centre bow length. The time variations of the relative velocity at different longitudinal positions can also be important, as the slamming force is a consequence of spatially distributed transient slam pressures.
Figure 19 compares the temporal and spatial variations of the relative velocity at two different wave frequencies. The longitudinal positions range from 71% to 84% of the overall length from the transom. The time variations range from 100 ms prior to slam until the slam instant with relative times indicated by
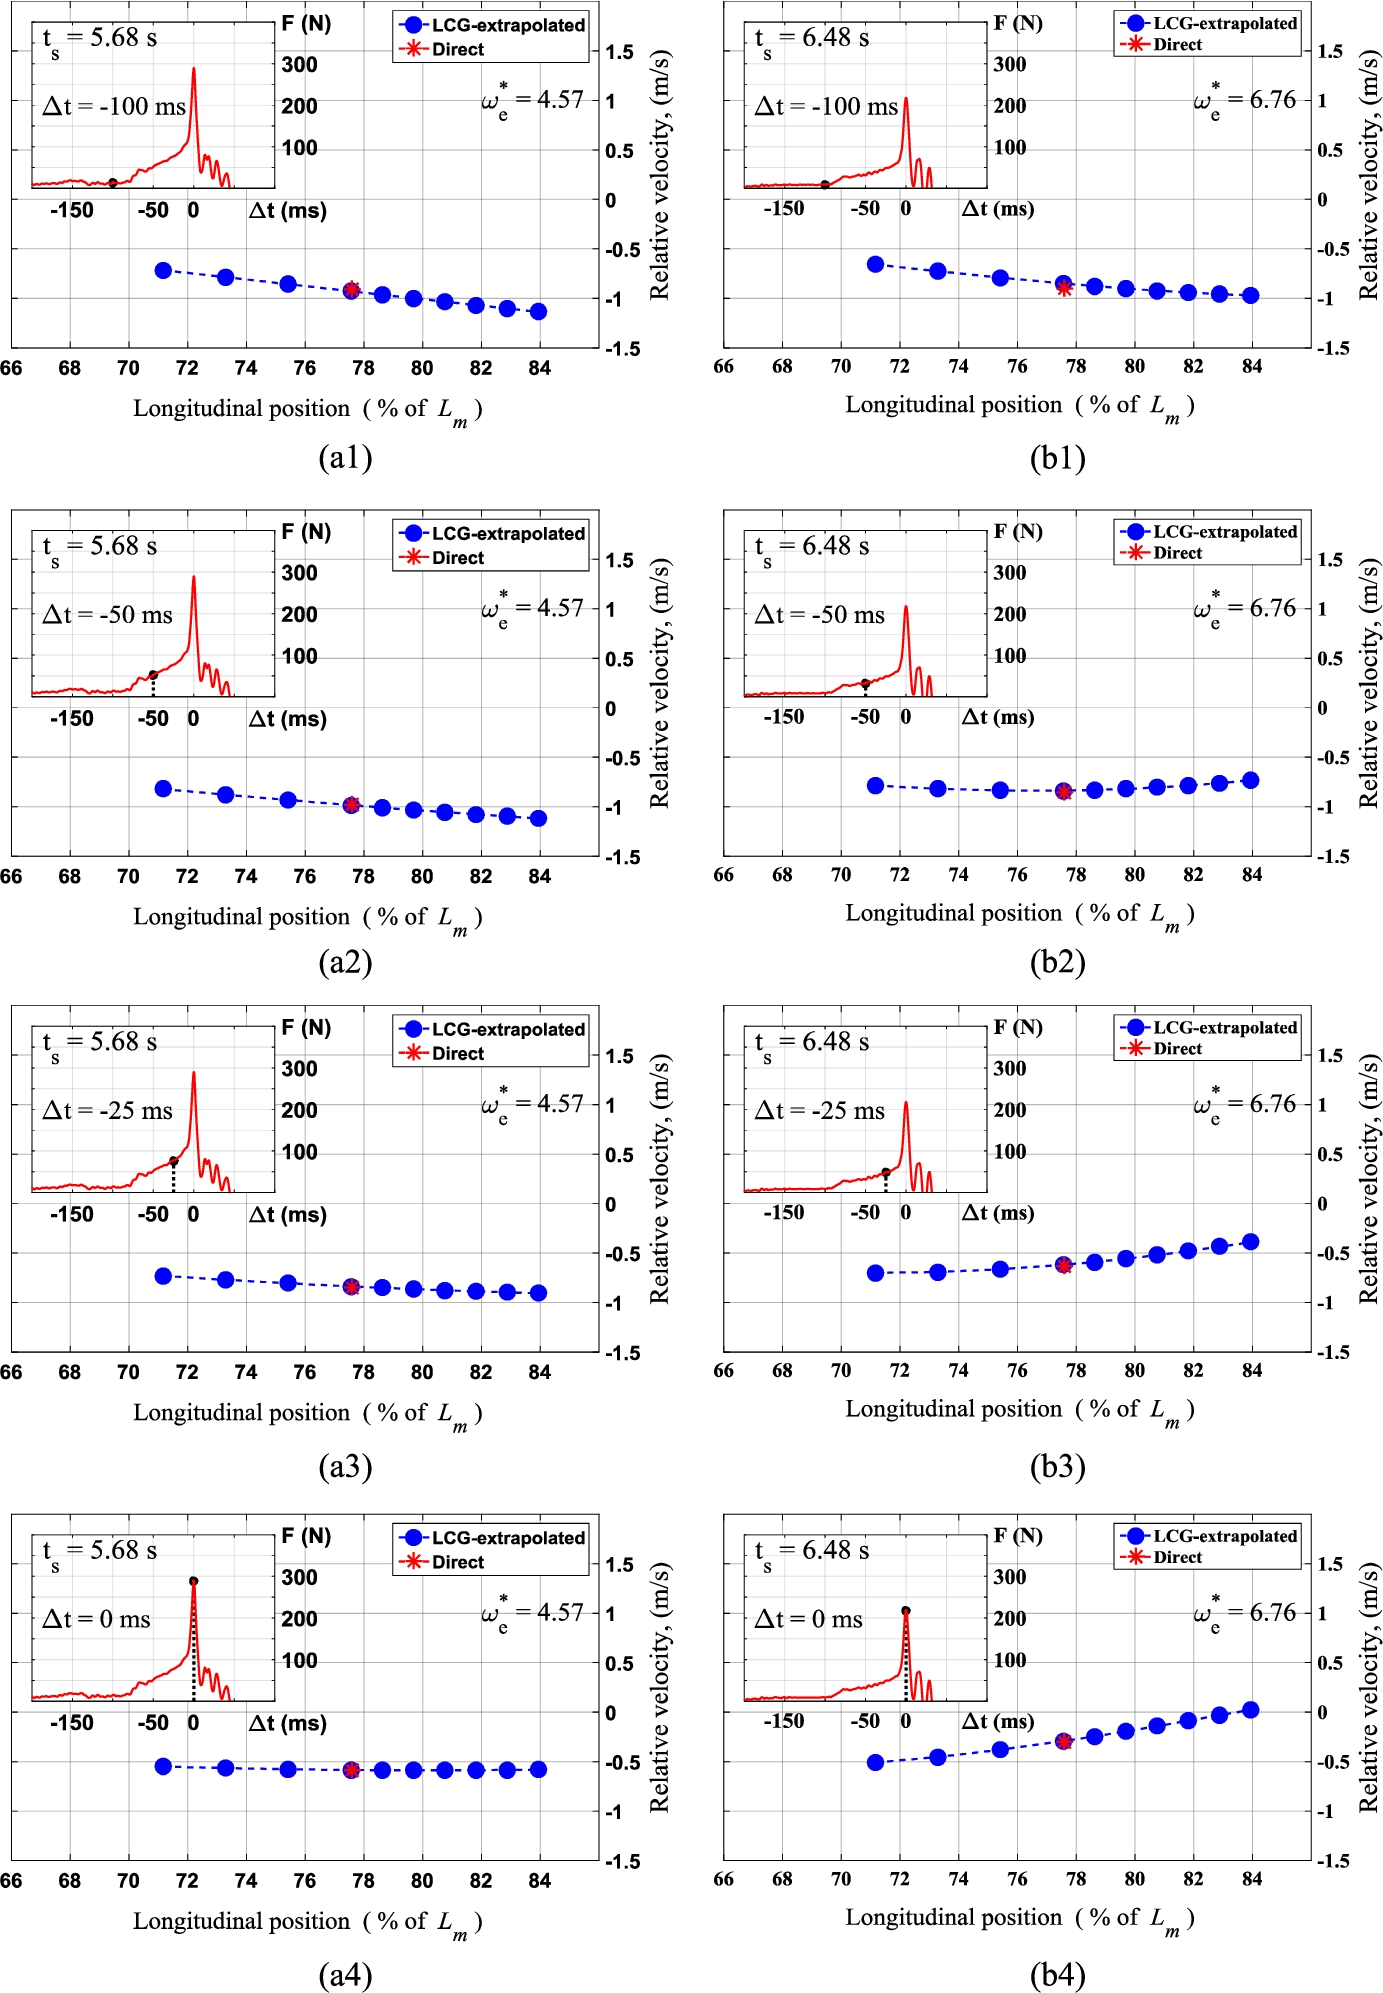
Relative bow velocity at different longitudinal positions along the centre bow at 100 ms, 50 ms and 25 ms prior to a slam and at the slamming instant for the parent CB for
A comparison of the actual time of pressure build up at various locations along the parent centre bow is given in Shabani et al. [32]. It was shown that the outboard, arch top and the inboard pressure transducers peak at different times and locations but within a duration of about 20 ms, in which the measured bow force also peaks at approximately halfway through the time interval. The actual CB immersion over this period is certainly greater than that shown in Fig. 10 because actual CB immersion depth at slam to arch height ratio is expected to be close to 1 in that very short period. The relationship between the actual relative bow velocity and that presented in Fig. 19 (using undisturbed wave profiles) is not known however.
As can be seen in Fig. 19, the magnitude of the relative vertical velocity at 100 ms prior to slam increases in magnitude towards the bow for both wave frequencies. Since the centre bow at this time was at the early stage of the water entry, this scenario can be expected for the maximum relative velocity prior to slam. The maximum relative velocities were found to occur between 110 and 100 ms prior to slam in these cases. The magnitudes of the relative velocities at different locations decrease as times approach the slam instants for both frequencies. However, it appears that at
Results provided in Fig. 19 also indicate that at
This analysis of the relationship between the slamming force, the relative velocity at slam and maximum velocity prior to slam was extended to all runs at all frequencies within test condition 2 (90 mm nominal wave height and 2.89 m/s model speed). Results are shown in Fig. 20 where relative velocities are calculated at 77.6% of overall length from transom. As can readily be seen, the relative velocities at slam have a much better correlation with slam forces compared to the maximum velocities prior to slam.
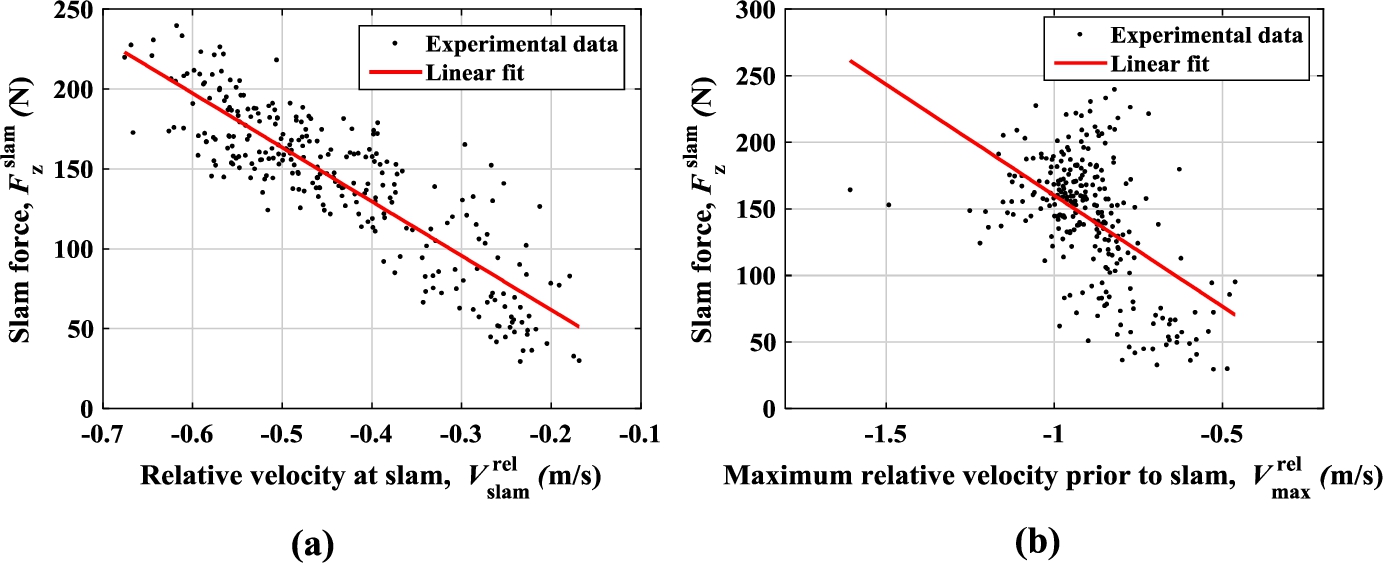
The correlation between slam force and (a) relative velocity at slam (b) maximum relative velocity to slam for the parent CB for
Figure 21 shows the same data as Fig. 20(a), but uses different markers to illustrate how data points collected at different dimensionless wave encounter frequencies are distributed with respect to the linear model obtained from correlation analysis of the slamming force and relative velocity at slam. It appears that the linear fit over-predicts the slamming force for

Distribution of experimental data points categorised into four intervals of dimensionless wave encounter frequency:
In light of this, it is desirable to investigate whether the relative velocity at slam can be used effectively to develop empirical linear models that can describe the slam forces for various centre bow configurations. Figure 22 summarises the linear fits of various CB configurations in 60 and 90 mm waves. The correlation coefficients (R) were calculated for all cases separately and it was found that except for the high and low CBs in 90 mm waves with
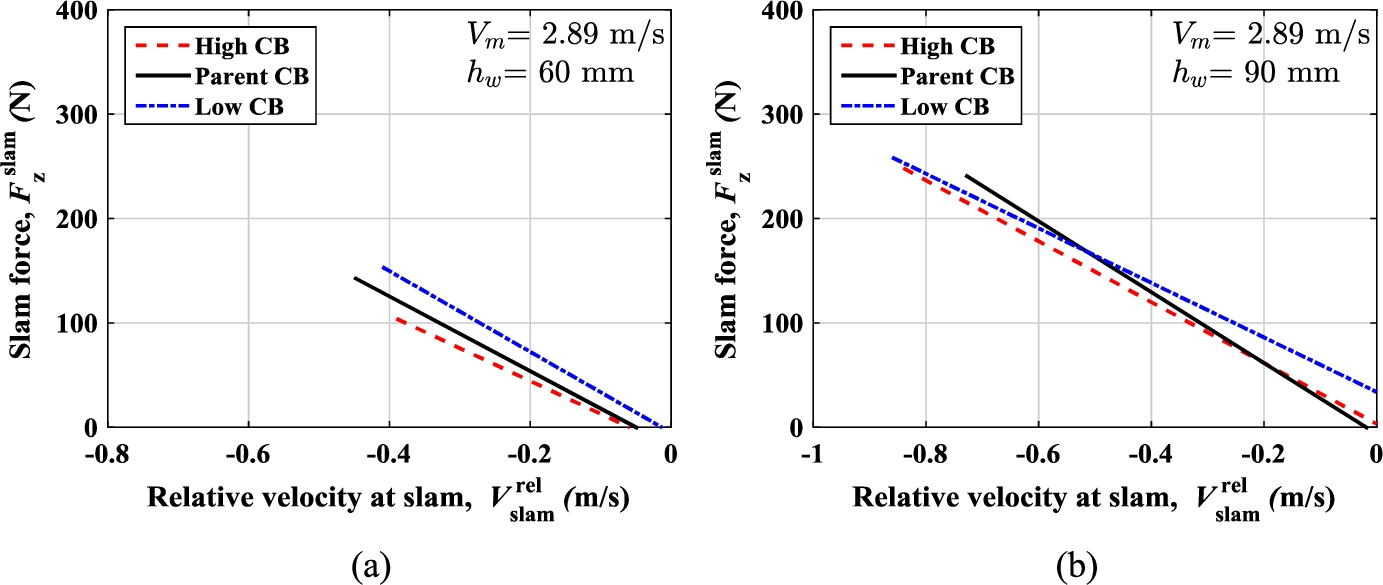
Comparison of the linear fits describing slam force as a function of relative velocity at slam for different centre bow lengths and wet-deck configurations for
The linear fits compared in Fig. 22 show the effect of the wet-deck and centre bow archway clearance on the severity of slamming at a given relative velocity. The linear fit for low CB, parent CB and high CB indicate that slamming load can be about 150 N, 125 N and 107 N, respectively, at a relative absolute impact velocity of 0.4 m/s, for a forward speed of 2.89 m/s and a wave height of 60 mm. The difference amongst the high, parent and low CBs regarding slam loads at a given impact velocity becomes smaller as the wave height increases.
Interestingly, the slam force for a given relative velocity appears to be relatively unaffected by the wave height. The main consideration here is not the wave height, but the maximum relative velocity at slamming, which in 90 mm waves is almost double than that in 60 mm waves. The distribution of slamming loads at a given relative velocity requires more investigations on various regression models and related quintile analyses by considering factors such as wave encounter frequency as discussed earlier.
The effect of wet-deck height on slamming occurrence and slamming loads and pressures acting on WPCs was investigated through a systematic model test programme in regular head waves at a speed equivalent to 38 knots at full-scale. Testing consisted of three centre bow and wet-deck configurations, designated as low, parent and high CBs for a 2.5 m segmented catamaran model.
The slamming occurrence was analysed by considering the immersion along the centre bow relative to undistributed incident wave profiles reconstructed from wave measurement at the LCG of the catamaran model. Slamming instants were identified by considering the peak slamming forces. The results indicated that slamming occurs when the centre bow immersion depth relative to undisturbed wave profiles is in the range between 0.33 and 0.66 of the maximum arch height, and the wet-deck clearance at the centre bow truncation is at minimum.
The maximum peak pressures for the low, parent and high CBs were almost in the same range in 90 mm waves but the high CB showed a considerable reduction in slamming pressures compared to the parent CB in 60 mm waves. A similar trend was seen for slamming forces. The difference between the parent CB and low CB in maximum slamming pressure was not generally significant in 60 mm waves, but the range and median of slamming loads increased with the decrease of the wet-deck height. The highest slam pressures were observed in the range of
The relationship between the centre bow relative velocity and the severity of slam loads was investigated to determine the influence wet-deck height on the slam load-relative velocity relationship. This suggested that, in regular waves, linear regressions can be used for determination of slamming severity based on the relative velocity at impact obtained from motion analyses. However, the variation of slamming loads at a given relative velocity should be considered using multi-variable regression.
The results of the current investigation support the consideration of the effective air gap for arch top clearance as described in Lloyds’s Register SSC rules. However, further investigation is recommended for the evaluation of experimental slamming pressures in comparison with class rules. Since the scale factor (1:44.8) in this study was quite large, further investigation on the effect of air entrapment within the archways and during the slamming is recommended as the measured pressures could be affected by detail of the converging jets inside the archways. In addition, the centre bow effect on design loads and pressures has not been formulated in the rules provided by the class societies, and therefore more effort may be required in this area. More broadly, further investigation is recommended to identify the relationship between slam pressures at full-scale to that in the model test experiments.
The results presented in this paper do not consider the influence of the centre bow entry on wave elevation and use the undisturbed wave profile measurement in regular waves. More investigations are recommended in irregular waves using various centre bow configurations. In addition, all tests have been conducted in head seas and it would be of interest to undertake future model tests in oblique wave headings. It would also be of the interest to perform a series of tests for an equivalent flat wet-deck catamaran without center bow to define more clearly the role of the centre bow in improving the seakeeping characteristics of a large wave piercing catamaran.
Footnotes
Acknowledgements
This work was undertaken in collaboration between the University of Tasmania, Revolution Design and International Catamarans Tasmania (INCAT) through the support of the Australian Research Council Linkage Grant number LP0883540. The work of Dr Jalal Rafie Shahraki in the development and production of the hydroelastic segmented model is also gratefully acknowledged.