
Abstract
Crewmembers are exposed to high work pressure. Pressure on freight tariffs motivates cost reduction in manning and maintenance, whilst societal developments show decreasing tolerances towards incidents. In conjunction with the developments towards autonomous shipping, the need for continuous and unmanned inspection increases. Considerable progress had been made with respect to monitoring machinery condition, however, the hull structure is as relevant for inspection and maintenance. This will require enhanced inspection, i.e., E-inspection. For hull structure corrosion and fatigue are of main interest. The application of E-inspection, directs the work effort from the crew to the location of interest, at the right time. It gives also the option to monitor the health status of a ship from shore. This paper summarizes the E-inspection methods, as identified in the SAFEPEC European project, and how they will help the crew reducing inspection workload.
Introduction
Any inspection process is highly dependent on the human performance of the surveyor/inspector, independently of its active role in the procedure. If not directly involved in the in-situ inspection, he/she will be involved in the process of decision-making, i.e. deciding if a maintenance action will be required or not. This is particularly true even with the introduction of new systems and technologies to help in the inspection process, as is the case of drones and 3D systems, for example.
The inspection process is complex since it involves a significant number of factors that can affect the performance of the surveyor/inspector, independently of being a visual inspection or the application of any Non-Destructive Technique (NDT), as for example, ultrasonic, dye penetrant, X-ray or any other. These factors can be related to design issues of the vessel (e.g. size, structural layout), conditions of the area to be inspected (e.g. temperature, lighting), human performance issues (e.g. fatigue, training, motivation), among many others.
Additionally, another factor is the downsize of ship crews in the last decades – even more evident in large size vessels. Crew sizes have been declining on ships for many decades, due to many reasons, from technological changes and increase in efficiency, to political and economic circumstances. This has given rise to long-standing concerns about under-manning and overwork, which could compromise ship safety and operation, and lead to hazardous levels of crew fatigue [8]. The reality is that manning levels have been declining over the last 40 years, from about 45 crew members for a typical merchant ship of 15,000 Deadweight tonnage (DWT) down to 15 crew members ([15] cited in [8]). Such decrease has also significant impact on ship maintenance given that operational tasks – particularly bureaucracies – take up a significant amount of time leaving crews with reduced time to inspection of non-critical systems, as the structure. This means that the workload is an issue of crewing and management and has significant impact on the effectiveness of the inspection [2]. Structural inspection often requires specific means of access to certain locations, which may require considerable crew time to perform this procedure. Nevertheless, on board maintenance procedures must be carried out, as consequence of legal requirements such as the International Safety Management (ISM) Code to keep standards for the safe management and operation of ships and for pollution prevention.
In this context E-inspection is fast becoming a widely applied solution. Condition Based Maintenance (CBM) is already being applied by manufacturers on essential equipment in ships: main engines, auxiliary engines, steering gears, bow thrusters, cargo pumps and other critical systems. CBM uses the measurement data retrieved from those equipment, such as temperatures, pressures, accelerations and flows, which are amongst the parameters that can be monitored. Changes in these parameters indicate deterioration of the equipment and therefore the manufacturer(s) can arrange resources for their repair and maintenance. This is very important to reduce maintenance costs and potential downtime and is the driving reason for the on-board E-inspection of the ship structure.
The variability of waves and loading conditions induces in ships fatigue issues as a result of these high cyclic loads [7]. These fatigue issues are higher in certain ships types or given some sailing areas more prone to have higher wave loads. Being able to make the correct assessment of the current hull status of a ship is paramount, giving this variability of factors and the current search on ways to extend structures life span. Fatigue and crack growth in deck plating may lead to a weakened cross section, hence a more vulnerable ship [6]. Vulnerability is expressed by the probability of the still water bending moment and wave bending moment exceeding the load bearing capacity of the hull girder, i.e. failure as in breaking of the hull girder. The consequence is then loss of property, life or damage to the environment. Inspections, are currently being done at large intervals and do not reveal the degradation during such intervals [5]. Also the scope for inspection is tremendous and without guidance, some degradation developments may be missed. Altogether, that may lead to a false trust in the condition of the ship.
Current inspections are performed primarily when required by schedules of Statutory Authority, Class, owner and Port State. This means that it is always a condition of a certain moment and these moments may be separated in time up to 5 years. There are intermediate surveys, but they do not cover the entire ship. This means that the updates on the condition of the ship are also irregular and may involve a step change from “fine” to “poor”. Without the regular updating, your idea of the status of a ship may be four years old and not relevant anymore. Especially in case of unnoticed deterioration, an inspection may result in unexpected repairs and/or detention. A similar string of events may be compiled for corrosion related issues. Additionally, plate thinning, especially if localised, may lead to loss of watertight integrity and ingress of water or egress of oil (cargo or fuel). The development of ship hull monitoring systems can take advantage of the information being collected by structure health monitoring devices, ranging from strain gauges, fibre optic sensors, or any other [19]. The use of this continuous and remote inspection information will deliver data for the any risk models being developed allowing the assessment of the hull condition in real time.
The E-inspection concept within SAFEPEC
Description of SAFEPEC: Its background, goals and achievements
SAFEPEC promoted proactive safety in shipping by developing and delivering a unified risk-based framework built upon the analysis of historical data of casualties, near miss cases, deficiencies and non-conformities that are detected by various types of inspections (e.g. Port State Control – PSC) for an earlier identification of areas of “concern”. The risk framework follows the route from causes (degradation), via vulnerabilities (insufficient remaining structural strength for the expected loads), to consequences (severe damage to or loss of the asset) and addresses the effect of inspection, as well as the newly developed E-inspection [9].
Through new technologies and probability-based risk models, the project consortium created innovative ready-to-use techniques making ship inspections on safety more effective. The developed framework advises which ships to inspect, which parts to examine carefully and for what kind of defects. One of the main advantages of SAFEPEC, is the possibility to compare the risk levels between different ships of a given fleet under analysis, thus dealing with a larger group of ships, rather than developing a detail model for a single ship. This benchmark for a fleet establishes an average value of the risk for a sample composed by 100 ships, for each of the ship types under the project scope, so that the risk of ships can be compared to the benchmark.
The tool developed under SAFEPEC is at a Proof of Concept (POC) level and addresses two main areas of interest, namely, Hull Structure and Life Saving Appliances (LSAs), considering two degradation mechanisms, Fatigue and Corrosion. The selection of the two areas and degradation mechanisms is based on the scrutiny of the inspection and incident databases. Further, feedback has been received at various workshops and interview sessions around Europe, aiming to identify the main concerns of the leading maritime stakeholder’s groups, allowing the project to be aligned with the ship industry needs and concerns [3].
The project developed risk models with cause and effect analysis based on incident reports and expert knowledge. The risks were quantified through Bayesian Networks (BN) Models. Based on the availability of data, Container ships, General Cargo vessels and RoPax ships were considered. This selection was made to ensure that necessary specific data can be gathered for the different models forming the Risk Framework (e.g. from the Inspection to the Consequence Module for a given degradation mechanism).
The developed Risk Framework consists of four Modules, namely, Causes, Vulnerabilities, Consequences and Inspection. These will be described in more detail in Section 3.1 of the paper. The Risk Framework functionality not only allows the estimation of the overall ship risk in different categories, but also can present intermediate results obtained from each of the Modules for a specific ship as, for example, the estimation of the coating life time and corrosion wastage, in some locations within the hull.
The Modules are built up by various models and use information from ship databases. A software prototype was developed to enable the interoperability and coherent interpretation of different models and data sources with the aim of contributing to the early detection of a failure, either in the ship structure or in its equipment. This is achieved through the development of a Data Integration Module (DIM).
Based on the need to increase the inspection frequency and improve the inspection quality, albeit without increasing the workload, SAFEPEC aimed at developing E-inspection, the inspection of tomorrow. The ultimate mean to reach this goal is to apply sensor data into the risk modules. Sensors and data acquisition equipment are used in many industries, including the maritime industry. The popularity is increasing, largely due to their low costs. Among many other opportunities, this enables automated continuous observation of ship structures during their entire life without physically sending a surveyor to the ship. But without the proper data interpretation and transformation to useful advice or input for the risk modules, the benefits will be small.
SAFEPEC proved the concept of remote monitoring through developing two dedicated systems: one which deals with hull girder loading (to assess fatigue of the ship structure) and the other which deals with the deterioration of protective coating in (ballast) tanks. Fatigue was monitored continuously through on-board strain measurements, from which data was processed simultaneously, yielding accumulated fatigue damage. Coating deterioration was ‘observed’ through measuring the galvanic current which will run between an anode submerged in ballast water and the steel tank structure. None of the methods can claim a 100% reliability because observations can be erroneous, and circumstances may sometimes render the ‘observations’ unreliable. Therefore, the uncertainty related to observations that are representative for the integrity of the entire ship structure will be presented. This uncertainty however can be dealt by applying the rule on conditional probabilities, known as Bayesian Rule. Both concepts have been tested at sea.
Description of the systems
The systems as proposed in the SAFEPEC project have been installed and used on board ships. As these systems have worked and provided results, we describe the actual realisations in this section. For other ships, the exact realisation will differ, but the components and lay out do not alter.
E-inspection for fatigue
Strain measurements have been performed under operational conditions on a general cargo vessel named Flinter Rose, which is shown in Fig. 1. The vessel is a 5500 DWT general cargo ship of 101.5 meter length over all, mainly operating in short sea shipping trade in European waters, stretching from Turkey to the Baltic. The Flinter Rose was built in 2012 in Chowgule, India, under the IMO number 9521368.
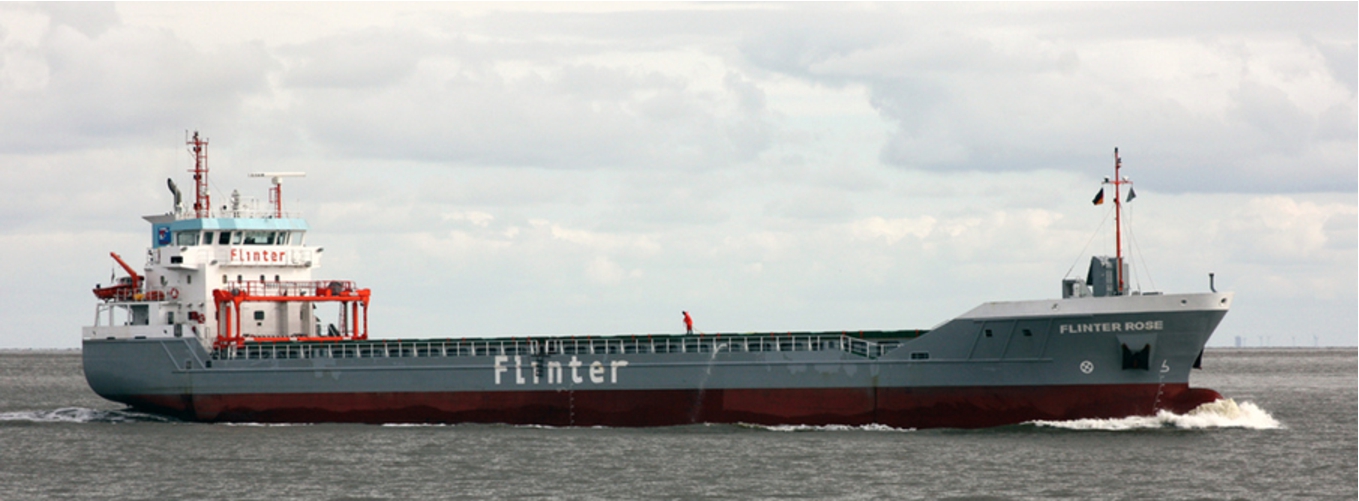
The vessel, named Flinter Rose, used for the strain measurements.
Monitoring system specifications

Side view of the Flinter Rose, indicating the location of the strain gauges, junction box and data acquisition system.
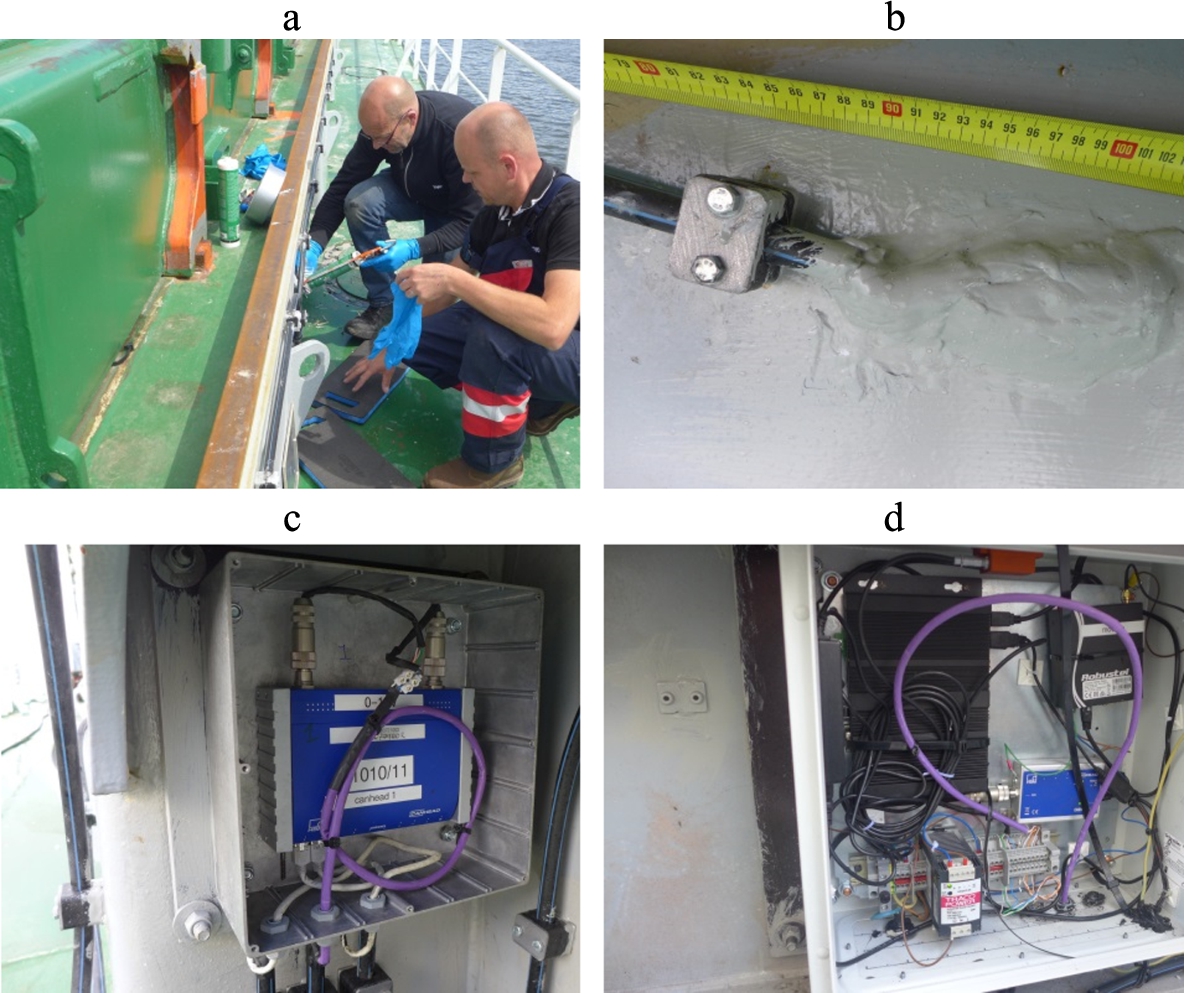
Installation of the measurement system on board (a), installed strain gauge at the coaming (b), junction box (c), data acquisition system and computer (d).
Details of the systems are provided in Table 1. The strains are measured near amidships, at the coaming, using two strain gauges at each side of the ship, as shown in Fig. 2 and Fig. 3. Figure 3(a) shows the installation of the measurement system on the vessel. A close up of one of the installed strain gauges, including protection against mechanical loading is shown in Fig. 3(b). Temperature compensation of the strain gauges is performed by a half bridge configuration. The strain gauges are electrically connected to a Canhead system located in the junction box, see Fig. 3(c). The junction box is located near the strain gauges, as shown in Fig. 2. The Canhead system converts the measured resistance to a voltage and digitize and amplifies the signal before it is sent to the data acquisition system (DAQ). The DAQ is located near the accommodation, as shown in Fig. 2. In the DAQ the measured voltage values are transformed into strain values. The strain values are logged by a computer. The computer is capable to store data and send it to shore when the ship is in the range of a Global System for Mobile communications (GSM) receiver. The DAQ and computer including its protective box are shown in Fig. 3(d).
Besides strains, also motions and the location in GPS coordinates of the vessel are measured and logged. Both the motion sensor and GPS device are located in the DAQ box.
Data is recorded at a frequency of 10 Hz, so impact responses such as whipping are not measured. For the proof of principle of the system, this was deemed sufficient. Whipping responses have a frequency of about 0.5 to 1 Hz as is shown in [1], for instance and can therefore not be recorded. On board the ship, rainflow counts are performed on the strain data. These data are sent to shore on a weekly basis, using the GSM connection.
Coating condition measurements were performed under operational conditions in the water ballast tank of the Roll-on-Roll-off ferry shown in Fig. 4, named Pride of Rotterdam. This vessel sails daily between Kingston-upon-Hull and Rotterdam. Pride of Rotterdam was built in 2001 at the Fincantieri Yard, Italy, having a length of 215 m, IMO number 9208617 and a deadweight of 10,100 ton.
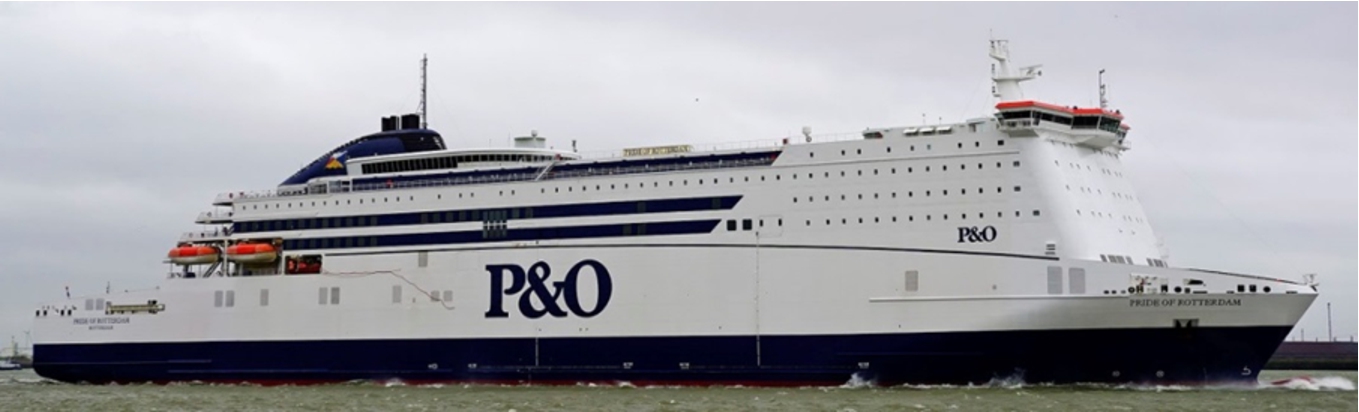
The vessel, named Pride of Rotterdam, used for the coating condition measurements.
The main components of the test–setup are:
The water ballast tank is located forward, in the double bottom of the vessel and it is crossed by two bow thrusters. Mainly, this tank is used for trimming the vessel. As a result, the water level in the tank varies. The tank is accessible by a man hole located in the tank top between frame 228 and frame 229 at starboard (SB) side of the centreline.
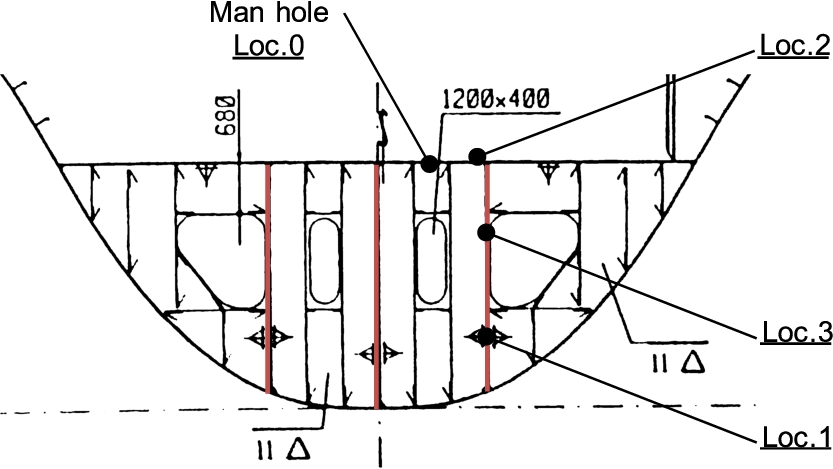
Structural drawing of Frame 229, where bullets indicates the locations of the test set–up components. An overview of the components is given in Table 2. The red lines indicate the locations of the longitudinal girders.
A structural drawing of frame 229 showing the longitudinal girders 1500 mm SB from the centreline of the vessel is shown in Fig. 5. The bullet lines in the figure indicate the location of the components of the test set–up. An overview of such components and corresponding locations is given in Table 2.
Overview of components and respective locations in the vessel
SB – Starboard; CL – Centreline; Loc. – Location
Figure 6(a), (b) show the installed specimens. Figure 6(c) shows a view through the manhole into the tank. The specimen and reference plate are visible. Installation work made on the electrical system is shown in Fig. 6(d). For this system, no communication with shore is established. The Pride of Rotterdam is every second day in Rotterdam, hence a visit is easily performed.
A similar system has been devised and patented by [17] (Thomas, 2005) The patent describes the system rather detailed. The main points (as indicated in Fig. 7) are:
Two half cells to measure potential (Ag–AgCl electrodes) (items 2a and 2b);
One anode to measure current (item 3);
Waterproof datalogger below man hole lid (item 6, 18).
The claim regarding measuring a potential and be able to provide a conclusion regarding corrosion is not supported by other literature. The system proposed here aims at providing a differential measurement in time: the higher the current, the larger the coating breakdown. Hence, the system described here is complementary to the one in the patent.
The criteria mentioned in the patent are discussed in conjunction with the results of our system.
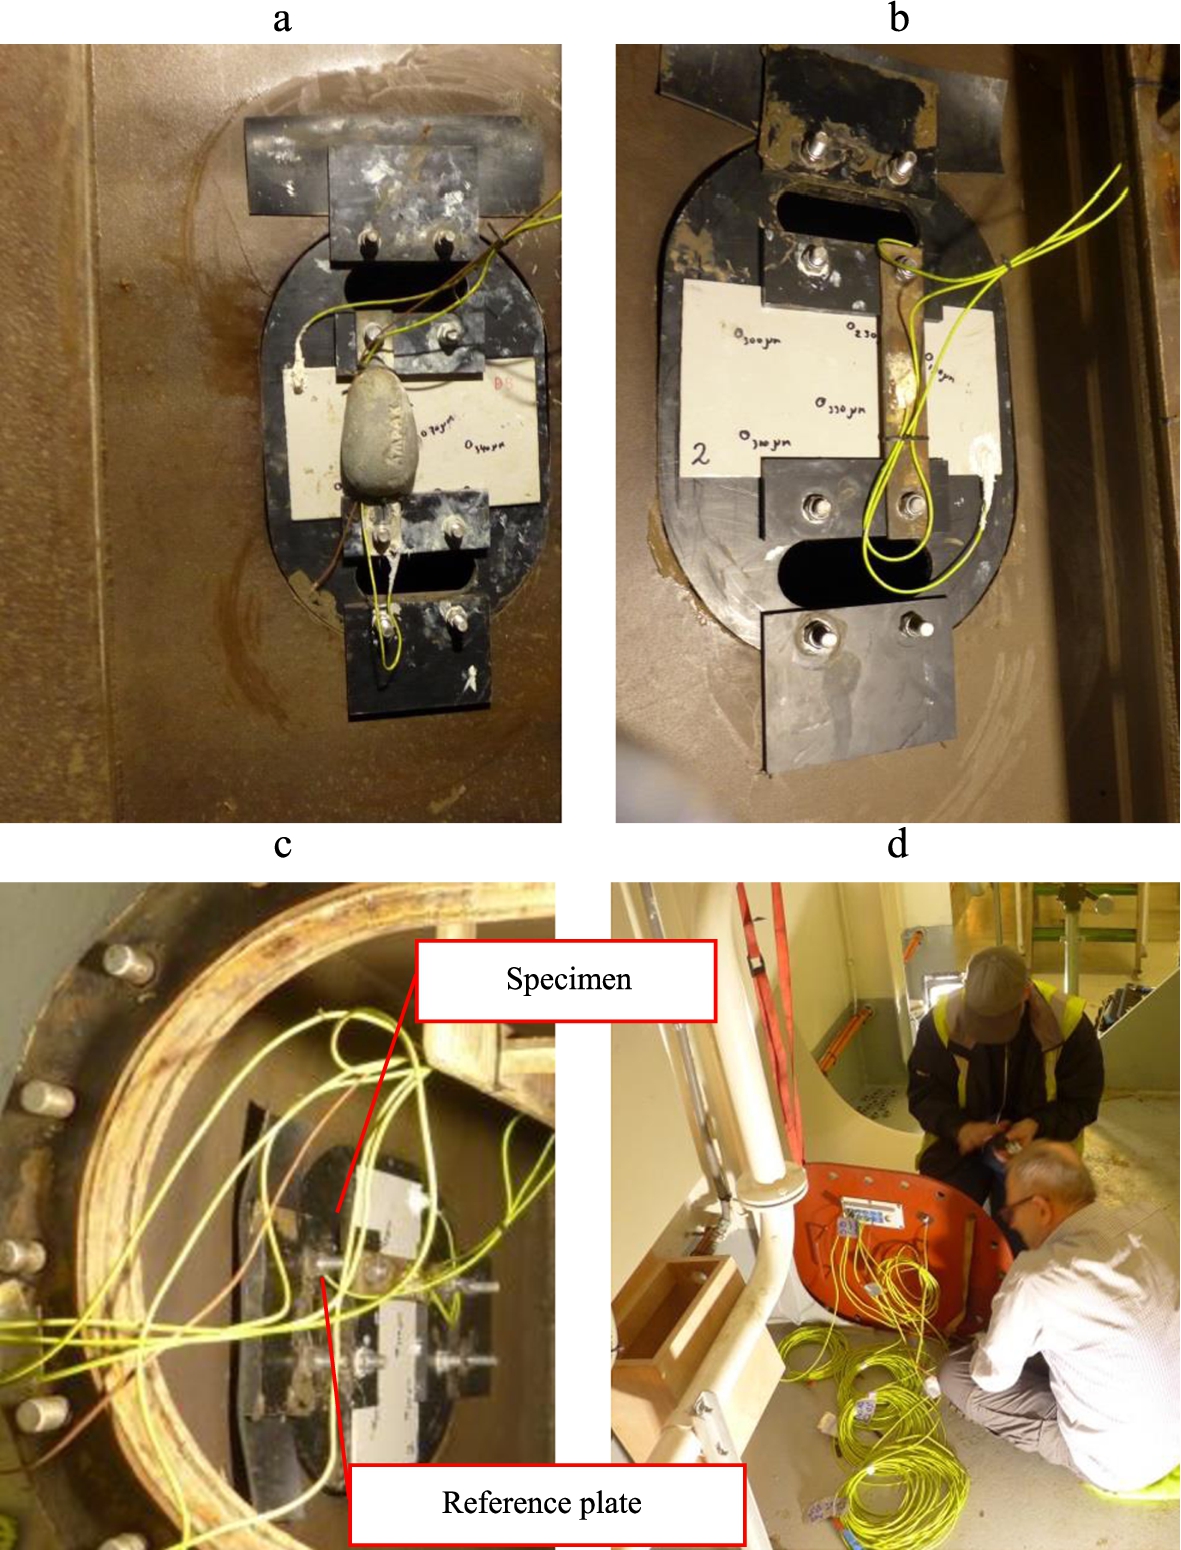
Specimens and anode installed at Loc. 1 (a), specimens and reference plate installed at Loc. 3 (b), view from deck on specimens (c), installation of the system onboard (d).
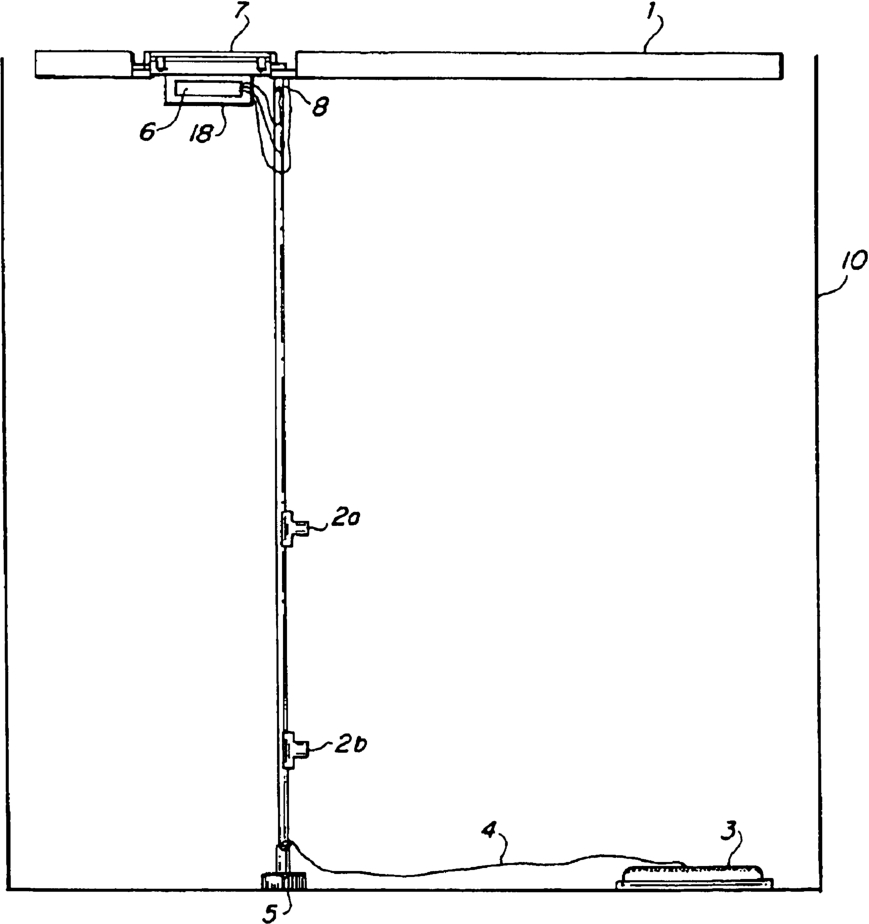
Layout of patented system [17].
As abovementioned, one of the main objectives of the E-inspection systems developed under the SAFEPEC project was to provide adequate data about the status of the ship structure to the risk modules. This means data related to the condition of the coating – potential situations of corrosion – or stress data from the strain gauges – related to potential fatigue situations.
Before discussing the reliability of the developed systems, a brief presentation of the different risk modules developed in the project is provided in the next section of the paper.
Risk modules in SAFEPEC
Four risk modules were developed in the SAFEPEC project, and each one of them is constituted by a set of different models. As previously mentioned, they are the Causes, the Vulnerability, the Consequences and the Inspection Modules.
In the Causes module, the relation between the failure modes and the underlying causes are identified and quantified. The following systems and underlying causes were selected: Ship Structure and Life Saving Appliances (LSA) systems; Corrosion and Fatigue causes. These systems and causes were chosen based on the feedback provided by the stakeholders in several technical workshops made in different European locations, namely, Hamburg, Athens and Setúbal. Two models, corrosion model and fatigue model, were developed in this module. Factors influencing the coating lifetime, the corrosion rate and the formation of fatigue related to cracks were identified from literature and expert interviews. Furthermore, the existing databases (mainly IHS Fairplay, Automatic Identification System (AIS) and Port State Control (PSC)) were analysed regarding the available data for quantification purposes. The influencing parameters for the corrosion cause model were investigated with respect to their importance and data availability (which factors could be quantified) from publicly available data sources, to describe their significance for the corrosion process. Bayesian Networks models were developed for coating, to estimate life and extent of breakdown as function of time and, for corrosion growth, in terms of reduction of wall thickness, likewise as function of time in several locations within the hull girder. The module output is the corrosion depth which is used as an input into the vulnerability module [10].
Regarding the fatigue model, its aim was to provide probabilities of having cracks in the ship structure, based on statistical information publicly available in data sources. The main data source was Port State Control (Paris Memorandum of Understanding – MoU) from where statistics were drawn. The crack probability is then adjusted with information about the operational area, which has a significant impact on high cycle fatigue caused by wave loads. Additionally, were introduced factors like flag, class and design rule set adjustment. These were selected to give benefit to some ships, i.e. lowering the probability of cracks in ships that are known to have flag and class performing well and that are designed according to the International Association of Classification Societies (IACS) Common Structural Rules (CSR). The model output, as an input for the Vulnerability module, is the probability of cracks in specific locations of the ship.
The information gathered by the E-monitoring systems is then provided to the cause module. This means that, for example, the corrosion e-monitoring system provides to the corrosion cause model information about the coating condition, which allows the model to compute the updated information of the real status of the structure.
The vulnerability module purposed to assess failure probabilities of ship structures in relation to the deteriorations. The key causes in the causes Module – corrosion and fatigue – are considered in the vulnerability module and linked to possible accidental events. The accidental events are represented by appropriate failure modes relevant to the causes, and calculating the probabilities of the failure events. Eventually the failure probabilities estimated by the vulnerability module is provided to the Consequence module to assess risk of the ship structure due to the underlying causes and accidental events. The vulnerability module was developed in the context of generic model approach. Typically, detailed information like ship drawings, Finite Element (FE) models or inspection results are not available and therefore were not considered when developing the vulnerability module. The mechanical and phenomenological models taken in this module are able to represent each ship’s properties with commonly available information (general information on the structure and operation of the ship, as well as inspection results). The generic model approach also requires proper simplification on the ship structures. The ship structure is simplified spatially, then representative models/sections/elements are chosen which are characterised by the generic ship indicators. Identification of the indicators is made with consideration of availability of the information, statistics of the relevant parameters and also expert/engineering judgment.
Essentially, the vulnerability module associates probabilistic models to address significant uncertainties in the present state of ship structures, environmental condition, and in future demands. Bayesian Network approach is implemented for efficient representation of the variables with uncertainties and their causal relations. The BN quantifies the effect of the uncertainties in terms of failure probabilities, and allows obtaining the updated failure probabilities by introducing observation/inspection/monitoring. Ultimately, the vulnerability module provides better understanding on the probability of incident occurrence even with the limited information and support inspections planning. In the vulnerability module, the failure modes relevant to the underlying causes are identified and quantified. In this deliverable following failure modes have been selected [11]:
Bending failure due to corrosion or fatigue;
Shear failure due to corrosion;
Loss of Watertight Integrity (LOWI);
Loss of operability and
Local buckling
Although all these failure modes have been developed into BN models, in some cases it was not possible their quantification, due to the unavailability of consistent and reliable data (cases of the LOWI, loss of operability and local buckling).
The failure modes of bending/shear evaluate the probabilities that cross section and whole ship structure may fail due to corrosion and fatigue, which essentially reduce effective cross-sectional area and resultant load bearing capacity. Parameters to define the load and resistance models are investigated in the context of generic ship model. Especially, the ultimate bending moment/shear capacities are evaluated by using Response Surface Method (RSM). This work associates analysing variation of the capacities in relation to the corrosion and fatigue in advance, then utilising the approximating function in BN. The representative cross-section models of different ships are selected in advance and then used in the process RSM. This approach enables evaluating the load resisting capacities with only generic information, e.g. ship type, size, etc. Furthermore, it helps to enhance computational efficiency in calculating the failure probabilities. Similarly, the load acting on ship structures were also characterised by generic ship information. Relevant empirical formulae and probabilistic models were identified to be used in BN. Ultimately, the failure probabilities evaluated for the causes are then delivered to the consequence module for risk assessment. In the figure below it is shown the example of the developed BN model for bending failure due to corrosion depth (Fig. 8).
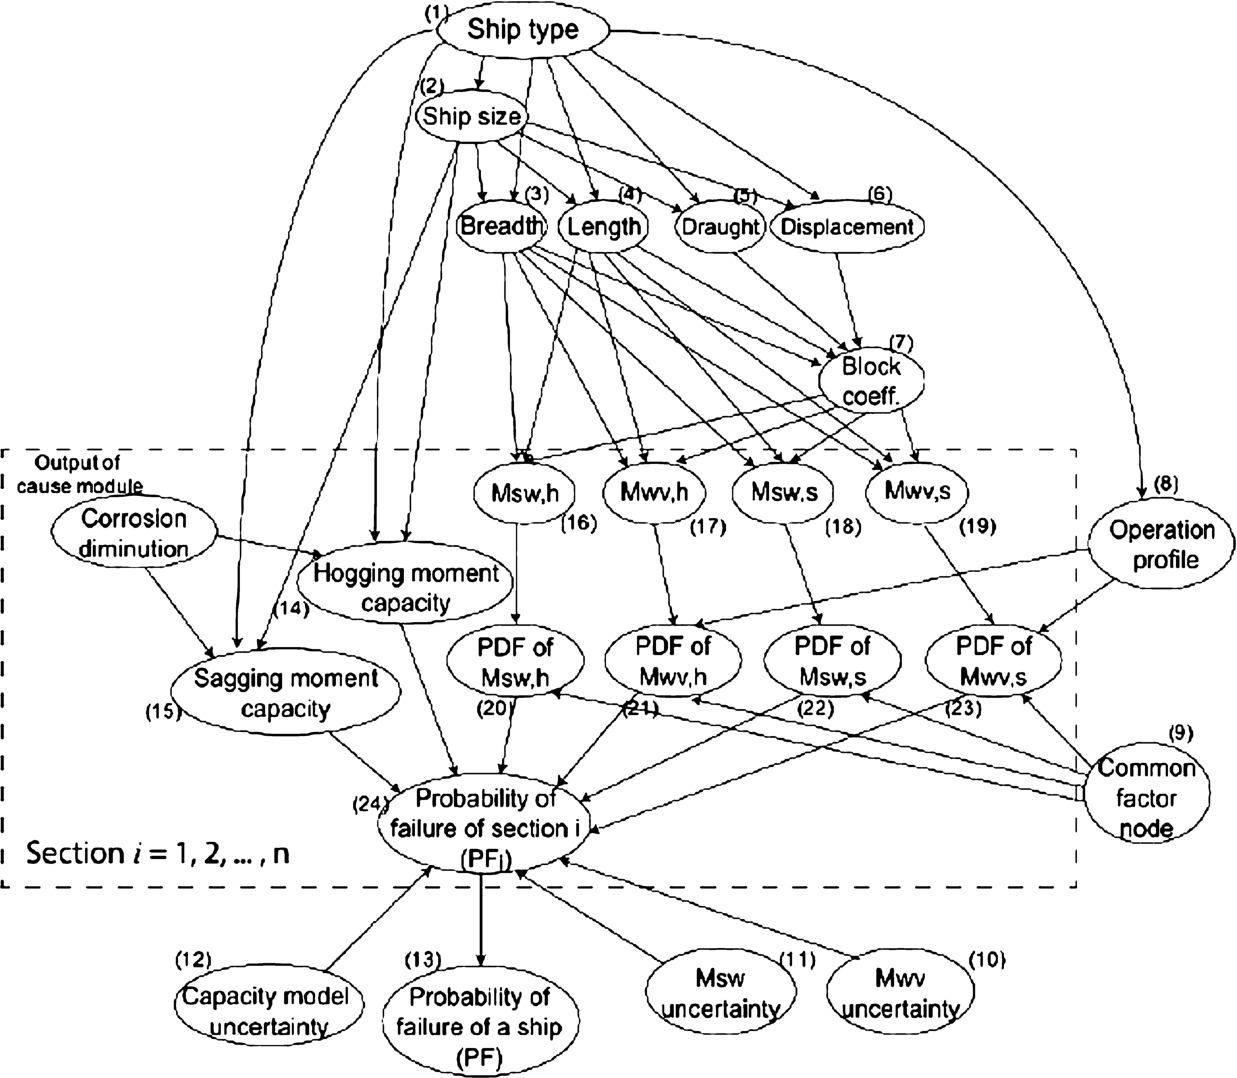
BN model – Bending failure due to corrosion depth.
More specific details concerning the vulnerability models can be found in [12–14].
In the Consequence Module, event trees were initially used to identify and assess the consequences and the intermediate events of several examined accidents: This was done for two underlying causes (i.e. corrosion and cracks), aiming at estimating the probability of occurrence of different accident scenarios. The quantification was based on a statistical analysis of a casualty database having historical data on General Cargo and RoPax ships. In a second stage, and to provide compatibility with the models developed in the other modules, were developed also appropriate Bayesian Network models for the quantification of the consequences [18].
The outcome of the consequence module is the estimation of the risk level of a given ship in three different risk categories, thus having the possibility to compare with an average, allowing the assessment as a high or low risk level ship. Figure 9 presents an example of the comparison between 5 general cargo ships for the Damage to Property (DtP) risk category – mockup GUI (Graphical User Interface). This user interface presents to the user the following steps:
IMO’s of interest are introduced by the user (presented in the right side in the above picture)
Based on the introduced numbers the data is fetched by the SAFEPEC tool;
The overall Risk is then estimated for each of the ships of a chosen risk category (presented by each of the columns in the above picture).
In order to compare the risk levels of the chosen ships, an average risk level is calculated based in a sample of ships (presented as a horizontal line). This is calculated based on a set of 50 IMO numbers of ships, with characteristics similar to the 5 sample ships, initially chosen for establishing the average risk of Damage to Property (DtP) or any other risk category, allowing a comparison to be performed. In this sample ships were included belonging from different flags (white, grey and black), different classes (IACS and no-IACS), etc. Besides the average for the overall risk is possible to estimate the averages by cause, i.e., due to fatigue or due to corrosion. In the figure is shows the comparison of the overall risk of DtP of each ship with the related average risk (horizontal line). It can be observed that two of the ships, IMO’s 9376452 and 9433690, present overall DtP risk levels above average – in the case of the former almost 300% above. It also should be mentioned that the color gradients applied to the risk levels were chosen avoiding the typical greens, yellows and reds associated to a particular risk level or risk acceptance criteria, and are based on DNV GL experts for human performance with the need to be easily to distinguishable and readable for people suffering from the colour blindness.
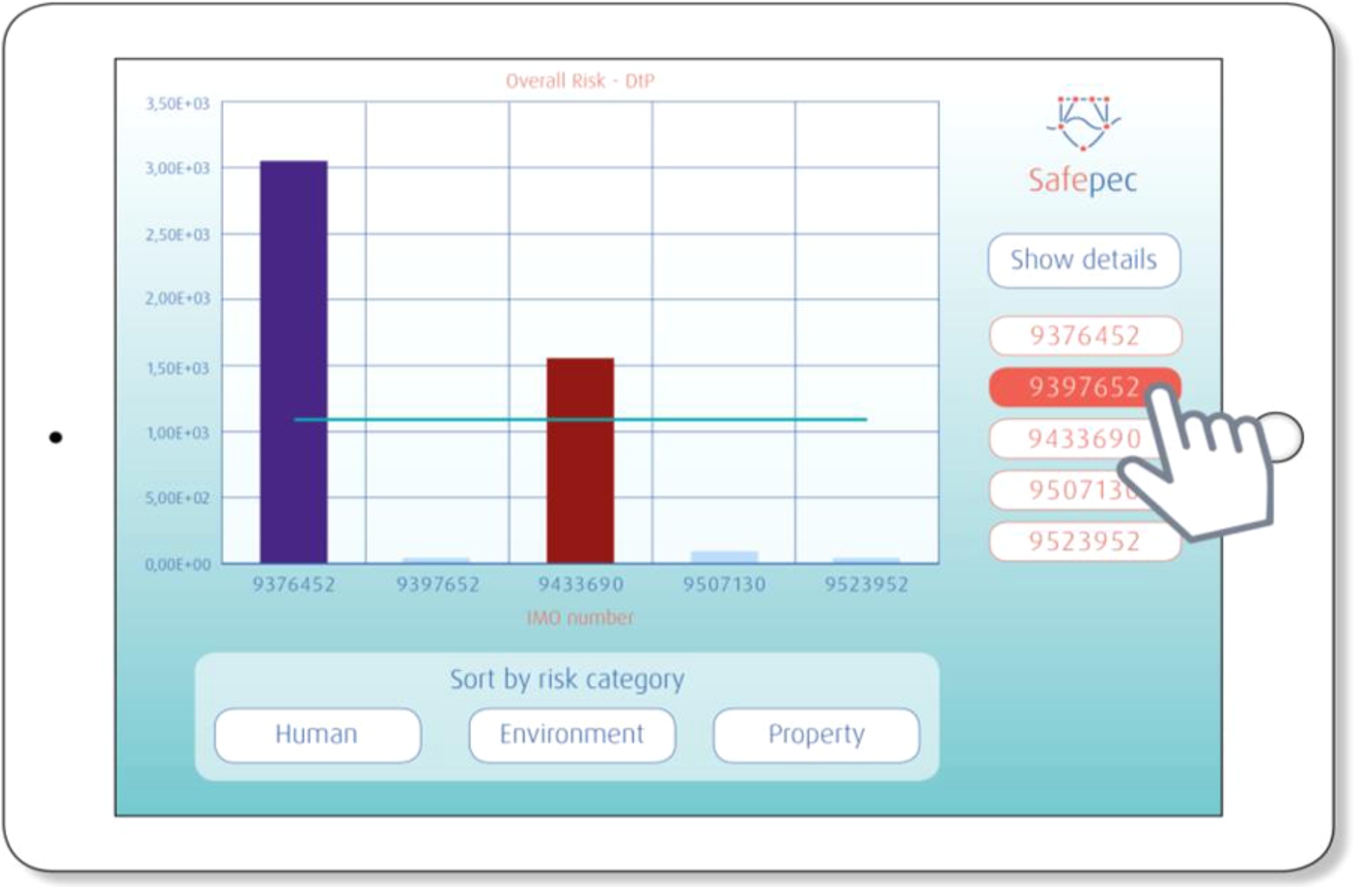
Comparison of the overall risk of DtP of 5 ships with the related to a risk average [4].
In the Inspection Module the information obtained from inspections (either visual inspection or through the continuous hull monitoring systems) is applied to update the probability of a given cause and, accordingly, the overall risk of a ship, through Bayesian updating. In the Inspection Module was developed a Bayesian model that incorporates a set of factors or variables with impact on the Probability of Detection (PoD) [16]. Based on evidences set within the inspection model, it allows the reduction of the uncertainty within the causes model – for a given cause – updating this way the initial Probability of Failure (PoF) and the Risk level.

Midship cross section PoF by corrosion bending with and without inspection [4].
In Fig. 10 is presented an example of the midship cross section PoF (Section 2 of the vessel under analysis), by corrosion bending, with and without inspection outcomes for ship with IMO number 9397652. Note that with this inspection updated information, PoF by corrosion bending is also updated for any cross section. It can be observed that the PoF increases in ∼10% after the results of the inspection are introduced within the tool. Likewise, the overall DtP risk will also be updated with this new information.
As abovementioned, a Risk Framework was developed based on the integration of the different modules presented. Given that the information is retrieved from external and internal databases a Data Integration Module (DIM) was developed as mediator between these databases and the risk framework.
To be successful, a system needs to be reliable, i.e., it shall provide correct warnings, but also remain silent when indeed the situation is safe. The SAFEPEC Risk Framework and E-inspection contain many parts and each part contributes to the perceived reliability. Both E-inspection systems and the risk modules will be treated here.
Fatigue monitoring system
The failure of equipment determines one aspect of the reliability of the system. If no signals are recorded, there is no use in having the E-inspection system. Worse, a false feeling of confidence is provided. The equipment used for the fatigue monitoring is normally used in laboratory conditions and circumstances. This means that Reliability, Availability, Maintainability (RAM) analyses, Mean Time To Failure (MTTF) and similar parameters are not readily available. However, the components can be assessed based on experience of frequent users, using expert opinion (Table 3).
Reliability parameters in the Fatigue monitoring system
Reliability parameters in the Fatigue monitoring system
Further, the signals received are processed and used to predict the fatigue health status. Fatigue calculations are based on the SN curve approach. This means that for specific details, the stress cycles are counted and compared to the capacity of handing a certain amount of stress cycles. This capacity is based on many laboratory tests. It appears that there is large spread in the results. In order to be safe, a margin is taken in setting the capacity limit. The limit is chosen such that when it is reached, there is a 98% chance that the specimen is still intact. Translated to the actual ship structural detail, it means that when it is calculated to be at its design fatigue strength capacity, there is a 98% chance that there is no crack yet. So, when the E-inspection system tells the user that the capacity limit for fatigue has been reached for a certain detail, there is still a 98% chance that no cracks will be found, assuming that the strain as measured is perfectly translated into a hot spot stress at the location of interest. The following steps are needed and are further influencing the reliability:
Stress is the product of strain and elasticity. Elasticity modulus has a range around the average value
The resulting stress is valid at a certain location and needs to be translated to a stress at the location of interest. This requires proper position measurements of the gauge, as well as proper derivation of cross section properties of the ship
To find the actual hot spot stress or applicable S-N curve for the detail of interest, the actual detail and initiation point of the fatigue crack shall be covered by known libraries of such details. Given the variety in ship details and the craftmanship of welders, there will be a discrepancy.
It is not the aim of this paper to address numbers associated with these influences for the reliability. Nevertheless, it further emphasizes the notion that an E-inspection system for fatigue loads will be inherently providing false alarms. It is recommended to improve the largest contributor, i.e. the definition of the S-N curve and have more useful parameter for that. This can be achieved by using the 50% probability of having a crack (mean line of the S-N curve). When the data is available, such lines can be created.

Strain-time measurements.

Strains zoomed in at box from Fig. 11.
Figure 11 shows the strain measurement signals for one trip of the Flinter. The mid area represents the part of the trip passing the Gulf of Biscay. This can be recognized by the larger fluctuations in the strain levels. Figure 12 is a close up, showing the larger fluctuations. It can also be seen that the signal of StrainGage_PS2 (purple) is not consistent with the others. Hence, this signal is considered unreliable. With the remaining three signals, the hull girder loads can be derived, though. The hull girder loads meant are the vertical bending moments. Bending moment are calculated from strains acting instantaneously on the hull girder:

Strain values at typical departure condition.
When the offsets of the strains are implemented, the instantaneous bending moments can be derived and used to advise the captain about the amount of load is experienced by his ship. This will allow for a direct feedback on sailing conditions and may prompt the captain to modify speed or heading to reduce the loads on the hull girder, for instance. This will enhance the performance of the ship and make life of the crew more comfortable.
For fatigue damage, one is interested to know the amount of cycles and the amplitudes of these cycles. Also without the calibration described above, histograms or cycle counts can be derived from the measurement data. The typical presentation of strain ranges vs cycles is shown in Fig. 14. The cycles depicted in Fig. 12 are encircled, confirming that part of the times series resulted in relative larger accumulated load. Multiplication by the Young’s Modulus will provide the stress ranges, and if required can be adjusted towards the location of interest and the associated stress concentration factors. These are normally used to calculate the consumed fatigue life by comparing tot S-N curve applying the damage accumulation equations. If insufficient data is available of the ship, the strain ranges can be converted to moment ranges and be compared with the expected loads from design. For instance, the histogram of expected wave bending moment cycles is derived from the North Atlantic wave scatter data, or any other area the ship is supposed to sail.

Strain cycle distribution based on continuously vs summed strain-time dataset (circled area is range of zoomed in time series Fig. 12).
Reliability parameters – coating condition monitoring system
Reliability parameters – coating condition monitoring system
Like the fatigue load monitoring system, the reliability of the components of the coating condition can be addressed. Table 4 shows the outcome of that assessment. Also, for this system, the lack of industrial data requires us to use expert opinion and laboratory experience.
Figure 15 shows a measurement in the tank of the Pride of Rotterdam. All measurements refer to the samples installed as part of the monitoring system check. The figure clearly shows when the tank is being filled and emptied. All test panels follow the filling and emptying of the tank. No spurious results are seen in the period of testing. It is considered a reliable system in terms of indication when a coating defect is present, as well as providing no alarm if indeed the coating is intact. This means that advice provided by this E-inspection system can be used by the crew right away. The implementation towards an advice for updating the for instance the allowable bending moment is not yet achieved, although the infrastructure to do so has been laid out.

Series of measurement (Sample “Reference upper” scale on the right axis).
The probability of a false alarm has also been verified. With three sizes of plates, the galvanic current was measured at various locations throughout the tank. These locations meant that the anode and the test samples were separated by frames and girders and could only “communicate” via the mouseholes. Figure 16 shows the results. It was found that readings were positive in all instances and remained consistent with the damage size ratios. So, even if the distance travelled by electrons is large and hindered by small openings, the system can pick up the damage in the coating system.

Measurement results for bare steel plates at various locations in the tank.
While the effectiveness of E-inspection is largely based on the reliability of the monitoring system, i.e., partly formed by the quality and reliability of the sensors and the data acquisition system, the overall of reliability of the approach is also based on the reliability and completeness of the information being introduced in the different modules that compose the risk framework.
Obviously, uncertainties are inherent to the system or to the framework, but current reliability of sensors and associated equipment is significantly high. However, the framework is prepared in the extreme case that the E-inspection systems fails, and input must be made by the onshore ship support for inspection/maintenance planning. This means, the possibility to directly introduce evidences of the structure condition status of the ship – in situ inspection – which will update the overall risk based on these inputs. Crew workload will not be affected in case the monitoring system is down. However, introducing evidence based on inspections in the reliability modules, will impact the maintenance planning of the ship or fleet by establishing priorities and thus optimizing the overall process.
Impact of E-inspection in crew workload
Some of the intermediate inspections, especially those carried out by the crew, can be automated, directing the limited time of the crew to maintain other areas. In general, this can lead to overall improvement of the condition of a ship. Likewise, current seafarers are loaded with work and experience fatigue, resulting in higher risk of incidents. This is especially true for the smaller ships engaged in coastal trading. Due to many port calls, the amount of activities is large, the areas are many, but small and the size of the crew is relatively small. Doing the right things is of utmost importance. When part of the work is automated, they may reclaim spare time, reducing fatigue and increasing safety. Either way, the safety of a ship is increased when part of the labour (inspections) can be automated. The crew is the key to success of the E-inspection system, but rightly using the advantages.
Conclusions
In this paper, a framework has been presented for assessing the hull girder health status of ships. Knowing the health status helps the crew in spending their limited time on the relevant jobs during sailing. The approach is outlined following two major parts. First, a risk framework has been set up. The risk framework follows the route from causes (degradation), via vulnerabilities (insufficient remaining strength for the expected loads), to consequences (severe damage to or loss of the asset). The relations are defined, and available evidence is used to calibrate the framework. Based on scenarios presented, we conclude that this risk framework performed well.
The second part is a E-inspection system. It is outlined how the hull girder loads and coating conditions can be monitored daily. Hull girder loads are measured by strain gauges on the deck, while the coating condition is verified by measuring the current between an anode and the tank structure. The system is explained, as well as the actual performance on board of two ships. The reliability of the systems is good, whereas the coating condition monitoring system even shows a low probability of false alarm.
The crew will be greatly helped by using the two parts described. The risk modules will guide the crew to the relevant locations for inspections and avoid spending time on the locations not requiring any attention. The E-inspection will provide regularly evidence of the loads on the hull and condition of the coating. The latter is directly reducing the need to enter ballast water tanks, since the monitoring will provide the information on the coating condition.
Footnotes
Acknowledgements
This work was supported by the European Commission and the SAFEPEC project [Grant number FP7-SST-2013-RTD-4-2. 605081].