
Abstract
Background:
Apolipoprotein E (ApoE) is known for its role in lipid trafficking and the ɛ4 allele is a risk factor for late onset Alzheimer’s disease (AD). Recently, aberrant ceramide and fatty acid (FA) levels have been implicated in AD.
Objective:
To determine the specific effects of human ApoE4 (hE4) on cerebral ceramide and FA content during chow or a high fat/high cholesterol (HFHC) diet.
Methods:
Cerebral ceramide and FA profiles were determined by LC-MSMS in 15-month-old female wild-type (WT), ApoE-knockout (E0), and hE4-knockin mice fed chow or a HFHC diet for 3 months. mRNA levels of genes involved in ceramide and FA metabolism were determined by qPCR.
Results:
Similar to E0, hE4 mice displayed lower cerebral total ceramide, Cer16 : 0, and Cer24 : 1 levels than WT mice on both diets. Akin to WT mice, hE4 mice had lower total and saturated FA levels on chow than E0 mice. The HFHC diet significantly increased total and saturated FA levels in hE4 mice. Chow-fed hE4 mice showed lower mRNA levels of ceramide synthase (CerS) 6, acid sphingomyelinase, and of most ceramide and FA transporters than WT and E0 mice. The HFHC diet downregulated the expression of CerSs in hE4 and WT mice, and of ceramide and FA transporters in WT mice, but not in E0 mice.
Conclusion:
hE4 reduced cerebral ceramide levels to levels observed in E0 mice independent of diet. The HFHC diet increased cerebral FA levels in hE4 mice. This was associated with alterations in the expression of ceramide and FA transporters specifically in hE4 mice.
INTRODUCTION
The ɛ4 allele of the APOE gene encoding for apolipoprotein E4 (ApoE4), one of the three common ApoE isoforms, is an important genetic risk factor for late onset Alzheimer’s disease (AD) [1, 2]. How it contributes to AD remains to be elucidated. Similar to its role in the circulation, ApoE is thought to play a role in lipid trafficking in the brain [3]. The brain is the second largest source of ApoE after the liver [4, 5]. In the brain, ApoE is primarily synthesized by astrocytes and secreted in association with lipids [6]. These ApoE-containing particles appear to provide lipids to neurons and to other cells [7]. Brain lipid homeostasis is regulated independently of peripheral transport and lipid transport across the blood-brain barrier (BBB) is strictly controlled [8–10]. Imbalances are associated with neuropathology [10–13]. ApoE4-mediated alterations in lipid homeostasis are expected to play a role in the pathogenesis of AD. Numerous alterations in lipid composition of AD brains have been reported, including in sterol, phospholipid, and fatty acid profiles [14–16], but the data are inconclusive. Notably, minor ApoE-isoform specific effects on brain sterols and phospholipids have been reported [17–21]. It is unclear how this can explain the large impact of ApoE4 on AD.
Recently, alterations in cerebral ceramide levels have been linked to AD [22–24]. Ceramides consist of a sphingosine backbone coupled to a 14–26 carbon fatty acid (FA) [11] and they are the backbone of all complex sphingolipids [24]. Besides being integral components of cell membranes, they act as second messenger and are involved in intracellular signaling, cell growth, differentiation, and proliferation [11, 25]. However, high ceramide levels can induce cell dysfunction and degeneration; they are initiators of a coordinated stress response eventually leading to apoptosis [26–28]. Increased ceramide levels have been observed in mild cognitive impairment (MCI) and during the early stages of AD in cerebrospinal fluid (CSF), plasma, and postmortem brain tissue [22, 23]. However, there is limited knowledge on the interrelation between ApoE and cerebral ceramide metabolism [21, 30]. Therefore, we explored the effect of human ApoE4 on cerebral ceramide levels in a mice model.
In addition to ApoE4, there are numerous other genetic and environmental factors that link lipid homeostasis to the pathology of AD [14, 31–33]. A diet high in fat and cholesterol, obesity, type 2 diabetes mellitus (T2DM), and metabolic syndrome were found to increase the risk of AD [17, 34–36]. All of these conditions are accompanied by increased plasma ceramide levels [37, 38]. In addition, diets rich in saturated fatty acids (SFA) were found to promote the development of AD, whereas mono-unsaturated fatty acids (MUFA) and poly-unsaturated fatty acids (PUFA) are thought to be neuroprotective [34]. Preliminary studies have shown that unfavorable dietary fatty acid (FA) compositions may directly affect the development of AD, or indirectly by promoting the development of T2DM [34, 39]. ApoE4-specific effects on the trafficking of omega-3 (n-3) PUFA have been reported, but are rather inconsistent (review [40, 41]).
In the present study, we determined the effects of ApoE4 on ceramide and FA levels in mouse brain. Mice have only one apoE isoform, which is functionally equivalent to human ApoE3 [42, 43]. By studying the effect of knocking-out the mouse Apoe gene (E0 mice) and of knocking-in the human APOE4 gene (hE4 mice) on an E0 background, we determined the specific effects of hE4 on brain ceramide and FA levels. In addition, we investigated the effect of a high fat/high cholesterol (HFHC) diet on cerebral ceramide and FA levels in the three different strains of mice.
METHODS
Animals and diet
ApoE-deficient mice (B6,129P2-apoEtm1Unc/J), hE4-knockin mice and C57BL/6J wild-type mice (WT) used in the current study have been described previously [44]. Since mouse apoE lacks the interaction between the C- and N-terminal domains that is unique to ApoE4 and required for its structure, it is considered to be the functional equivalent of human ApoE3 [42, 43]. However, human ApoE3 does not completely substitute for mouse apoE, as illustrated by its additional effect on diet-induced hypercholesterolemia and atherosclerosis [45]. Advanced age and female sex are risk factors associated with AD [46], therefore we restricted our study to 12-month-old female mice. At this time, 16 mice of each strain were randomly assigned to either a standard rodent chow (3.3% fat, ssniff Spezialdiäten GmbH, Soest, Germany) or a HFHC diet (19% butter, 0.5% cholate, 1.25% cholesterol; Supplementary Table 1) [17] (8 animals per diet and per strain) for 3 months. Animals were then sacrificed and transcardiallyperfused with 0.1 M phosphate buffered saline (pH 7.4). Whole brain was collected for lipid profiling and gene expression experiments. Immediately after excision whole brain was frozen in liquid nitrogen and stored at –80°C until analysis.
Throughout the experiments, animals were housed in groups of 6–8 animals per cage under standard environmental conditions (ambient temperature 20±1°C; humidity 40–60%; 12 : 12 h light: dark cycle (lights on at 7 : 00 a.m.), background noise, cage enrichment) at the central animal facility of the Radboud University Medical Centre. Food and water were available ad libitum. All animal procedures were performed according to Dutch regulations for animal protection and were ethically approved by the Veterinary Authority of the Radboud University Medical Center.
Lipid extraction
Frozen whole brain samples were weighed and homogenized in cold methanol containing ceramide d18 : 1/12 : 0 (Cer12 : 0, Avanti Polar Lipids, Alabaster, AL) and [2H8]-arachidonic acid (Cayman Chemical, Ann Arbor, MI) as internal standard for ceramides and FA, respectively. Total lipids were extracted by adding chloroform and water (2/1, v/v) and fractionated through open-bed silica gel columns by progressive elution with chloroform/methanol mixtures. Eluted fractions were dried under nitrogen and reconstituted in chloroform/methanol (1 : 4. v/v, 100 μl).
Lipid profiling
Ceramides
Ceramides were determined by liquid chromatography tandem mass spectrometry (LC-MSMS) using an Agilent 1100 liquid chromatograph (Poroshell 300 SB C18 column; 2.1×75 mm i.d., 5 μm, Agilent Technologies) coupled to an electrospray ionization (ESI)-ion-trap XCT mass detector (Agilent Technologies, Palo Alto, CA). Detection was in the positive mode. Commercially available ceramides (Nu-Chek Prep, Elysian, MN, USA; Cayman Chemical or Sigma-Aldrich, St Louis, MO, USA) were used as references. For identification purposes, the deprotonated pseudo-molecular ions [M-H]- of the ceramides were monitored in the selected ion-monitoring mode, using Cer12 : 0 as internal standard (mass-to-charge ratio, m/z = 264). Extracted ion chromatograms were used for quantification of ceramide d18 : 1/14 : 0 (Cer14 : 0), Cer16 : 0, Cer18 : 0, Cer24 : 1, and Cer24 : 0.
Fatty acids
Fatty acids were determined as described previously by Astarita et al. [18]. Shortly, samples were analyzed by LC-MSMS using an Agilent 1100 liquid chromatograph (reversed-phase XDB Eclipse C18 column (50×4.6 mm i.d., 1.8 μm, Zorbax, Agilent Technologies) coupled to a 1946D mass detector equipped with an ESI interface (Agilent Technologies, Palo Alto, CA, USA). Commercially available fatty acids (Nu-Chek Prep, Elysian, MN, USA; Cayman Chemical or Sigma-Aldrich, St Louis, MO, USA) were used as reference. For identification purposes, the deprotonated pseudo-molecular ions [M-H]- of the fatty acids were monitored in the selected ion-monitoring mode using [2H8]-arachidonic acid as internal standard (mass-to-charge ratio, m/z = 311.3). Fatty acids measured were grouped by saturation status in SFA, MUFA and PUFA (Supplementary Table 2).
Gene expression
We selected the following candidate genes of the ceramide and FA pathways for quantitative real-time PCRs (qPCRs): serine palmitoyltransferase (SPT), ceramide synthases (CerS)1–6, and N-acylsphingosine amidohydrolase 1 (ASAH1) to reflect the coupling between fatty acids and ceramides, acid and neutral sphingomyelinase (aSMase and nSMase 1 and 2) to reflect the formation of ceramide from sphingomyelin, ceramide transporter protein (CERT), Goodpasture antigen-binding protein/Ceramide transfer proteinL (GPBP/CERTL), and ATP binding cassette transporter A1 (ABCA1) as indicators of subsequent ceramide transport, and fatty acid transport protein (FATP) 1, FATP4, fatty acid translocase/CD36 (FAT/CD36), intracellular fatty acid binding protein (FABP) 5 and FAPB7 as proxy of FA transport across the BBB and within the brain. Intron-spanning oligonucleotide primers for qPCRs were designed with NCBI (Primer-BLAST, Supplementary Table 3). Total RNA was isolated from whole brain using Trizol reagent (ThermoFisher Scientific) and was quantified using spectrophotometry (NanoDrop Technologies, Wilmington, USA). cDNA was synthesized using QuantiTect Reverse Transcription (RT) Kit (Qiagen, USA) after removal of genomic DNA by genomic DNA wipeout buffer. qPCRs for each gene were conducted with 2.5 ng cDNA in a total volume of 15 μL using a Step-One cycler (Applied Biosystems, UK) and the SYBR® Green PCR Select Master Mix (Applied Biosystems, UK) as per manufacturer’s recommendations. The following amplification conditions were used [95°C for 10 min, (95°C for 15 s, 60°C for 60 s)×40 cycles]. qPCR of β-actin, HPRT-1, B2M, HMBS, and TPB cDNA was performed in parallel on all samples in order to determine the actual input amount of cDNA and were used as endogenous references to normalize variations in DNA recovery and amplification efficiency. A 2-fold dilution series was created from a random pool of cDNA from our sample groups. The PCR efficiency and correlation coefficients (R2) of each primer pair were determined using the slopes of the standard curves. The efficiencies were calculated by the formula: efficiency (%) = (10(–1/slope) –1) * 100. For a correct interpretation of the qPCR results, all data was normalized using the geometric mean of the reference genes [47].
Statistical analyses
Data are expressed as mean ± standard error of the mean. Extreme values identified by the Dixon-test (α= 0.05) were excluded from the dataset [48, 49]. Statistical analyses were performed with SPSS for Windows 21.0 software (SPSS Inc., Chicago, IL, USA). Differences between genotype were analyzed using one-way ANOVA with a Tukey post-hoc test and differences between diets were analyzed using an independent sample t test. Asterisks in the figures are used to indicate levels of significance between genotypes and $ signs are used for differences between diets: *p < 0.05, **p < 0.01, and ***p < 0.001; $p < 0.05 and $$p < 0.01.
RESULTS
Ceramide levels in hE4 mice are similar to those in E0 mice but lower than in WT mice
Compared to WT mice, total cerebral ceramide levels were significantly lower in hE4 mice on chow (p = 0.044) and HFHC (p = 0.002) diet and similar to those observed in E0 mice (Fig. 1A). This was mainly due to lower levels of Cer16 : 0 (hE4: chow p = 0.037 and HFHC p = 0.046) and Cer24 : 1 (hE4: HFHC p < 0.001) (Fig. 1B). In all three strains, cerebral Cer24 : 1 levels were on average 19-fold higher than Cer16 : 0 levels, while the ratio was reversed in plasma. Here Cer16 : 0 levels were on average 5-fold higher compared to Cer24 : 1 levels (Supplementary Figure. 1). The HFHC diet did not affect total or specific ceramide levels in brain of WT or hE4 mice, but resulted in 3.3-fold higher Cer16 : 0 levels in E0 mice (p = 0.045). The relative contribution of Cer18 : 0 to the total ceramide pool was on average 20% higher in hE4 and E0 mice compared to WT mice (p < 0.05 for both) (Fig. 1C). On a HFHC diet the contribution of Cer18 : 0 was approximately 40% higher in hE4 and E0 mice compared to WT mice (p < 0.001 for both), which was accompanied by a decrease in relative contribution of Cer24 : 1. Overall, we found lower total cerebral ceramide levels and a relatively higher contribution of Cer18 : 0 in hE4 and E0 mice compared to WT mice independent of the type of diet.
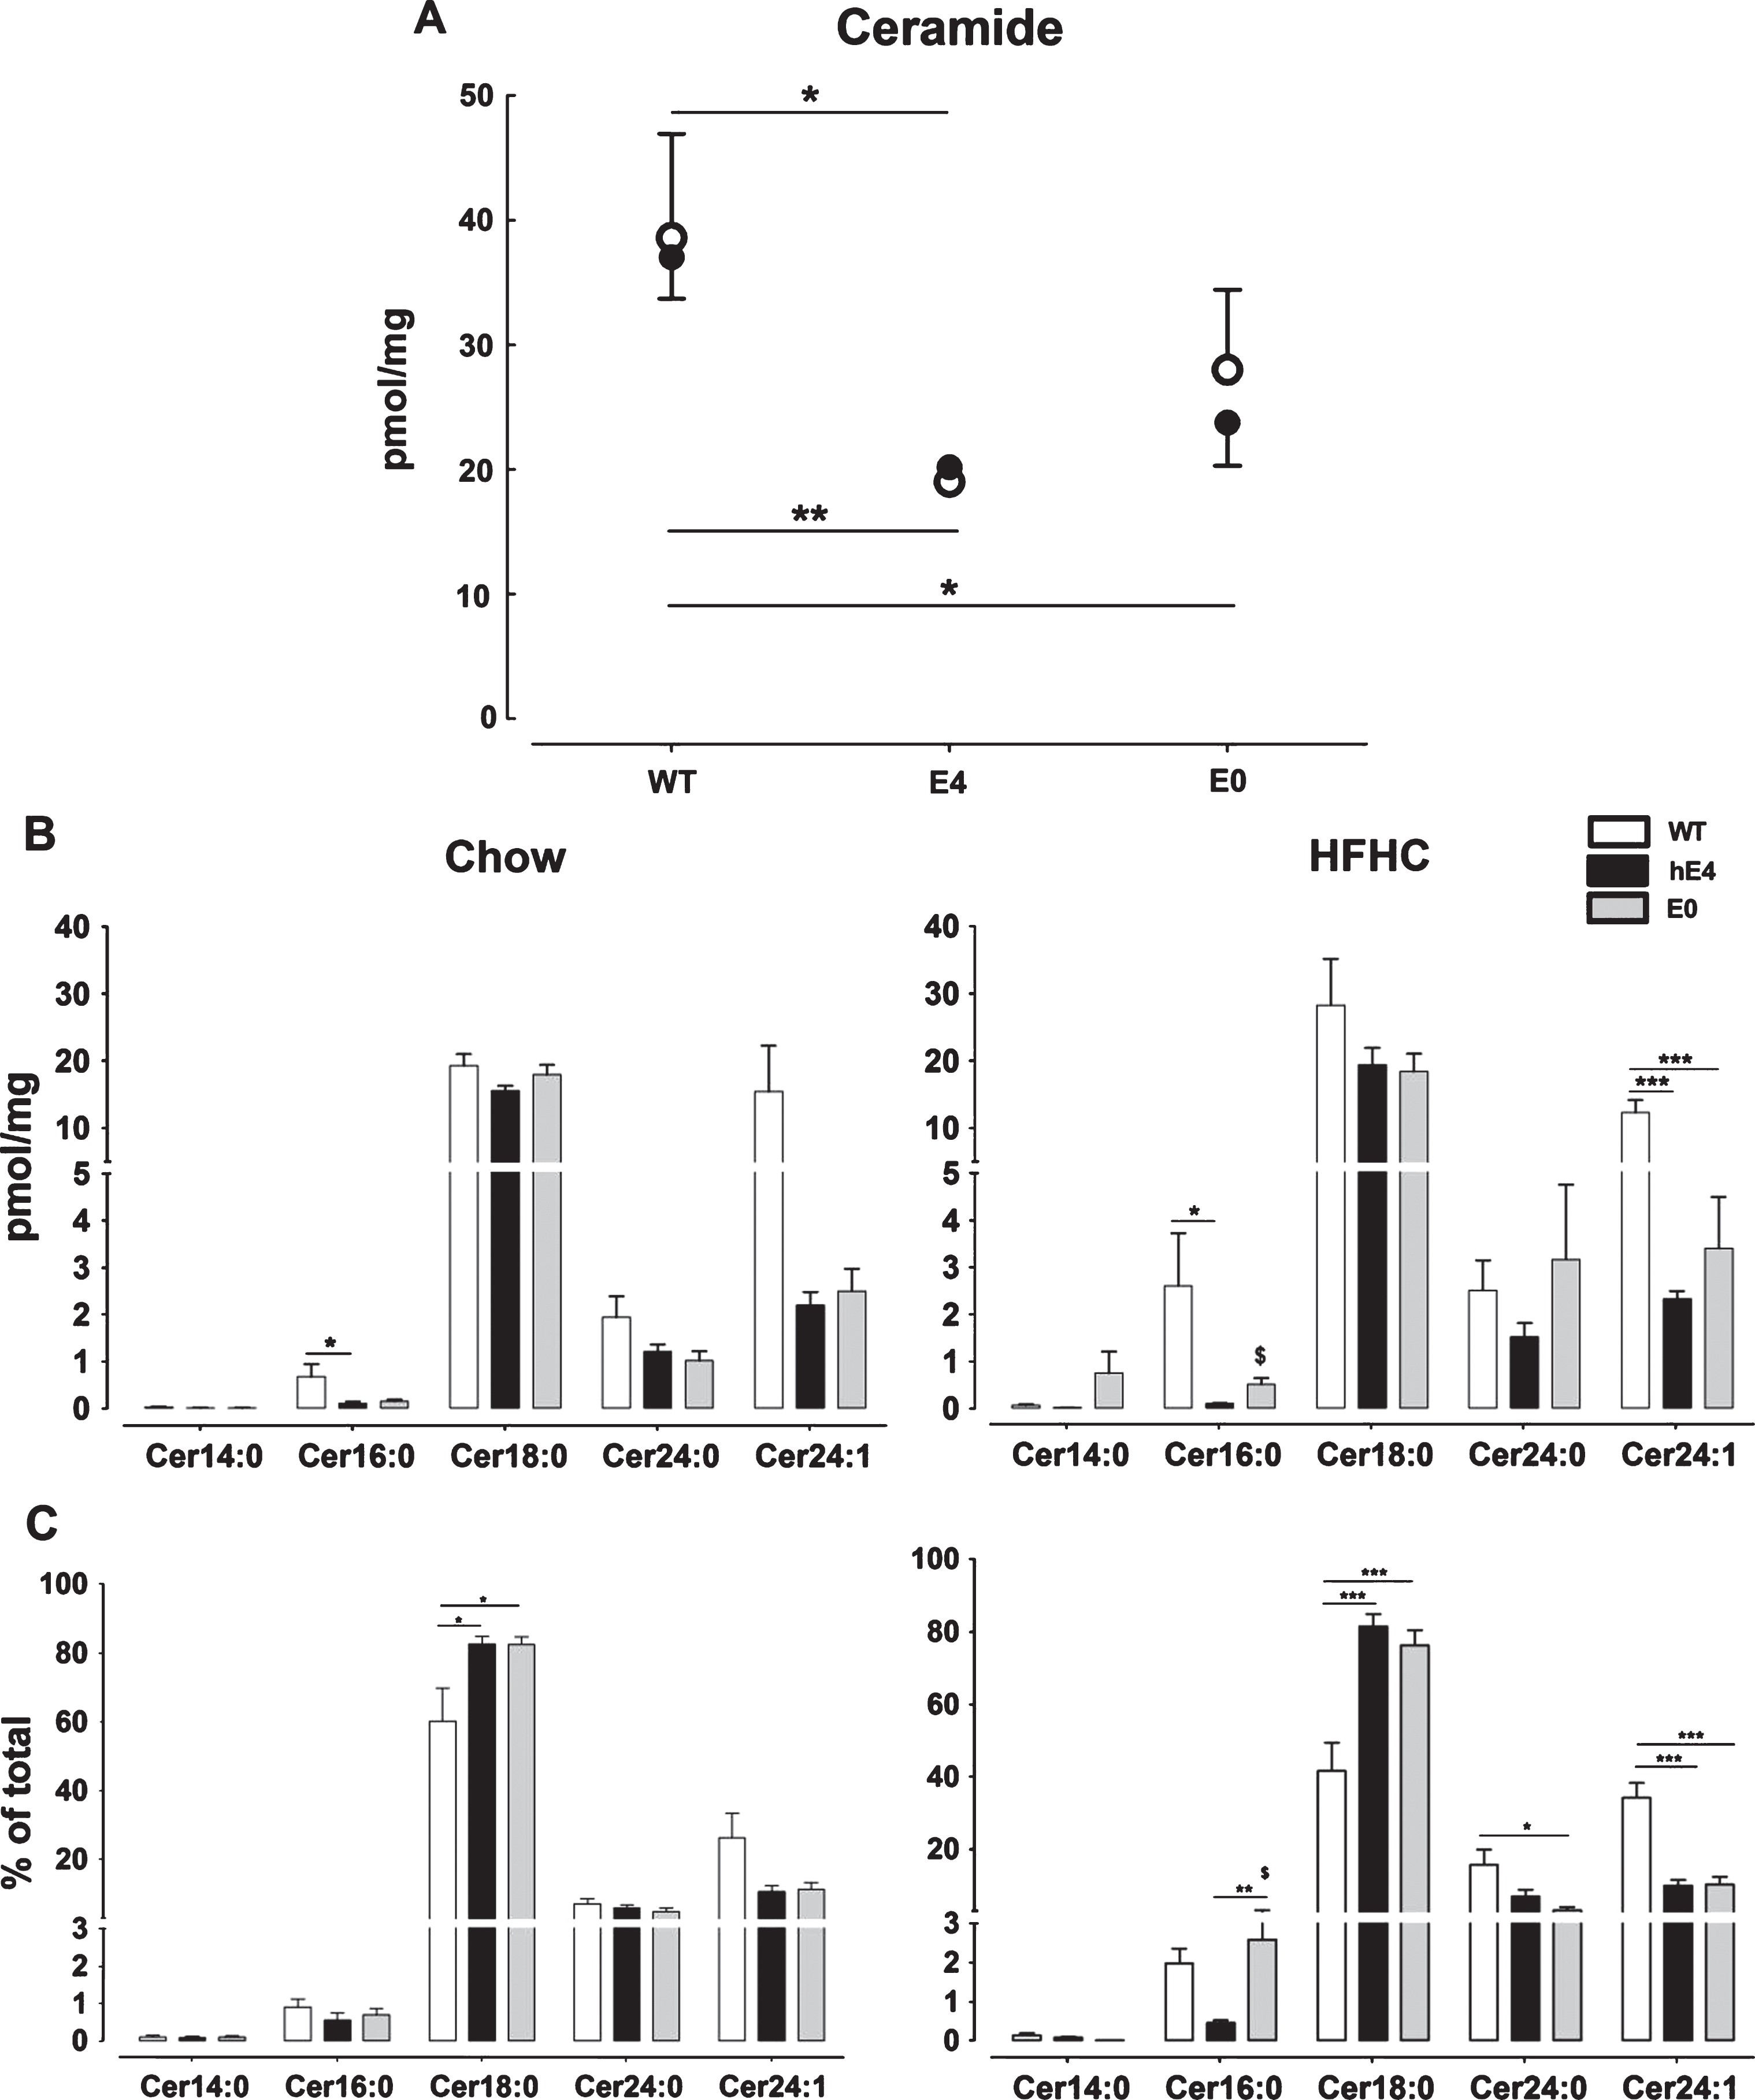
Cerebral ceramide concentration in WT, hE4, and E0 mice on chow or HFHC diet. Data represent mean ± SEM and are normalized to weight of brain sample, n = 6–8, *p < 0.05, **p < 0.01, and ***p < 0.001 for differences between genotypes and $p < 0.05 for differences between diet. A) Total ceramide levels of WT, hE4, and E0 mice on chow (•) or HFHC (∘) diet. The top line indicates differences between genotype on chow and the bottom line on HFHC diet. B) Specified ceramide levels in WT (white), hE4 (black), and E0 (gray) mice on chow (left) and HFHC diet (right). C) Specified relative ceramide levels in WT (white), hE4 (black), and E0 (gray) mice on chow (left) and HFHC diet (right).
Increased SFA levels in hE4 mice on HFHC diet compared to chow
In hE4 mice total FA and SFA levels were not significantly different from those observed in WT mice on chow, but levels in E0 mice were higher than in both hE4 mice (p = 0.001) and WT mice (p = 0.006, Fig. 2A,B). On HFHC diet, the E0 mice showed significantly higher levels of MUFA and PUFA (p = 0.017 and p = 0.006, respectively) than WT mice, but no difference with hE4 mice. The HFHC diet resulted in significantly higher total FA levels exclusively in hE4 mice (p = 0.008). This was mainly due to higher SFA and, to a lesser extent, MUFA levels (both p = 0.004) in hE4 mice fed HFHC diet. PUFA levels were significantly lower in WT mice on HFHC compared to chow diet (p = 0.035). This effect of the diet was not observed in hE4 mice or in E0 mice. There were only limited changes in the relative distribution of FA due to genotype and diet. Overall, the absence of mouse apoE resulted in increased FA levels, while no significant differences between hE4 and WT mice were observed. Notably, hE4 mice showed higher SFA levels when fed a HFHC compared to chow diet.
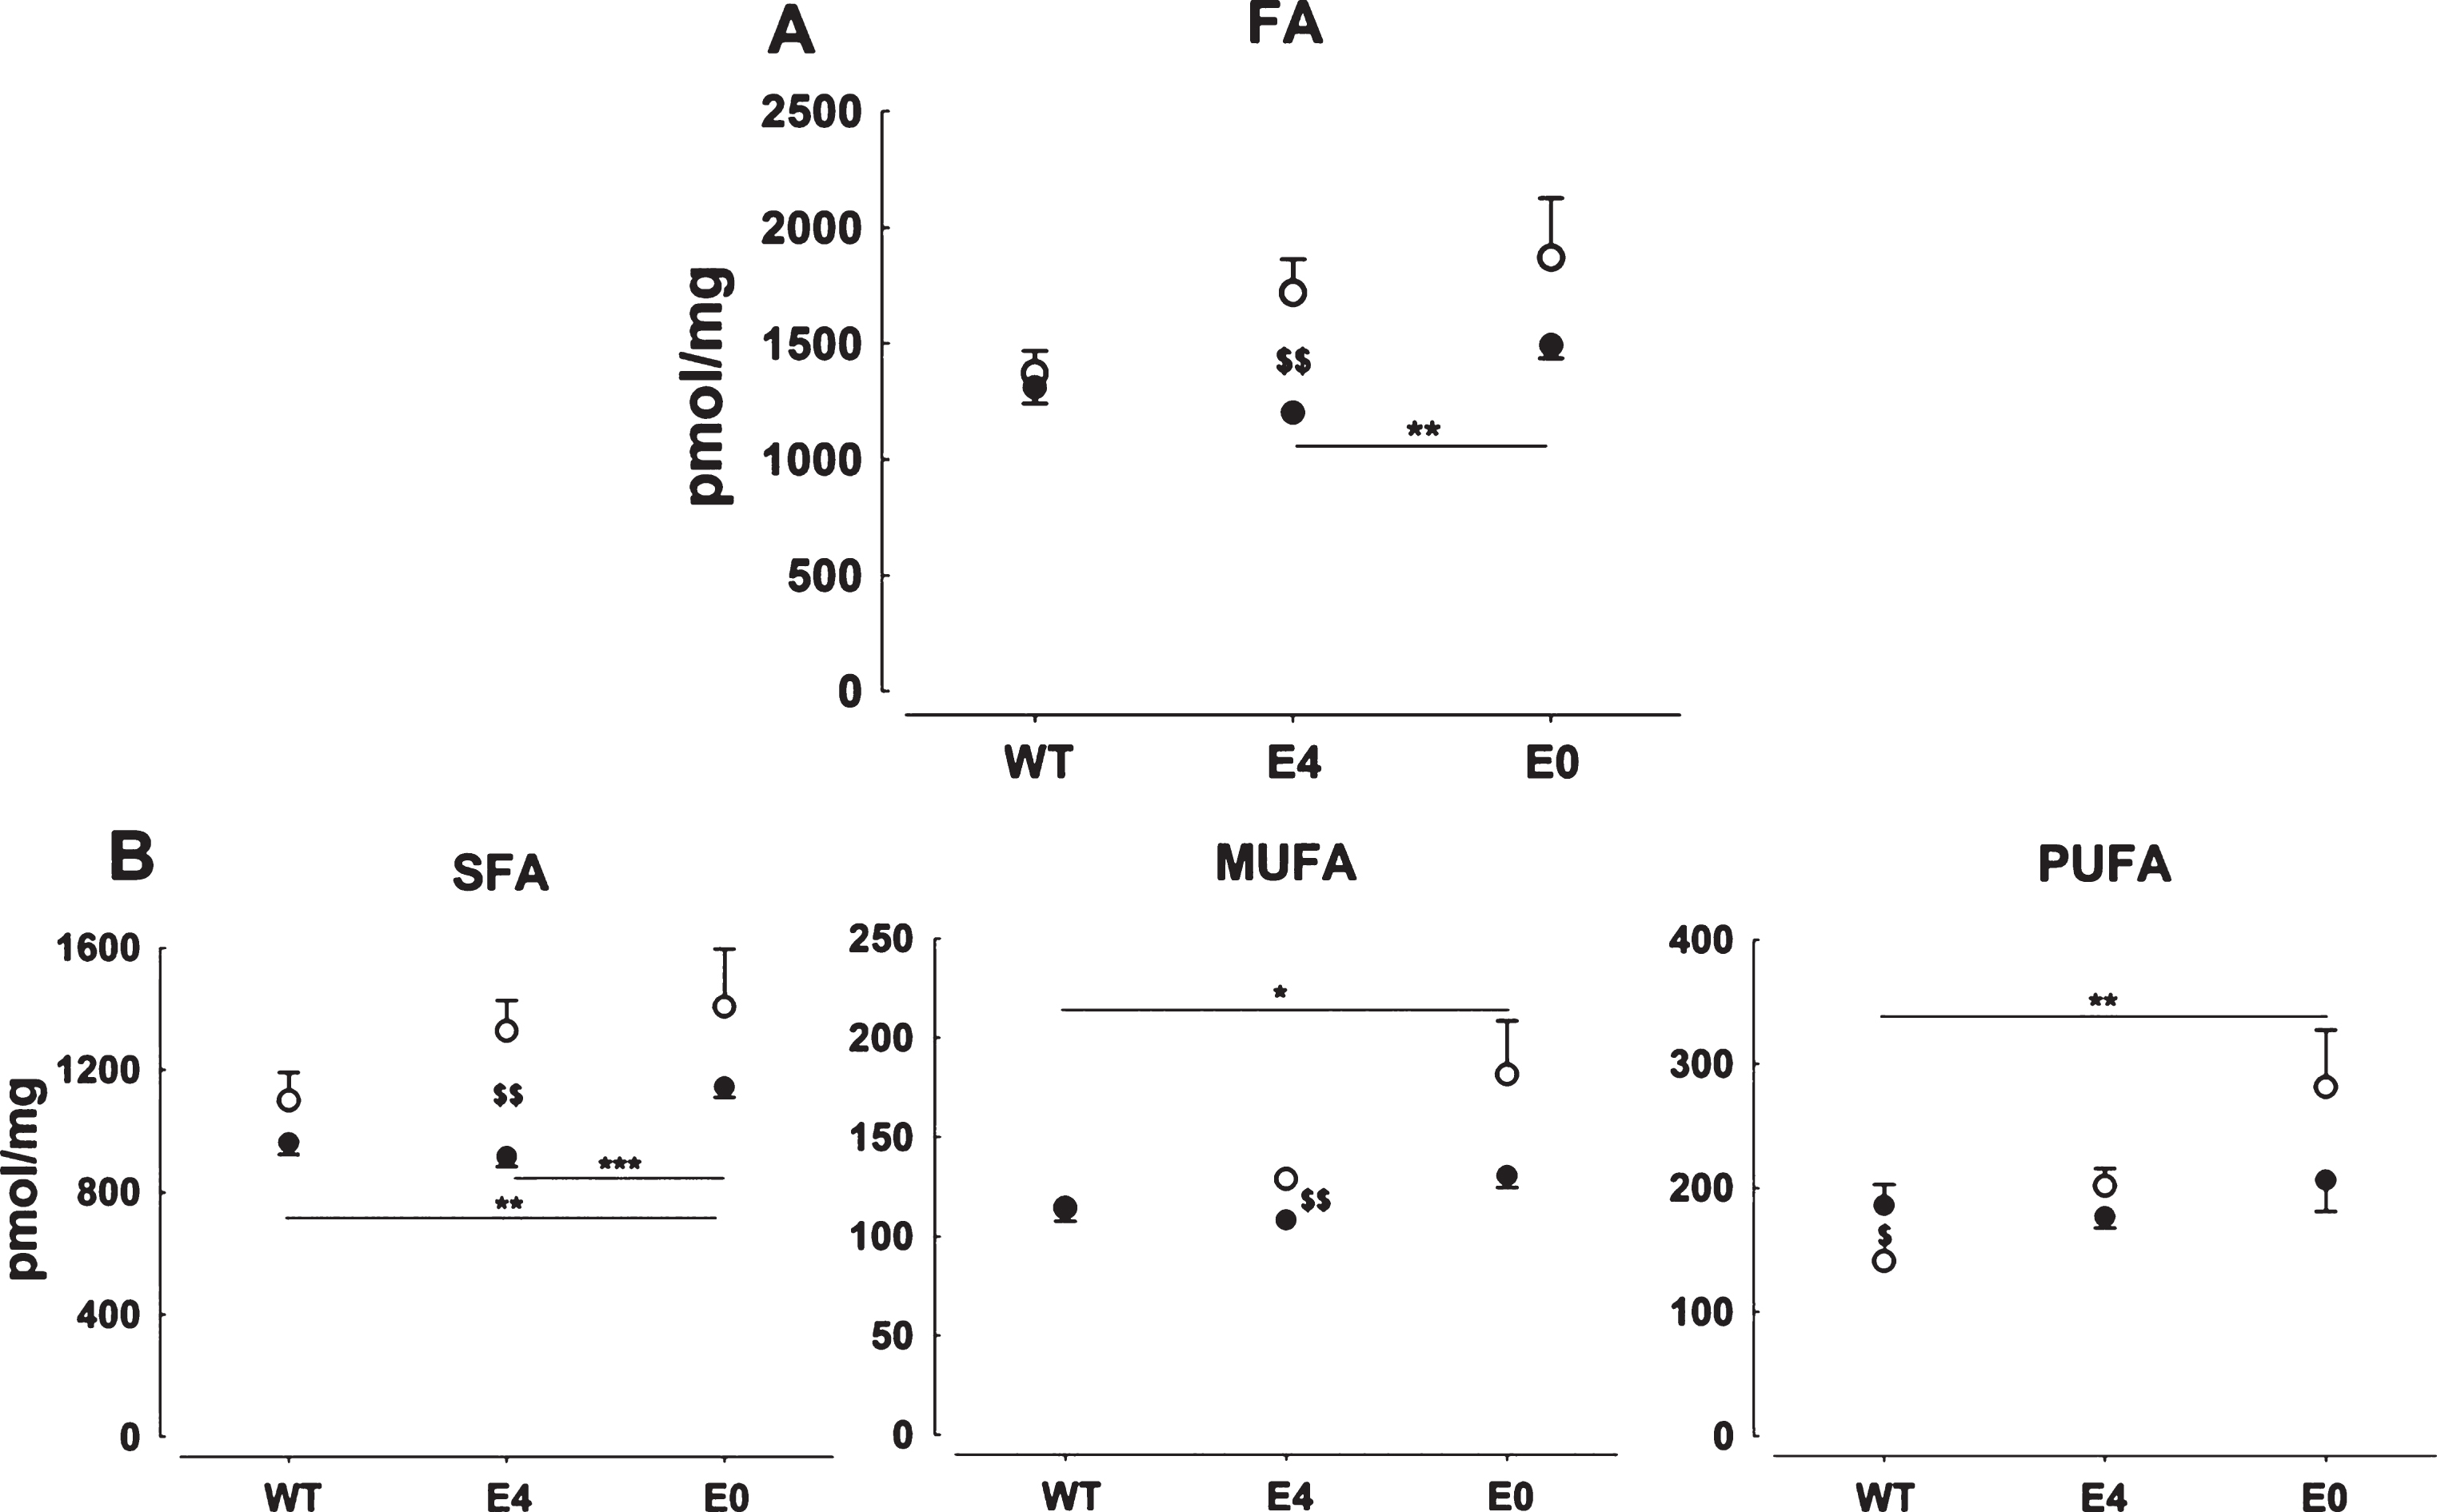
Cerebral fatty acid concentration in WT, hE4, and E0 mice on chow (•) or HFHC (∘) diet. Data represent mean ± SEM and are normalized to weight of brain sample, n = 6–8, *p < 0.05, **p < 0.01, and ***p < 0.001 for differences between genotypes and $p < 0.05 and $$p < 0.01 for differences between diet. Bottom lines indicate changes between genotype in animals on chow and the top line on HFHC diet. A) Total fatty acid levels of WT, hE4, and E0 mice on chow and HFHC diet. Bottom lines indicate changes between genotype in animals on chow and the top line on HFHC diet. B) SFA (left), MUFA (middle), and PUFA (right) levels in WT, hE4, and E0 mice on chow and HFHC diet.
Lower mRNA levels of CerS6, ceramide, and FA transporters in hE4 mice compared to WT and E0 mice on chow
Next, we examined the mRNA levels of SPT, CerS1-6, ASAH1, aSMase, and nSMase1 and 2, encoding enzymes involved in ceramide synthesis and degradation [50, 51]. SPT, CerS1-5, nSMase1, and nSMase2 expression levels were not different among the three mouse strains on chow (Fig. 3A). Interestingly, CerS6 mRNA levels were 2–2.5 fold lower in hE4 mice compared to WT and E0 mice (p = 0.001 and p = 0.013, respectively). The expression of ASAH1, encoding acid ceramidase that degrades ceramides in lysosomes [52, 53], was similar in hE4 and WT mice but lower in E0 mice (both p < 0.001). aSMase expression was lower in hE4 mice compared to WT mice (p = 0.043) on chow. Compared to chow, the HFHC diet reduced expression of all CerS genes in both hE4 and WT mice, but not in E0 mice. mRNA levels of SPT, aSMase, and nSMase2 were not affected by the HFHC diet in hE4 mice, but were decreased in WT mice as were the levels of aSMase and nSMase2 in E0 mice. In HFHC diet fed animals, there was no difference in CerS expression between hE4 and WT mice, but mRNA levels were lower in E0 mice (p = 0.041 and p = 0.042, respectively). Similarly, there was no difference in expression of aSMase and nSMase2 between hE4 and WT mice. The expression of nSMase2 was higher in hE4 mice compared to E0 mice (p = 0.018), while no differences with WT mice were observed. Differences in expression between the three strains were not observed for SPT, ASAH1, and nSMase1. Overall, the genes encoding for enzymes involved in ceramide metabolism were similarly expressed in hE4 and WT mice, with the notable exception of CerS6 in chow-fed animals.
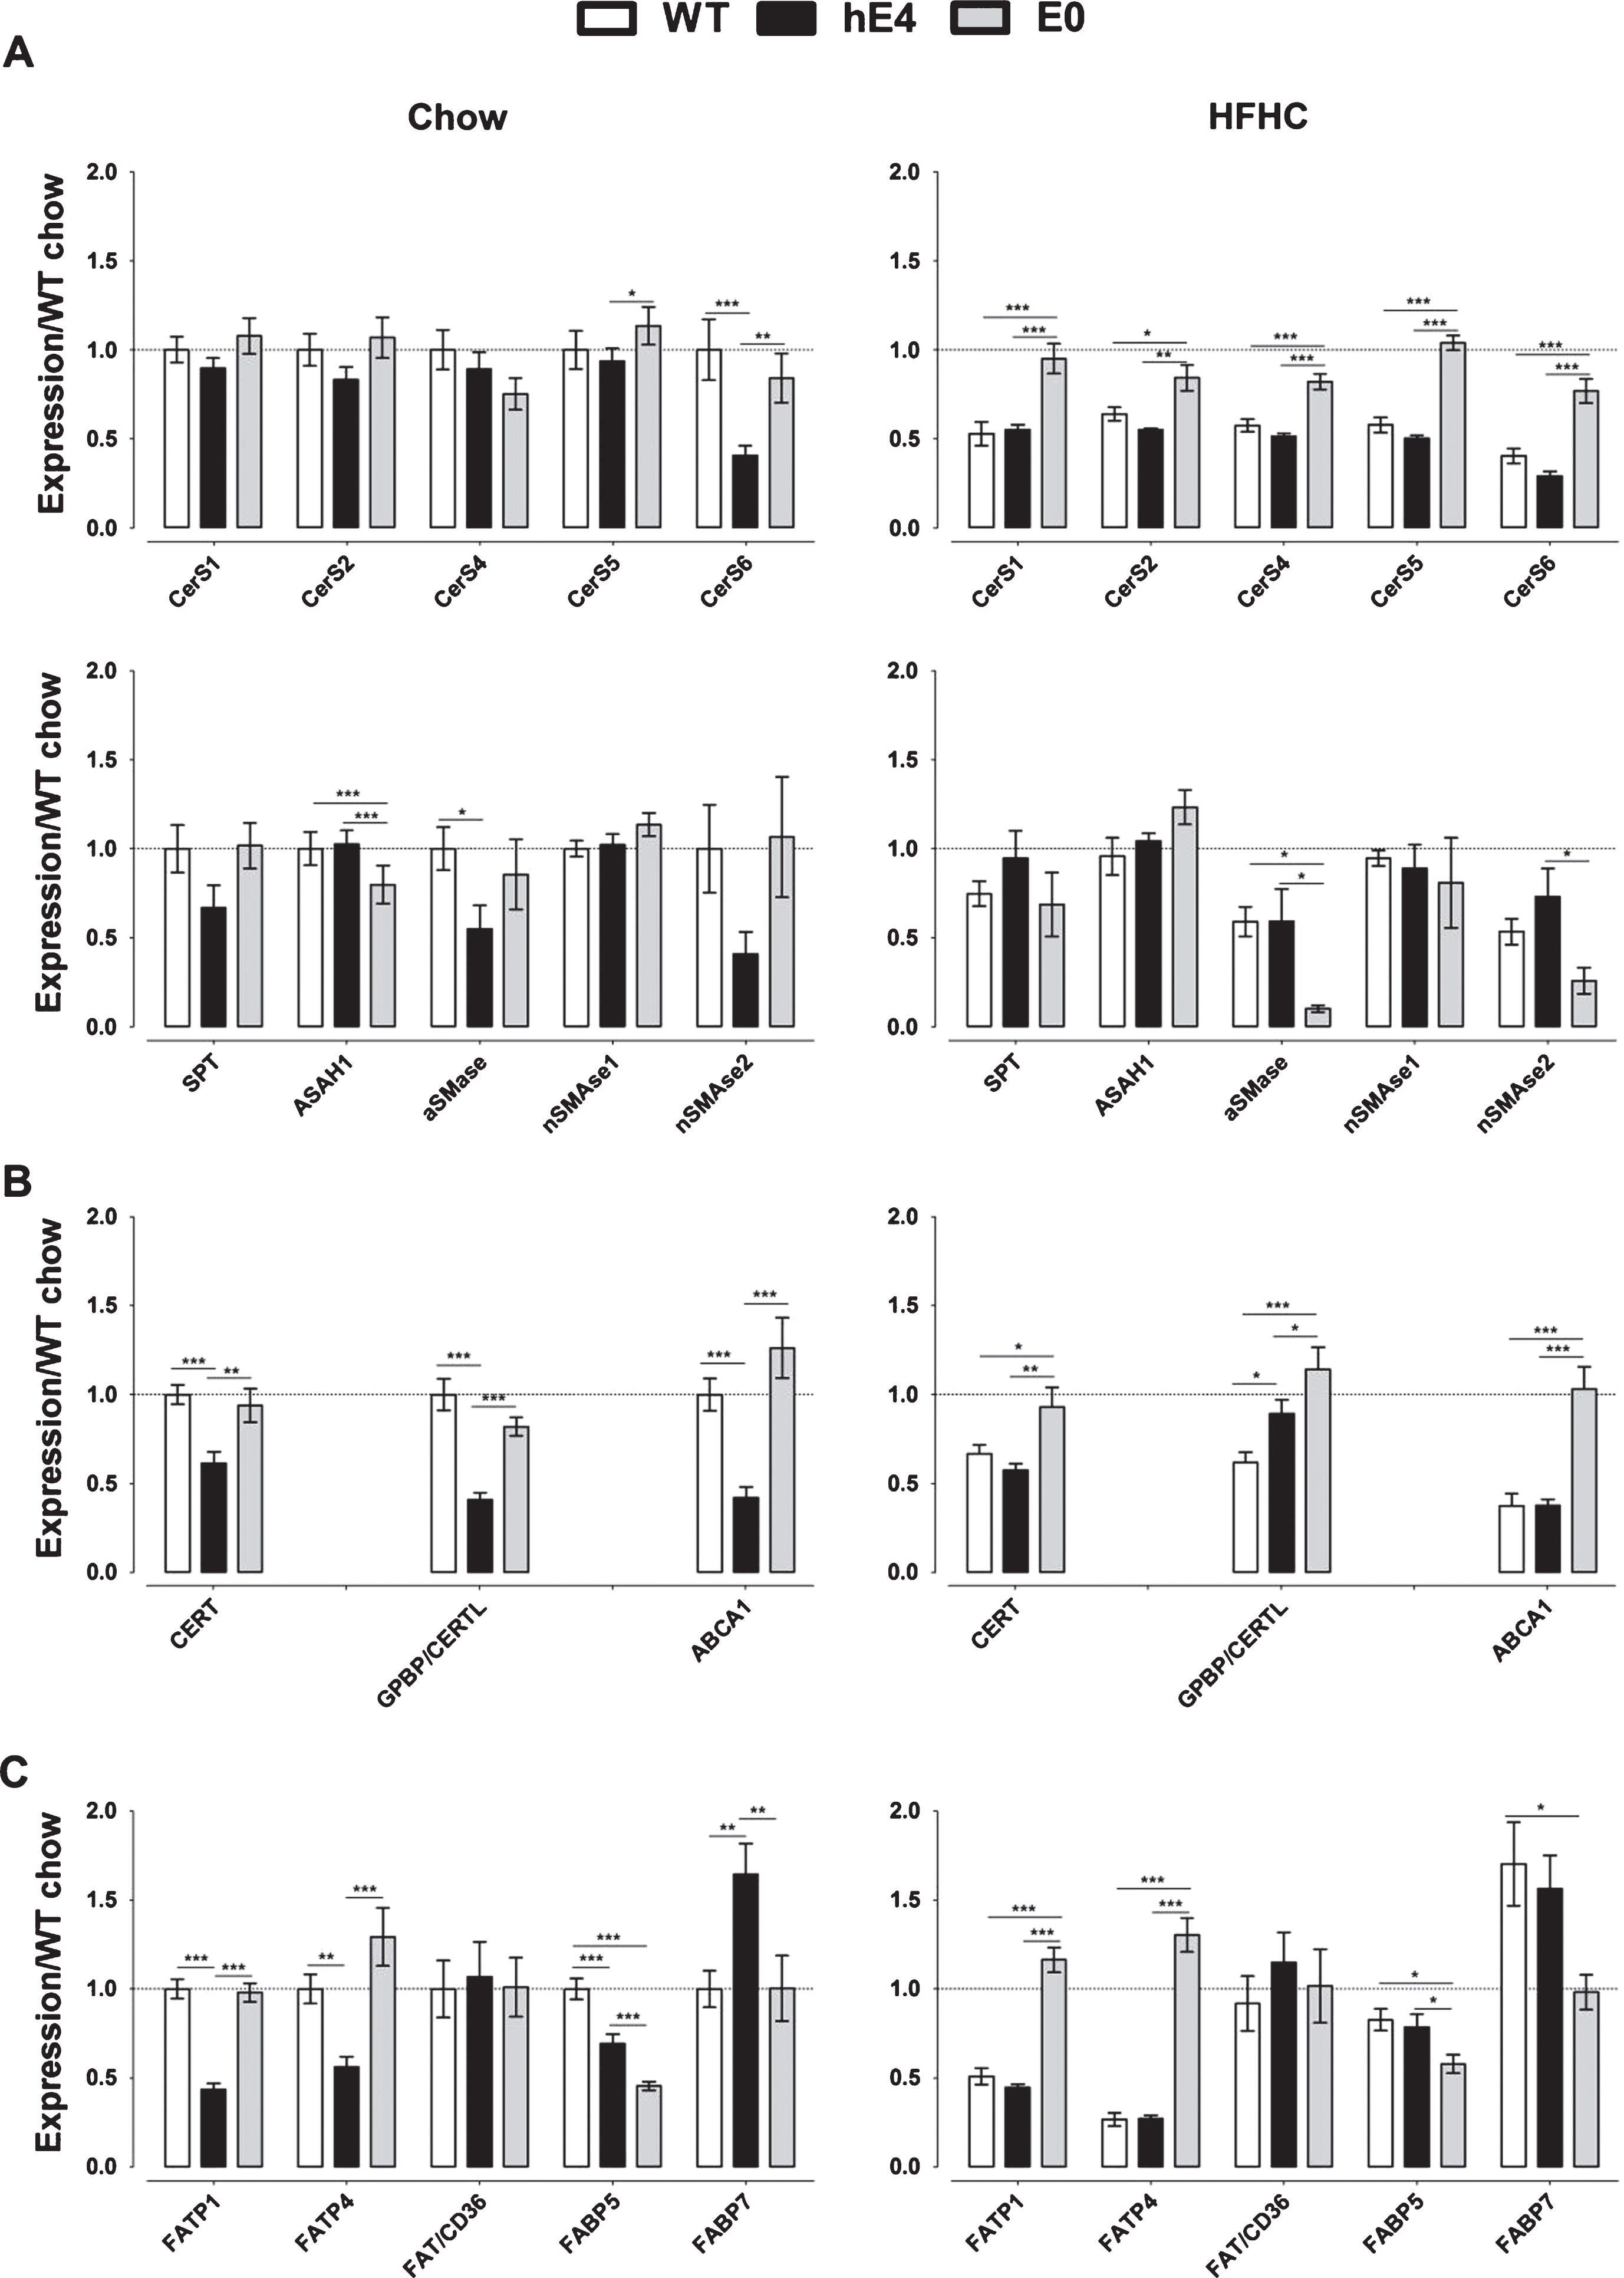
mRNA expression levels in WT (white), hE4 (black), and E0 (gray) mice on chow and HFHC diet. Data represent mean ± SEM and are normalized to WT chow data, n = 6–8, *p < 0.05, **p < 0.01, and ***p < 0.001 for differences between genotypes. A) mRNA expression of genes involved in ceramide metabolism in WT, hE4 and E0 mice on chow (left) and HFHC diet (right). B) mRNA expression of ceramide transporters in WT, hE4, and E0 mice on chow (left) and HFHC diet (right). C) mRNA expression of FA transporters and binding proteins in WT, hE4, and E0 mice on chow (left) and HFHC diet (right).
The expression of CERT, GPBP/CERTL, and ABCA1, all encoding ceramide transporters [54, 55], in animals on chow was 1.5–3.0 fold lower in hE4 mice than in both other strains (p < 0.01 for all comparisons; Fig. 3B). On a HFHC diet, the expression of all genes was lower in hE4 and WT mice when compared to E0 mice (p < 0.05 for all comparisons). CERT and ABCA1 were similarly expressed in hE4 and WT mice, while GPBP/CERTL expression was 1.4-fold higher in hE4 mice compared to WT mice (p = 0.019). The HFHC diet resulted in a lower expression of all three ceramide transporter genes only in WT mice, while the expression of GPBP/CERTL was increased by 2.2-fold in hE4 and 1.4-fold in E0 mice (p < 0.001 and p = 0.024, respectively). Overall, we observed lower mRNA levels of ceramide transporters in hE4 mice compared to both other strains on chow but not HFHC diet.
In hE4 mice on chow, FABP5 mRNA levels were 1.4-fold lower compared to WT mice (p < 0.001) but 1.5-fold higher compared to E0 mice (p = 0.001). The mRNA levels of FATP1 and FATP4 were significantly lower and of FABP7 significantly higher in hE4 mice than in both other strains on chow (p < 0.01 for all comparisons). The expression of the genes encoding fatty acid transporters or binding proteins was not significantly different between E0 and WT mice, except for a 2.2-fold lower expression of FABP5 mRNA in the E0 mice (p < 0.001; Fig. 3C). On a HFHC diet, expression of FATP1 and FATP4 did not differ between hE4 and WT mice, but was higher and FABP5 and FABP7 expression lower in the absence of mouse apoE (p < 0.05 for all comparisons). The HFHC diet had a variable effect on gene expression in the three strains. It was associated with a lower expression of FATP1, FATP4, and FABP5 and a higher expression of FABP7 in WT mice, while it resulted in higher expression of FATP1 and FABP5 in E0 mice. In hE4 mice, FATP4 mRNA levels were lower on HFHC diet. Only the FAT/CD36 gene was similarly expressed in the 3 strains of mice on both diets. Overall, we observed a specific expression pattern of most FA transport and binding proteins in hE4 mice compared to WT and E0 mice on chow that is absent on HFHC diet.
DISCUSSION
We have compared the effects of knocking-out the mouse Apoe gene and replacing mouse apoE by human ApoE4 on cerebral ceramide and FA levels in 15-month-old female mice fed either chow or a HFHC diet. We found that the absence of mouse apoE resulted in lower cerebral ceramide levels, which were not restored to levels observed in WT mice by the introduction of human ApoE4. Our data suggest that human ApoE4 differs from mouse apoE, the functional equivalent of human ApoE3, in maintaining relatively high cerebral ceramide levels. In particular, cerebral levels of Cer16 : 0 and Cer24 : 1 were much lower in hE4 than in WT mice and similar to those in E0 mice, indicating that cerebral levels are modulated by ApoE. In all three mouse strains, cerebral ceramide levels were hardly influenced by the diet, indicating strictly controlled ceramidelevels in the brain. In addition, we observed higher levels of SFA in hE4 mice on a HFHC diet, suggesting that human ApoE4 increases susceptibility to SFA accumulation in the brain.
The presence of ApoE4 increases the risk of developing AD [1, 2]. Previous studies have shown higher levels of ceramide in brains of AD patients compared to non-demented controls [56–61]. Our observation of lower brain ceramide levels of hE4 and E0 mice compared to WT mice was therefore unexpected. However, APOE genotype was not taken into account in the previous studies and, to the best of our knowledge, few studies have explored the relationship between APOE4 genotype and ceramide levels. Alternatively, brain ceramide levels may only increase during the progression toward AD or in specific regions of the brain. In contrast with our findings, Bandaru et al. found no difference in ceramide levels in the middle frontal gyrus grey and white matter of non-demented ApoE4 and ApoE3 carriers [21]. The difference with our findings may be due to the fact that we analyzed ceramides in homogenized total female mouse brains. Sphingolipid profiles have been shown to vary between brain regions and cell types [62]. Only minor differences in total brain ceramide levels were found in male human ApoE2, E3, and E4 knock-in mice [30]. Sex-specific effects on ceramide accumulation have been reported [63]. Therefore, the observed hE4-related effects may be restricted to female animals. Besides absolute ceramide levels, the balance between long and very long chain ceramides may determine cell survival [64]. Both on chow and HFHC diet, we observed a change in this balance. The relative contribution of Cer18 : 0 was higher in hE4 mice compared to WT mice, while the contribution of Cer24 : 1 was lower, especially on a HFHC diet. The contribution of Cer18 : 0 to the total ceramide pool was relatively high in brain, but not inplasma.
Both on chow and HFHC diet, expression of SPT, most CerS genes, ASAH1 and most SMases was similar in hE4 and WT mice. An exception is CerS6, which showed lower expression in hE4 than in WT and E0 mice on chow. The ceramide synthases CerS1-6 have different substrate specificities for FAs. In particular, C16 ceramides are preferentially synthesized by CerS5 and 6, and C24 ceramides by CerS2 and 4 [65, 66]. Decreased expression of CerS6 could explain the observed differences in Cer16 : 0 levels between WT mice and hE4, but not E0 mice. SPT catalyzes the first step of de novo sphingolipid synthesis [67]. Since SPT expression does notdiffer between WT, hE4 and E0 mice we assume that the -de novo- sphingolipid synthesis is not affected by genotype. Ceramides are central to sphingolipid metabolism and can be converted into other bioactive lipids, such as sphingomyelin, sphingosine-1-phosphate, and ceramide-1-phosphate [67–69]. An increased conversion into one of these sphingolipids could have led to the lower ceramide levels we observed in hE4 and E0 mice. An alternative explanation is decreased breakdown of sphingomyelin into ceramide by SMases. However, as for CerS6, we observed a decreased expression of aSMase in hE4 mice compared to WT mice, but not in E0 mice. Again, this could explain the observed differences in ceramide levels between WT and hE4, but not E0 mice. aSMase is active both at the cell membrane and the lysosomes while the nSMases function only at the cell membrane [67]. The nSMases were not affected by the APOE genotype. It remains to be determined if ApoE affects the transport of ceramides from plasma to the brain. Notably, we found much lower plasma levels of Cer16 : 0 and Cer24 : 1 in hE4 mice compared to WT mice in line with lower ceramide levels in brain.
Quantitatively, cerebral total FA levels were much less affected by APOE genotype than ceramide levels. Compared to WT mice, E0 mice displayed higher levels of SFA when fed standard chow and higher levels of MUFA and PUFA when on a HFHC diet. Knocking-in human ApoE4 restored FA levels to those observed in WT mice, indicating that human ApoE4 can replace mouse apoE in maintaining FA levels. In line with this, we observed only minimal changes in plasma FA levels between WT and hE4 mice, while E0 mice displayed lower plasma FA levels (Supplementary Figure. 2). Interestingly, the expression of FABP5, which facilitates docosahexaenoic acid (DHA) uptake across the BBB [70], was decreased in E0 compared to WT mice and partly restored in the hE4 mice. FABP5 was previously found to regulate cognitive function by its role in the transport of FAs, especially PUFAs [71, 72], and was identified as a risk factor for AD in combination with APOE genotype [73].
We found a number of hE4-specific effects, as compared to WT and E0 mice, on gene expression. In chow-fed animals expression of CerS6, aSMase, CERT, GPBP/CERTL, ABCA1, FATP1, and FATP4 was decreased and FABP7 was increased in hE4 mice compared to both WT and E0 mice. These effects may all contribute to the low ceramide levels in the hE4 mice compared to WT mice (Fig. 1). Decreased levels of CERT and GPBP/CERTL have a direct effect on ceramide transport and availability both intra- and extracellularly [24, 55]. Moreover, the ceramide transport protein has been found associated with amyloid plaques in AD brain [13]. FATP1, FATP4, and FABP7 transport FAs across the BBB and into the nucleus of cells [74, 75] and ApoE appears to have an isoform-specific role in the trafficking of FAs between brain cells and across the BBB [41, 76–78], which is in line with our data showing effects on the expression of FATP1, FATP4, and FABP7 in the hE4 mice specifically. Moreover, elevated levels of FABP7 proteins have been measured in the serum of AD patients [79].
In agreement with Kariv-Inbal et al. [80], we found that only on a HFHC diet human ApoE4 increased brain SFA levels, and to a lesser extent also MUFA levels, while we did not observed an effect in WT mice. Plasma FA levels were far more susceptible to diet-induced changes, especially in hE4 and E0 mice (Supplementary Figure. 2). ApoE was found to be essential in protecting the brain from HFHC diet-induced neuropathologies [17], and our results suggest that human ApoE4, in comparison with mouse apoE, is less capable in maintaining this protection. Excess SFAs tend to have a negative effect on normal brain function and cognition, while high levels of MUFAs and PUFAs tend to be beneficial [81–83]. Additionally, SFAs in general, and palmitic acid (C16 : 0) in particular, may affect de novo synthesis of ceramides [39, 85]. The HFHC diet reduced mRNA levels of all CerSs in WT and hE4 mice, but hardly in E0 mice. In effect, on a HFHC diet the mRNA levels of most of these genes were similar in hE4 and WT mice. In WT mice, the expression of all ceramide transporters and most FA transporters was lower on a HFHC diet, which may be a compensatory mechanism for the increased FA availability due to the diet. In contrast to WT mice, hE4 and E0 mice showed minimal changes in expression of ceramide and FA transporters as a result of diet. This suggests a loss of function of hE4 in ceramide and FA transport and a reduced ability to protect the brain against FA loading upon a HFHC diet.
We found a number of effects specific to hE4 mice in comparison with WT mice. Because murine apoE behaves more like human ApoE3 than human ApoE4 [42, 43], it can be speculated that differences found between hE4and WT mice, such as observed for cerebral ceramide and fatty acid homeostasis, also exist between hE4 and hE3 mice. However, future experiments need to confirm this.
In conclusion, our data strongly suggests a role for human ApoE4 in cerebral ceramide and FA homeostasis. The absence of mouse apoE resulted in low cerebral ceramide levels, which was not restored by human ApoE4. The APOE genotype affected brain FA profile when mice were fed a HFHC diet. There was an hE4-specific reduction in mRNA levels of ceramide synthase 6, ceramide transporters, and FA transporters on chow, while on HFHC diet levels in WT mice, but not E0 mice, decreased to levels similar to those observed in hE4 mice. hE4 mice on chow displayed similar brain SFA levels and similar expression levels of most genes implicated in ceramide metabolism as WT mice on a HFHC diet. Our findings suggest that human ApoE4 may mimic and perhaps augment the adverse effects of a HFHC diet on brain ceramide and fatty acid homeostasis, and thereby enhance the development of AD.