
Abstract
Seizures occur at a higher frequency in people with Alzheimer’s disease (AD) but overt, clinically obvious events are infrequent. Evidence from animal models and studies in mild cognitive impairment suggest that subclinical epileptic discharges may play a role in the clinical and pathophysiological manifestations of AD. In this feasibility study, the neurophysiological and cognitive effects of acute administration of levetiracetam (LEV) are measured in patients with mild AD to test whether it could have a therapeutic benefit. AD participants were administered low dose LEV (2.5 mg/kg), higher dose LEV (7.5 mg/kg), or placebo in a double-blind, within-subject repeated measures study with EEG recorded at rest before and after administration. After administration of higher dose of LEV, we found significant decreases in coherence in the delta band (1–3.99 Hz) and increases in the low beta (13–17.99 Hz) and the high beta band (24–29.99 Hz). Furthermore, we found trends toward increased power in the frontal and central regions in the high beta band (24–29.99 Hz). However, there were no significant changes in cognitive performance after this single dose administration. The pattern of decreased coherence in the lower frequency bands and increased coherence in the higher frequency bands suggests a beneficial effect of LEV for patients with AD. Larger longitudinal studies and studies with healthy age-matched controls are needed to determine whether this represents a relative normalization of EEG patterns, whether it is unique to AD as compared to normal aging, and whether longer term administration is associated with a beneficial clinical effect.
INTRODUCTION
Patients with Alzheimer’s disease (AD) have an increased risk of epilepsy, with 1.5% to 22% developing unprovoked seizures. These rates are even higher when AD is early-onset and familial [1–10]. While the majority of patients do not have clinically evident seizures, subclinical epileptic activity may be more prevalent, and has been hypothesized to underlie some fluctuations in cognition in AD [3]. A recent study showed that 42.4% of patients with AD had subclinical epileptiform activity when epilepsy was assessed by overnight long-term video-electroencephalography (EEG) and magnetoencephalography, as compared with 10.5% of controls and that patients who showed subclinical epileptic activity had faster decline in global cognition [11]. If present, even subclinical epileptic discharges in the hippocampus and other limbic structures could disrupt network activity in circuits critical for memory [12].
Previous studies in mouse models of AD have shown abnormal EEG spiking activity that is correlated with behavioral deficits [13, 14]. In these models, the acute administration of an antiepileptic drug (AED), levetiracetam (LEV), blocked the spiking activity and reversed the cognitive deficits. LEV decreases the frequency and limits the propagation of epileptiform activity without affecting normal neuronal excitability [15, 16]. The mechanism of action of LEV is not fully understood, but it binds selectively to synaptic vesicle protein SV2A and likely modulates its function [17]. In AD animal models, LEV showed efficacy whereas a number of other AEDs with different mechanisms of action (ethosuximide, gabapentin, phenytoin, pregabalin, valproic acid, and vigabatrin) were ineffective [13].
The neurophysiological effects of LEV have been studied in epilepsy patients, where LEV has been shown to decrease the power of delta and theta bands and increase that of the high alpha (10–13 Hz) and middle beta (19–24 Hz) band in drug-naive epilepsy patients [18]. Acute dosing of LEV at a dose of 500 mg caused significant reduction in the frequency of interictal epileptiform activity in 8/10 patients with epilepsy [19]. Another study using functional magnetic resonance imaging (fMRI) to determine the effects of a low dose of LEV in patients with amnestic mild cognitive impairment (aMCI) has shown that it reduces the aberrantly increased fMRI activity in the dentate gyrus/CA3 to the same level as healthy controls [20]. In this study, LEV improved the task-related memory performance on a forced choice memory task for patients with aMCI. Elderly people with cognitive impairment such as AD, mixed dementia, or MCI with epilepsy tolerated LEV as well, and improvements were seen in the Mini-Mental State Examination (MMSE) and the Alzheimer’s Disease Assessment Scale–Cognitive [21].
It is difficult to directly study the occurrence of epileptic activity in the medial temporal lobes of patients suffering from AD since medial temporal lobe sources have deep localization and are not visible on scalp EEG unless activity propagates to neocortex. We therefore sought to investigate whether LEV could improve abnormalities on other EEG parameters using quantitative EEG, which has been used to show differences between healthy controls and AD. Quantitative EEG has also been used to assess the progression of AD and MCI using spectralpower [22–26] and connectivity measures like coherence [27–33]. To date, we are unaware of any published study investigating the neurophysiological and cognitive effects of acute administration of AEDs in patients suffering from AD without known epilepsy. In this feasibility study, we therefore wanted to test the cognitive and neurophysiological effects of acutely administering two different doses of LEV (2.5 mg/kg and 7.5 mg/kg) intravenously as compared to a placebo/saline administration in patients with mild AD. We sought to measure whether LEV leads to changes when looking at quantitative EEG or cognitive scores, and whether these changes could support the hypothesis that patients with AD, even in the absence of clinically evident seizures, may still benefit from AED therapy.
METHODS
We conducted a double-blind, within-subject crossover design study in which participants with mild AD received placebo, 2.5 mg/kg, and 7.5 mg/kg of LEV intravenously in a random order in three sessions. The three sessions (placebo, 2.5 mg/kg LEV, and 7.5 mg/kg LEV) were held at least one week apart to allow for complete washout of the drug. During each session, baseline EEG was recorded for 20 min prior to administration of the LEV/placebo. The drug was administered over a second 20-min epoch and a final 20-min epoch of EEG was recorded afterward. After completing the EEG, the participants underwent functional brain imaging with perfusion MRI and resting state functional connectivity MRI (the results from the imaging component of the study will be presented elsewhere). Finally, participants performed cognitive testing with a battery designed to test frontal executive function, declarative memory, and overall cognitive performance (Fig. 1). The study was conducted in a General Clinical Research Center and blinding was performed by the research pharmacy. The local Committee for Clinical Investigations approved the study and informed consent was acquired from patients: This study was limited to patients deemed eligible to give consent with a MMSE >20 [34]. The study was registered at ClinicalTrials.gov at the ID NCT01554683.

Overall paradigm. Participants underwent testing in three sessions counterbalanced for order, with placebo, low dose LEV, or high dose LEV (A, B, and C). Drug was administered intravenously during EEG recording after the baseline EEG was recorded. Afterwards, we recorded post EEG to compare with the baseline. Then the participants did MRI scans and finally cognitive testing was performed with a battery including a memory test particularly sensitive to hippocampal function as well as other tests of frontal function.
Subjects
Participants with mild AD, as defined by a MMSE score of 20–29, were recruited from the Cognitive Neurology Unit at Beth Israel Deaconess Medical Center and were screened to determine that they met the NINCDS-ADRDA criteria for probable AD. Inclusion criteria included age of 50–90 and native English speaking, as the cognitive battery was not available in alternative languages. Exclusionary criteria included any history of clinical seizures, current use of any AED or medication known to lower seizure threshold, presence of parkinsonism, significant cerebrovascular disease, or any other CNS disease. The patients were also screened for depression using the Geriatric Depression Scale and excluded if they score higher than 9 [35]. AD participants receiving standard treatments for dementia including cholinesterase inhibitors, memantine and serotonergic selective reuptake inhibitors were allowed to participate as long as their medical regimen remained stable for one month prior to the study and throughout all three sessions. All the included participants received standard treatment with acetylcholinesterase inhibitors (five on donepezil, one on rivastigmine, and one on galantamine) and one participant also received memantine. In addition, two participants also received selective serotonin reuptake inhibitors (mirtazapine and paroxetine). To date, 12 participants have been enrolled; 3 participants were unable to complete the protocol (two due to claustrophobia inside the MRI scanner and one due to desire not to perform the cognitive testing). However, two participants had to be excluded from the analysis prior to unblinding, due to excessive muscle and movement artifacts on EEG and inadequate awake EEG recording for analysis. Complete data sets were acquired from seven participants and their results are presented here.
Cognitive testing
The participants underwent declarative memory testing with the Free and Cued Selective Reminding Test, a task that is particularly sensitive tohippocampal function [36]. In addition, a short battery was administered to test other cognitive realms affected in early AD, including executive function, naming, visuospatial ability and semantic function (Trail Making Test Parts A+B, Phonemic fluency Test, Boston Naming Test 15-item version, clock drawing, and category fluency).
EEG recording
The EEG recordings were done with 21 electrodes placed according to the 10–20 international system (C3, C4, O1, O2, Cz, F3, F4, F7, F8, Fz, Fp1, Fp2, P3, P4, Pz, T3, T4, T5, T6) with additional electrodes placed at T1 and T2. The EEG was recorded with a sampling rate at 256 Hz for five of the patients and 200 Hz for two of the patients. The patients had their eyes open and closed during each session of the recordings after instructions from an EEG technician. Due to excessive artifacts and drowsiness in many of the recordings with eyes closed, higher quality data were available from the eyes-open EEGs and the analysis was restricted to eyes-open data.
Preprocessing
For the preprocessing, we used the EEG recordings before and after the intervention. The investigator who performed the preprocessing was blinded to condition. The data were visually inspected and epochs of the EEG free of excessive artifacts were concatenated for the period before and after the intervention and were exported to MATLAB (the Mathworks, vR2013b) using the EEGLAB toolbox (v13.2.1) [37]. Here, the EEG data was bandpass filtered from 1 to 100 Hz using a zero-phase second-order Butterworth filter. Afterwards, the EEGs were divided into 1-s epochs, and epochs with significant artifacts on visual inspection were removed. For each visit, the segments recorded before and after the intervention were merged and re-referenced to the average. Subsequently, extended infomax Independent Components Analysis [38] from the EEGLAB toolbox was utilized to remove components that clearly could be identified as muscle, eye movements, or electrode artifact. The cleaned data was subsequently divided back into pre- and post-LEV segments for further analysis. The EEGs recorded with a sampling rate at 256 Hz were downsampled to 200 Hz.
Power analysis
For the analysis of the resting state EEG, we used the cleaned files and calculated the spectral power across epochs using the spectopo function from the EEGLAB toolbox. The window length was one epoch (sampling rate: 200 Hz). The power was calculated in each of the following bands: delta (1–3.99 Hz), theta (4–7.99 Hz), alpha (8–12.99 Hz), beta1 (13–17.99 Hz), beta2 (18–23.99 Hz), beta3 (24–29.99 Hz), and beta (13–29.99 Hz).
Coherence analysis
Functional connectivity refers to the temporal correlation between signals recorded from different brain regions. There are many ways to measure functional connectivity, but for this study we used magnitude-squared coherence, which has been applied to both functional magnetic resonance imaging and EEG. Magnitude-squared coherence values can assess the functional connectivity between two electrodes in the recorded EEG and thereby indirectly calculate whether there are any connectivity changes in the brain. In this manner, it shares a conceptual framework with functional connectivity analyses done with BOLD fMRI. We assessed the strength of the connections between the recorded signals and calculated the square of the cross-spectrum of the electrodes divided by the product of the power spectra of the individual electrodes. Here, the MATLAB function mscohere was used with the default settings and coherence calculated in the same frequency bands as power. The mean coherence was calculated between each pair of electrodes for each of the aforementioned frequencybands.
Global coherence analysis
In order to test whether there were any global effects across electrodes for the coherence values, we calculated a mean global coherence for each electrode, averaging its coherence with each other electrode. This was done for all the aforementioned frequency bands.
Statistics and plotting
For power, coherence calculations, and global coherence, a two-way within-subject repeated measures ANOVA was performed for each of the power values, coherence values, and global coherence values separate in each of the aforementioned frequency bands. Post-hoc paired t-tests were then performed for each of the conditions (high-dose, low-dose, and placebo) if the interaction was significant (p-value <0.05) and the values were corrected for multiple comparisons within each frequency band using a false discovery rate (FDR) of 0.05.
For each of the cognitive scores one-way within-subject repeated measures ANOVA were performed for each of the scores comparing the scores after placebo, low-dose LEV or high-dose-LEV. The statistical analyses described above were done with MATLAB.
Correlation analysis was assessed to test the relationship between changes in coherence and cognitive performance, testing whether changes in coherence values in the fronto-parietal network (F3-P3 and F4-P4) correlated with changes in cognitive performance on tests of executive function (Trail making test part B and phonemic fluency). Furthermore, the coherence values that were significant in the temporo-parietal networks for T5-Pz and T3-C3 were correlated with phonemic and semantic fluency scores (FAS and animal naming) since these networks have been associated with fluency tasks [39]. Before doing the correlations, the post-session coherence values for the group that received the high dose LEV were contrasted with values from the placebo session. The same was done for the cognitive scores. The results of the coherence analysis (Fig. 4) were plotted using BrainNet Viewer toolbox for MATLAB [40]. A custom template for EEG electrodes locations was created by manually locating each electrode x, y and z values in the tridimensional space. Groups of electrodes belonging to different lobes (frontal, temporal, parietal, occipital) were represented using a color scheme (Fig. 3). Line thickness and color respectively represent size and sign (blue = before LEV >after LEV; red = after LEV >before LEV) of the t values obtained at the post-hoc analysis. In addition, the coherence results were also plotted using box plots (Fig. 3) and the global coherence results were plotting using topographical head maps (Fig. 5).
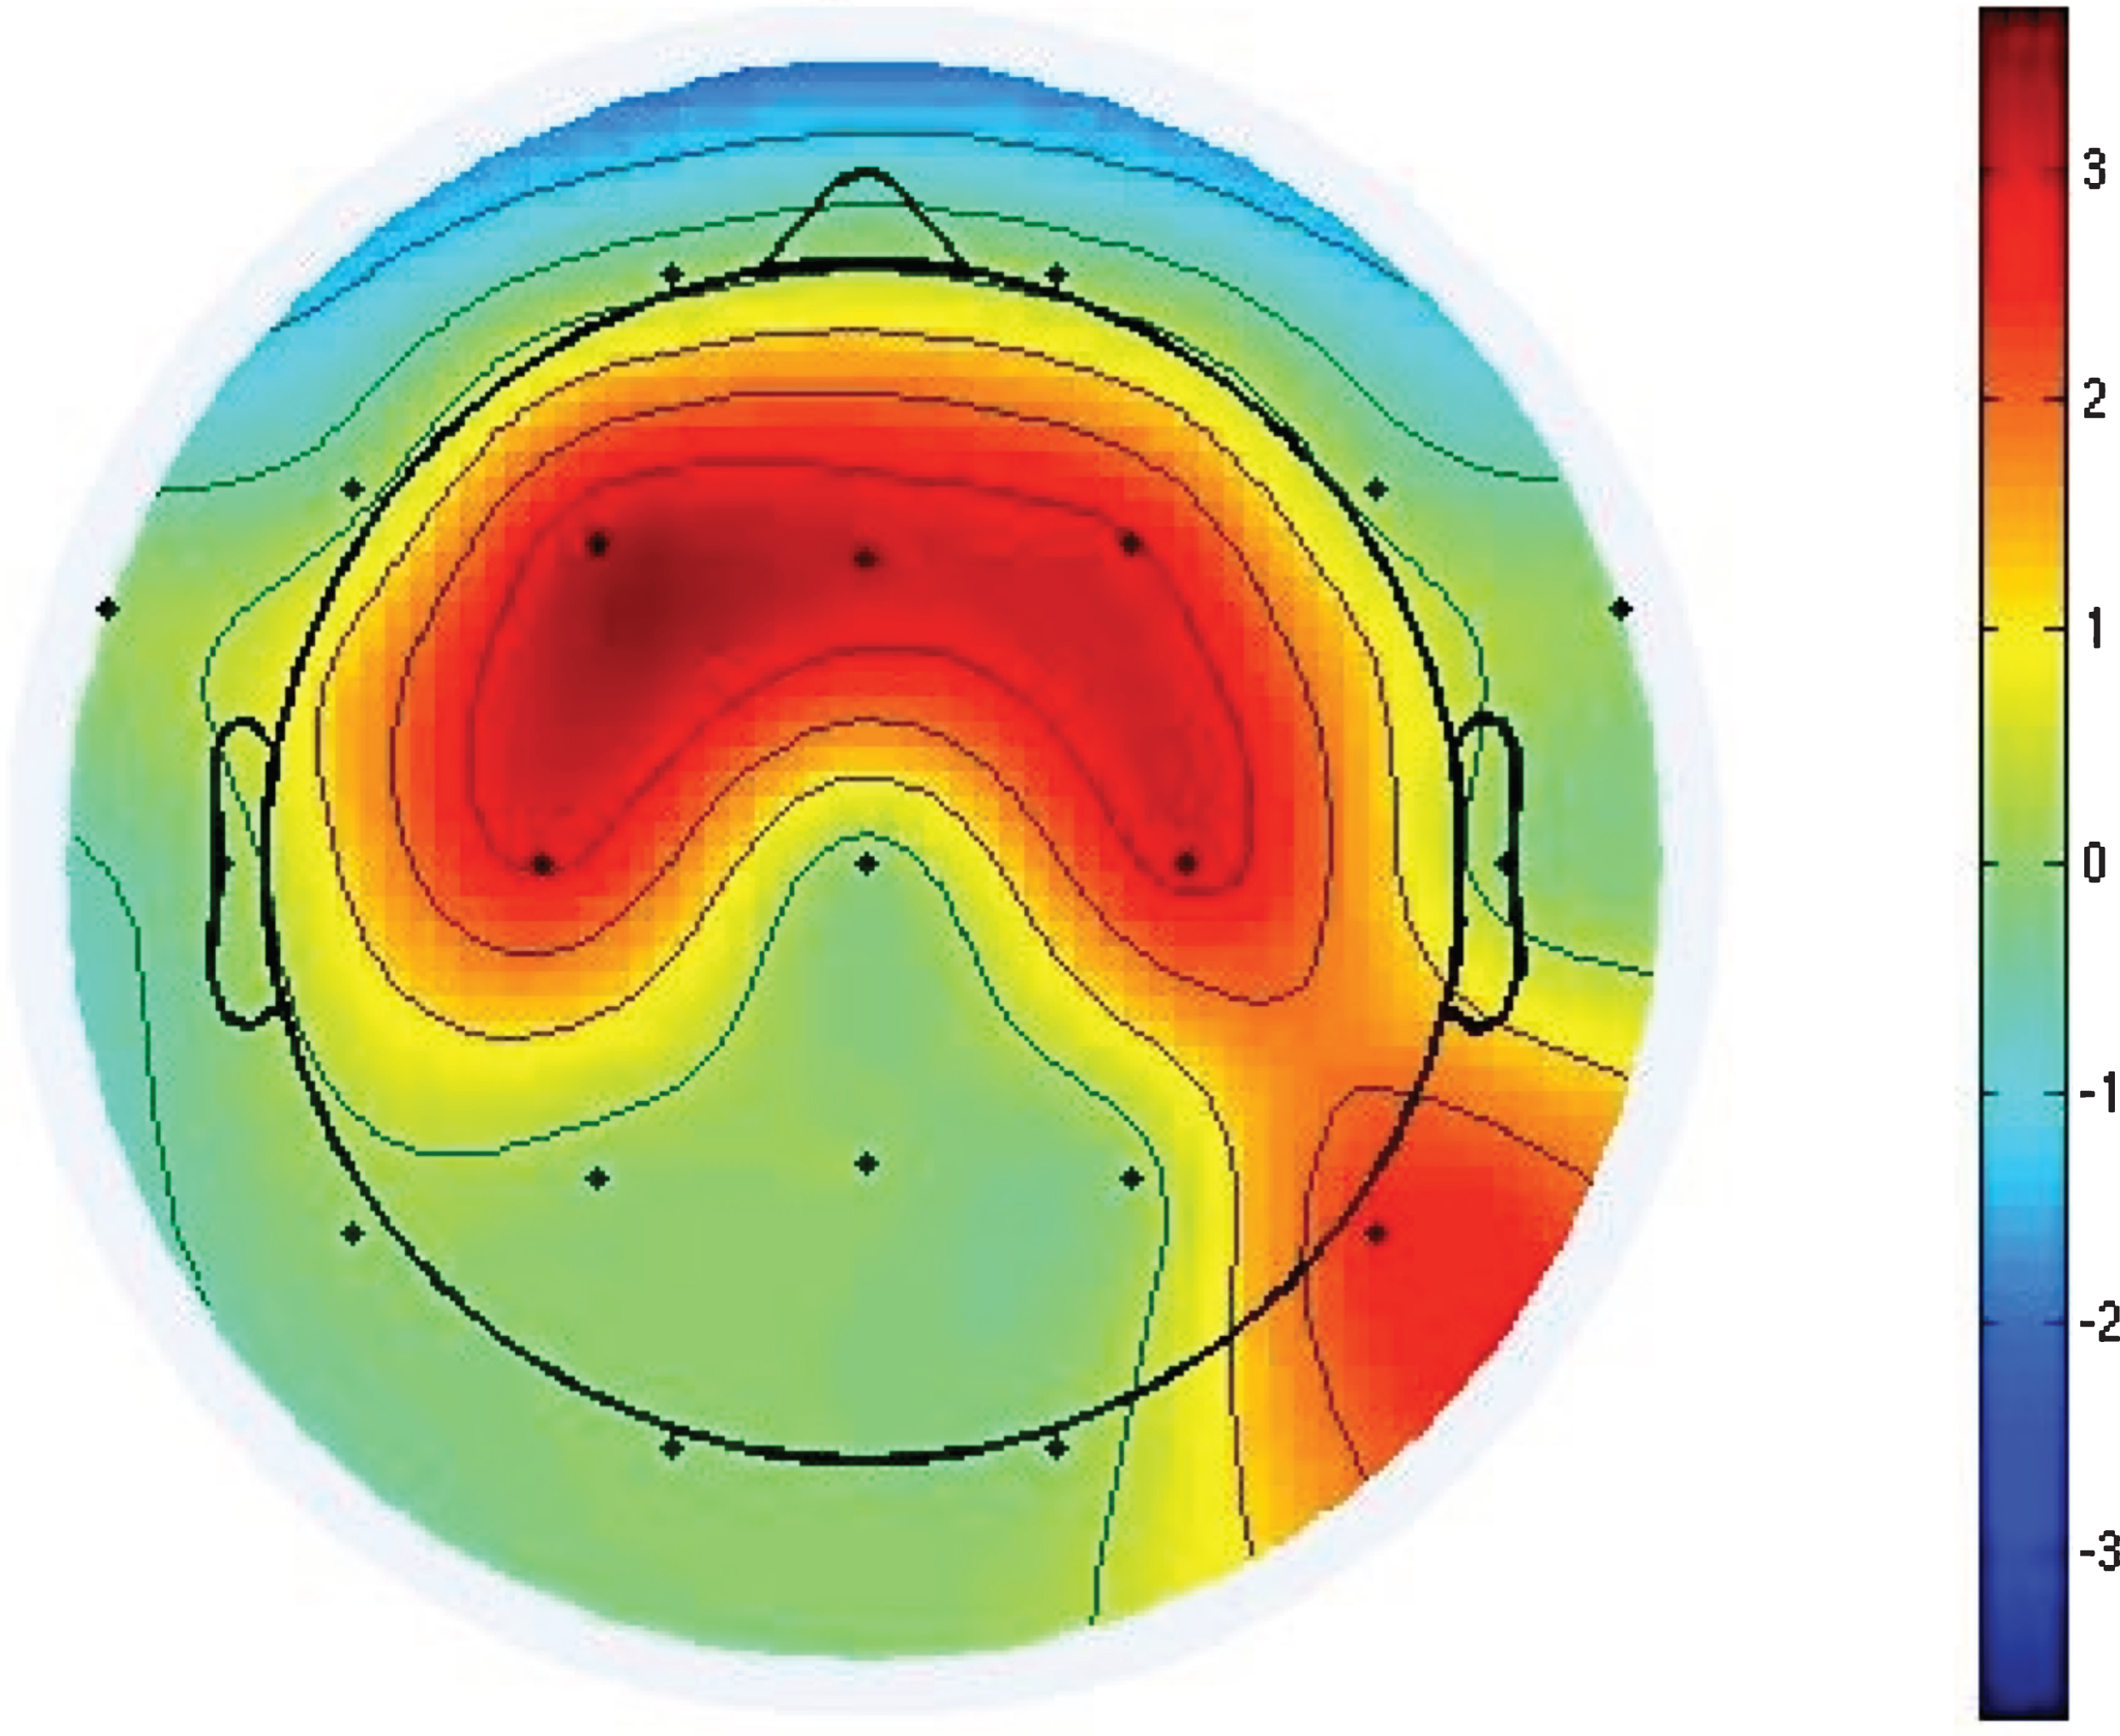
This shows the significant changes in power (p-value <0.05) in the beta3 band (24–29.99 Hz) as a result of the t-tests in the group receiving high dose of LEV. The color bar shows t-values.
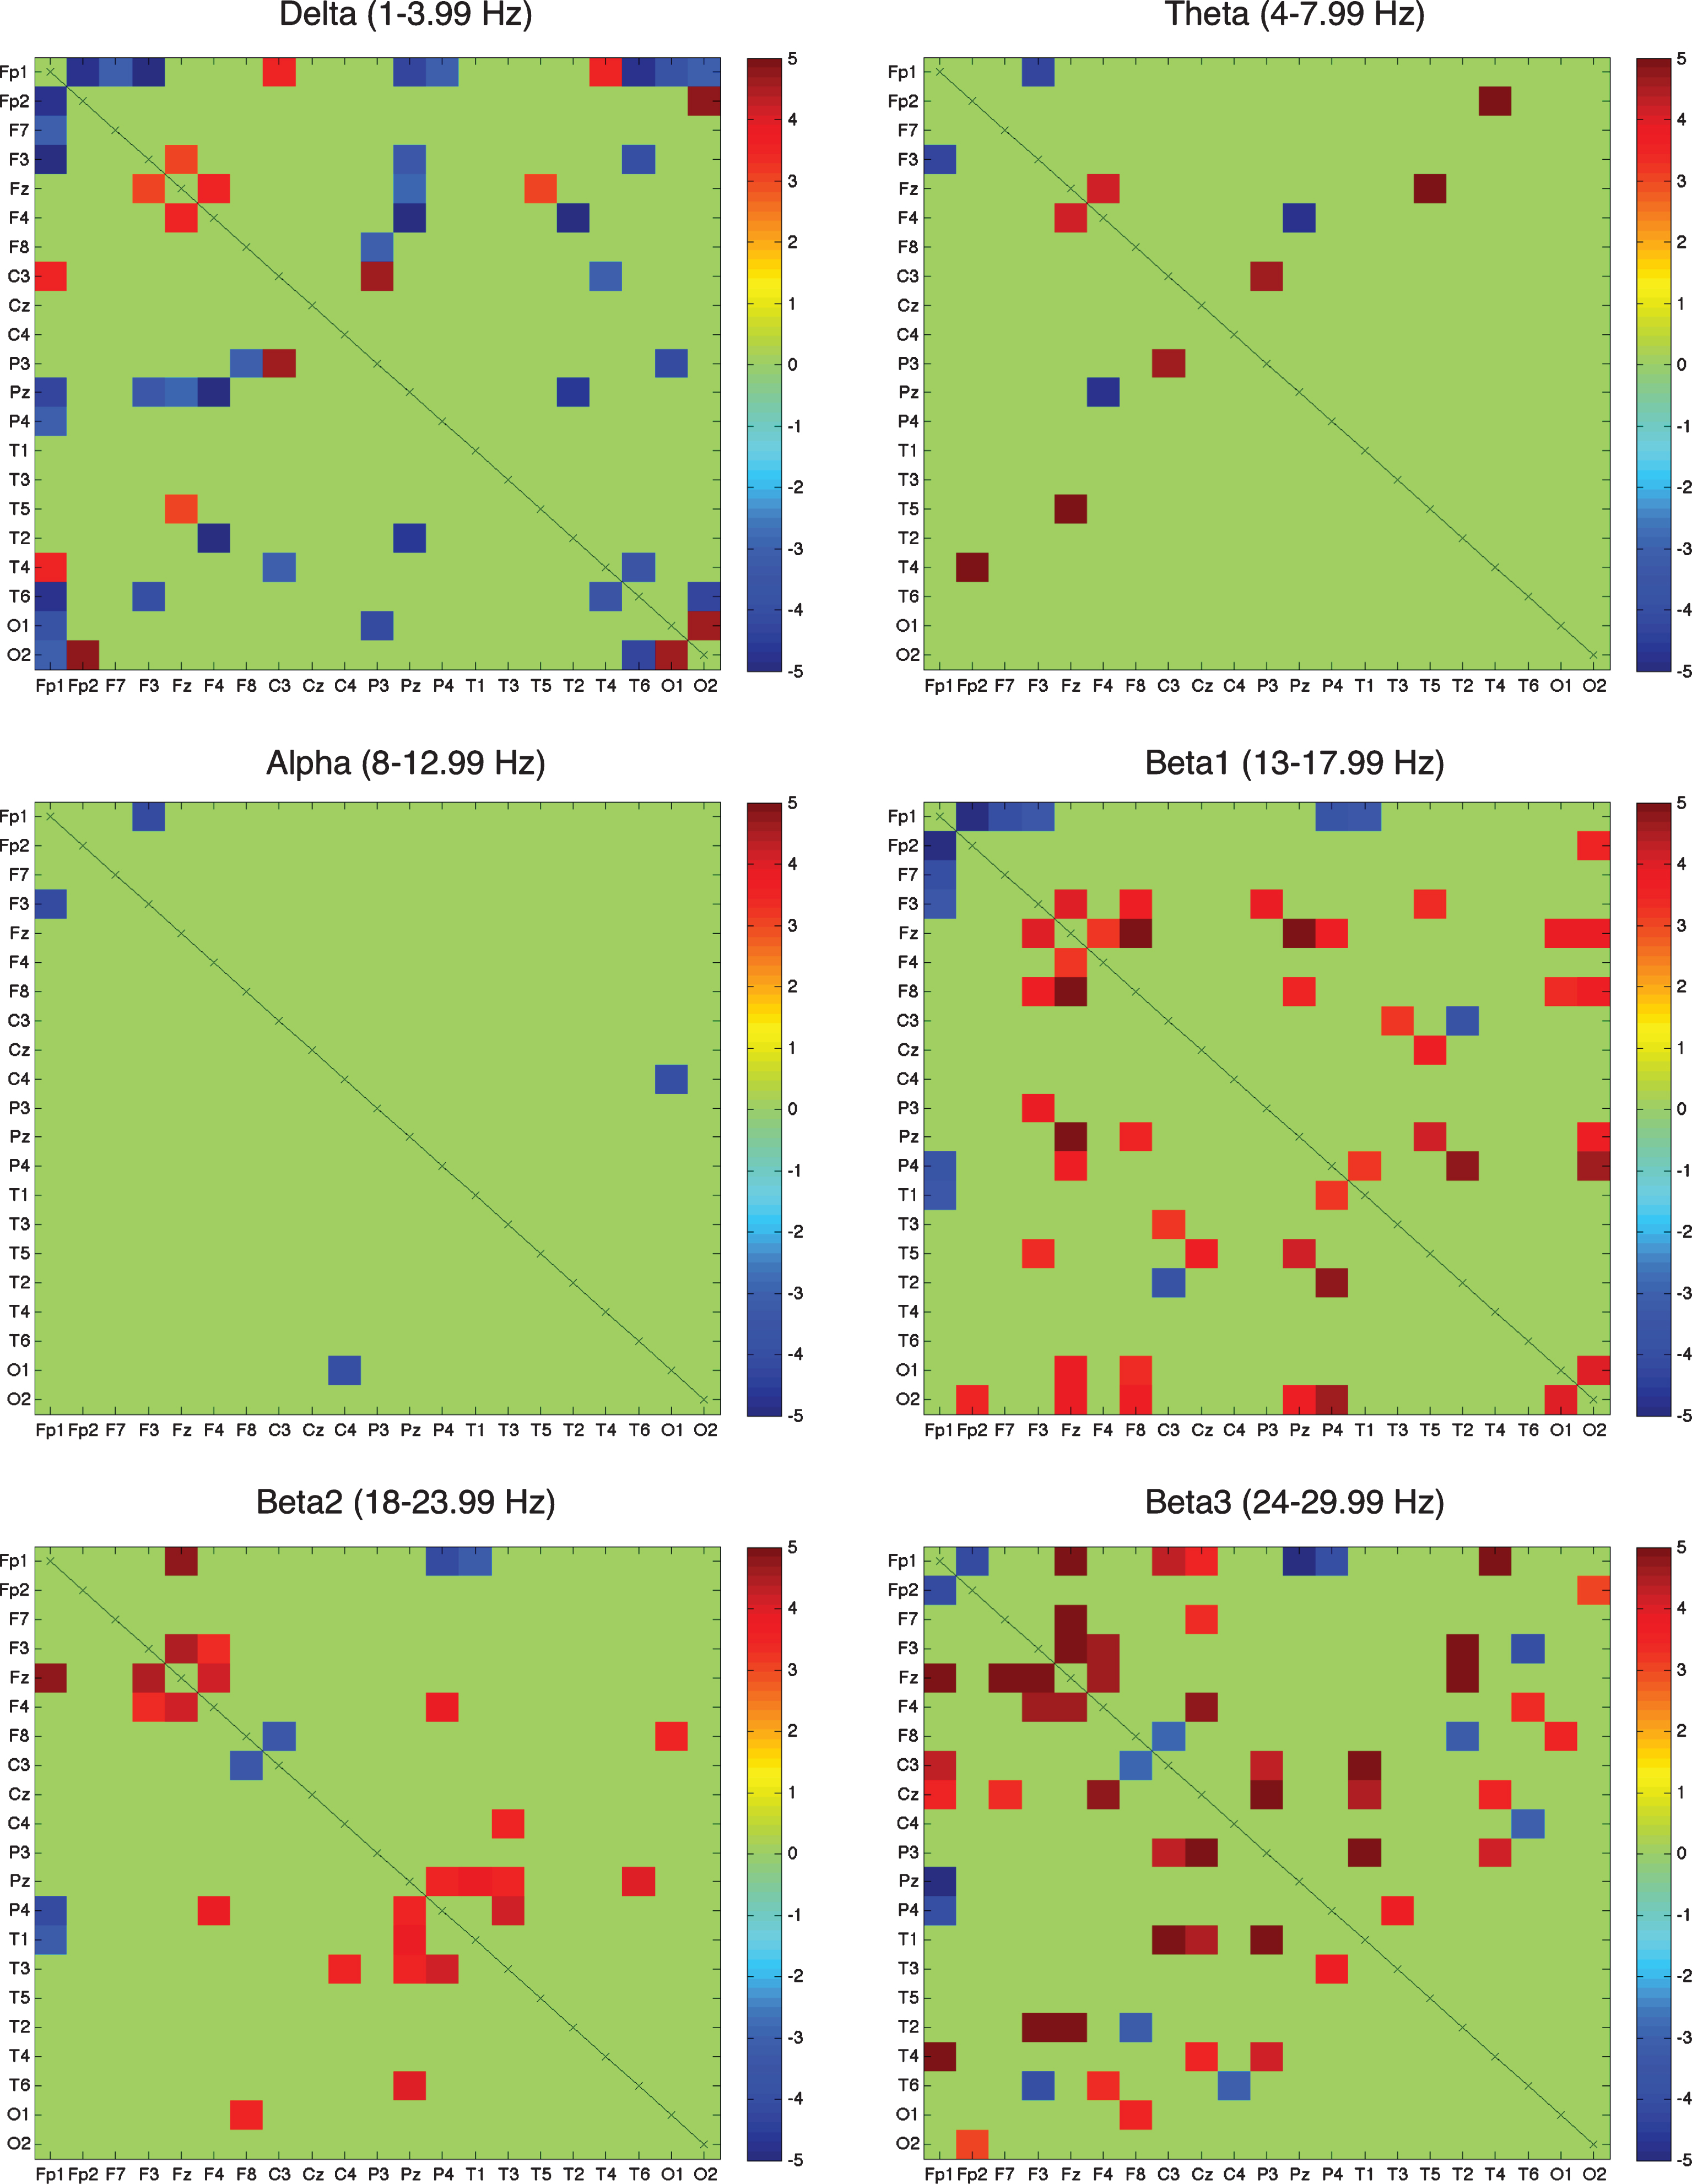
Figures show the significant coherence values for the FDR-corrected post-hoc test (p < 0.05) in the eyes open condition for the high group (7.5 mg/kg LEV). The red and blue boxes respectively show positive and negative t-values. The green boxes are the not significant values.
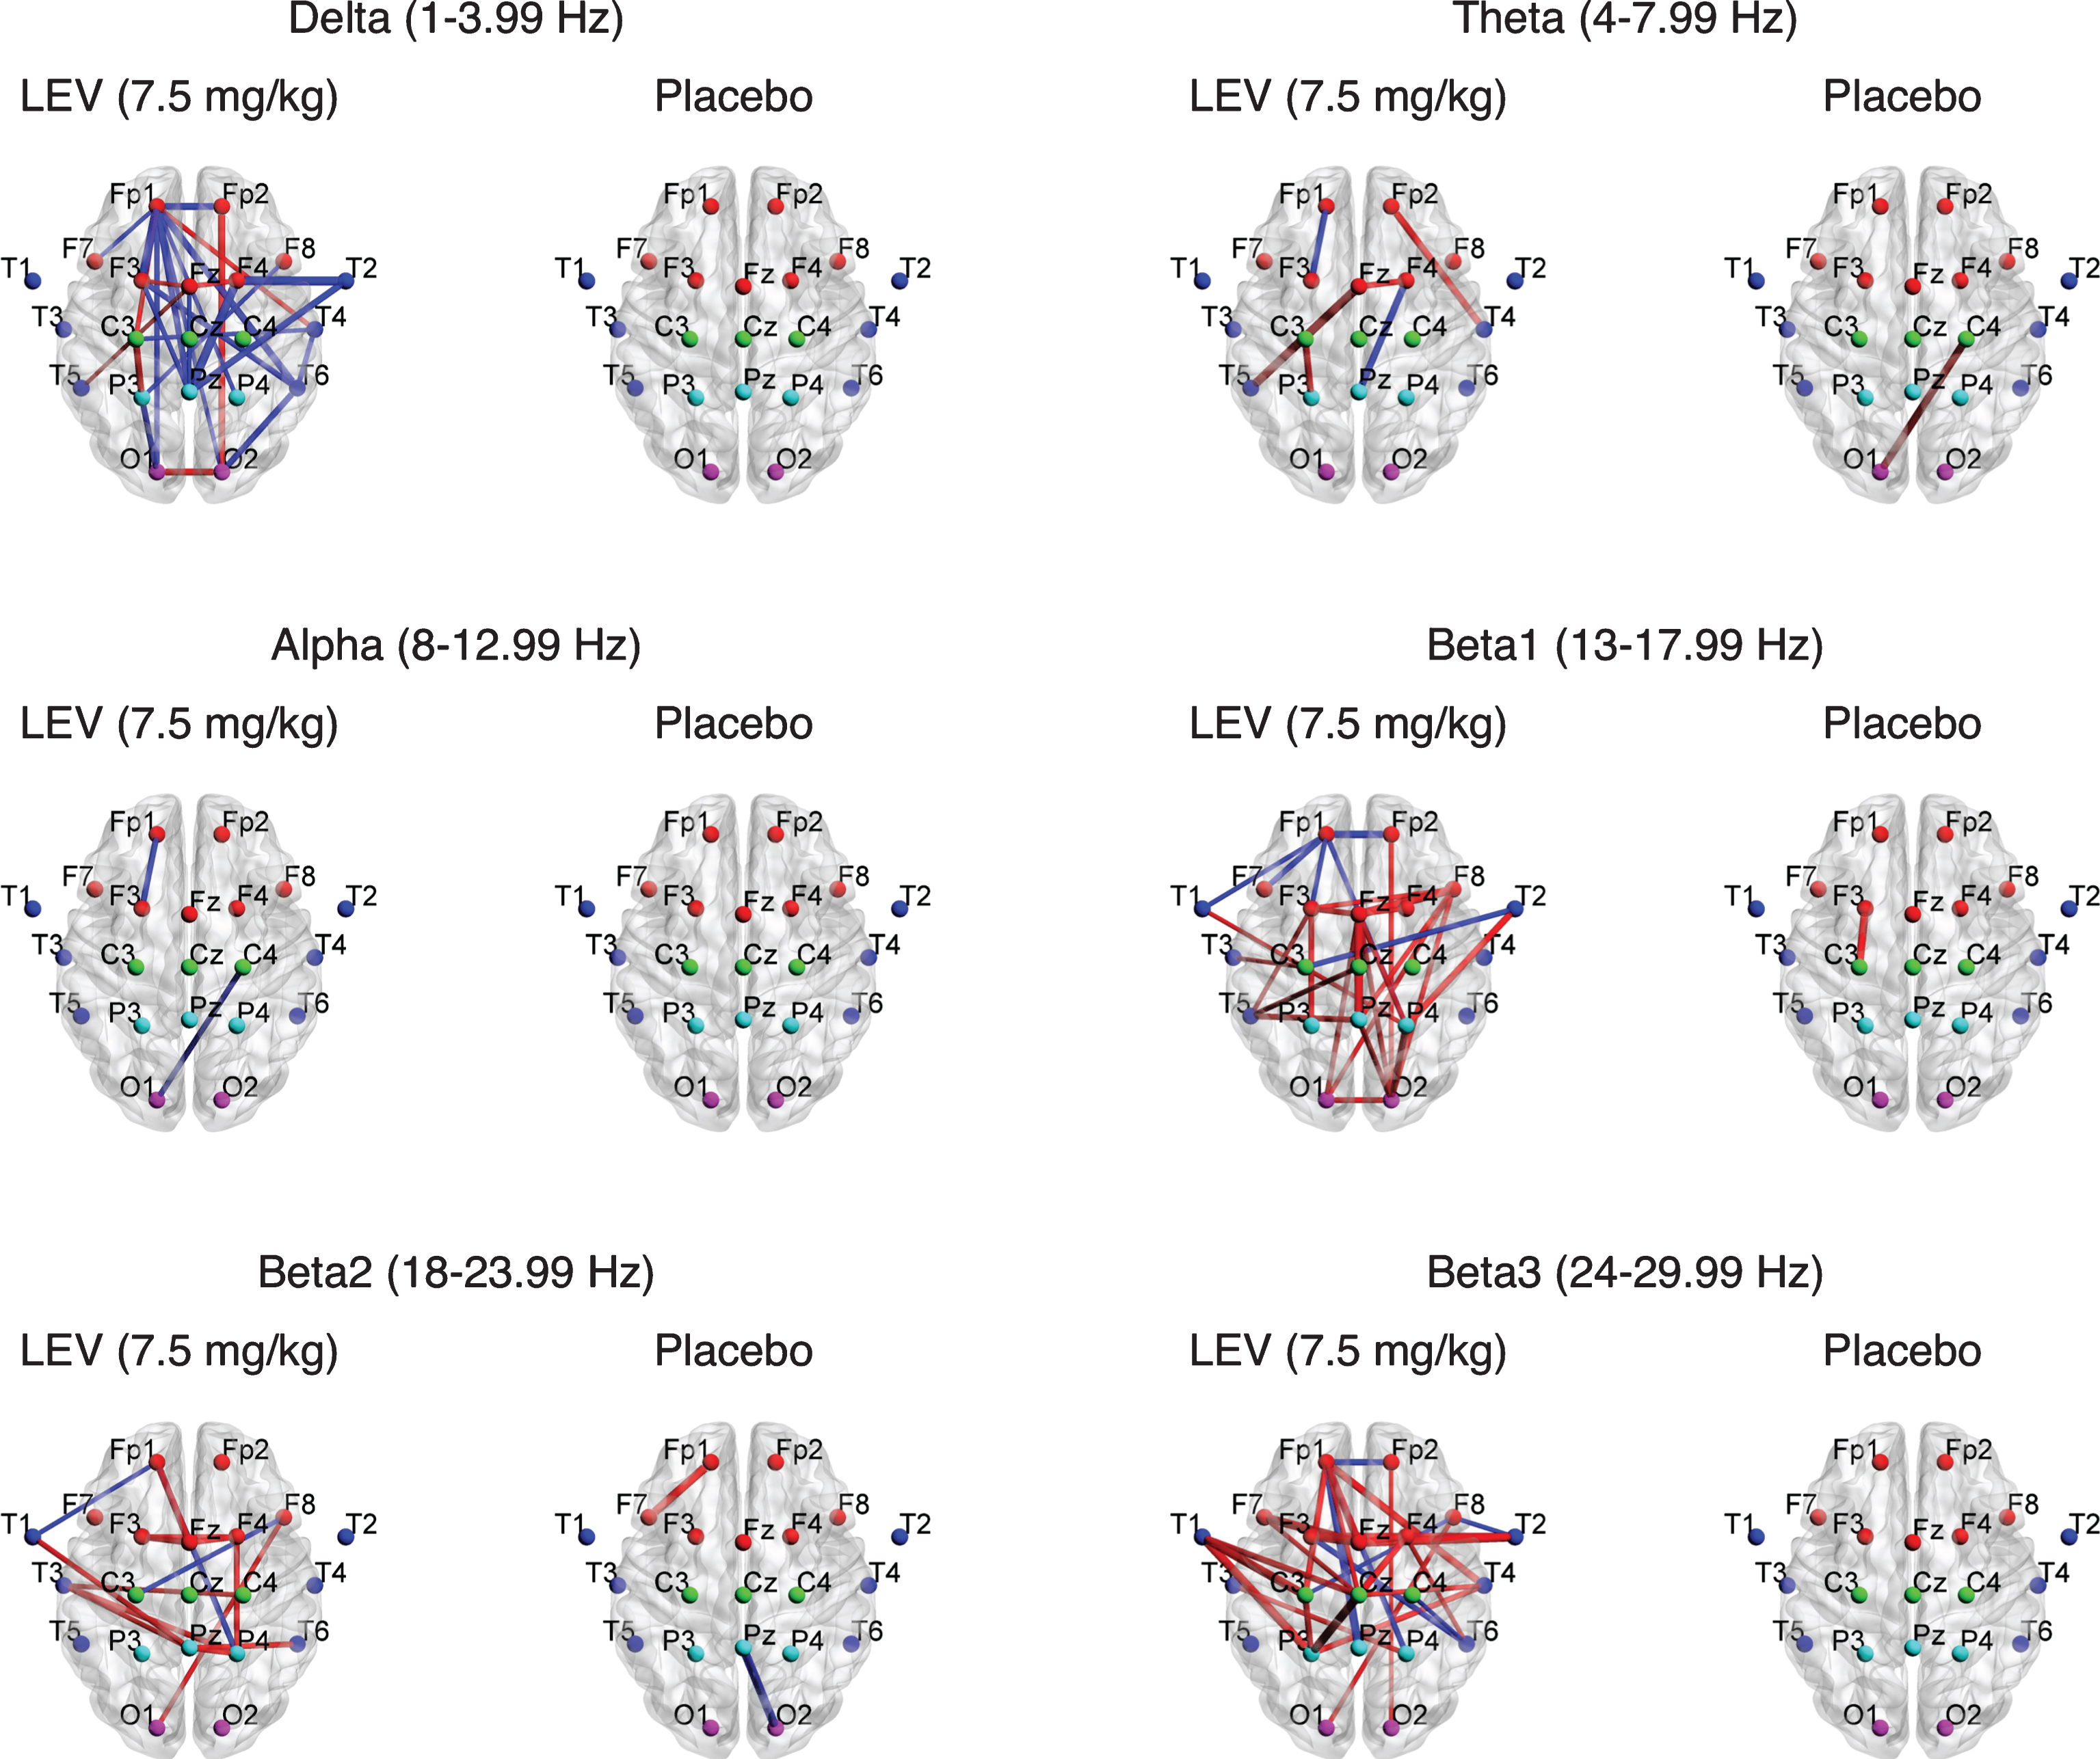
Figures show the significant coherence values for the FDR-corrected post-hoc t-test in the eyes open condition for the high group (7.5 mg/kg LEV) and placebo. The red and blue lines respectively show positive and negative t-values. Line thickness represents level of significance.
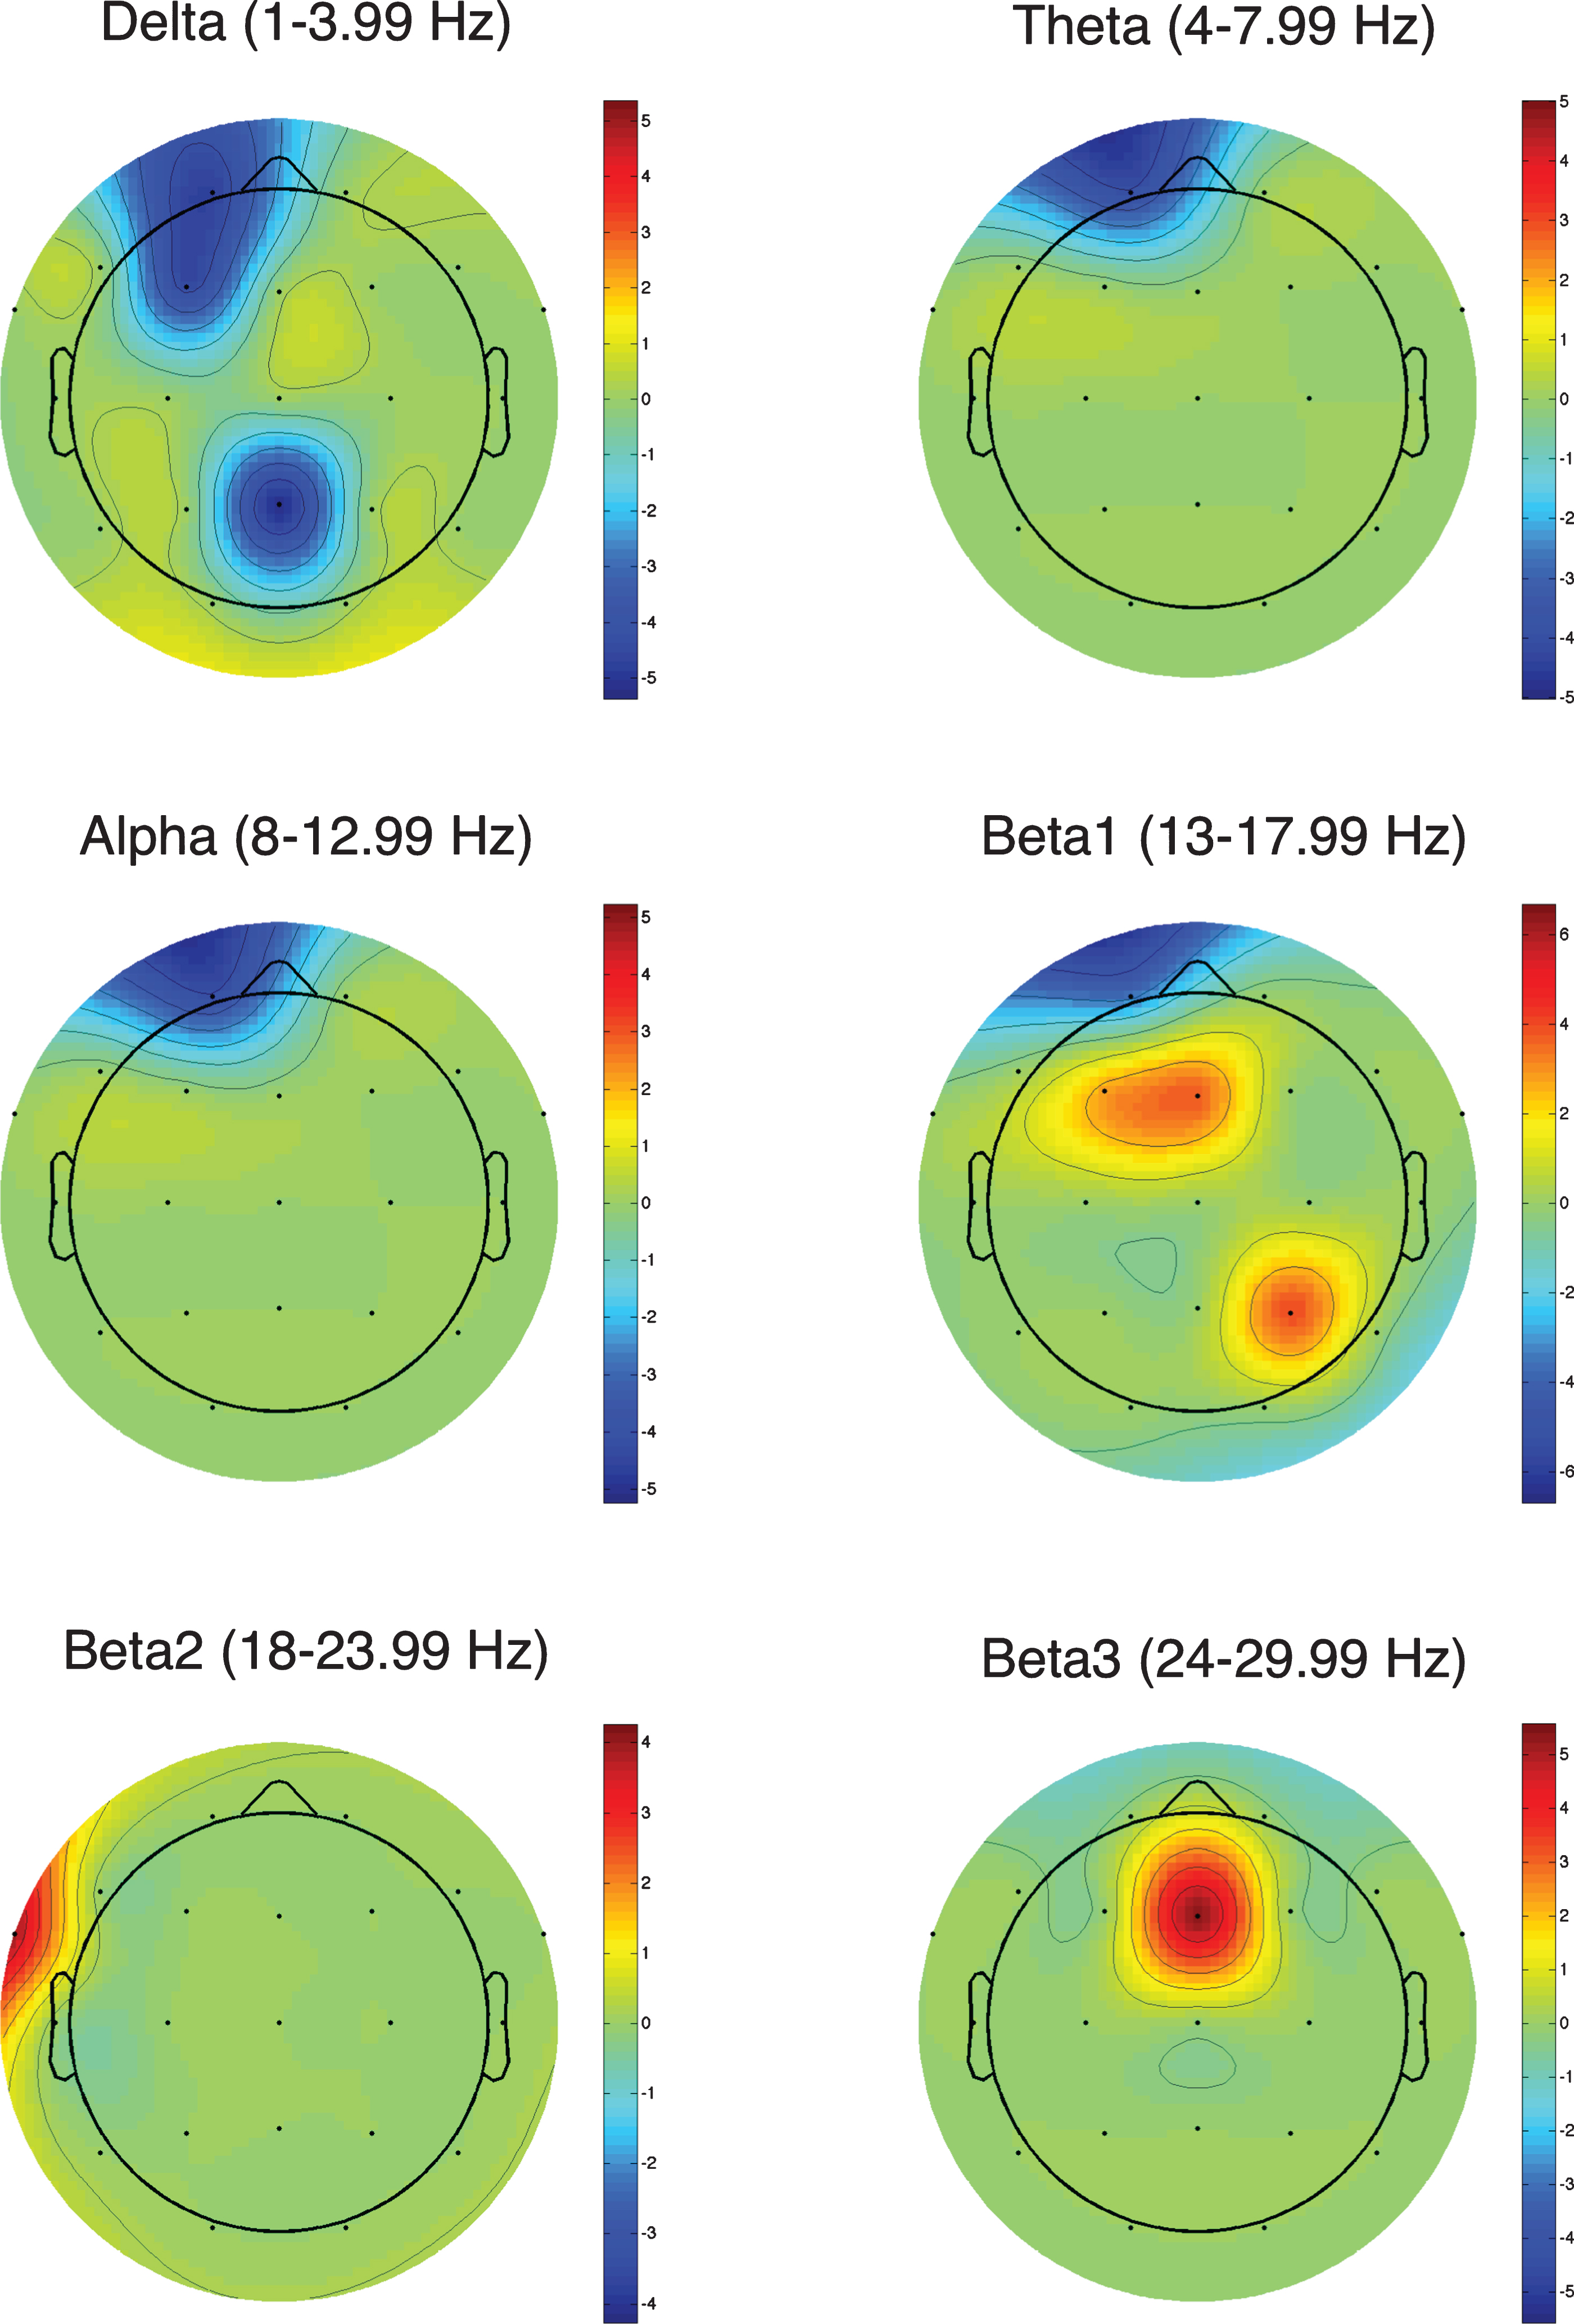
Figures show the significant global coherence values for the FDR-corrected post-hoc t-test in the eyes open condition. The colorbar shows t-values.
RESULTS
Results from power analysis
There were no significant interactions (p > 0.05) in power in any frequency band at any electrode after correcting for multiple comparisons; however, there was a trend towards a significant increase in power in the high-beta band (24–29.99 Hz) in the frontal and central regions (p-values for interaction in ANOVA: F3: p-value = 0.098, F-value = 2.838; F4: p-value = 0.062, F-value = 3.528; Fz: p-value = 0.063, F-value = 3.507; C4: p-value = 0.109, F-value = 2.687; C3: p-value = 0.170, F-value = 2.059). To further explore these potential changes, we did t-tests contrasting the pre and post high dose LEV and a pattern of increased central power was seen in the high beta band (24–29.99 Hz) (Fig. 2).
Results from coherence analysis and global coherence
Delta (1–3.99 Hz)
In the delta band (1–3.99 Hz), the majority of significant coherence changes were decreases after administering the high dose of LEV (Figs. 3 and 4 and Supplementary Tables 1 and 7). Such decreases occurred primarily between electrodes along the midline and the parasagittal plane in the fronto-parietal area (Fig. 4). Overall, there were no significant changes in coherence after administration of either low dose LEV or placebo. Global coherence showed an overall decrease in the left frontal electrodes (Fp1 and F3) and Pz after administering the high dose of LEV (Fig. 5).
Theta (4–7.99 Hz) and alpha (8–12.99 Hz)
In the theta (4–7.99 Hz) and the alpha (8–12.99 Hz) band, only a few sporadic changes in coherence were seen, without a clear pattern (Figs. 3 and 4 and Supplementary Tables 2-3 and 8-9). Both theta and alpha showed a decrease in global coherence for Fp1.
Beta1 (13–17.99 Hz)
The beta1 (13–17.99 Hz) band mostly showed significant increases in coherence after administration of high dose of LEV (Fig. 3 and Supplementary Tables 4 and 10). The majority of significant increases occurred along the midline involving the frontal, and the fronto-parietal connections (Fig. 4). Conversely, there were decreases in coherence between Fp1 and several other electrodes. After administering either placebo or low dose LEV, there were few significant coherence changes. Global coherence showed a decrease in Fp1 but an increase in frontal and parietal electrodes (F3, Fz, and P4; Fig. 5) after administering high dose of LEV, consistent with midline increases in coherence observed between individual electrode pairs.
Beta2 (18–23.99 Hz)
The beta2 (18–23.99 Hz) band mostly showed significant increases in coherence after the high dose of LEV (Fig. 3 and Supplementary Tables 5 and 11). The most prominent increases were noted in frontal and temporo-parietal connections (Fig. 4). There were also isolated decreases in coherence, without any clear pattern. In placebo and low-dose LEV administration, few changes in coherence were seen. Global coherence showed an increase for T1 after administering the high dose of LEV.
Beta3 (24–29.99 Hz)
Beta3 (24–29.99 Hz) band also showed predominantly significant increases in coherence after administration of LEV. Increases occurred primarily in the connectivity between temporal and parasagittal/midline electrodes (see Figs. 3 and 4 and Supplementary Tables 6 and 12). There were again scattered decreases in coherence without any clear pattern. In contrast, few or no significant coherence changes were observed after placebo or low dose LEV in the beta3 frequency band. Global coherence showed an increase in beta 3 for Fz after administering the high dose of LEV.
Cognitive scores and correlations
There were no significant effects of the intervention groups (placebo vesus low dose LEV versus high dose LEV) on any cognitive measures (see Table 1). There also were no significant correlations between the changes in coherence between the predefined electrode pairs and cognitive performance (p > 0.05).
This table shows the mean values of the acquired cognitive scores for placebo, low dose of LEV (2.5 mg/kg), and high dose of LEV (7.5 mg/kg) and the standard deviation. In the last column are the p-values and the F-values for the interaction measures using ANOVA
DISCUSSION
We conducted a within-subject, double-blind clinical trial to test whether the AED LEV leads to any cognitive improvement or favorable changes in the EEG in patients with mild AD. The effect of LEV was tested via measuring EEG power and the strength of connectivity between regions through coherence EEG measurements. Coherence has been used to measure the differences between healthy controls and AD [27–31] and the progression from MCI to AD [32, 33]. When comparing AD with healthy controls, some studies have shown a general increase while others show a decrease in the delta band in AD, but all show a decrease in coherence in alpha and beta bands in the frontal, central, and parietal areas [27–31, 42].In the current study, we found that administration of high-dose LEV led to a decrease in coherence in the delta band and increases in beta1, beta2, and beta3 bands (Figs. 3 and 4). This pattern of increases in coherence in higher frequency bands and decreases in lower frequency band represents a normalization of the EEG abnormalities typically seen in patients with AD. Furthermore, we saw an increase in the coherence between T1, T2, and T4 in the high beta band (24–29.99 Hz). This might suggest an improvement in a network particularly sensitive to the pathological changes in AD, since right temporal-central coherence has been shown to decrease in AD compared with healthy controls [27]. The current study tested a single acute administration of LEV and did not find any improvement in cognitive measures. Beneficial effects on these measures might well require chronic administration. Alternatively, acute administration of AEDs often causes somnolence, which might mask any improvement in individual cognitivedomains.
In the current study, power changes did not reach significance in an overall ANOVA measuring the effect of both a lower dose (2.5 mg/kg) and a higher dose (7.5 mg/kg) of LEV after correcting for multiple comparisons, likely due to the relatively small sample size. A possible trend of increased power in the high beta band (24–29.99 Hz) in the central leads (C3, C4, F3, F4, and Fz) was observed in an exploratory post-hoc analysis after the higher dose of LEV. In papers investigating the changes in spectral power in AD patients compared with healthy controls, investigators have generally found a decrease in the beta band [22, 26]. These changes in spectral power are most prominent in fronto-temporal and temporo-parietal areas [24, 25]. The changes in high beta power (24–29.99 Hz) seen after high dose LEV may therefore represent normalization of beta activity and possibly an improvement in cognition due to correlation between beta from 22–30 Hz and the MMSE scores and was positively correlated with verbal memory recall and recognition [26], although this finding is tentative given the limited power and the lack of an enhancement on cognitive tests. Larger studies would be necessary to show whether this trend represents a beneficial effect in mild AD.
This study shows that the acute administration of 7.5 mg/kg LEV in patients with mild AD may have a normalizing effect on the EEG with a decrease in coherence in slower frequency bands and an increase in coherence in the faster bands, along with a tendency toward increased power in the central areas in the high beta band (24–29.99 Hz). Alternatively, the lack of a control group prevents us from determining whether the effects would also be seen in healthy aging. However, one study has shown that LEV does not change the EEG in healthy volunteers compared with two other AEDs [43]. Another study investigating the changes in background EEG when LEV was administered in patients with focal epilepsy showed decreased delta (1–3 Hz) and increased beta1 (13–19 Hz) band power (similar to the results in our study) only in the group who responded clinically to the drug, with no effect on the EEG in the poor response group [44], suggesting that changes in EEG features may be potential biomarkers of clinical drug response.
In terms of dosing, we selected two doses: a lower dose of 2.5 mg/kg to be roughly comparable with the dosages used in previous trials of MCI, along with a higher dose of 7.5 mg/kg, to be more comparable with the dosages used in epilepsy to suppress seizures. A recent study investigated the effects of three different doses of LEV on patients with aMCI compared with healthy controls. The findings showed that a dose of either 62.5 mg BID or 125 mg BID led to improved performance in the patients with aMCI compared with healthy controls in a forced choice memory task designed to assess pattern separation and completion processes. These doses of LEV also led to a normalization of the increased fMRI activity in the DG/CA3 and entorhinal cortex, which were elevated compared to healthy controls [45]. However, no changes were seen with a dose of 200 mg. In contrast, in the current study, we only saw a significant effect in the higher 7.5 mg/kg dose, corresponding to a dose of approximately 500 mg for a typical patient. This could be due to the differences in the study designs where the participants in our study received an acute injection whereas in the previous study the drug was administered twice a day for two weeks. Higher doses may also be more beneficial in mild AD as compared with aMCI.
This study has several limitations as described above. First, LEV was only administered acutely, mimicking the model of treating non-convulsive seizures acutely with intravenously administration of an AED. Chronic administration would be required to better delineate any potential long-term benefits of the drug. However, LEV has to our knowledge never been tested in AD patients without clinical seizures, and a goal of this pilot study was to determine feasibility and tolerability of acute administration as well as contrasting two different doses. The small sample size limits the power to see more subtle effects. While we were able to show neurophysiological effects of LEV in AD, the lack of an aged-matched control group prevents us from knowing whether these changes are specific to AD, although LEV did not have any effects on EEG in studies in healthy controls [43]. Despite these limitations, our study showed promising results with statistically robust findings of increased beta1 and beta3 coherence and decreased delta coherence. Further, we have shown that it is feasible to administer LEV intravenously in mild AD as a probe for acutely attempting to suppress hyperexcitability. These findings “normalize” the typical EEG changes seen in AD, and suggest that LEV deserves further study in AD. The results raise the possibility that chronic administration could lead to symptomatic benefits and, if subclinical epileptic activity is a factor in the pathophysiology of AD, potentially disease-modifying effects.