
Abstract
Background:
MRI-based hippocampus volume is a core clinical biomarker for identification of Alzheimer’s disease (AD).
Objective:
To assess robustness of automatic hippocampus volumetry with the freely available FSL-FIRST software with respect to short-term repeat and across field strength imaging. FSL-FIRST hippocampus volume (FIRST-HV) was also evaluated as enrichment biomarker for mild cognitive impairment (MCI) trials.
Methods:
Robustness of FIRST-HV was assessed in 51 healthy controls (HC), 74 MCI subjects, and 28 patients with AD dementia from ADNI1, each with two pairs of back-to-back scans, one at 1.5T one at 3T. Enrichment performance was tested in a second sample of 287 ADNI MCI subjects.
Results:
FSL-FIRST worked properly in all four scans in 147 out of 153 subjects of the first sample (49 HC, 72 MCI, 26 AD). In these subjects, FIRST-HV did not differ between the first and the second scan within an imaging session, neither at 1.5T nor at 3T (p≥0.302). FIRST-HV was on average 0.78% larger at 3T compared to 1.5T (p = 0.012). The variance of the FIRST-HV difference was larger in the inter-field strength setting than in the intra-scanner settings (p < 0.0005). Computer simulations suggested that the additional variability encountered in the inter-field strength scenario does not cause a relevant degradation of FIRST-HV’s prognostic performance in MCI. FIRST-HV based enrichment resulted in considerably increased effect size of the 2-years change of cognitive measures.
Conclusion:
The impact of intra-scanner test-retest and inter-field strength variability of FIRST-HV on clinical tasks is negligible. In addition, FIRST-HV is useful for enrichment in clinical MCI trials.
Keywords
INTRODUCTION
Twenty years of systematic methodological and clinical research have advanced magnetic resonance imaging (MRI)-based hippocampus volume (HV) as one of the most reliable and best validated topographical imaging biomarkers for Alzheimer’s disease (AD) [1]. It is very well documented that the pathophysiological process of AD induces progressive and substantial structural brain changes in the hippocampus since its early phases leading to quantifiable HV reduction detectable using MRI [2–4]. The precision of HV measurements relative to differences between disease stages not only qualifies HV as one of the best established core biomarkers for AD at prodromal stages [5, 6] but also enables prediction of imminent progression to AD dementia at these early symptomatic stages, particularly in subjects with amnestic mild cognitive impairment (aMCI) [7]. The reduction of HV in aMCI is as large as 10–15% compared to age-matched healthy controls [8].
The gold standard for volumetric assessment of the hippocampus using MRI is represented by the manual delineation by an expert tracer. Manual delineation, however, is time consuming and the result depends on the technical experience and expert level/training of the tracer. These limitations can be overcome by using methods for automatic hippocampus segmentation such as FreeSurfer [9], NeuroQuant [10, 11], Learning Embeddings for Atlas Propagation (LEAP) [12], Hippocampus Multi-Atlas Propagation and Segmentation (HMAPS) [13, 14], the FIRST module from the Software Library (FSL) of the Oxford Centre for Functional MRI of the Brain (FMRIB) [15, 16], or processing pipelines based on the statisticalparametric mapping (SPM) software package [17–19]. So far, however, these methods are rarely employed as diagnostic tools in everyday clinical routine, but they are exclusively used in few specialized academic expert centers. One of the main obstacles for the widespread clinical use of MRI-based hippocampus volumetry is the dependence of its results on the MRI scanner and the parameters of the acquisition sequence used to generate the MR images. The most straightforward way to deal with this issue is to use a site-specific cutoff (for normal HV) derived from a site-specific reference database of healthy controls. Such a database, however, is not available in the majority of clinical sites. This issue might be overcome by using methods for hippocampal volumetry that are robust against scanner hardware and (moderate) variations of the acquisition protocol.
Against this background, the present study aimed to evaluate fully automatic hippocampus volumetry using FSL-FIRST with respect to test-retest stability and robustness across common 1.5T and 3T MR hardware platforms. Healthy subjects, subjects with aMCI and AD patients from the Alzheimer’s Disease Neuroimaging Initiative (ADNI) were selected. The performance of FSL-FIRST in measuring the volume of the hippocampus as a biomarker for enrichment and/or stratification of aMCI population was tested in an independent sample of ADNI aMCI subjects.
FSL-FIRST is a promising candidate for the integration of hippocampal volumetry into everyday clinical routine, since it is freely available, easy to use and sufficiently fast (typical processing time is 15 min per scan). Cutoff values on FSL-FIRST-based HV for the prediction of conversion to AD dementia in subjects with aMCI within 12, 24, or 36 months have been published recently [15].
MATERIALS AND METHODS
Subjects
All MRI data used in this study were obtained from the Alzheimer’s Disease Neuroimaging Initiative (ADNI) database (http://adni.loni.usc.edu). The ADNI was launched in 2003 by the National Institute on Aging (NIA), the National Institute of Biomedical Imaging and Bioengineering (NIBIB), the Food and Drug Administration (FDA), private pharmaceutical companies and non-profit organizations, as a $60 million, 5-year public private partnership. The Principal Investigator of this initiative is Michael W. Weiner, MD, VA Medical Center and University of California– San Francisco. ADNI is the result of efforts of many co-investigators from a broad range of academic institutions and private corporations, and subjects have been recruited from over 50 sites across the U.S. and Canada. The primary goal of ADNI has been to test whether serial MRI, positron emission tomography, other biological markers, and clinical and neuropsychological assessment can be combined to measure the progression of MCI and early AD.
In order to facilitate comparison with previous results on the robustness of the multi-atlas based LEAP method for hippocampus segmentation across MRI field strengths and repeat imaging by Wolz et al. [20], the present analyses included exactly the same ADNI subjects as Wolz and colleagues: 51 normal (healthy) subjects, 74 patients with aMCI, and 28 AD patients. Each of these subjects had been scanned twice on two different scanners, one scanner with 1.5T field strength and the other with 3T field strength. The two scans at the same field strength were acquired as back-to-back scans within the same imaging session (without repositioning of the patient [21]). 1.5T and 3T imaging session were performed within a period of a few weeks. There were 612 MRI scans in total ((51 + 74 + 28) * 2 * 2 = 612) which were downloaded in November and December 2015 from the ADNI repository (www.adni-info.org). Data were acquired at 31 different imaging centers (ADNI study centers) using 62 different MR scanners. All images were downloaded as “unpreprocessed” (no gradwarp, B1 non-uniformity or N3 correction, see http://adni.loni.usc.edu/methods/mri-analysis/mri-pre-processing/).
MRI acquisition
ADNI MR acquisition protocols have been set-up to harmonize image quality across MR hardware platforms [21, 22]. In short, high-resolution T1-weighted MRI scans were acquired using a sagittal 3-dimensional magnetization prepared rapid gradient echo (3D-MPRAGE) sequence with an approximate TR = 2400 ms, minimum full TE, approximate TI = 1000 ms, and approximate flip angle of 8° (scan parameters varied between sites, scanner platforms, and software versions). Scans were collected with an acquisition matrix of 192×192×166 (x, y, z) and voxel size of 1.25×1.25×1.2 mm3. Images were then reconstructed to give a 256×256×166 matrix and voxel size of approximately 1.0×1.0×1.2 mm3.
Hippocampus volumetry with FSL-FIRST
All 3D-MPRAGE images were converted from DICOM to NIfTI format using MRIconvert (http://lcni.uoregon.edu/downloads/mriconvert). Then, hippocampus segmentation was performed using the FIRST module from the FMRIB’s Software Library (FSL; version 5.0; http://fsl.fmrib.ox.ac.uk/fsl). The run_first_all_routine was applied with slight modifications to enable a larger search region and a normalized mutual information cost function as described in [23]. FSL was running on a Debian GNU/Linux system Release 8.3 (jessie). It was installed from the NeuroDebian repository [24]. The total hippocampus volume (FIRST-HV) was obtained by summing the hippocampus volume of left and right hemisphere.
FSL-FIRST uses a hippocampus model comprising shape and intensity information. The model has been derived from 336 T1-weighted MRI scans in which the hippocampus was manually delineated. MRI scans were globally registered to MNI space (affine 12 parameter registration). A second, local registration was restricted to subcortical structures. The variation in shape and intensity is modelled by a multivariate Gaussian distribution. The reader is referred to [16] for more details of the method.
The FSL-FIRST segmentation result was checked for each MPRAGE image by visual inspection of the segmented contours overlaid to the MPRAGE in coronal, sagittal and axial views. Visual inspection was performed in randomized order (over all 612 images) by a reader blind to all clinical information. Two types of failures were detected and led to exclusion of the scan: first, failure of FSL-FIRST’s global registration step resulting in a hippocampus contour far from the actual hippocampus (no overlap at all), and second, failure of FSL-FIRST’s local registration step resulting in strong over- or underestimation of the hippocampus.
Test-retest reliability and inter-field strength variability
Test-retest stability and inter-field strength variability of FIRST-HV were assessed using the same measures as used by Wolz and co-workers [20]. Briefly, signed and unsigned difference of two volumetric measures, V1 and V2, were defined as δ
signed
= V1 - V2 and δ
unsigned
= |V1 - V2|. Relative signed and relative unsigned difference were defined as
For assessment of (intra-scanner) test-retest reliability of FIRST-HV, V1 and V2 were chosen as FIRST-HV from the first (V1) and from the second (V2) of the two back-to-back scans acquired in the same imaging session. Test-retest variability was determined separately for 1.5T and for 3T. It was determined for the whole subject sample as well as separately for each diagnostic group (normalcontrols, aMCI, AD).
For assessment of inter-field strength variability, V1 and V2 were chosen from the first acquired 3T scan (V1) and from the first acquired 1.5T scan (V2). The rationale for using the first scans within the imaging sessions was that these might be less affected by motion artefacts. The latter cause additional variability which contaminates actual field strength effects. Moreover, in clinical or clinical trial applications, often only a single scan is acquired. Inter-field strength variability was determined for the whole sample of subjects and separately for each diagnostic group.
Statistical analysis
The distribution of the signed difference measures could not be assumed to be normal in all cases according to the Kolmogorov-Smirnov test (the unsigned difference measures are not expected to be normally distributed from the outset). Therefore, non-parametric tests were used to test signed difference measures (i) for being different from zero and (ii) for difference between diagnostic groups. More precisely, the one-sample Wilcoxon signed rank method was used to test the median of the signed difference measures for deviation from zero. The Kruskal-Wallis-Test was used to test the median of signed difference measures for an effect of the diagnostic group. In addition, the “two one-sided tests” (TOST) approach, as described by Pardoe and co-workers [25], was used for equivalence testing of FIRST-HV estimates (between first and second back-to-back scan at 1.5T and at 3T, as well as between the first 1.5T scan and the first 3T scan). The equivalence margin was set to 5% of the average of the mean values of the FIRST-HV values to be tested for equivalence.
The intra-class correlation coefficient (ICC) of back-to-back FIRST-HV was computed (separately at 1.5T and at 3T) to assess correlations between back-to-back scans (ICC (2,1); absolute agreement). An ICC was also calculated for the inter-field strength comparison to test for the consistency between volumes obtained from 1.5T and 3T scans (ICC(3,1); consistency) [26]. The R software package (version 3.2.4) was used for the statistical analyses [27]. A p value below 0.05 was assumed to indicate statistical significance.
Impact on the performance of FIRST-HV for prediction of AD dementia in aMCI
The power of FIRST-HV for the prediction of AD dementia in ADNI1 aMCI subjects has been evaluated previously [15]. The area (AUC) under the receiver operating characteristic (ROC) curve for prediction of AD dementia within 12, 24, and 36 months was 0.79, 0.70, and 0.70, respectively [15]. This previous study used 1.5T MRI data only.
In order to assess how the predictive power of FIRST-HV in ADNI1 aMCI is impacted by additional variability due to combining MRI data across 1.5T and 3T, computer simulations were performed. The simulations added Gaussian mean zero noise to the FIRST-HV values obtained in [15], i.e. FIRST-HV ⟶ (1 + R * α/100) * FIRST-HV, where R are normally distributed (pseudo) random numbers and α is the level of the additional noise in %. Then the ROC analyses were repeated. Ten thousand repeats were simulated for each level of additional noise. The resulting AUC (mean±standard deviation over the 10,000 repeats) was reported for additional noise ranging from α= 0 to 10%.
FIRST-HV as an enrichment biomarker for aMCI trials
Yu and co-workers have evaluated the benefit of patient selection based on hippocampus volume for clinical trials in aMCI using the effect size (= mean/standard deviation) of the 2-years change in Mini-Mental State Examination score (MMSE), the 13-item Cognitive subscale of the Alzheimer’s Disease Assessment Scale (ADAS13), and the Clinical Dementia Rating Sum of Boxes (CDR-SB) as performance measures [28]. The rationale for using these performance measures was that selecting MCI patients with fast cognitive decline (i) reduces clinical variability that negatively impacts the statistical power of a trial to detect slowing of cognitive decline and (ii) reduces etiological heterogeneity amongst aMCI subjects by enriching the sample with patients in whom the clinical syndrome of aMCI is attributable to AD pathology [28]. Yu and co-workers tested enrichment performance of FreeSurfer, NeuroQuant, LEAP, and HMAPS. In the present study, we tested enrichment performance of FIRST-HV using the same patient sample and the same method as Yu and co-workers in order to facilitate comparison of enrichment performance between FIRST-HV and the previously tested algorithms. Thus, 3D-MPRAGE images of the 287 aMCI subjects and 227 of the 228 cognitively normal controls included in the Yu et al. study were downloaded from the ADNI homepage as “unpreprocessed” (the 228th normal control was not available from the ADNI homepage at the time of download). FIRST-HV was computed in these additional subjects as described above. Raw FIRST-HV values were corrected for age and total intracranial volume (TIV) based on linear regression of FIRST-HV in the 227 normal controls with age and TIV as regressors. TIV was obtained using SPM12 and the method described in [29]. MMSE, ADAS13, and CDR-SB of the aMCI subjects, at the time of MRI and 2 y later for computation of the 2-years change, were downloaded from the ADNI homepage (https://adni.loni.usc.edu).
Enrichment was based on a cutoff value on age and TIV adjusted FIRST-HV (aFIRST-HV), that is, all aMCI subjects with aFIRST-HV ≤ cutoff were included in the enriched sample. The cutoff was varied between the first and the 50th percentile (in steps of 1 percentile) of aFIRST-HV in the group of the 227 controls. The number of aMCI subjects in the enriched sample increases with increasing cut-off from the first to the 50th percentile. For each cutoff, the effect size of the 2-years change of MMSE, ADAS13 and CDR-SB was computed as the mean divided by the standard deviation of the 2-years change over all aMCI subjects in the enriched sample.
The effect of FIRST-HV’s short-term test-retest variability on its enrichment performance was evaluated by computer simulations. Again, the approach described by Yu and co-workers was used [28]. For each of the 50 cutoffs on aFIRST-HV, 1000 realizations of aFIRST-HV in the 287 aMCI subjects were simulated by randomly varying the measured aFIRST-HV values using a Gaussian distribution with mean zero and standard deviation of 3.04%. The latter is the standard deviation of the relative signed difference Δ signed of FIRST-HV between the two back-to-back scans at 1.5T in the aMCI subjects of the first sample included in the present study (Table 2).
Demographics of the subjects included in the analyses of intra-scanner test-retest and inter-field strength variability
AD, Alzheimer’s disease; aMCI, amnestic mild cognitive impairment; MMSE, Mini-Mental State Examination; SD, standard deviation.
Test-retest variability measures of FIRST-HV at 1.5T. AD
§obtained from the first scan. AD, Alzheimer’s disease; aMCI, amnestic mild cognitive impairment; RMS, root mean square; CV, coefficient of variation; R, correlation coefficient (Pearson); ICC, intraclass correlation coefficient; CI, 95% confidence interval; p*, p value of one sample Wilcoxon signed rank test; p, p value of Kruskal-Wallis test; TOST, “two one-sided t-test” equivalence test; p′, p value of the TOST.
RESULTS
Total processing time for the computation of FIRST-HV was approximately 15 min per scan on a standard 2.67 GHz CPU with 8 MB cache.
Segmentation of the hippocampus failed in 7 out of 612 scans (failure rate 1.14%). It failed in both 3T scans in a patient with AD (PTID 136_S_0426, failure of local registration). It also failed for the first 1.5T scan of another AD patient (PTID 018_S_0633, failure of local registration). Moreover, the segmentation of the hippocampus failed for two MCI patients (023_S_0855, first 1.5T scan, failure in local registration and 133_S_0629, first 3T scan, failure in global registration) and for two normal subjects (012_S_1009, second 3T scan, failure of global registration and 082_S_1256, second 3 T scan, failure of global registration). All subjects with at least one segmentation failure among the four scans were excluded from the further analyses. Thus, the analyses of intra-scanner and inter-field strength variability of FIRST-HV included 147 subjects: 49 healthy controls, 72 aMCI, and 26 AD patients. Demographic data of these subjects are given in Table 1. The MRI data of these subjects had been acquired at 31 different ADNI sites. In the 1.5T setup, 95 subjects had been scanned on a General Electric scanning platform, 35 subjects on a Siemens platform, and 17 subjects on a Philips platform. In the 3T setup, 24 subjects had been scanned on a General Electric platform, 86 subjects on a Siemens platform, and 37 subjects on a Philips platform.
Intra-scanner test-retest variability measures of FIRST-HV from back-to-back scans at 1.5T or 3T are given in Tables 2 and 3, respectively. The distribution of signed difference measures, signed difference δ signed , and relative signed difference Δ signed , was in agreement with zero median in the whole subject sample and in each diagnostic group, both at 1.5T and at 3T. Signed and relative signed difference were largest in the AD group (more pronounced at 3T than at 1.5T), but the difference to the other diagnostic groups did not reach the level of statistical significance (Kruskal-Wallis p = 0.828 and p = 0.814 for δ signed and Δ signed at 1.5T, and p = 0.199 and p = 0.128 for δ signed and Δ signed at 3T, respectively).
Test-retest variability measures of FIRST-HV at 3T
§obtained from the first scan. AD, Alzheimer’s disease; aMCI, amnestic mild cognitive impairment; RMS, root mean square; CV, coefficient of variation; R, correlation coefficient (Pearson); ICC, intraclass correlation coefficient; CI, 95% confidence interval; p*, p value of one sample Wilcoxon signed rank test; p, p value of Kruskal-Wallis test; TOST, “two one-sided t-test” equivalence test; p′, p value of the TOST.
Neither signed (δ signed and Δ signed ) nor unsigned (δ unsigned and Δ unsigned ) variability measures showed a significant effect of the ADNI imaging site, neither at 1.5T nor at 3T (Kruskal-Wallis test including the 12 ADNI sites that contributed at least 5 subjects: all p≥0.273). There was also no significant platform effect (General Electric, Siemens, Philips) on the test-retest variability measures, neither at 1.5T nor at 3T (Kruskal-Wallis: all p≥0.455).
Inter-field strength variability measures of FIRST-HV between 1.5T and 3T are summarized in Table 4. The signed difference measures indicated a significant offset of FIRST-HV in the whole subject sample (n = 147): FIRST-HV was on average 50.52 mm3 or 0.78% larger at 3T than at 1.5T (p = 0.012). A similar tendency was seen in each diagnostic subgroup, although the effects did not reach the level of statistical significance. Again, signed and relative signed differences were largest in the AD group although these differences missed the level of statisticalsignificance for being different from zero (p = 0.071 and p = 0.080 for signed and relative signed difference, respectively).
Test-retest variability measures of FIRST-HV for the inter-field strength setup (first scans were compared)
AD, Alzheimer’s disease; aMCI, amnestic mild cognitive impairment; RMS, root mean square; CV, coefficient of variation; R, correlation coefficient (Pearson); ICC, intraclass correlation coefficient; CI, 95% confidence interval; p*, p value of one sample Wilcoxon signed rank test; p, p value of Kruskal-Wallis test; TOST, “two one-sided t-test” equivalence test; p′, p value of the TOST.
The variance of the inter-field strength signed difference measures was larger than the variance of the intra-scanner signed difference measures. For example, signed difference δ signed of the total sample (n = 147) was 9.66±175.26 mm3 and 15.74±207.70 mm3 in the intra-scanner setup at 1.5T and 3T, respectively (Tables 2 and 3), and 50.52±366.04 mm3 in the 3T versus 1.5T comparison (Table 4). Thus, the standard deviation of the signed FIRST-HV difference was 2.1 or 1.8 times larger in the inter-field strength setup than in the intra-scanner setup at 1.5T and 3T, respectively. This effect was tested for statistical significance by pairwise application of the Pitman test for comparison of variances in two paired samples [30]. The Pitman test consists of testing for correlation between the sum and the difference between paired observations (with significant correlation indicating significant difference of the variances). The non-parametric Spearman test was used for correlation analysis. The increased variance of the signed FIRST-HV difference at 3T compared to 1.5T only barely reached statistical significance (Spearman rho = 0.176, p = 0.033); in contrast, the difference between the 1.5T intra-scanner setup and inter-field strength setup (rho = 0.582, p < 0.0005) as well as between the 3T intra-scanner setup and the inter-field strength setup (rho = 0.473, p < 0.0005) was highly significant.
Figure 1 shows Bland-Altman plots of intra-scanner FIRST-HV test-retest variability at both 1.5T and 3T, and of inter-field strength variability.

Bland-Altman plots of FIRST-HV in the 1.5T setup, the 3T setup, and in the inter-field strength setup.
Impact on the performance of FIRST-HV for prediction of AD dementia in aMCI
The results of the computer simulations of the impact of additional variability of FIRST-HV due to pooling MRI data across 1.5T and 3T on its predictive power in ADNI1 aMCI are shown in Fig. 2. Additional noise in FIRST-HV up to 10% resulted in only small reduction of the AUC under the ROC curve for prediction of AD dementia in ADNI aMCI subjects. For 6.64% additional noise, which is the standard deviation of the inter-scanner variability for the aMCI population as measured by the signed relative difference (Table 4), the AUC declined from 0.79 to 0.77±0.02 (mean±standard deviation over 10,000 simulations of additional noise) for 12 months prediction, from 0.70 to 0.69±0.02 for 24 months prediction, and from 0.70 to 0.68±0.02 for 36 months prediction.
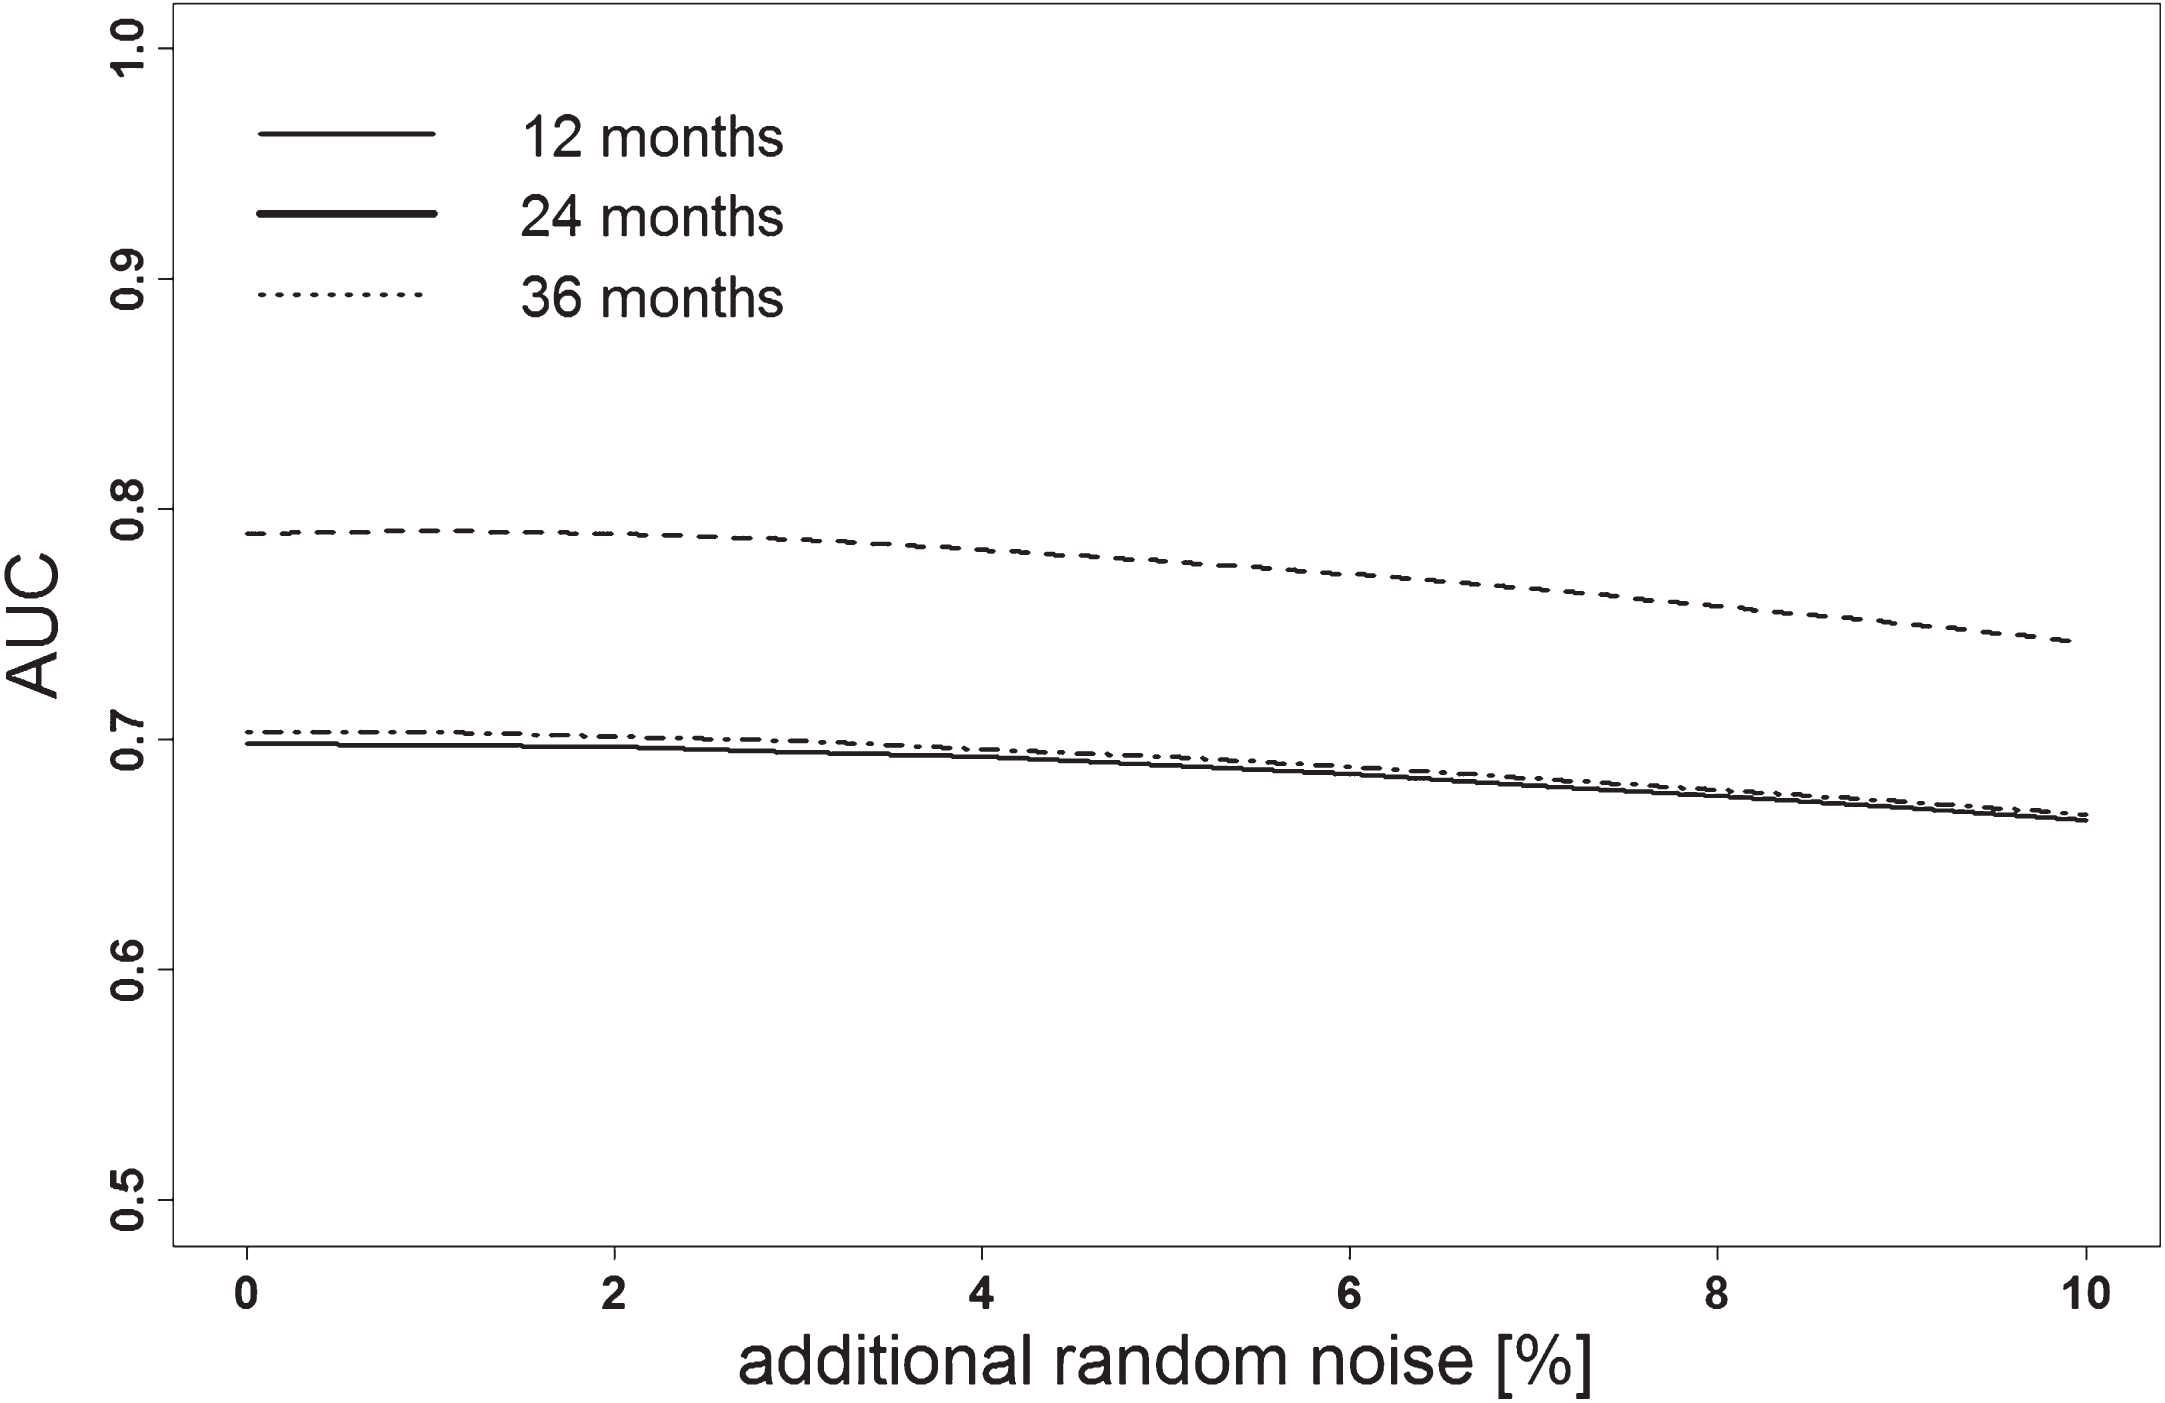
Computer simulations: area (AUC) under the ROC curve of FSL-FIRST hippocampus volume for prediction of AD dementia in ADNI1 aMCI subjects within 12 (dashed line), 24 (dot-dashed), and 36 (solid) months. The AUC (mean over 10,000 simulations) is plotted as a function of additional random noise (zero mean) added to the FSL-FIRST hippocampus volume from the harmonized ADNI 1.5T MRI scans.
FIRST-HV as an enrichment biomarker
Segmentation of the hippocampus failed in 12 of the additional 287 aMCI subjects and in 1 of the 227 cognitively normal controls (overall failure rate in the additional subjects 2.53%). The effect of aFIRST-HV based enrichment of the aMCI sample on the effect size of the 2-years change of MMSE, ADAS13, and CDR-SB is shown in Fig. 3. Enrichment resulted in increased effect size compared to the unenriched scenario (in which all aMCI subjects would be enrolled) for all 3 cognitive measures. The increase of the effect size was the larger the more stringent (smaller) the cutoff on aFIRST-HV was. The effect of measurement variability of FIRST-HV on its enrichment performance was rather modest: even the mean– 2 standard deviations of the enriched effect size was larger than the unenriched effect size (Fig. 3).
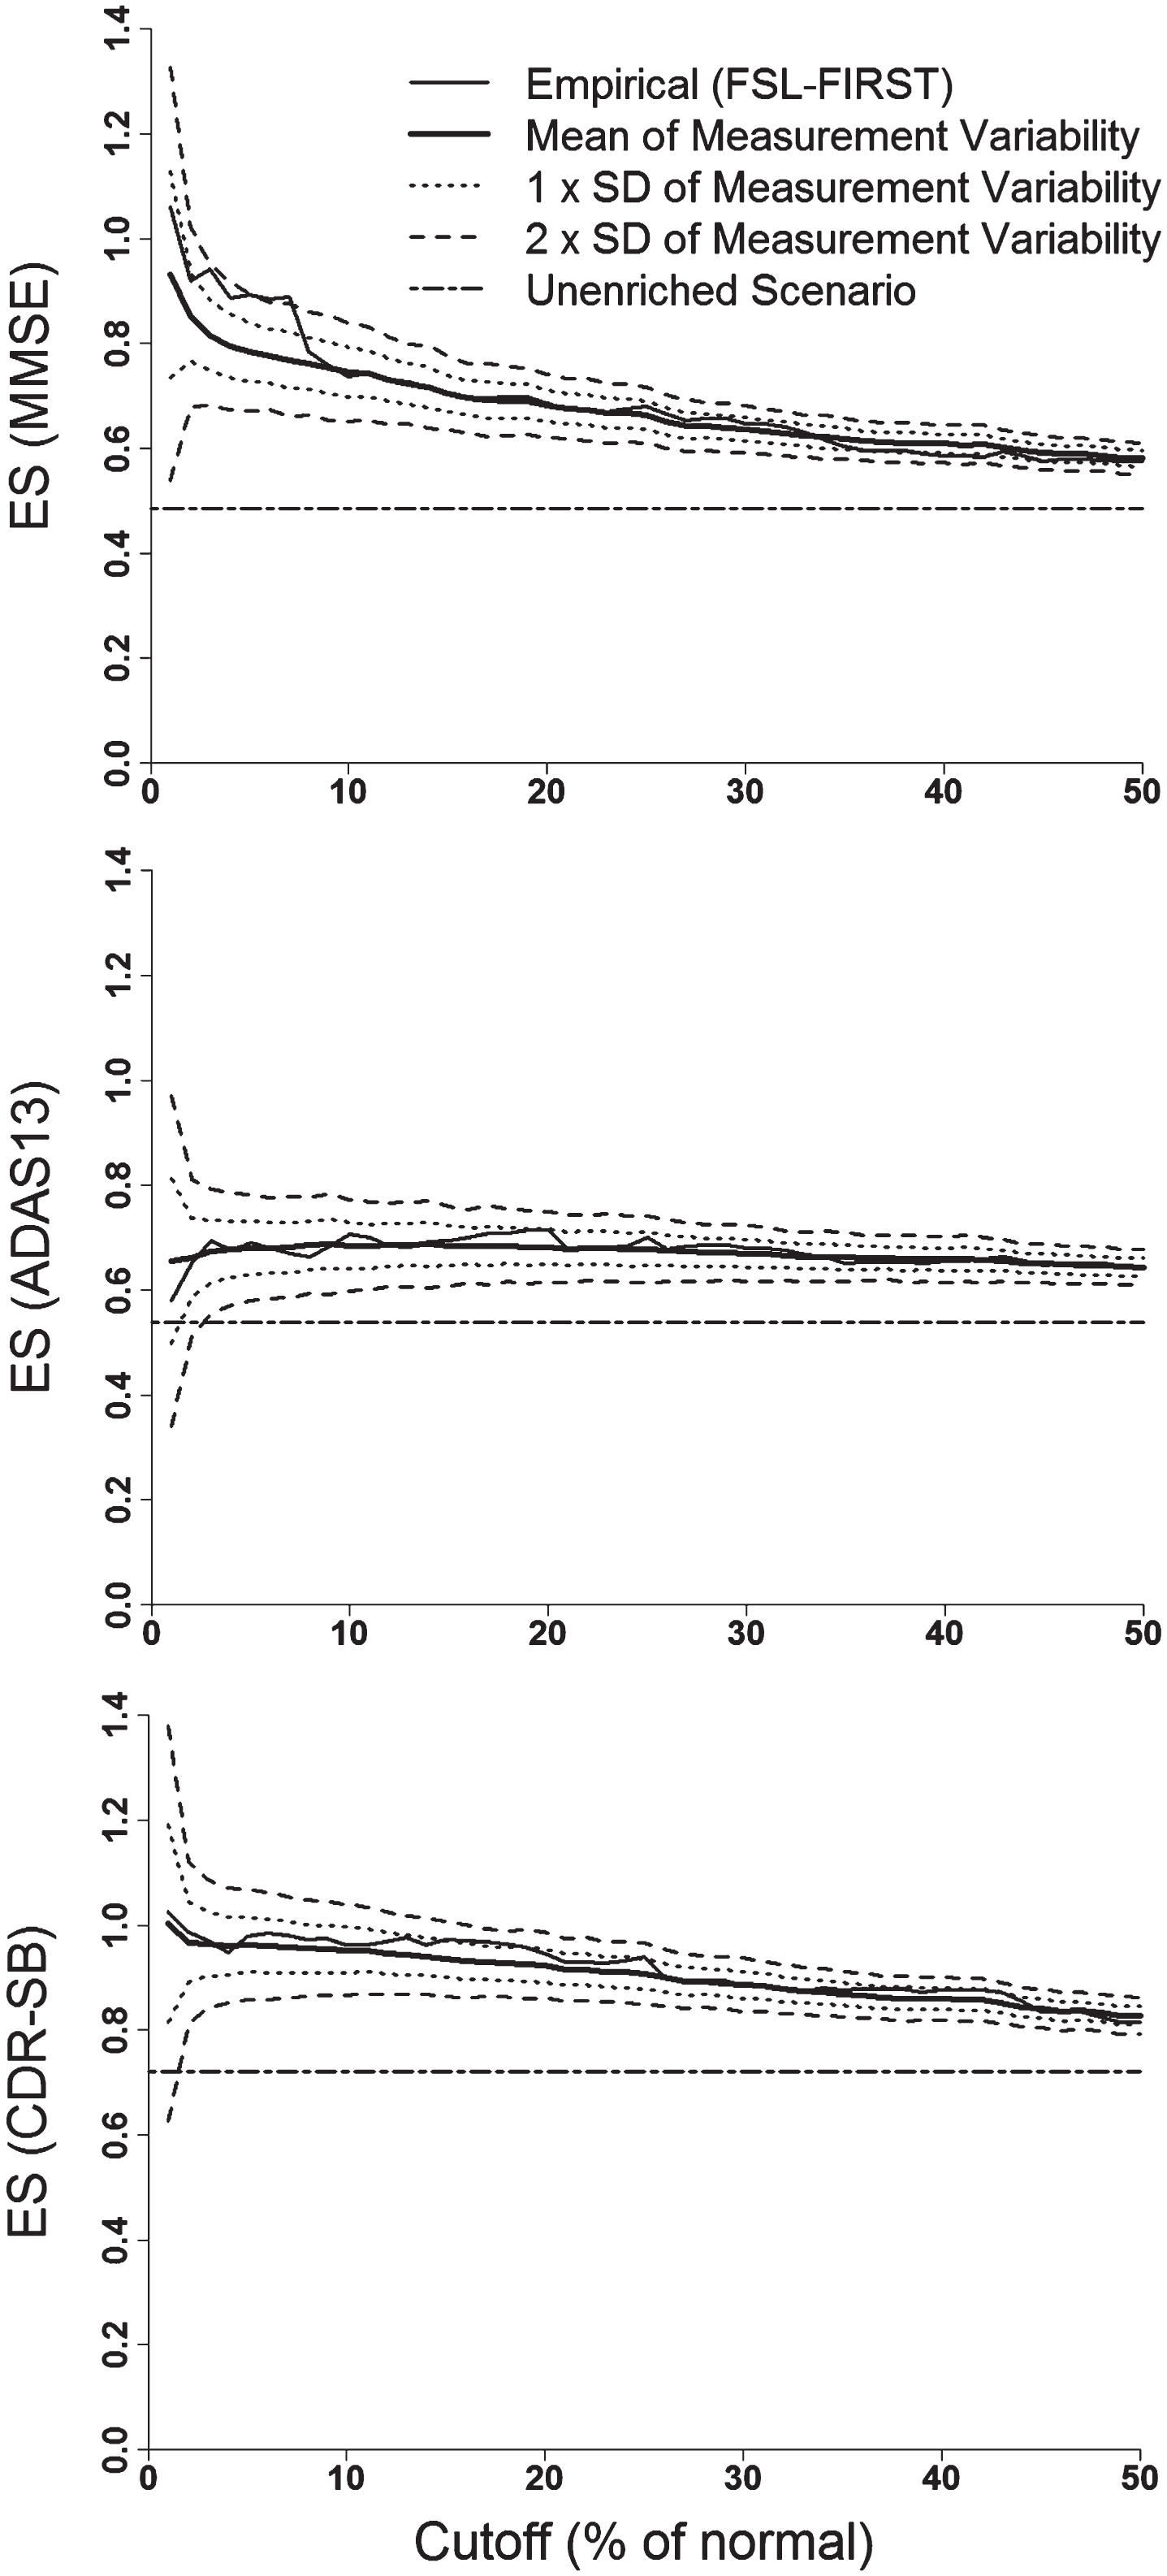
Effect of enrichment of the second aMCI sample based on FIRST-HV (adjusted for age and total intracranial volume) on the effect size of the 2-years change of MMSE (top), ADAS13 (middle) and CDR-SB (bottom) as a function of the cutoff derived from the 1st to the 50th percentile of adjusted FIRST-HV in cognitively normal controls. The effect of variance due to test-retest measurement variability of FIRST-HV is shown by the curves of mean±1 or±2 standard deviations (SD) of the effect size in the enriched scenario.
DISCUSSION
This study investigated the robustness of MRI-based HV using the freely available and fully automatic FSL-FIRST software tool with respect to back-to-back imaging at both 1.5T and 3T and with respect to variable field strengths (1.5T versus 3T). In addition, the study modelled the impact of inter-field strength variability on the power of FIRST-HV for prediction of progression and conversion to AD dementia in ADNI1 aMCI subjects. The study also evaluated FIRST-HV for enrichment of clinical trials using subjects with aMCI as target population.
The most important result of this study was that FIRST-HV showed a very small systematic difference (offset) between 1.5T and 3T MR field strength, at least when averaged over a variety of different pairs of 1.5T and 3T scanners (the study included 31 ADNI sites). FIRST-HV was on average 50.52 mm3 larger at 3T than at 1.5T. For comparison, the FIRST-HV difference between subjects with aMCI and healthy controls was 1213 mm3 and 1255 mm3 at 1.5T and 3T, respectively (Tables 2 and 3), i.e. about 24 times larger. The offset of the 1.5T versus 3T difference of FIRST-HV was statistically significant in the whole subject sample only (n = 147). It missed the level of statistical significance in the diagnostic subgroups. This obviously does not mean that there is no field strength effect in the diagnostic subgroups. The lack of statistical significance in the subgroups most likely is explained by reduced statistical power due to reduced sample size, not sufficient to detect this small effect. However, “two one-sided tests” (TOST) equivalence testing [25] with 5% equivalence margin lead to clear-cut rejection of the null hypothesis of unequal FIRST-HV between 1.5 and 3T (Table 4). This indicates equivalence of FIRST-HV between 1.5 and 3T at the 5% level or better. Altogether, these findings suggest that in order to support clinical decisions by hippocampus volumetry the same cutoff on hippocampus volume might be employed independent of the imaging platform and the acquisition protocol when FSL-FIRST is used for hippocampus volumetry.
The signed FIRST-HV difference showed an approximately two times larger standard deviation in the 3T versus 1.5T inter-field strength setup than in both intra-scanner setups, i.e. in back-to-back scans acquired in the same imaging session. To some extent this might be attributed to the fact that medium-term test-retest variability (a delay of several weeks between the 1.5T and the 3T imaging session, which also requires repositioning of the subject’s head) in general is expected to be larger than short-term test-retest variability (within a few minutes in the same imaging session without repositioning). However, the major contribution to increased variability of the 3T versus 1.5T difference most likely is due to some scanner dependence of FIRST-HV, particularly with respect to varying field strength. Field strength dependence might be associated with higher signal-to-noise ratio (SNR) at 3T than at 1.5T.
Wolz and colleagues [20] assessed intra- and inter-scanner variability of hippocampus volume estimated by LEAP [12], a state-of-the-art tool for hippocampus volumetry that was used as part of the submission to the European Medicines Agency (EMA) for hippocampal volume as an imaging biomarker for enrichment of clinical trials in predementia stages of AD [7]. Tables 2–4 provide the measures of intra-scanner and inter-field strength variability of FIRST-HV using exactly the same notation as Wolz and colleagues [20]. The present study also used exactly the same MRI data as Wolz and colleagues so that results can be directly compared. The variance (not the mean) of the test-retest difference of HV obtained from back-to-back scans in the intra-scanner setup was larger with FSL-FIRST than with LEAP, both at 1.5T and at 3T. For example, the relative signed difference Δ signed in the whole sample at 1.5T was 0.10±2.80% for FSL-FIRST (Table 2) and -0.19±1.93% for LEAP (Table 2 in [20]), i.e. the standard deviation of Δ signed was about 31% smaller for LEAP than for FSL-FIRST. This difference was slightly less prominent at 3T: 0.26±3.30% for FSL-FIRST (Table 3) and -0.21±2.50% for LEAP (Table 2 in [20]), i.e., at 3T the standard deviation of Δ signed was about 24% smaller for LEAP than for FSL-FIRST. However, the difference was more pronounced in the 1.5T versus 3T inter-field strength setup. The relative signed 1.5T versus 3T difference Δ signed in the whole sample was 0.78±5.80% for FSL-FIRST (Table 4) and 1.17±3.07% for LEAP (Table 3 in [20]), i.e. the standard deviation of Δ signed was about 47% smaller for LEAP than for FSL-FIRST, thus suggesting that FSL-FIRST is somewhat less robust than LEAP, particularly with respect to variation of the MR field strength. Previous results by Lotjonen and co-workers [31] also suggested that multi-atlas segmentation might be more robust than FSL-FIRST with respect to variation of the field strength. This group tested multi-atlas segmentation in ADNI subjects and reported a relative signed 1.5T versus 3T difference Δ signed of 3.17±2.47%, i.e. the standard deviation was about 57% smaller than reported here for FSL-FIRST.
Wolz and colleagues put δ unsigned for the LEAP algorithm in relation to the mean volume difference between AD patients and normal subjects to estimate the order of magnitude as to which level the variability might impact the effect size for the discrimination of these groups. They reported the proportion of variability with respect to the volumetric difference between both subgroups to be 6.7% and 7.2% for the 1.5T and 3T intra-scanner setup, and 12.5% for the inter-field strength setup. The corresponding figures for FSL-FIRST obtained here are 6.8% (1.5T), 8.4% (3T), and 15.1% (3T versus 1.5T). Thus, the impact of test-retest variability, both intra-scanner and between 3T and 1.5T scanners, appears only slightly larger with FSL-FIRST than with LEAP. This suggests a very small impact of FSL-FIRST versus LEAP on the performance in clinical tasks. This was confirmed by the computer simulations (Fig. 2), suggesting that the additional variance of FIRST-HV due to pooling 1.5T and 3T data (without adjusting the HV cutoff) causes only very small degradation of its power to predict progression and conversion to AD dementia in subjects with aMCI.
The analysis of FIRST-HV as enrichment biomarker for trials targeted for subjects with aMCI (Fig. 3) demonstrated similar performance of FIRST-HV as the 4 widely used algorithms for hippocampus volumetry evaluated by Yu and colleagues [28]: FreeSurfer [9], NeuroQuant [10, 11], Learning Embeddings for Atlas Propagation (LEAP) [12], and Hippocampus Multi-Atlas Propagation and Segmentation (HMAPS) [13, 14] (Fig. 1 in [28]). The rationale of biomarker-based eligibility criteria for interventional AD trials is to enrich the patient sample with patients in whom the cognitive impairment is actually caused by AD pathology. This is expected to increase the trial’s power to demonstrate efficacy of an intervention that is effective in treating AD. However, biomarker-based patient selection with very restrictive cutoffs may considerably affect the generalizability of the trial’s findings to more heterogeneous patient population as typically seen in clinical patient care.
Two previous studies investigated the robustness of MRI-based hippocampus volumetry with FSL-FIRST. Morey and colleagues used FSL-FIRST in 23 young, healthy subjects who received back-to-back scans with a 3T MR system on two different days [32]. Nugent and colleagues investigated intra- and inter-scanner test-retest variability of FSL-FIRST hippocampus volumetry in psychiatrically healthy and mentally ill subjects using three different 3T MR systems [33]. They observed a significant hippocampal volume difference between MRI systems equipped with either a single channel or an 8-channel coil, most likely caused by the difference in SNR (higher with the 8-channel coil).
Finally, the failure rate of FSL-FIRST hippocampus segmentation was small (20 out of a total of 1126 scans processed in this study, 1.78%). The occurrence of segmentation failures, however, makes visual inspection of the segmentation results mandatory. The rate of segmentation failures might be reduced by using the FSL Brain Extraction Tool (BET) to remove the skull prior to the application of FSL-FIRST. Image preprocessing by SPM12 6-parameter rigid-body co-registration to MNI space prior to application of FSL-FIRST also might reduce the rate of segmentation failures [15]. In the 147 ADNI subjects included in the test-retest and inter-field strength stability analyses (Table 1), the relative signed difference of FIRST-HV computed with and without SPM12 preprocessing was ≤ 0.1% for both 1.5 and 3T scans (results not shown). This indicates that the impact of the additional interpolation (smoothing) step associated with the SPM12 preprocessing is negligible. It therefore is permissible to try SPM12 preprocessing if straight application of FSL-FIRST fails. Regular preprocessing is not required.
A limitation of neuroimaging analyses, including hippocampus volumetry with FSL-FIRST, is that results depend on the computing platform. Glatard and co-workers tested the reproducibility of several neuroimaging tools including Freesurfer and FSL on two computing clusters which differed in the operating system and the software library (GNU C library) [34]. The reproducibility of FSL-FIRST segmentation was tested in MRI brain scans of 150 subjects. The segmentation results differed between the two computing clusters in each single case. Although the Dice coefficient was very close to one on average for all segmented brain structures, indicating very good agreement of the segmentations from the two computing clusters, there were outliers with very low Dice coefficient for small structures, such as the amygdala and the nucleus accumbens, in some subjects. Glatard and co-workers did not observe strong platform effects in FSL-FIRST segmentation of the hippocampus. Nevertheless, there are computing platform effects which one should be aware of.
Parallel imaging techniques such as generalized autocalibrating partially parallel acquisition (GRAPPA) and sensitivity encoding (SENSE) have been introduced for reduction of MR scan time. This reduces the risk of motion-artifacts and allows higher patient throughput, but it is associated with decreased signal-to-noise ratio. The latter might affect FSL-FIRST estimates of hippocampal volume. It also might increase the rate of segmentation failures. This should be tested in further studies for validating FSL-FIRST for widespread use in clinical routine.
In conclusion, the impact of intra-scanner and inter-field strength variability of MRI-based hippocampus volumetry with FSL-FIRST on clinical tasks, such as prediction of AD dementia in subjects with amnestic MCI, is negligible. This suggests that the cut-off on FIRST-HV proposed in [15] can be employed to support clinical decisions, independent of the neuroimaging platform, at least when using harmonized acquisition protocols according to the ADNI. This is particularly useful in routine clinical practice when a site-specific cut-off is not available. The results of this study also qualify FIRST-HV for enrichment in multicenter clinical trials targeted on prodromal AD patients.
Footnotes
ACKNOWLEDGMENTS
Data collection and sharing for this project was funded by the Alzheimer’s Disease Neuroimaging Initiative (ADNI) (National Institutes of Health Grant U01 AG024904) and DOD ADNI (Department of Defense award number W81XWH-12-2-0012). ADNI is funded by the National Institute on Aging, the National Institute of Biomedical Imaging and Bioengineering, and through generous contributions from the following: Alzheimer’s Association; Alzheimer’s Drug Discovery Foundation; Araclon Biotech; BioClinica, Inc.; Biogen Idec, Inc.; Bristol-Myers Squibb Company; Eisai, Inc.; Elan Pharmaceuticals, Inc.; Eli Lilly and Company; EuroImmun; F. Hoffmann-La Roche, Ltd and its affiliated company Genentech, Inc.; Fujirebio; GE Healthcare; IXICO, Ltd.; Janssen Alzheimer Immunotherapy Research & Development, LLC.; Johnson & Johnson Pharmaceutical Research & Development, LLC.; Medpace, Inc.; Merck & Co., Inc.; Meso Scale Diagnostics, LLC.; NeuroRx Research; Neurotrack Technologies; Novartis Pharmaceuticals Corporation; Pfizer, Inc.; Piramal Imaging; Servier; Synarc, Inc.; and Takeda Pharmaceutical Company. The Canadian Institutes of Health Research is providing funds to support ADNI clinical sites in Canada. Private sector contributions are facilitated by the Foundation for the National Institutes of Health (![]() ). The grantee organization is the Northern California Institute for Research and Education, and the study is coordinated by the Alzheimer’s Disease Cooperative Study at the University of California, San Diego. ADNI data are disseminated by the Laboratory for Neuro Imaging at the University of Southern California.
). The grantee organization is the Northern California Institute for Research and Education, and the study is coordinated by the Alzheimer’s Disease Cooperative Study at the University of California, San Diego. ADNI data are disseminated by the Laboratory for Neuro Imaging at the University of Southern California.