
Abstract
INTRODUCTION
Individuals diagnosed as mild cognitive impairment (MCI) are at high risk of conversion to Alzheimer’s disease (AD) [1, 2]. One study showed that 43% of MCI exhibited neuropsychiatric symptoms with depression (20%), apathy (15%), and irritability (15%) [3]. Depression has been considered as a potential clinical marker of preclinical AD [4]. A recent research showed that depressive symptoms in MCI patients were associated with greater atrophy in AD-affected regions (white matter atrophy in frontal, parietal, and temporal lobes), more obvious cognitive decline, and higher rates of conversion from MCI to AD [5]. Increasing studies have focused on the imaging characteristics of MCI patients with depression [6]. However, little is known about the abnormal functional characteristics revealed by resting-state functional magnetic resonance imaging (rs-fMRI) in MCI patients with concomitant depressive symptoms (MCI-d).
rs-fMRI, a promising tool that could assess intrinsic brain activity, may provide a new avenue for disease diagnosis and evaluation using image-based biomarker detection. The amplitude of low-frequency fluctuation (ALFF) and fractional amplitude of low-frequency fluctuation (fALFF) methods are usually used to reflect the regional spontaneous brain activity. The ALFF measures the amplitude of resting-state spontaneous brain activity by calculating the square root of the power spectrum in the low-frequency range [7]. The fALFF reflects the ratio of the low-frequency power spectrum to that of the entire frequency range [8]. Recently, low-frequency oscillations have gained increasing attentions and been widely used to investigate the resting-state function of the human brain [9]. In our recent study, subjects with subjective cognitive decline exhibited higher ALFF values than control subjects in the bilateral inferior parietal lobule, right inferior and middle occipital gyrus, right superior temporal gyrus (STG), and right cerebellum posterior lobe [10]. In our another previous study, the abnormal fALFF and ALFF values in the right ventral median frontal gyrus and in the right putamen were found in depressed patients, suggesting that such an anomaly may play a crucial role in depressive symptomatology [11]. All these studies indicated that the ALFF and fALFF could serve as effective markers for brain-related diseases. However, to our knowledge, there were still no studies about the ALFF and fALFF differences between the MCI and MCI-d patients.
The ALFF and fALFF were usually calculated within the full frequency (0.01–0.1 Hz), and recently the characteristics within different subbands have attracted more and more attentions. Zuo et al. firstly reported the existence of frequency-dependent effects in ALFF and fALFF [8]. In our previous study, the frequency-dependent changes of ALFF in MCI patients were found to mainly located in the posterior cingulate cortex, precuneus, hippocampus, parahippocampal gyrus, and the medial prefrontal cortex might be related to metabolic correlates of neuronal activity in MCI [12]. Researchers also observed significant main effects of frequency on ALFF and fALFF in widely distributed brain regions, including the right putamen, inferior frontal gyrus (IFG), precentral gyrus, the bilateral posterior cingulate, and precuneus in major depressive disorder [13]. To the best of our knowledge, it is still unknown about the frequency dependent differences in ALFF and fALFF between the MCI and MCI-d patients.
Most previous studies have focused on the depression-related or MCI-related brain functional changes. However, the characteristics in MCI patients combined with depression using rs-fMRI are not clear. Here, we used rs-fMRI to detect the functional differences among MCI, MCI-d, and HC groups, and especially between MCI and MCI-d groups. ALFF and fALFF of rs-fMRI were utilized to investigate brain changes among the above three groups. Here we hypothesized that the patients in MCI-d group would show abnormal amplitudes of low frequency oscillations (LFO) in specific regions. Furthermore, it remains largely unknown whether the abnormalities are related to specific frequency bands of LFO, so we observed the features in three distinct frequency bands: 1. 0.01–0.1 Hz, 2. slow-5 (0.01–0.027 Hz), and 3. slow-4 (0.027–0.073 Hz). In the study, we sought to determine (i) whether the MCI-d patients show abnormal LFO amplitudes in the specific brain regions and (ii) whether it is necessary for MCI-d patients to analyze the rs-fMRI data within Slow 5 and Slow 4 besides the full frequency, i.e., whether more diagnostic information for MCI-d patients could be provided within Slow 5 and Slow 4 compared with the full frequency.
MATERIALS AND METHODS
Participants
The study was approved by the Research Ethics Review Board of XuanWu Hospital. A total of 78 right-handed subjects were recruited in the study, including 27 patients with MCI due to AD who did not have depression symptoms (MCI), 19 MCI combined with depression patients (MCI-d) who were first suffered from MCI, and 32 well-matched cognitive healthy controls (HC). All MCI and MCI-d patients were recruited at the clinic of the Department of Neurology, XuanWu Hospital, Capital Medical University, Beijing, China. The HC group were recruited from the local community via advertisements. Diagnoses of MCI due to AD were made by experienced neurologists using Petersen’s criteria [14]. The diagnosis of MCI-d fulfilled the published MCI diagnostic criteria [14] and the Mini-International Neuropsychiatric Interview (MINI) for the diagnosis of mild depression [15]. The inclusion criteria included an acute episode of mild depression who were first suffered from MCI and the 17-item Hamilton Depression Rating Scale (HDRS) was 8–16 scores [16, 17]. The MCI and MCI-d subjects were excluded if they had been diagnosed with major depression, recurrent depression, or other psychiatric disorders as described in DSM-IV. The subjects of MCI and HC groups with no diagnosed depression were score 0 to 4 in 17-item HDRS [18]. Controls were screened as described in the Structured Interview for DSM-IV Non-Patient Edition to confirm the life-long absence of psychiatric and neurological illness. Inclusion criteria for MCI due to AD included: (1) memory complaint, preferably confirmed by an informant; (2) objective memory impairment, (cutoff points of Mini-Mental State Examination (MMSE) score [19]: 19 (no formal education), 22 (1 to 6 years of education), 26 (7 or more years of education);cutoff points of Montreal Cognitive Assessment (MoCA) [20]: 13 (no formal education), 19 (1 to 6 years of education), 24 (7 or more years of education); cutoff point of Auditory Verbal Learning Test (AVLT) - delayed recall: 6); (3) no or minimal impairment of daily life activities; (4) a Clinical Dementia Rating (CDR) [21] score of 0.5; and (5) free from dementia according to the Diagnostic and Statistical Manual of Mental Disorders, fourth edition, revised (DSM-IV-R); (6) hippocampal atrophy confirmed by structural MRI; and (7) the Han nationality, right-handed (the Edinburgh handedness scale score [22] >40 points). The exclusion criteria applied to all subjects were as follows: contraindications for MRI; with histories of stroke, psychiatric disease, neurological disorder, alcohol or drug abuse, and systemic disease such as severe anemia, thyroid dysfunction, syphilis, or acquired immune deficiency syndrome. All subjects underwent a standardized clinical and neuropsychological evaluation, including the MMSE, MoCA, AVLT, activities of daily living scale, Hachinski Ischemic Scaling (HIS), HDRS, and CDR. Furthermore, the quality of the whole-brain rs-fMRI images was inspected by an experienced neuroradiologist.
Image acquisition
All MRI data were acquired on a 3.0-Tesla Magnetom Trio Tim scanner (Siemens, Erlangen, Germany) at Xuanwu Hospital, Capital Medical University. During the scanning, the subjects were asked to keep the eyes closed without significant head motion, and not to fall asleep or think anything systematically. The rs-fMRI data were collected through gradient echo-planar imaging sequence using the following parameters: TR = 2 s; TE = 40 ms; matrix = 64×64; number of slices = 28; slice thickness = 4 mm; gap = 1 mm, and voxel size = 4×4×4 mm3. At the same time, the 3D-T1 weighted images were acquired for the normalization step. The parameters were set as follows: TR = 1.9 s, TE = 2.2 ms, matrix = 448×512, number of slices = 176, thickness = 1 mm, voxel size = 0.5×0.5×1 mm3.
Data analysis
Image preprocessing was conducted using the latest software DPABI. In detail, the first 10 volumes of the rs-fMRI data were removed to reach the stabilization state of the scanner. Then, slice time and head motion correction were carried out. In this study, subjects with head motion >2 mm (displacement) or 2 (rotation) were discarded, and there were also no significant group differences in the head motion (mean_FD_Jenkinson) among the three groups. After that, the T1-weighted images were registered to the mean functional images, and the resulted images were segmented into the gray matter, white matter and the cerebrospinal fluid by ‘new segment’ tool. The Dartel toolbox was subsequently used to generate a specific group template, through which the functional images were finally normalized to the Montreal Neurological Institute (MNI) space and resampled to 3 mm isotropic voxels. Furthermore, several nuisance variables were regressed out from the individual functional image, including the linear trend, 24 Friston head motion parameters, signals from the white matter and the cerebrospinal fluid. In addition, the normalized functional images were smoothed with a 4 mm full width at half maximum (FWHM) Gaussian kernel. At last, the ALFF and the fALFF were calculated at different frequency bands: 1. 0.01–0.1 Hz (full frequency); 2. 0.01–0.027 Hz (Slow 5); and 3. 0.027–0.073 Hz (Slow 4). For the ALFF calculation, the images were band-pass filtered with the corresponding frequency band. Besides, the calculated ALFF and fALFF values of each voxel were divided by the whole brain mean ALFF and fALFF values for the following statistical purpose.
Statistical analysis
The one-way analysis of covariance (ANCOVA) was performed to find the main differences in ALFF and fALFF at different frequency bands among three groups, and individual age, sex, and education level were used as the covariates. The analysis was constrained with a gray matter mask (obtained by a threshold of 0.3 for the gray matter probability maps from the TPM.nii file in SPM) [23]. The results were reported after an Alphasim correction, and the threshold was set at individual p < 0.01 and a cluster extent of 33 voxels, which corresponds to a corrected p < 0.05. The regions with significant differences among three groups in ALFF and fALFF at different bands were selected as the regions of interest (ROIs). The mean ALFF and fALFF values in the ROIs were then calculated for every subject and compared between each pair of the three groups. Also, in order to investigate the correlation between the mean ALFF and fALFF values in the ROIs and the clinical scores, a Spearman correlation analysis was performed.
ROC analysis
The ROIs with significantly different ALFF and fALFF values between MCI and MCI-d group were further analyzed with the receiver operating characteristic (ROC) curve. The ROC analysis is a widely-used method to compare the diagnostic performance of the biomarkers, and three important indexes could be acquired from the analysis: sensitivity, specificity, and the area under curve (AUC). In the study, this part was carried out by Medcalc 11.0 software.
RESULTS
Demographic and clinical data
As shown in Table 1, no differences were found with sex, age, and education level among three groups. There were also no differences among groups in the mean framewise displacement [24], which was thought to uniquely account for the regional variation in head motion [25]. For the clinical scores, the MCI group showed significant differences in HDRS and AVLT-D compared with the MCI-d group, and no significant differences existed in MMSE, MoCA, AVLT-I, AVLT-R, and HIS between MCI and MCI-d groups.
Sample characteristics
HC, healthy control; MCI, mild cognitive impairment; MCI-d, mild cognitive impairment with the symptom of depression; MMSE, Mini-Mental State Examination; MoCA, Montreal Cognitive Assessment; AVLT-I, auditory verbal learning test-immediate recall; AVLT-D, auditory verbal learning test-delayed recall; AVLT-R, auditory verbal learning test-recognition; HDRS, Hamilton Depression Rating Scale; HIS, Hachinski Ischemic Scaling; SD, standard deviation. χ, The p value was obtained by the chi-square test; F, The p value was obtained by the one-way ANOVA test; t, The p value was obtained by the two-sample t test between the MCI and MCI-d groups.
The ANCOVA results of ALFF
Significantly differences on ALFF among three groups were summarized in Table 2 and Fig. 1. In the full frequency band (0.01–0.1 Hz), six clusters, including bilateral parahippocampal gyrus, right putamen, right middle frontal gyrus (MFG), left precuneus and left IFG (opercular part), were found to be different among three groups. In the Slow 5 (0.01–0.027 Hz), three clusters comprising of the left IFG (opercular part), and the right superior frontal gyrus (SFG) and right angular gyrus were significantly activated regions. In contrast to the Slow 5, four brain areas from Slow 4 (0.027–0.073 Hz) displayed the main differences existing in the full frequency band among three groups, including the right parahippocampal gyrus, the left IFG (opercular part), the left precuneus and the right MFG.
Clusters showing significant differences among groups
Significance level: p < 0.01 & cluster size >33 voxels, corresponding to an Alphasim corrected p < 0.05. MNI, Montreal Neurological Institute; L, left; R, right; IFG, inferior frontal gyrus (opercular part); Parah, parahippocampal gyrus; Precu, precuneus; MFG, middle frontal gyrus; Puta, putamen; SFG, superior frontal gyrus; STG, superior temporal gyrus; Supramar, supramarginal gyrus.

ANCOVA results in ALFF (left part) and fALFF (right part) among the three groups. A) The ALFF results in the full frequency (0.01–0.1 Hz). B) The ALFF results in Slow 5 (0.01–0.027Hz). C) The ALFF results in Slow 4 (0.027–0.073 Hz). D) The fALFF results in the full frequency. E) The fALFF results in Slow 5 (0.01–0.027 Hz). F) The fALFF results in Slow 4 (0.027–0.073 Hz). The differences shown were thresholded at p < 0.05 Alphasim corrected. The results were displayed using the BrainNet Viewer software [22].
The ANCOVA results of fALFF
In general, the fALFF results showed far different from the ALFF results among three groups (Fig. 1 and Table 2). In the full frequency band (0.01–0.1 Hz), only the left IFG (opercular part) was found to be different, which was also the only region consistent with the ALFF results. In the Slow 5 (0.01–0.027 Hz), the right insula and the left STG were found to be significantly activated, while only the right supramarginal gyrus in Slow 4 (0.027–0.073 Hz) was displayed to be prominently different.
Between-group differences and correlation analysis
In the study, the clusters with significant differences in ALFF and fALFF among three groups using ANCOVA analysis were selected to make up the ROIs at different bands, which could be seen in Fig. 1. Once the ROIs were obtained, the between-group differences within the ROIs were compared for ALFF and fALFF in corresponding bands. The results presented in Figs. 2 and 3, which were two distinct types for the between-group differences. Figure 2 summarized six regions where the mean ALFF and fALFF between each pair of the three groups were all significantly different, including the left parahippocampal gyrus and the left precuneus from ALFF full frequency, the left IFG and the right SFG from ALFF Slow 5, left precuneus from ALFF Slow 4, and the right supermaginal gyrus from fALFF Slow 4. Figure 3 illustrated ten brain regions where both the MCI and MCI-d groups had significant ALFF and fALFF differences compared with the HC group, comprising of the left IFG, the right MFG, the right parahippocampal gyrus, the right putamen, the left STG, and the right insula, but no significant differences were found between the MCI and MCI-d groups.
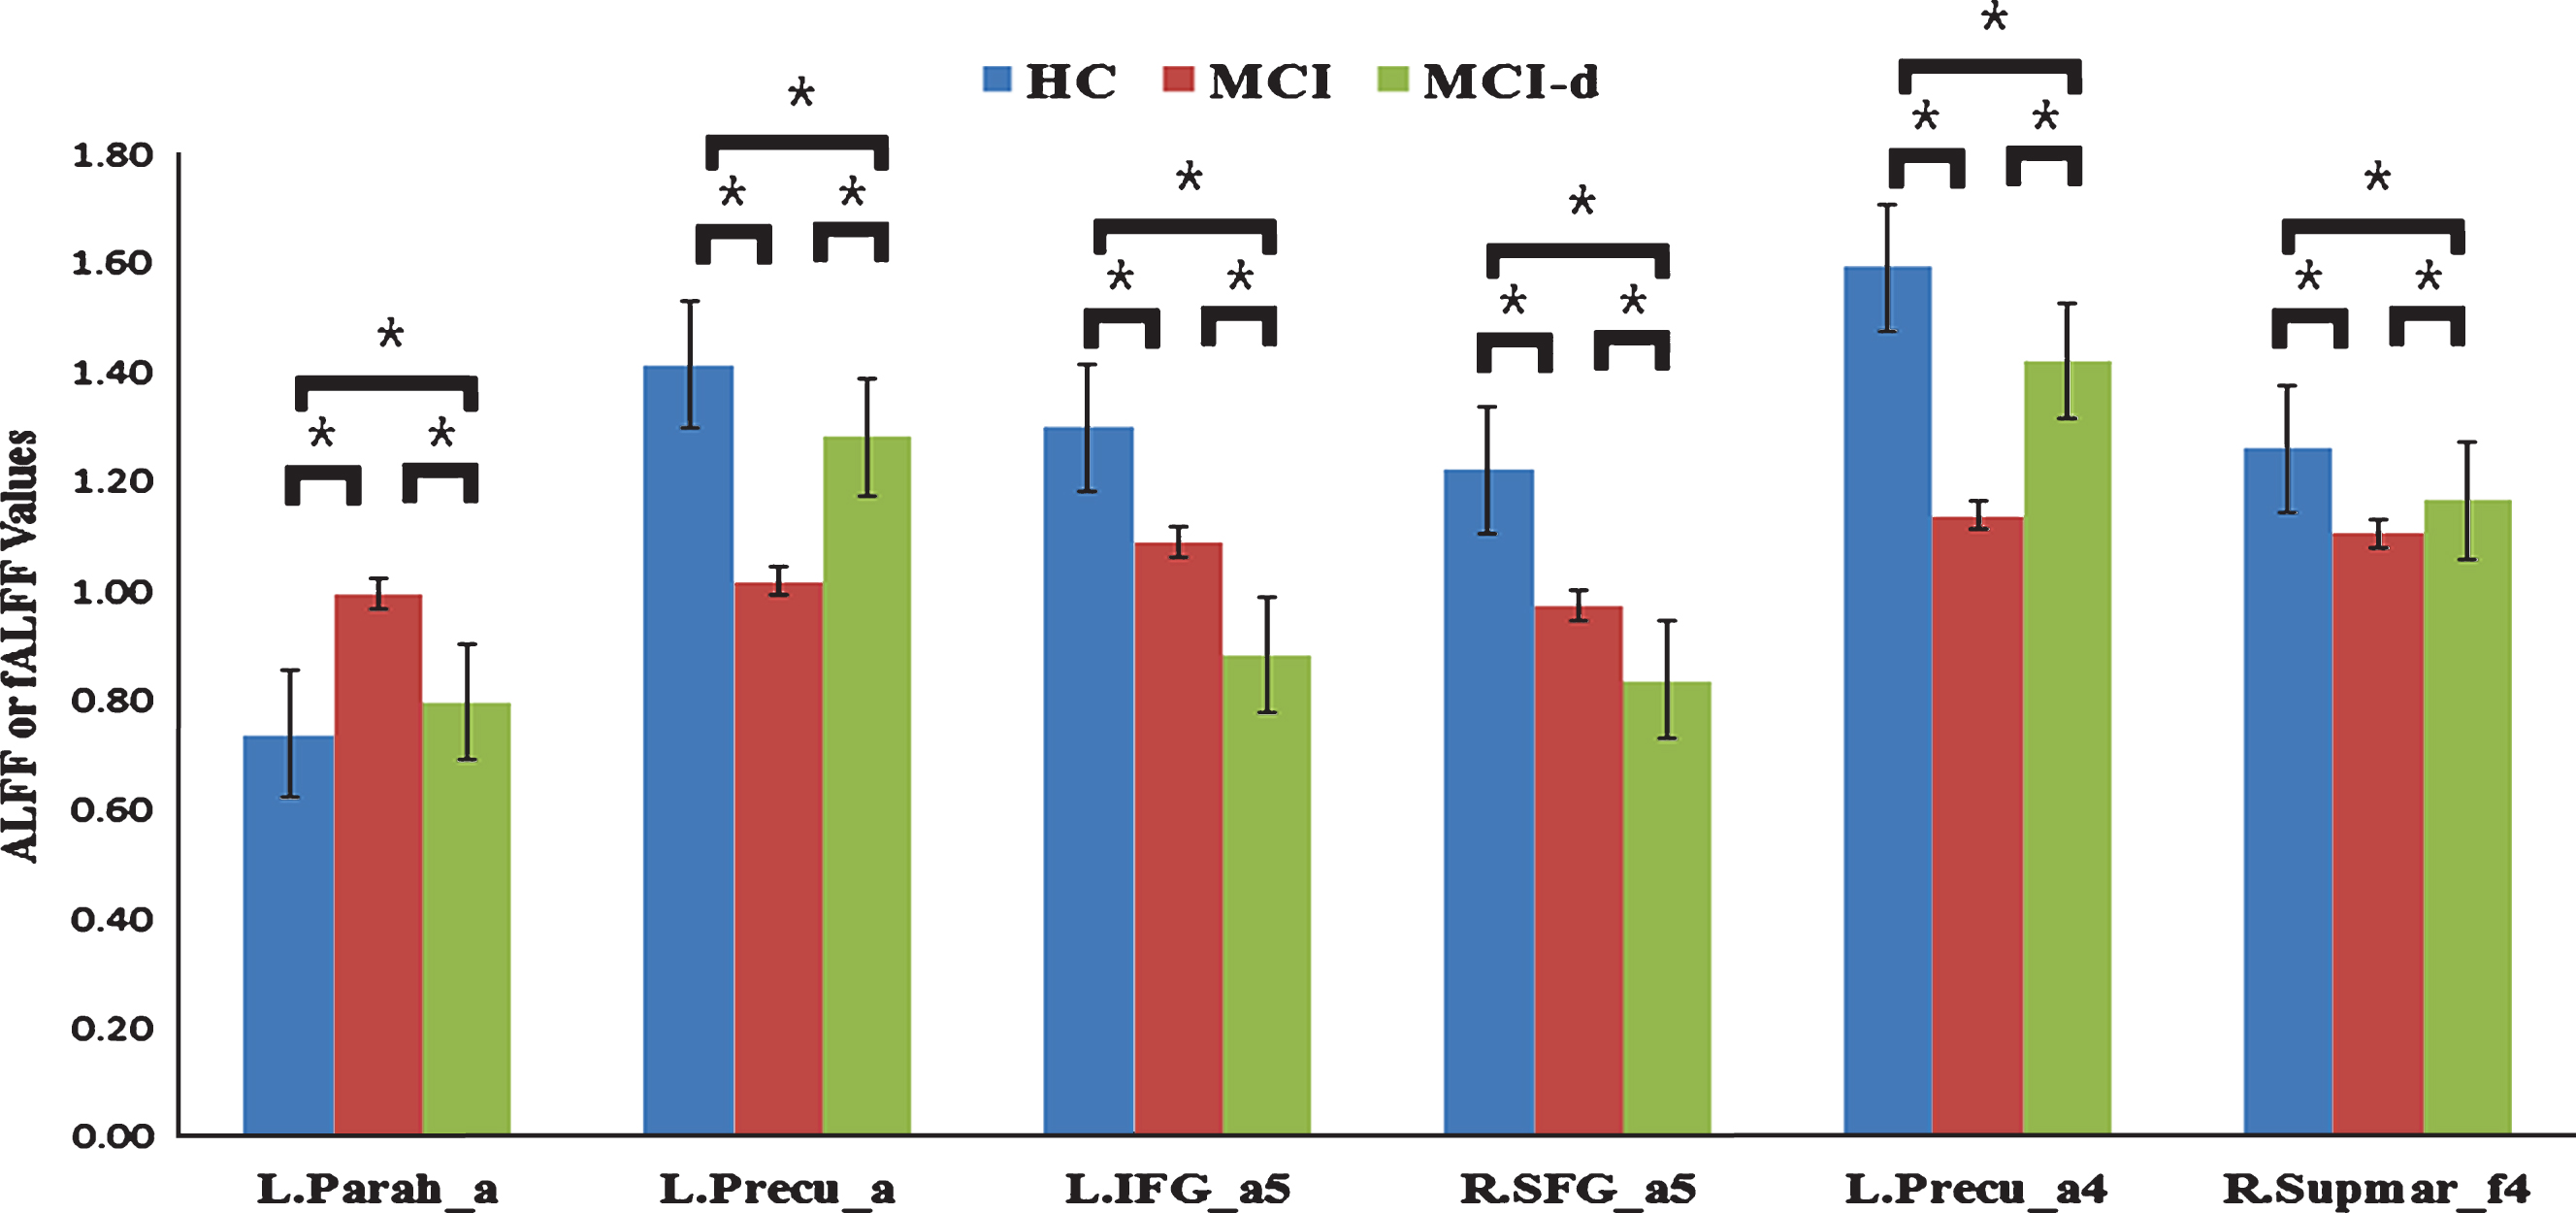
The bar plot showed the clusters where the mean ALFF and fALFF values were significantly different between each pair of the three groups and the error bar. The single asterisk represents a significance level of p < 0.05. L, left; R, right; Parah, parahippocampal gyrus; Precu, precuneus; IFG, inferior frontal gyrus (opercular part); SFG, superior frontal gyrus; Supmar, supermarginal gyrus; _a, ALFF in full frequency; _a5, ALFF results in Slow 5; _a4, ALFF results in Slow 4; _f4, fALFF results in Slow 4. For example, L. Parah_a means the left parahippocampal gyrus cluster obtained from the ALFF full frequency.
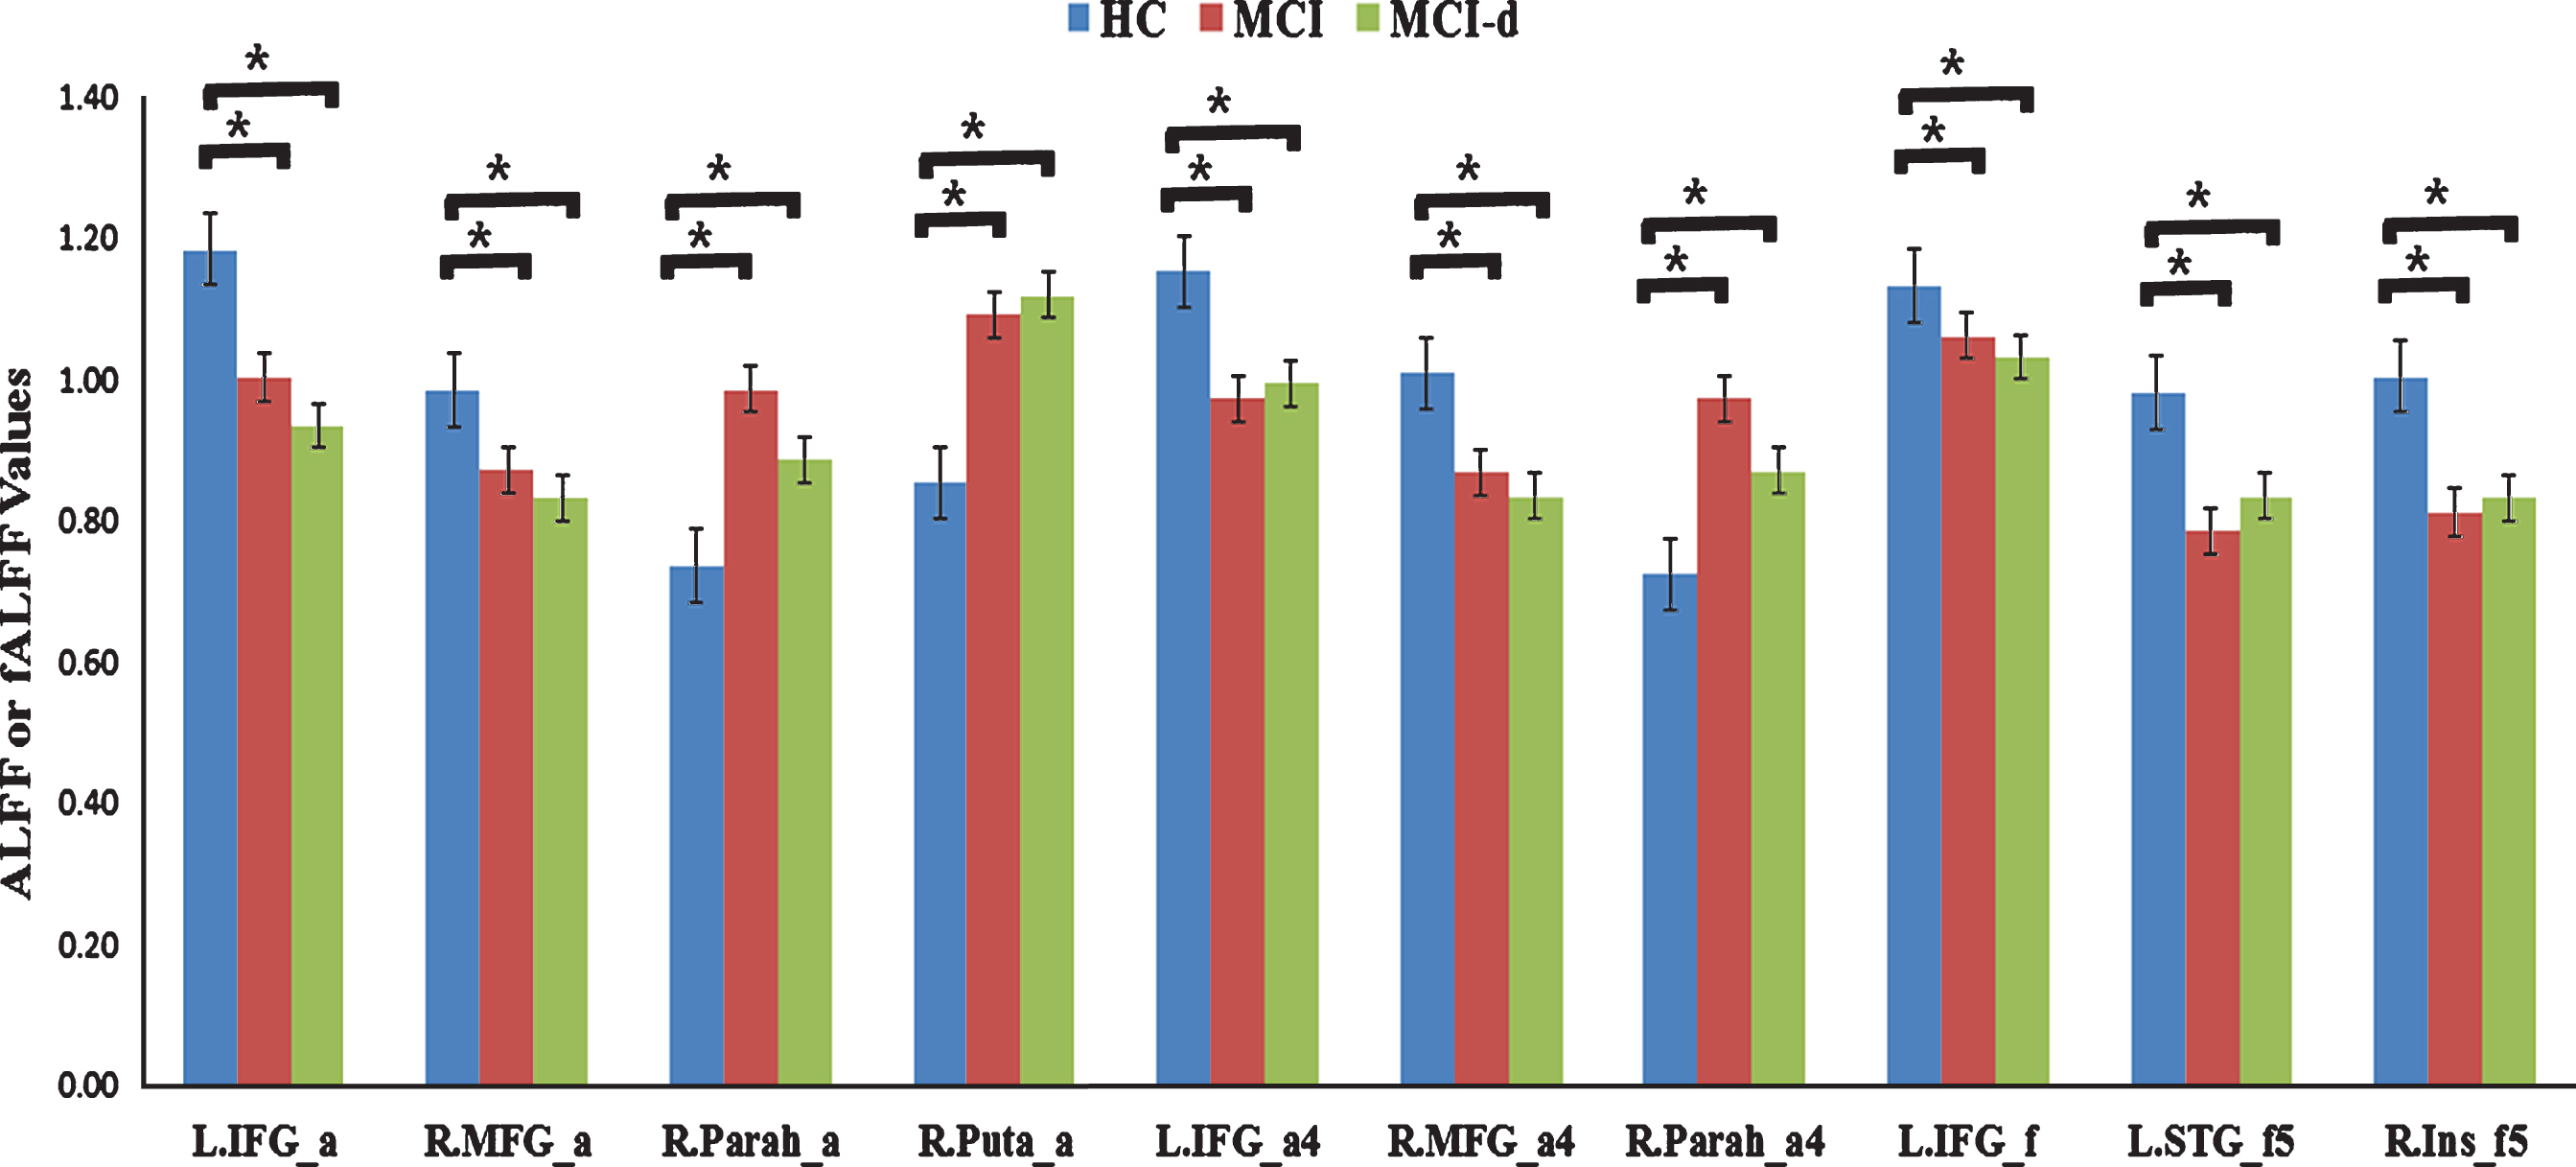
The bar plot displayed the error bar and the clusters where the mean ALFF and fALFF values in healthy group were significantly different from both MCI and MCI-d groups, but no significant differences existed between the MCI and MCI-d groups. The single asterisk represents a significance level of p < 0.05. L, left; R, right; IFG, inferior frontal gyrus (opercular part); MFG, middle frontal gyrus; Parah, parahippocampal gyrus; Puta, putamen; STG, superior temporal gyrus; _Ins, insula; _a, ALFF in full frequency; _a4, ALFF in Slow 4; _a5, ALFF in Slow 5; _f, fALFF in full frequency; _f5, fALFF in Slow 5.
Further correlation between prominent different brain areas and clinical scores in MCI and MCI-d groups considering age, gender, and education as covariates were analyzed and the results were summarized in Table 3, which showed that seven regions from ALFF and fALFF were correlated with the MMSE score, two regions positively correlated with the MoCA score, five regions were correlative with the AVLT-I score, and two regions displayed correlative relationship with the AVLT-R score. However, no ROIs showed significant correlations with the HDRS and AVLT-D scores in MCI and MCI-d groups.
Correlational analysis on brain areas with clinical scales in MCI and MCI-d groups
MCI, mild cognitive impairment; MCI-d, mild cognitive impairment with the symptom of depression; MMSE, Mini-Mental State Examination; MoCA, Montreal Cognitive Assessment; AVLT-I, auditory verbal learning test-immediate recall; AVLT-R, auditory verbal learning test-recognition; L, left; R, right; Precu, precuneus; Puta, putamen; SFG, superior frontal gyrus; Parah, parahippocampal gyrus; STG, superior temporal gyrus; IFG, inferior frontal gyrus (opercular part); _a, ALFF in full frequency; _a5, ALFF in Slow 5; _a4, ALFF in Slow 4; _f, fALFF in full frequency; _f5, fALFF in Slow 5; _f4, fALFF in Slow 4.
ROC analysis
Table 4 showed the ROC analysis results in the clusters where the MCI-d group had prominently different mean ALFF and fALFF values compared with the MCI group. It could be found that four regions displayed higher AUC values than 0.8, which is thought to be a criterion of good discrimination performance. These regions were all from the ALFF, including the left precuneus (AUC = 0.858) and the left parahippocampal gyrus (AUC = 0.858) obtained in the full frequency, the left IFG (opercular part, AUC = 0.801) in Slow 5, and the left precuneus (AUC = 0.851) in Slow 4. The other two regions also showed acceptable recognitions, including the right SFG (AUC = 0.707) from ALFF Slow 5 and the right supramarginal gyrus (AUC = 0.692) from fALFF Slow 4. Six brain regions showed significant differences between MCI and MCI-d groups, the logistic regression was adopted to testify the classification performance, and 91.3% accuracy was obtained to discriminate MCI-d from MCI patients. The ROC curve was shownin Fig. 4.
ROC analysis results
L, left; R, right; Parah, parahippocampal gyrus; Precu, precuneus; IFG, inferior frontal gyrus (opercular part); SFG, superior frontal gyrus; Supramar, supramarginal gyrus; _a, ALFF in full frequency; _a5, ALFF in Slow 5; _a4, ALFF in slow 4; _f4, fALFF in Slow 4.
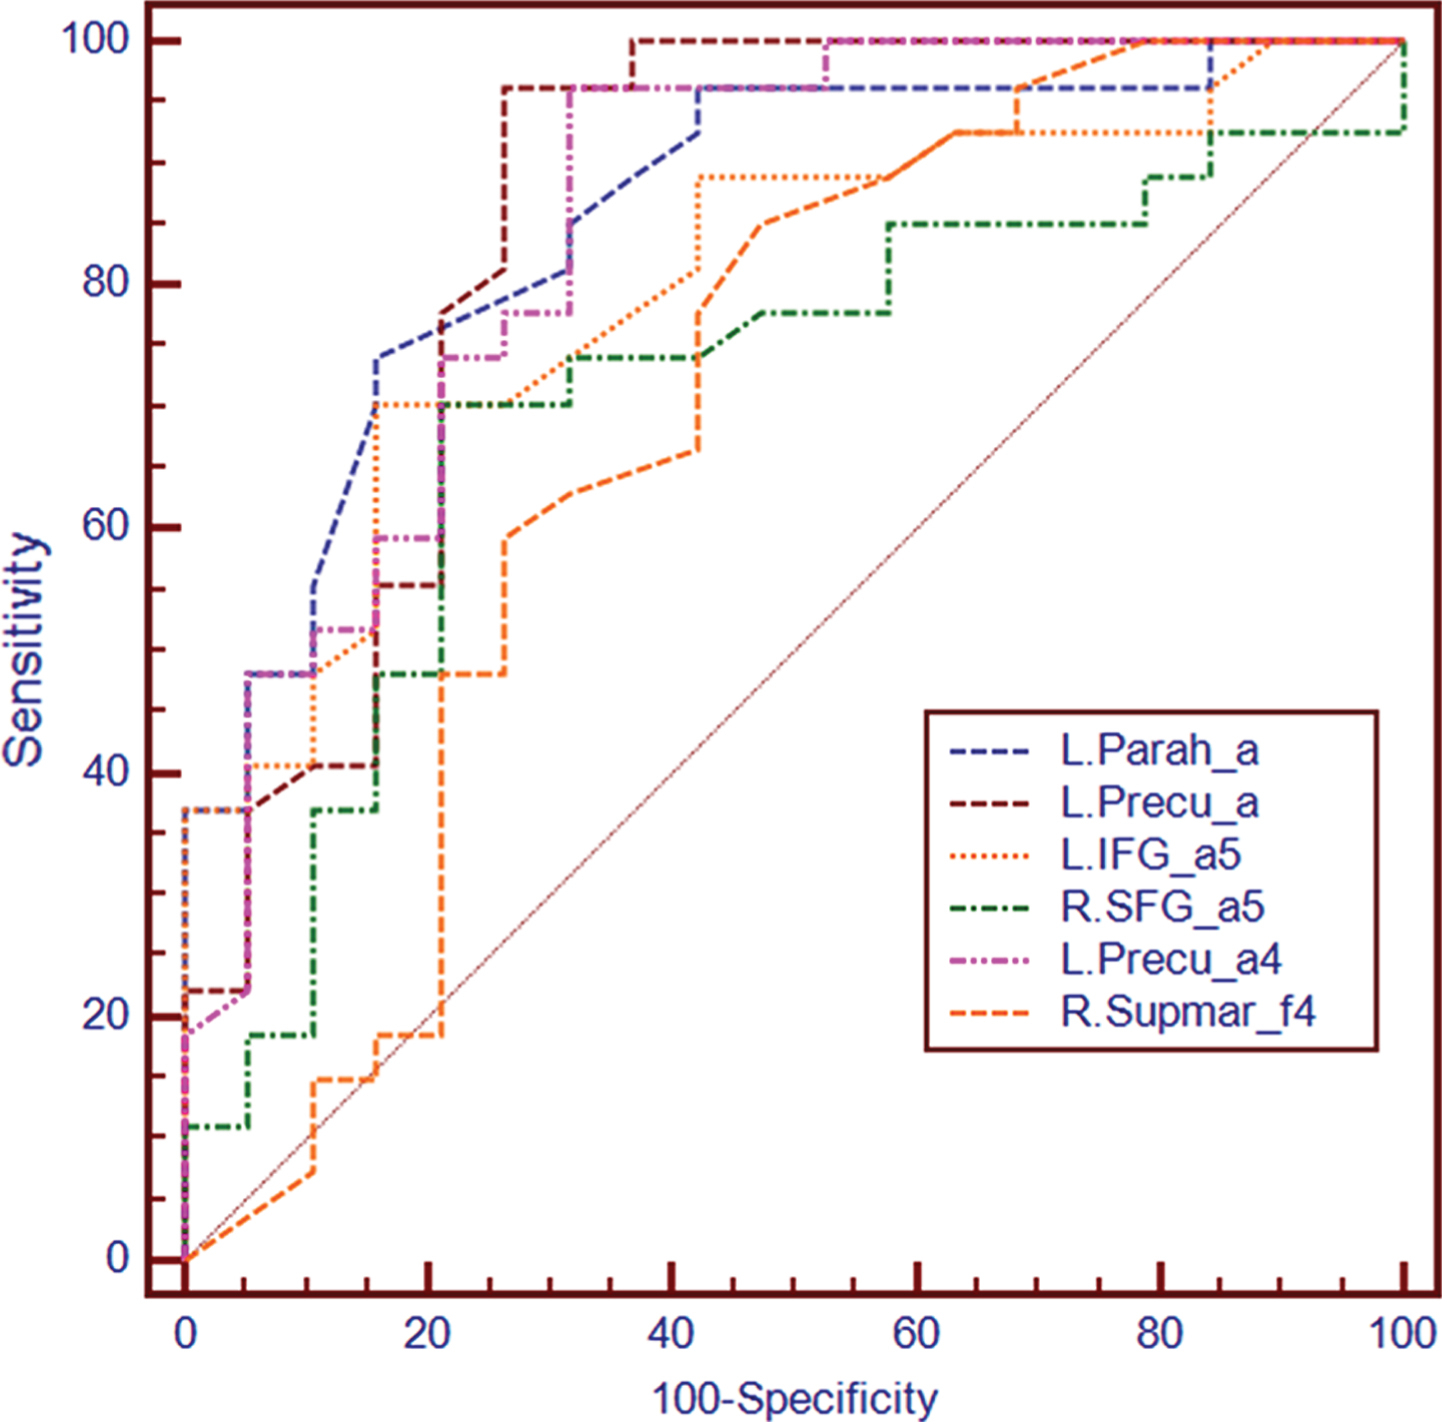
The ROC curve. L, left; R, right; Parah, parahippocampal gyrus; Precu, precuneus; IFG, inferior frontal gyrus (opercular part); SFG, superior frontal gyrus; Supmar, supermarginal gyrus; _a, ALFF in full frequency; _a5, ALFF results in Slow 5; _a4, ALFF results in Slow 4; _f4, fALFF results in Slow 4.
DISCUSSION
In this study, we examined the changes of ALFF and fALFF in the patients with MCI and MCI-d at three different frequency bands (full frequency, slow-5 and slow-4 bands). We found that several brain regions showed significant differences in ALFF and fALFF in three bands among the MCI, MCI-d, and HC groups. Importantly, ROC analysis revealed that the ALFF values in the left parahippocampal gyrus and the left precuneus, Slow 5 value in ALFF in the left IFG, and Slow 4 value in ALFF in the left precuneus could serve as markers to effectively differentiate MCI-d from MCIpatients.
Differences in ALFF and fALFF in the three groups among frequency bands
We found significant differences with ALFF and fALFF in MCI, MCI-d, and HC groups among different frequency bands in the study. Several clusters had been reported in DMN regions by ALFF in the full frequency band, including bilateral parahippocampal gyrus, right putamen, right MFG, left precuneus and left IFG (opercular part). However, by fALFF the number of abnormal regions was reduced obviously and only the left IFG (opercular part) was discovered. It has been pointed out that the ALFF is sensitive to the physiological noise irrelevant to brain activity such as noise induced by cardiac and respiratory pulsations which could be successfully suppressed with the fALFF approach [26]. In the meantime, a recent research by Zuo et al. revealed the greater specificity of fALFF for gray matter appearing to favor its use over that of ALFF, but ALFF showed somewhat higher test-retest reliability in gray matter regions than fALFF [8]. Taken together, in view of their limitations, it is still advisable to describe findings through both ALFF and fALFF measures. From our results, especially the ROC results, it seems that ALFF displayed better recognitive performances than fALFF to discriminate MCI-d patients from MCI patients, which indicates ALFF may be more sensitive for the abnormalities in MCI-d patients.
Another focus of the study is that whether it is necessary to analyze rs-fMRI signal in Slow 4 and Slow 5 frequency band besides the full frequency band. For the ALFF analysis in Slow 4, the differences were found in the right parahippocampal gyrus, the left IFG, the left precuneus and the right MFG; while the ALFF analysis in Slow 5 showed the left IFG, the right SFG, and the right angular gyrus. For the fALFF analysis in Slow 4, only the supramarginal gyrus was revealed; while the fALFF analysis in Slow 5 displayed the differences in the right insula and the left STG. From the ALFF results, it could be found that the Slow 4 results were just part of the full frequency results, but the Slow 5 results were largely different from the full frequency results [27]. It seems to draw a conclusion that ALFF analysis in Slow 5 frequency band may contain additional useful information in comparison to the full frequency band, which was also supported by the ROC results. So, it is recommended to conduct the ALFF analysis in Slow 5 (frequency band) in addition to full frequency. From the fALFF results, both the Slow 4 and Slow 5 results were significantly different from the full frequency results. Comparing with the abnormal regions from ALFF, fALFF only reported consistent regions in full frequency band. Therefore, at this moment, it is difficult to come to a decision on whether it is necessary to conduct the fALFF analysis in Slow 4 and Slow 5. The results suggested that the alterations of LFO amplitudes in specific brain regions in MCI-d patients could be more sensitively detected in the slow-5 in ALFF rather than the slow-4 bands. And this result is in line with a recent study about depression [28]. Together, our data suggest that there are significant differences between MCI and MCI-d patients in intrinsic brain activity, and the differences depend on the studied frequency bands of rs-fMRIdata.
Although fALFF was less sensitive to the physiological noise than ALFF, fALFF could not completely take the place of ALFF in fMRI studies. From our results (Table 4), it is not hard to find that ALFF displayed better discrimination performance than fALFF, and this phenomenon may reflect another aspect of fALFF: fALFF may also suppress the meaningful low frequency oscillations besides the physiological noise. Therefore, ALFF and fALFF are still recommended to be calculated together, and no one could replace the other one. Furthermore, the physiological significances of ALFF and fALFF are not confirmed as before, so it is not unacceptable that some discrepancies exist in ALFF and fALFFresults.
Differences in ALFF and fALFF between three groups
We observed that several brain regions in DMN were activated abnormally between MCI and MCI-d groups, including right supramarginal gyrus clusters from the fALFF Slow 4, left precuneus from the ALFF full frequency band and the ALFF Slow 4, left IFG (opercular part) from the ALFF Slow 5, right SFG from the ALFF Slow 5, the left parahippocampal gyrus from the ALFF full frequency band. This results of DMN were affected in MCI was in line with previous studies [12, 29–32]. The declines of episodic memory in MCI patients have been associated with the functional defects in the DMN regions, which might be caused by the underlying accumulations of amyloid-β plaques [33] and decreased metabolic activity [34]. Interestingly, among the results of different activated brain regions between MCI and MCI-d groups, right supramarginal gyrus and left precuneus were with increased ALFF and fALFF activity in the MCI-d patients than MCI patients. Nevertheless, left IFG (opercular part), right SFG, and the left parahippocampal gyrus showed decreased ALFF and fALFF activity in the MCI-d patients than MCI patients. Similar to previous study [12], our study, together with several recent studies using rs-fMRI [35, 36], suggested that in the MCI patients the DMN regions had reduced regional activity. Patients in MCI-d group, the existence of depressive symptoms might be due to the abnormal activation in specific regions. Functional and structural neuroimaging studies in subjects with AD and MCI have correlated the presence of depression with atrophy, hypoperfusion, and hypometabolism in the frontal cortex and anterior cingulate [36, 37]. Previous studies using rs-fMRI have showed that the depressive symptoms were associated with altered resting state functional connectivity in the prefrontal cortex [28, 38], orbitofrontal cortex [39], cingulate cortex [40, 41], hippocampus [42], and amygdala [41]. Atrophy in frontal cortex, orbitofrontal cortex, anterior cingulate cortex, posterior cingulate cortex, and inferior temporal cortex in AD patients may be associated with depression [41] and avoidance behaviors [43]. Thus, our results are consistent with previousstudies.
ROC analysis
Notably, ROC analysis revealed that the ALFF values in the left parahippocampal gyrus, the left precuneus and the left IFG could serve as a marker to effectively differentiate MCI and MCI-d groups. Abnormalities in these regions have been reported by previous fMRI studies in depression patients [38, 44]. Researchers found that parahippocampal gyrus was associated with depression [45] and depression questionnaires scales [46]. A recent study revealed the decreased resting-state functional connectivity in medial prefrontal cortical and parahippocampal gyrus in major depressive patients [47]. Parahippocampal gyrus was not only associated with the decreased of episodic memory [48] but also related to depression [45].
Previous studies suggested that a circuit involving the prefrontal cortex, amygdala, and related parts of the striatum, pallidum, and medial thalamus is involved in the functional neuroanatomy of depression [49]. Meanwhile, our findings were in line with some studies associated with depression [13, 50] and neuroimaging studies of depression have revealed neurophysiological abnormalities in prefrontal cortex [51, 52]. A recent study revealed that the depressed patients have higher activation in the IFG, SFG, superior parietal gyrus, and inferior temporal gyrus than the healthy controls, and indicated that the abnormal neural circuitry in depressed patients might provide neurobiological markers for depression [50]. A study using fMRI demonstrated increased response in right parahippocampal gyrus, left IFG, right subgenual cingulate, right striatum, and left brain stem with positive picture-caption pairs in treatment-resistant depression [53]. Collectively, the altered low-frequency fluctuations of the prefrontal cortex may be associated with the depression.
Previous studies showed depression has been considered as a potential clinical marker of preclinical AD [4] and that MCI accompanied by depression might increase the risk of conversion from MCI to AD [54]. In the current study, our data revealed that there were many regions appeared abnormalities in MCI and MCI-d groups simultaneously and were differ from HC group (Fig. 3). These brain regions may be the evidence of a possible shared pathophysiology between depression and MCI. These brain regions included the left IFG, the right MFG, the right parahippocampal gyrus, the right putamen, the left STG, and the right insula. This result was consistent with previous similar study [5]. A tensor-based morphometry study showed MCI with depressed subjects had more frontal, parietal, and temporal white matter atrophy than no-symptom subjects, and those whose depressive symptoms persisted over 2 years also had higher conversion to AD [5]. Nevertheless, there were some certain brain areas affected in MCI-d were AD-related pathology regions with cognitive impairment, including the left parahippocampal gyrus, the left precuneus, the left IFG, the right SFG and the right supermarginal gyrus (Table 4). These AD-related pathology regions affected in MCI-d might be the reason for the depression symptoms of MCI subjects increasing the risk of MCI conversion to AD dementia.
In the correlation analysis, our data revealed the precuneus, the parahippocampal gyrus and the insula displayed correlative relation with the AVLT-R score in the MCI and MCI-d groups. It has been reported that insular lobe was associated with depression and previous studies suggested that the affective network (limbic network) including the amygdala, orbitofrontal cortex, temporal cortex, pallidum, and insular cortex was participated in emotion regulation and processing [55, 56]. A recent study showed that increased ALFF and fALFF in the right dorsal anterior insular cortex in depressive patients and alterations of the cortico-limbic networks (the right dorsal anterior insula and right ventral anterior cingulate cortex), may play a critical role in the physiopathology of depression [57].
Further considerations
The following limitations of the present study should carefully require further considerations. One is that in this cross-sectional study, we did not investigate the conversion from MCI and MCI-d to AD, and MCI and MCI-d patients may have different disease progress into AD. We will focus on not only the different clinical symptoms and their different brain areas, but also the potential different consequences for MCI and MCI-d patients in the near future. The other is that it is still unclear that the mechanism of the differences and abnormalities in the patients of MCI-d and MCI. It is very important to investigate the mechanisms and physiological significance of LFOs in different frequency bands in the future studies. In further studies, we would like to combine the rs-fMRI, structural MRI and other biophysical data simultaneously with a larger sample, and would reveal structural and biological substrates underlying these functional deficits in MCI and MCI-d patients.
Conclusions
In this study, we found that several changes in special brain regions are associated with MCI and MCI-d patients, including bilateral parahippocampal gyrus, right putamen, right MFG, left precuneus, and left IFG (opercular part). Here, we provided evidence that the ALFF values in the full frequency band in the left parahippocampal gyrus and the left precuneus, Slow 5 value in ALFF in the left IFG, and Slow 4 value in ALFF in the left precuneus could effectively differentiate MCI-d from MCI patients might be served as markers to effectively differentiate MCI and MCI-d groups. Our data suggest that there are significant differences between MCI and MCI-d patients in intrinsic brain activity, and the differences depend on the studied frequency bands of rs-fMRI data. Moreover, the affective network and the DMN might be damaged simultaneously in MCI-d patients.
Footnotes
ACKNOWLEDGMENTS
This article was supported by the National Key Research and Development Program of China (No. 2016YFC1306300), National Natural Science Foundation of China (No. 31371007, 81430037, 61633018), Beijing Natural Science Foundation (No. 7161009, 7174282), Hundred, Thousand, and Ten Thousand Talents Project of Beijing (No. 2010-005), Beijing Municipal Science & Technology Commission (No. Z161100002616020), Fundamental and Clinical Cooperative Research Program of Capital Medical University (No. 16JL-L08, 15JL18), Beijing Municipal Science & Technology Commission (No. Z131100006813022), Health and Family Planning Commission of Shunyi District Beijing, CSA Key Laboratory of Behavioral Science, Institute of Psychology, Project of Science and Technology office of Hebei Province (No. 162777169).