
Abstract
Keywords
INTRODUCTION
Around 44 million people in the world suffer dementia [1]. The most prevalent cause of dementia is Alzheimer’s disease (AD) and according to family history can be divided into sporadic, familial, and autosomal dominant [2]. PSEN1 mutations are the most common cause of familial early onset AD. The PSEN1 E280A (E280A) mutation has an autosomal dominant inheritance and is involved in the production of amyloid-β [3]. The largest family group of carriers with E280A mutation live in Antioquia, Colombia. Carriers of this mutation develop mild cognitive impairment (MCI) at 44 years of age and dementia at 49 years of age [4, 5]. The study of mutation carriers provides an unique opportunity to identify biomarkers related to predisposition to the AD [6, 7].
The clinical observations and the neuropathological postmortem findings have been the basis for AD diagnosis, albeit the use of behavioral symptoms alone fails to identify patients that are in early stages of disease. Currently, at least eight measures, which include clinical scales, metabolic activity, and levels of brain chemicals related to amyloid or tau production, are accepted as probable biomarkers for AD [8]. In spite of the amount of biomarkers available for AD, the search for early brain changes is motivated by the opportunity to increase the efficacy of the therapies oriented to prevention [6].
Changes related to E280A mutation have been found using neuroimaging techniques. Magnetic resonance imaging (MRI) in mutation carriers has demonstrated preclinical changes in cerebral thickness and volume [9]. These differences have also been identified in regional brain activity using positron emission tomography (PET) [10], functional MRI (fMRI) [11, 12], and proton magnetic resonance spectroscopy [13]. A recent study in children between 9 and 17 years of age identified functional and structural brain changes and abnormal levels of plasma amyloid-β-1-42, constituting the earliest biomarkers associated with E280A mutation [14].
Functional changes in the brain have been also detected using electroencephalography (EEG) in E280A mutation. The advantages for using EEG as a diagnostic tool include its minimal invasiveness, easy storing and transportation, low cost, and better temporal resolution in relation to neuroimaging techniques [15]. Estimating intracranial sources of evoked related potentials (ERPs) during a semantic-matching task, an increase of the ERP generator strength in the left medial temporal lobe was found in the mutation carriers with respect to the non-carriers [16]. During a visual recognition memory test, young carriers showed lower ERP positivity in frontal regions and increased positivity in occipital regions compared to control subjects despite an identical behavioral performance [17]. Using a connectivity approach, the encoding of information has been also studied, finding an increase of connectivity in asymptomatic carriers in relation to controls [18, 19]. The visual short-term memory, which has been proposed as an early marker for AD, is related to reduction in electrical activity in fronto-central and parieto-occipital regions, in carriers at symptomatic stage [20]. The quantitative EEG analysis has also shown modification of spectral parameters in fronto-temporal regions [21].
For a group of young asymptomatic carriers of E280A mutation, the EEG acquired in resting condition showed a decrease, respect a control group, in power for Theta band and an increase in power for Alpha-2 band for different regions of interest across the scalp avoiding the study to analyze specific brain regions [22]. On the contrary, the main changes in resting EEG spectral power density for sporadic AD are: widespread increases of delta and theta rhythms and decreases of posterior alpha and/or beta rhythms [23, 24]. The lack of consistence between sporadic AD and asymptomatic E280A findings confirms the importance of spectral studies, particularly, in these frequency bands.
The possibility to infer the origin of neuronal activity from electrode locations are limited by the mixing process due to volume conduction effect. Independent component analysis (ICA) decomposes multichannel EEG into maximally independent processes related to brain activity or artifacts cancelling the mixing process and opening the possibility to infer the origin and modulation of EEG activity [25–27]. The basic ICA model is defined as: x = As, where the matrix s contains the independent components (ICs), activations, or sources, and A contains the mixing coefficients. Associated to the activation or sources is the scalp topography, or strength of projection of the source to the scalp, that are obtained as the columns of the A. The source signals can be recovered as ICs as Wx = s, where W = A-1 works as a spatial filter. Although the traditional approach to brain mapping using EEG is based in the solution of the inverse problem over the raw EEG data [28, 29], the approach could be guided using the scalp topographies obtained by ICA [26].
However, the decompositions obtained using ICA are not directly comparable between subjects; this is the reason why strategies like group ICA (gICA) have been proposed [30]. For gICA, the channels of the recordings from the different subjects are concatenated implying a common mixing matrix: (x1, x2,. . . , x r ) = A (s1, s2,. . , s r ). After finding the common mixing matrix A, the activations from the different subjects are estimated as Wx i = s i , with W = A-1, enabling the comparison of activations from different subjects using the same spatial filters.
A first application in EEG of the gICA approach is given by the work of Marco-Pallares et al. [31], where the brain sources related to the mismatch negativity ERP are found in two step: 1) gICA decomposition and 2) inverse solution of the topography maps related to the ICs. The authors found six components related to the ERP and show how the neuronal sources found using gICA can also be found applying ICA to each subject. A study of the “resting state networks”, obtained by EEG during eyes closed and eyes open, was done by Chen et al. [32], finding connectivity patterns between thirteen neuronal sources comparable with those found by fMRI. The analysis was based in gICA, to extract the neuronal sources related to resting state, and inverse solution methods to locate the neuronal sources in the brain cortex. The concatenation of subject data for gICA analysis has been applied to study MCI [33], AD [34], and attention-deficit hyperactivity disorder [35].
Linking results from EEG to brain regions complements the findings from other neuroimaging techniques and enable the tracking of specific brain regions failures. The objective of current work is twofold: i) to localize brain regions that are related to previously reported differences for Theta and Alpha-2 in E280A carriers [22]; and ii) to evaluate the relation between those differences and the neurodegenerative process. With respect to the first objective, a combination of ICA [30] and inverse solution methods was used [36]. The second objective led to the study of the correlation between neurophysiological measures, age, and a composite cognitive scale with high sensitivity for the tracking of E280Asubjects [37].
The decomposition of the EEG data using ICA showed a source mainly related to the Precuneus region with significant differences for the Theta and Alpha-2 bands. Using the ratio between Theta and Alpha-2 powers, significant correlations were found with a composite cognitive scale and age. In addition, given that different regions of the Precuneus have prominent activity during resting state and belong to so-called dorsal and ventral Default Mode Network (DMN) [38], as an cross-validation approach, these differences were also investigated using the signals obtained from Precuneus regions of interest (ROIs) of DMN through an inverse solution method. The current results point to an interaction between the Theta and Alpha-2 bands being its ratio a promising index to track the progress of symptoms in E280A mutation carriers.
MATERIALS AND METHODS
Participants
All participants were members of the E280A mutation Colombian kindred. We selected 22 asymptomatic carriers (ACr), 18 healthy non-carriers (Ctrl-1), 20 symptomatic carriers (SCr), and 17 healthy non-carriers (Ctrl-2). Given that the increase in age implies the onset of measurable cognitive symptoms in E280A mutation carriers, we separated the healthy non-carriers to match for gender, age, and educational level with ACr and SCr, always comparing the carriers with its respective control group. Thirty of these asymptomatic subjects, the same number of carriers and non-carriers, participated previously in a connectivity analysis using transfer entropy [19] and in a quantitative EEG study using signals from scalp channels [22].
Participants were studied under guidelines approved by local institutional review boards. Informed consent was obtained from participants, or their legal representatives, or both, according to a general protocol approved by the Human Subjects Committee of the Sede de Investigación Universitaria of Universidad de Antioquia, Medellin, Colombia. Participants’ genetic status was masked to the investigators who acquired all data. The exclusion criteria were severe physical illness, psychiatric or neurological disorders associated with potential cognitive dysfunction, and other dementia conditions. Subjects with alcohol or drug abuse, and under regular treatment with neuroleptics or antidepressants with anticholinergic action were also excluded. Table 1 summarizes the demographic and clinical information of the subjects. Comparison between groups for each of the variables is also presented (significance set to 5%).
Demographic, educational level, and MMSE data for controls and carriers
ns = Not significant.
Inclusion criteria
The following inclusion criteria were defined for each group:
Clinical assessments and cognitive scales
All subjects underwent comprehensive neuropsychological and clinical assessments. Neurological examination and clinical history revision was performed by a neurologist or a physician trained in dementia assessment. Neuropsychological protocol included the MMSE and the Consortium to Establish a Registry for Alzheimer’s Disease (CERAD) battery adapted to Colombian population [39].
A cognitive composite test, with high sensitivity for the tracking of E280A subjects, was used for the correlation analysis with the neurophysiological measures [37]. The composite test used is the average of the scores from the following subtests: Abstract Reasoning (Ravens Progressive Matrices), Orientation (MMSE Orientation to Time), Language (CERAD Boston Naming Test), Memory (CERAD Word list Recall), and Praxis (CERAD Constructional Praxis).
EEG recordings and preprocessing
A Neuroscan amplifier was used to record EEG (Neuroscan Medical System, Neurosoft Inc. Sterling, VA, USA). Recordings were obtained while the subjects remained comfortably sat, resting with eyes closed during 5 min. EEG data were recorded from 64 electrodes ([0.1, 200] Hz bandpass) with midline reference and sampling rate of 1000 Hz. The electrodes were positioned according to the international 10–10 system with a simultaneous electrooculogram recording (0.1–100 Hz bandpass). All the recordings were obtained in the second semester of 2012 in a shielded room.
The preprocessing approach used improves the test-retest reliability [40] and includes power line interference removal, detection, and interpolation of noisy channels, and computing of a robust average reference, using the PREP pipeline [41]. For each subject, a maximum of 5% of the channels were replaced by interpolation. EEG signals were limited to the [1, 50] Hz frequency band using the eegfiltnew function of EEGLAB version 13 [42] with default settings, segmented in epochs of 2 s and resampled to 128 Hz. The resulting data were corrected using the wavelet ICA that diminishes the effect of ocular activity [43]. For the subsequent analysis, 50 epochs, free of artifacts, were used for each subject.
EEG cortical analysis
The main steps for cortical analysis are summarized in Fig. 1. The cortical analysis started with the use of a gICA algorithm [30] to detect neuronal sources comparable between asymptomatic subjects. For the gICA decomposition, the first fifty epochs from each asymptomatic subject (ACr and Ctrl-1) were used, accounting for a total of 2000 epochs (Fig. 1a). The number of estimated ICs, or possible neuronal sources, was obtained using the minimum description length (MDL) according to the definition given by Li et al. [44] (Fig. 1b). Whitening, using PCA, was used for data dimensionality reduction (Fig. 1c). The decomposition algorithm was the FourierICA [45] in the [1, 30] Hz frequency band. Thirty runs of the gICA algorithm were performed to validate the reliability of the decompositions using the ICASSO routines [46], which were adapted to be use with FourierICA (Fig. 1d). The obtained spatial filters W were applied to all the subjects, asymptomatic and symptomatic, to extract the source signal, where the recorded EEG signal from each subject x i is used to recover the individual source signals as Wx i = s i , previous to IC comparisons(Fig. 1g).

Steps followed for cortical analysis.
The objectives of gICA analysis were: i) not to use previous assumptions about EEG source generation or regions of analysis, ii) to reduce the dimension of the data because the analysis of all possible voxels through inverse solutions leads to many comparisons which can hide significant effects, and iii) to obtain reliable sources that could guide the inverse solution analysis.
The cortical signal reconstruction was divided in two steps: i) localization in the cortex, using the exact LORETA (eLORETA) [47, 48], of the scalp topographies obtained by gICA (Fig. 1e), ii) the estimation of the signal in the cortex using the EEG for each subject, through the weighted Minimum Norm Estimation (wMNE) implementation included in eConnectome [49], using personalized ROIs according to the brain localization from the previous step (Fig. 1f). The standard Boundary Element Method included in each software was used. The eLORETA and wMNE were considered in order to use the strong functionalities from each one: improved localization and availability of visualization tools for eLORETA software and flexibility for the construction of ROIs for eConnectome through homemadescripts.
The signals obtained using gICA and wMNE were analyzed using the multitaper spectral estimation, included in the Chronux software [50, 51], in the range [1, 30] Hz. Relative power was obtained for the bands of interest: Theta [4, 8] Hz and Alpha-2 [10, 13] according the findings at asymptomatic stage given by Duque et al. [22].
Statistical analysis
The t-test for paired observations was used to perform comparisons using the routine developed by Glerean et al. [52] where the null distribution is obtained by permutations (10.000 permutations). The p-values were corrected using the false discovery rate (FDR), through the Benjamini and Hochberg linear-step up procedure, when there are multiple comparisons problems. Additionally, the effect size was computed, using the Matlab toolbox provided by Hentschke and Stüttgen [53], in different comparisons. For correlation analysis between clinical scales and neurophysiology, the Spearman rank order correlation was used.
Furthermore, receiver operating characteristic (ROC) curve analysis was also used to compare the accuracy of the EEG measures to discriminate carriers of controls. The numeric value of area under the ROC curve (AUC) was computed with the trapezoidal rule. The 95% confidence interval (CI) was computed with 2000 stratified bootstrap replicates. Both values, AUC and CI, were calculated in R using the library pROC [54].
RESULTS
Group independent component analysis results
After concatenating the epochs of the asymptomatic subjects, the MDL criteria provided a dimension of eight for the data. Thus, using the gICA algorithm eight stable components were obtained accounting for the 91% of variance in data. Figure 2 shows the scalp projection for the different components and the cluster quality Index (Iq) given by the ICASSO. The values obtained, which were close to the maximum value of 1, indicated that the components had great reliability and were obtained in each one of the thirty runs of the gICAalgorithm.
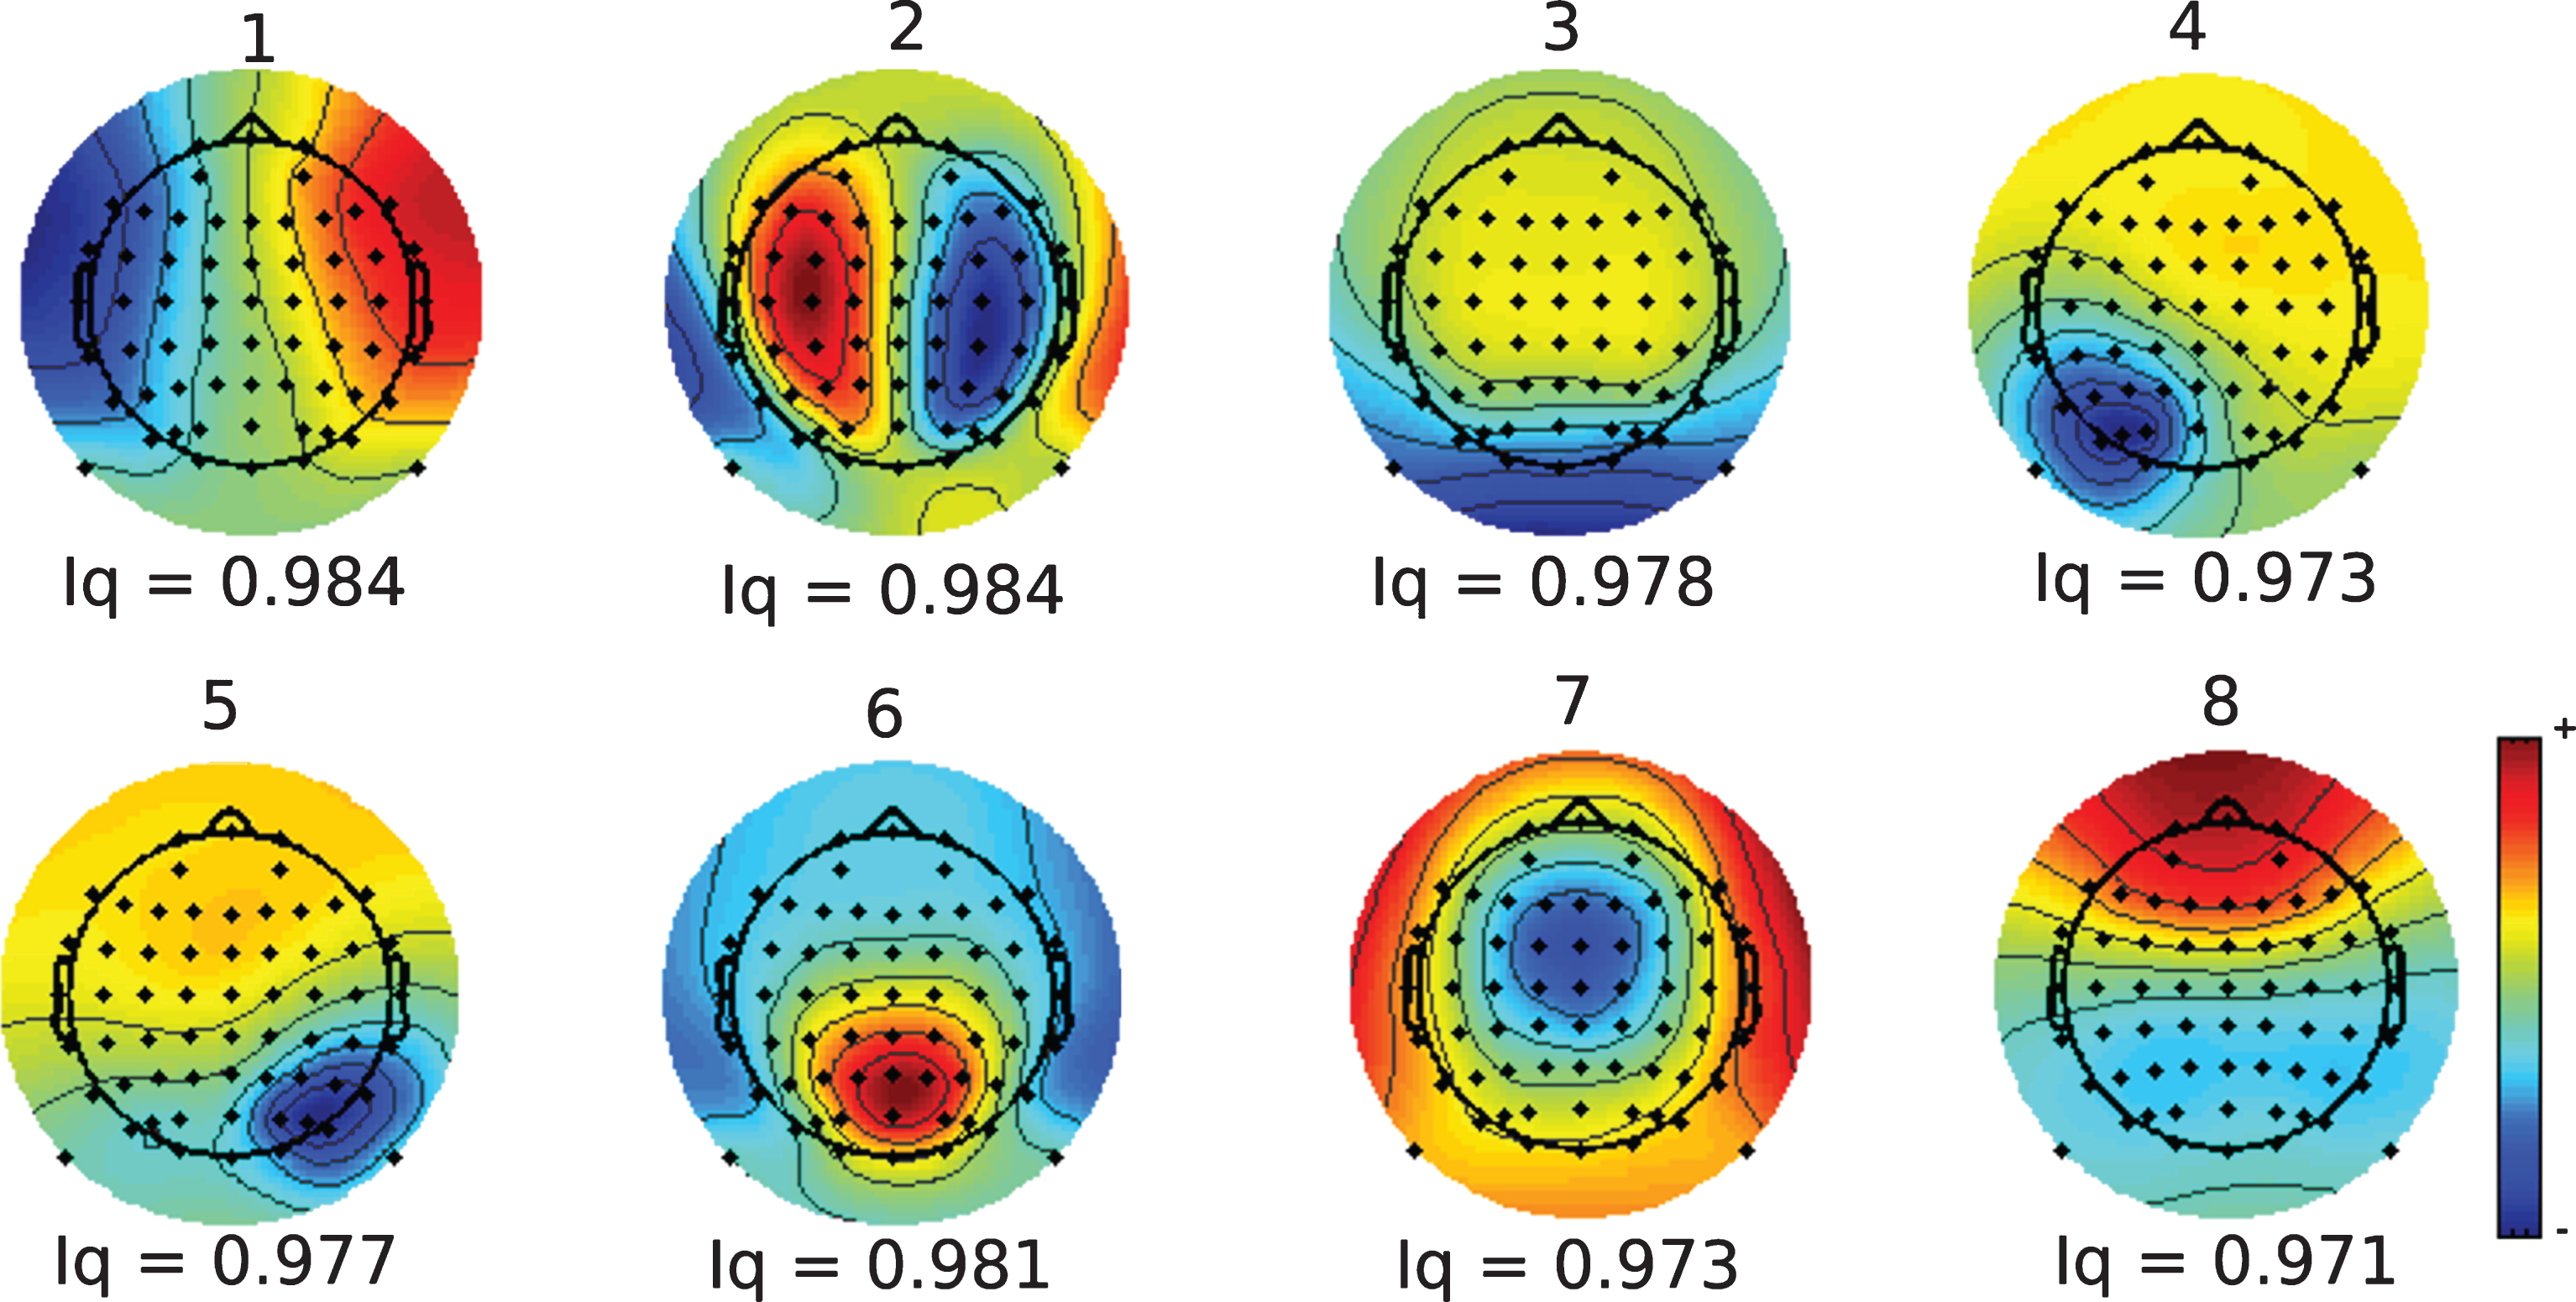
Topography and cluster quality Index (Iq) of the ICs obtained after the gICA analysis.
Table 2 shows the results of comparison of Theta and Alpha-2 powers between groups for each component, where a probability value lower than 5%, FDR corrected, was defined as significant. At the asymptomatic stage, five of eight components show differences in the Theta band, but only two of them show differences in the Alpha-2 band. The effect size shows in all cases a power at Theta band higher for Ctrl-1 and at Alpha-2 band higher for ACr. At symptomatic stage, seven of eight components are different for the Theta band and five in Alpha-2. Contrary to asymptomatic stage, the size effect indicates a Theta band higher for SCr and an Alpha-2 band higher for Ctrl-2.
Results for the Theta and Alpha-2 band for the different ICs obtained after the gICA analysis. The p-values are FDR corrected. SE, size effect; CI, Confidence Interval for Size Effect. The SE was calculated so that a positive value indicates that the carriers have higher values than the non-carriers, a negative value indicates that the carriers have lower values than the non-carriers
Those results indicate a spread of the dysfunctions across the cortex. Two of the identified components were dysfunctional from the asymptomatic stage to the symptomatic stage, for the Theta and Alpha-2 band with significant differences in all cases, with a paradoxical change in the direction of the effect. Given that those two components, the third (IC-3) and the sixth (IC-6), have differences at the two stages and have the higher effect size, the following analysis will be based on the information from these two components.
Cortex representation for IC using inverse solution methods
According to the eLORETA software, for the IC-3 and IC-6 the region that included the highest number of voxels was the Precuneus (Fig. 3), constituting the 50% of the total of the voxels from the two components. The other 50% of the voxels were related to many parieto-occipital structures: 10% in the posterior cingulate, 9% in the cuneus, and the remaining 31% divided between different gyrus with percentages below 5% of the total voxels. Given that the main part of the voxels were from Precuneus, and the remaining were scattered across the posterior brain, the differences between groups were calculated using an average of the signals obtained from the Precuneus voxels contained in the DMN (Fig. 4) [38]. Table 3 shows the differences for Theta,Alpha-2, and Theta/Alpha-2 index, obtained as the average from the four ROIs of Precuneus at the DMN. The results are coherent with those obtained with gICA (Table 2) in direction and magnitude of effect.
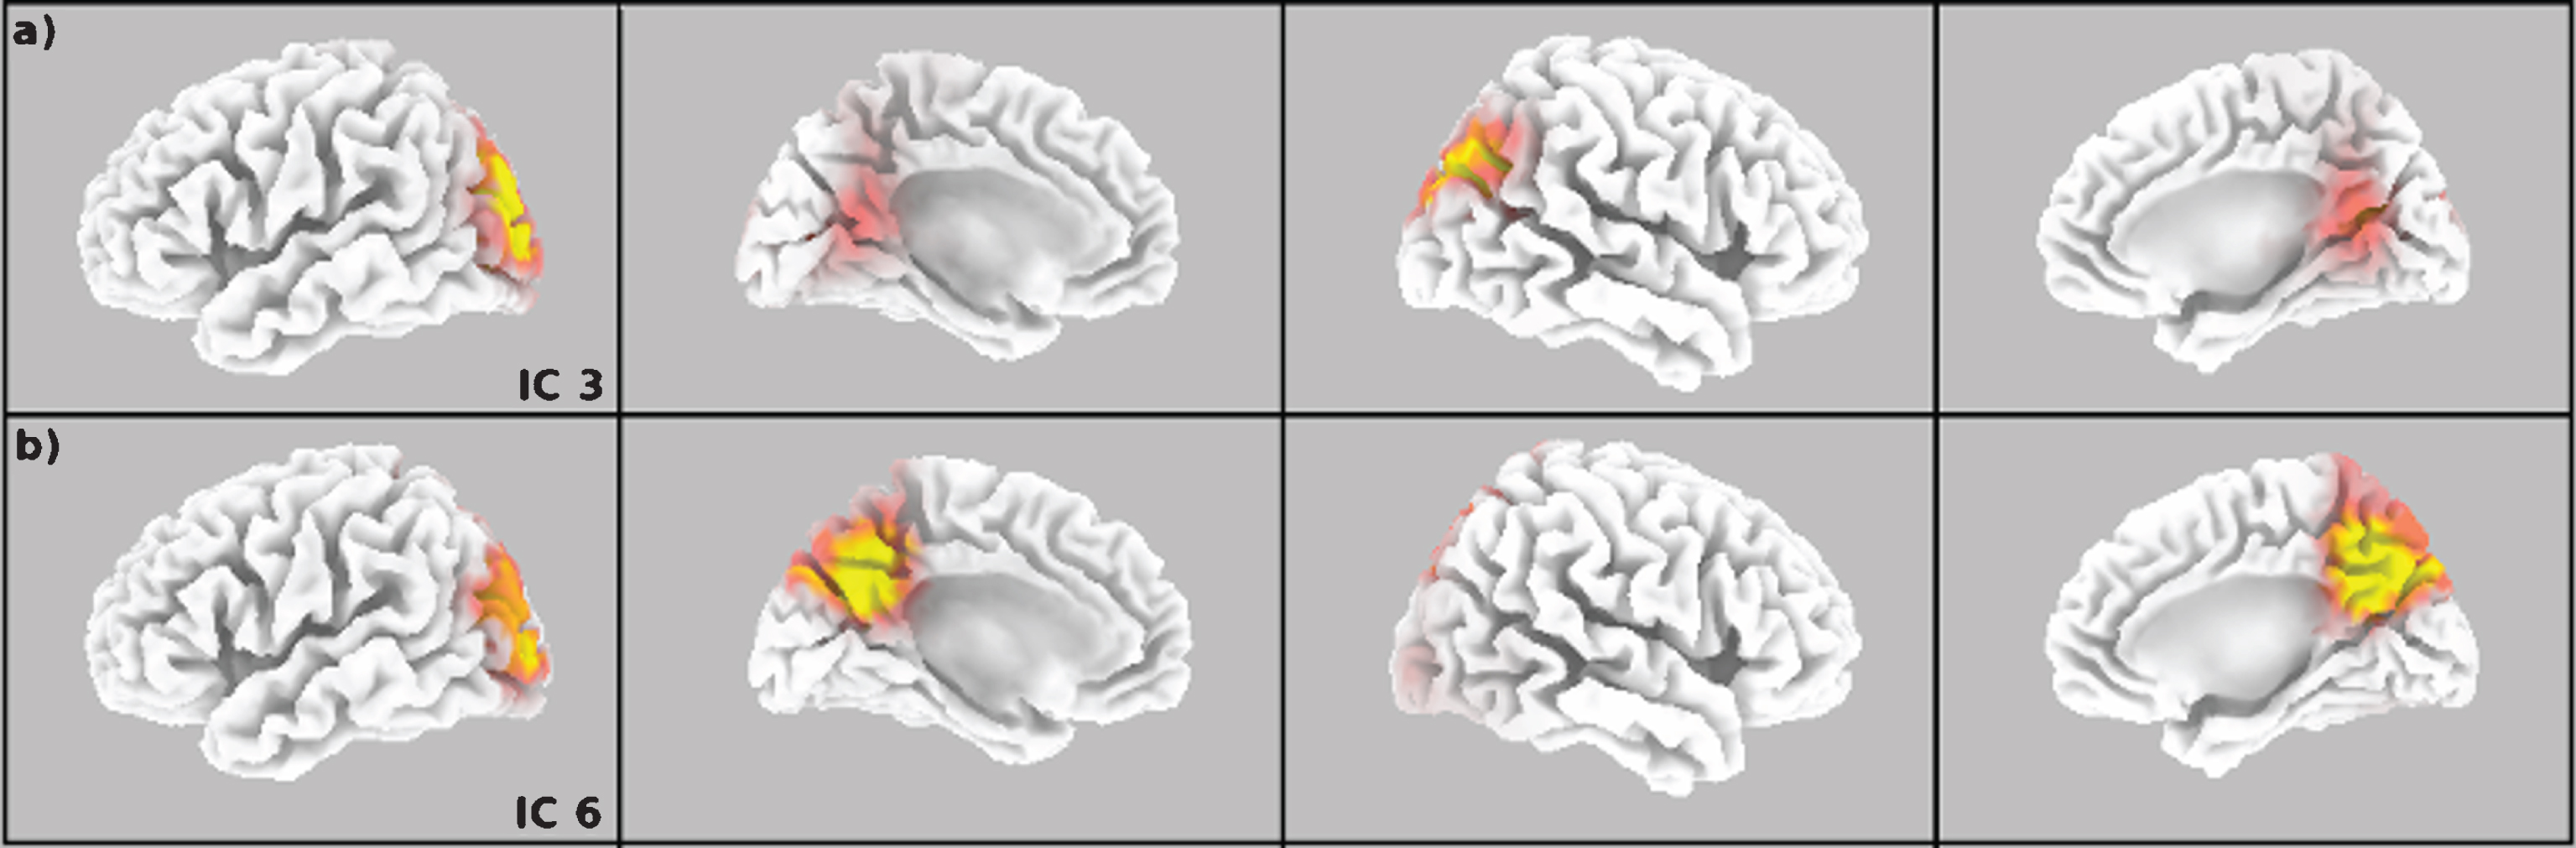
Cortex projection of the topography for the IC-3 (a) and IC-6 (b).

DMN ROIs used for analysis [38]. The zones in green belong to the ventral DMN (v1, v5, and v6). The zones in red belong to the dorsal DMN (d4).
Differences between groups estimated using the signal from the Precuneus. SE, size effect; CI, confidence interval for size effect. The SE was calculated so that a positive value indicates that the carriers have higher values than the non-carriers, a negative value indicates that the carriers have lower values than the non-carriers
Relation of the Theta/Alpha-2 index with age and cognitive scales in E280A mutation
There was an inversion in the direction of the effect for the analyzed frequency bands (Fig. 5, Tables 2, 3): Theta power seemed to increase from asymptomatic to symptomatic compared to controls, while Alpha-2 power seemed to go in the inverse direction. Consequently, the ratio between Theta and Alpha-2 powers was selected as an index to track the changes across the E280A population. For signals obtained from the Precuneus, using the wMNE method, Fig. 6a shows how the Theta/Alpha-2 index increased with age for carriers, and how the same index remained stable for non-carriers (Fig. 6b). Table 4 shows the relation between the Theta/Alpha-2 index, the age, and the composite test [37] for the signal obtained from Precuneus using wMNE, and from IC-3 and IC-6 using gICA. There was a strong relationship between the Theta/Alpha-2 ratio, age, and cognitive scales in E280A carriers, relation that did not exists for non-carrier subjects.

Theta and Alpha-2 in carriers and non-carriers of E280A mutation.
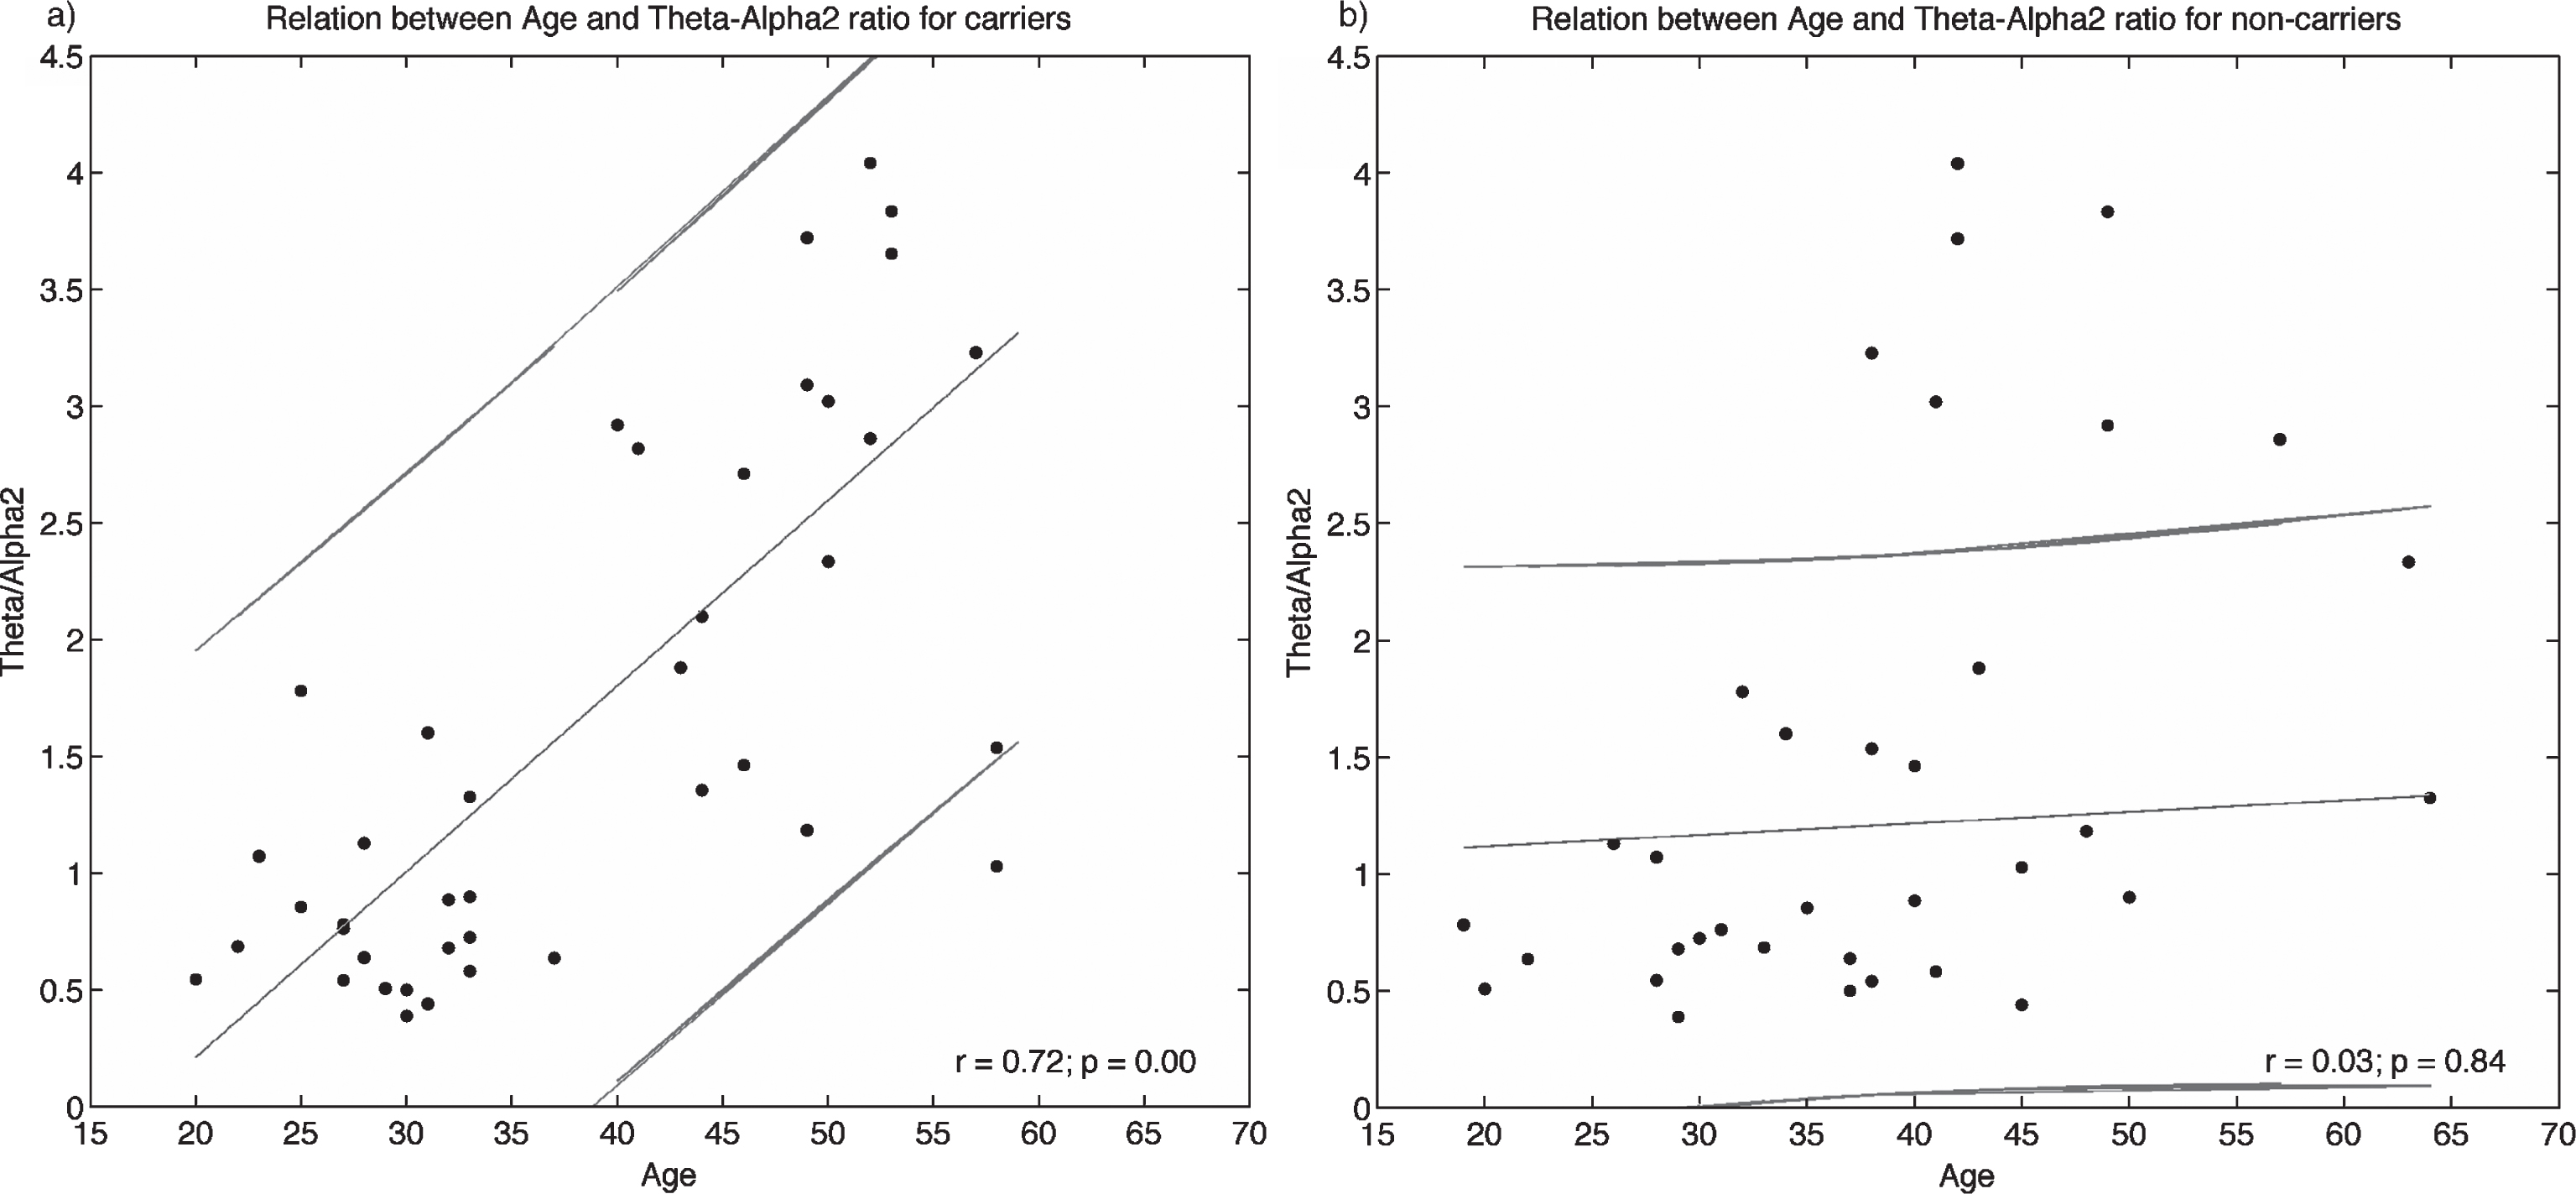
Relation between the Theta/Alpha-2 index at Precuneus and age in carriers and non-carriers of E280A mutation.
Relation between Theta/Alpha-2 index, age and cognitive scale for carriers and non-carriers subjects. r, Pearson’s correlation index; p, p-value
Specificity and sensitivity for the Theta/Alpha-2 index
Using an average of Theta/Alpha2 index, from the IC-3 and IC-6 signals, an AUC of 0.75 (confidence interval = (0.60, 0.91), sensitivity = 72%, specificity = 82%) was found in the classification of ACr and Ctrl-1, and an AUC of 0.89 (confidence interval = (0.77, 1), sensitivity = 82%, specificity = 90%) in the classification of SCr and Ctrl-2. On the other hand, using the Theta/Alpha2 index from Precuneus signals obtained through inverse solution, an AUC of 0.76 (confidence interval = (0.60, 0.91), sensitivity = 72%, specificity = 77%) was found in the classification of ACr and Ctrl-1, and an AUC of 0.89 (confidence interval = (0.78, 0.99), sensitivity = 76%, specificity = 90%) in the classification of SCr and Ctrl-2.
DISCUSSION
During healthy aging a marked decrease of the Alpha band is expected with topographic differences for Alpha-1 (8–10.5 Hz) and Alpha-2 (10.5–13 Hz) [55]. On the other hand, increases in Theta rhythms have been shown in healthy subjects who had only subjective complaints at baseline and showed deterioration during 7–9 years follow-up according the GDS [56]. Our results expand previous findings at channel level [22], confirm the relevance of the Theta band in neurodegenerative process and the functional differences between Alpha-1 and Alpha-2 rhythms. Previous findings in sporadic AD helped to speculate that posterior Delta/Theta increase of power density and Alpha power density decrease, duringeyes-closed resting-state, reflect the neurodegenerative processes along the time course of the disease [23], that in the case of the Theta and Alpha rhythms could be due to failures to the thalamocortical circuitry [57]. Our results confirm the possibility of tracking the changes from asymptomatic to symptomatic in E280A mutation carriers in a posterior region of brain, as is the Precuneus. As correlation of the neurodegenerative process, we obtained significant relationships between the increase of Theta/Alpha-2 and age, and an inverse relationship between this same index and cognitive scales in carriers, whereas these relationships do not exist in non-carriers.
We already know that the course from asymptomatic to AD is non-linear [58]. Our findings in asymptomatic carriers point to an inversion of the expected magnitude of the Theta and Alpha power in relation to the pattern reported in AD. Given the recent findings in children carriers of E280A mutation [14], it is possible that the EEG differences also begin early, following a pattern different from reported of symptomatic subjects, characterized by a slowing of EEG pattern, because the carriers remain cognitive intact until the fourth decade of life maybe using compensative mechanisms.
Differences in Theta and Alpha bands have been reported between sporadic MCI and AD, suggesting a possible continuum from normal aging to MCI to AD [59], and similar differences between subjects with subjective memory complaints and with amnesic MCI [60]. Those differences are comparable with the differences reported for symptomatic subjects in the current study. The differences for MCI and AD patients seems to be more related to gray matter alterations [61] and hippocampal volume [62] than to white matter pathology [63], implying that changes in Theta and Alpha rhythms are not an epiphenomena and are directly related to the neurodegenerativeprocess. Different to the Alpha2 results reported in this work, the Alpha1 band shows statistical differences in all these previous studies [59–63], something that might be due to the approach for signal normalization used in the reviewed studies [59–63], where the LORETA current density at each voxel was normalized by the LORETA power density averaged across all frequencies and across all 2394 voxels, or the difference in age between sporadic, which is the type of AD or MCI used in the reviewed studies [59–63], and familial AD that is the used in the current study.
Other familial forms of AD, different to the E280A pedigree, have been studied using EEG. Golob et al. [64] reported differences in ERP acquired during a target detection task in asymptomatic carriers of the PSEN1 mutation (A431E substitution = 14, L235 V substitution = 5) and APP mutation (V717I substitution). The CLU genotype, which is related to risk for AD, exerts a significant effect on Alpha absolute power in resting state for asymptomatic subjects [65]. The homozygous presence of the AD risk variant CLU CC in asymptomatic subjects is associated with an increase of Alpha-3 (11–13 Hz) and Alpha-1 (7.5–9 Hz) power. The Alpha-3, which is close to our Alpha-2, is also higher in young subjects and lower in old subjects [65]. The Apolipoprotein E (ApoE) ɛ4 allele is the greatest genetic susceptibility factor for AD and has been studied in carriers with AD and MCI using EEG [66–70]; anomalies for Alpha and Theta band at resting state related to slowing of EEG have also been reported [71, 72]. To our knowledge, only one study has used EEG in subjects within a wide range of age (18–56 years), including young asymptomatic carriers [65]. The study reported a significant effect between age and ERP, related to an olfactory task, for ApoE ɛ4 carriers, opening the possibility of finding significant effects over the EEG in asymptomatic APOE ɛ4 carriers.
Different to the approach using ERP tasks in PSEN1 mutation carriers [16–18, 64], the resting paradigm diminishes the confounding error due to the performance in symptomatic subjects and it is suitable for clinical trials in AD [73]. Different works using resting EEG have reported differences in E280A mutation carriers when compared against non-carriers. Thirty of the asymptomatic subjects included in the current study participated in a previous analysis where differences in Theta and Alpha-2 band at resting state were identified [22]. The quantitative EEG analysis was used also to classify asymptomatic and symptomatic carriers, using an statistic known as the Mahalanobis distance (D2), finding discriminative spectral parameters especially for the D2 related to beta band [21].
A couple of studies have analyzed the classification value of EEG metrics in E280A mutation carriers in asymptomatic state. Rodriguez et al. [21] with recordings in resting state found an AUC of 0.86 in the accuracy to discriminate asymptomatic carriers from controls using data from the Alpha or Theta band. We obtained a lower AUC value (0.75), however, our asymptomatic carriers were younger; our group has a mean age of 29.2 years whereas Rodriguez’s group has a mean age of 39.9 years. Quiroz et al. [17] also took asymptomatic carriers but with ERP recordings finding a sensitivity of 72.7% and specificity 81.8% to discriminate asymptomatic carriers from controls, which is similar to the sensitivity (72%) and specificity (82%) obtained in the current study. They used a task-based experiment during the recordings [17]. In the asymptomatic condition, it would not be difficult for the patients to participate in the task, but in patients with symptoms of dementia, the execution performance could have a confounding effect. Comparing the accuracy to discriminate E280A symptomatic carriers from healthy people, only Rodriguez had presented results with an AUC of 0.98 using data from the Alpha or Theta band. Our results, sensitivity = 76%, specificity = 90% and AUC = 0.9, seem to be close to the current finding in classification in AD using EEG source markers [74]: sensitivity = 73%, specificity = 78%, and AUC = 0.8; or even using a scalp Alpha/Theta ratio [75]: sensitivity = 76%, specificity = 85%, and AUC = 0.9. It is important to highlight that the symptomatic subjects, 15 of them, were mainly in the MCI stage and the remaining in mild dementia.
The main differences in relation to the work of Rodriguez et al. [21] are related to the beta band. Differences in the methodology of Rodriguez and the current study may help to explain the differences in the results: our asymptomatic subjects are around 10 years younger, they use an unique control group to compare with asymptomatic and symptomatic subjects, Rodriguez uses an unique Alpha band and a narrow Beta ((12.5–19.1] Hz) band, and the statistics were based on a transformation of the data using z standardized statistic, where the MMSE and age are introduced as covariates, and Mahalanobis distance (D2). Although we focused on Theta and Alpha-2 bands, our analysis in different frequency bands did not show significant differences at the asymptomatic stage. We obtained differences in the Delta ([1, 4] Hz) and Beta ([13, 30] Hz) bands, but only for symptomatic subjects (Supplementary Table 1). The Gamma band, which comprises [30, 50] Hz, was not evaluated given the confounding effects of the muscle artifacts [73].
The use of ICA in EEG has evolved from a technique oriented to help in artifact detection and correction [76, 77] to identify neural process and biomarkers [27, 79]. Using recordings obtained at rest in 144 subjects, Congedo et al. [80] reported seven sources distributed across the cortex, where three of them were also related to the Precuneus, that would serve to assessment and diagnosis of abnormal brain functioning. In our case, gICA helps to link differences between asymptomatic subjects at scalp level [22] and brain cortex, showing a region that can be reliably measured using inverse solution methods. Although we used the wMNE method included in eConnectome as cross-validation method, it is possible that the differences can also be found using the LORETA Software and the Precuneus as ROI.
Similar to the approach given by Congedo et al. [80], we obtained the spatial filters using young asymptomatic subjects. The differences between groups using the spatial filters obtained by gICA were validated by the positive results comparing SCr and Ctrl-2, which were not included in the gICA analysis, and were also confirmed by the wMNE results, that in our case served also as cross-validation results. A similar approach has been used in attention-deficit hyperactivity disorder adults including a higher number of subjects in the gICA algorithm, 177 for eyes-closed resting condition, and reporting that the spectral power of EEG activity isolated by inverse solution methods or gICA might be a suitable marker for discrimination between healthy adults and attention-deficit hyperactivity disorder [35].
Some approximations to validate the gICA approach have been proposed using synthetic and real EEG data. The performance of gICA over temporal or spatial concatenation was evaluated by Huster et al. [81] using different ICA decomposition algorithms; unfortunately none of them were in frequency domain that was the approach used in the current work. A recent work by Lio and Boulinguez [82] found that the approach is insensitive to inter-individual differences of neuroanatomy; rather the spatial filters are optimized to the population of analysis. For the study, the author used simulated EEG, varying the source location over the Population-average, Landmark and Surface-based (PALS) atlas [83]. Being that the gICA analysis based in ICA, a learning algorithm guided by the data, it is not possible to establish which is the lower amount of data needed to obtain the same spatial filters, something that might imply that the gICA approach leads to results dependent from the subjects. In the current work, we obtain eight reliable spatial filters, according the ICASSO criterion, but maybe a higher number of reliable components could be found at resting state exploring higher orders than those given by MDL criterion, or the filters could be improved using a higher number of subjects.
Our analyses were centered in one specific brain region: the Precuneus. This region was chosen because it involved the highest number of voxels after the eLORETA analysis. The Precuneus has been reported as a highly connected brain region [84, 85] and highly active region [86], where the connectivity and the energy consumption are both related to amyloid-β deposition [87, 88]. The Precuneus has been also reported altered in previous works using E280A carriers: There was a lower deactivation in children and in young carriers compared with non-carriers during the encoding of information [14, 89]; FDG-PET was altered around the 29 years in carriers [90]; Florbetapir (18F) was detectable 16 years before the MCI symptoms [10]; Cortical thickness was diminished in adults asymptomatic carriers [9]; A biomarker based in magnetic resonance spectroscopy was also centered in the Precuneus [13]; Lower current source density has been detected during semantic processing [16]; and Increased connectivity was found during the encoding of visual information [19].
Our results are not only in agreement with previous results in E280A carriers, but also in concordance with those findings reporting the posterior regions of the DMN as the first regions with altered activity previous to the clinical symptoms [58].
The strengths of our work are related to the use of economic techniques, in comparison to neuroimaging approaches like PET or fMRI, in a very homogeneous population with a single-gene mutation for early-onset AD. The statistical power reached in the comparisons, and the concordance with previous findings of alterations of Theta and Alpha bands in asymptomatic carriers and sporadic AD show consistent results. To our knowledge this is the study with the highest number of E280A carriers analyzed, and the purpose was to evaluate the AD even in those early years where clinical symptoms have not appeared yet. Finally, the ratio between powers of Theta and Alpha-2 bands measured in the Precuneus region has been presented as a promising index to track the progress of neurophysiological changes in mutation carriers.
Footnotes
ACKNOWLEDGMENTS
This work was supported by Vicerrectoría de Investigación of Universidad de Antioquia (CODI), Projects “Identificación de marcadores preclínicos de la mutación E280A de la enfermedad de Alzheimer a partir de medidas de conectividad en EEG”, code PRG14-1-02, by “Sistema de Entrenamiento en Neurocirugía”, code MDC-10-1-6, by Departamento Administrativo de Ciencia, Tecnología e Innovación (Colciencias) for the financial support to the Project “Marcadores neurofisiológicos del inicio de la disfunción cerebral en la etapa pre-clínica de la enfermedad de Alzheimer” identified with the code 1115-519-29028, and by the Spanish Ministry of Economy and Competitiveness - Spain (project DPI2014-59049-R) and the BBVA Foundation Grant for Researchers and Cultural Creators 2016.