
Abstract
The topic of gut microbiota is currently attracting considerable interest as a potential factor in Alzheimer’s disease (AD). However, the extent and time course of alterations in the gut microbiota, and their effects on AD pathology remain uncertain. Herein, we compared the fecal microbiomes and fecal short chain fatty acid composition (SCFAs) between wild-type and AD model mice at different ages under strictly controlled specific pathogen free conditions, and also conducted microscopic investigations of intestinal structures. Our results showed that the microbiota composition and diversity were perturbed and the level of SCFAs was reduced in AD mice, predicting alterations in more than 30 metabolic pathways, which may be associated with amyloid deposition and ultrastructural abnormalities in AD mouse intestine. These findings indicate that AD pathology might not only affect brain function directly, but also exacerbate cognitive deficits through reducing the level of SCFAs via alterations of gut microbiota induced by intestinal amyloid deposition. Our data may support a role of gut microbiota, and suggest a novel route for therapeutic intervention in AD.
INTRODUCTION
Alzheimer’s disease (AD) is the most common form of neurodegenerative disease among older individuals, manifesting not only in cognitive impairment but also psychiatric symptoms such as depression and anxiety. The hallmark pathologies of AD are accumulation of the protein amyloid-β (Aβ) outside neurons together with tau protein tangles within cortical neurons, but certain aspects of AD symptoms may reflect systemic aspects of the disease, such as amyloid deposition in extracerebral structures as well as cerebrovascular changes. Despite much progress in recent years, the comprehensive pathogenesis of AD remains to be elucidated, and so far, no effective treatment has been developed. The existing evidences indicate that many factors, such as aging, inflammation, obesity, and insulin resistance, are risk factors for AD [1].
The past decade has seen the emergence of an understanding that the microbiome, notably the intestinal microbiota, is a factor influencing human health and disease, being implicated in neuropsychiatric disorders such as depression, autism, and neurodegeneration through effects on the gut-brain axis [2 –8]. For example, alterations in gut microbiota are now documented in Parkinson’s disease (PD). The deposition of α-synuclein, an underlying molecular pathology for nigrostriatal degeneration, has been found in enteric neurons in the early phases of PD, with consequences for gut motility. Moreover, the gut mucosa of parkinsonian patients shows increased permeability, signs of inflammation and invasion of coliform bacteria [9], and hosts an aberrant gut microbiota composition [10]. Recently, using mice that overexpress α-synuclein, Sampson and colleague reported that gut microbiota are required for full expression of motor deficits, microglia activation, and α-synuclein pathology in the brain of mice overexpressing α-synuclein, thus implicating gut microbiome as a risk factor for idiopathic PD [11].
In the context of AD, many converging lines of evidence suggest that the cognitive impairment in AD is likewise associated with perturbation of the normal gut microbiota [4 , 13]. Alterations of the gut microbiome might increase intestinal permeability, induce pro-inflammatory responses, and favor the development of insulin resistance, which has also been associated with risk for AD. Additionally, an expanding list of bacteria including gram-negative species of Bacillus, Pseudomonas, Staphylococcus, Streptomyces, and others, can be the sources of amyloid deposits [14 –16]. Bacterial amyloids might activate signaling pathways known to play a role in neurodegeneration and AD pathogenesis, while the gut microbiome might enhance inflammatory responses to cerebral accumulation of Aβ. Furthermore, some gut microbiota can secrete lipopolysaccharides (LPSs) and other proinflammatory factors into their surrounding environment. Lukiw provided the first evidence that Bacteroides fragilis (BF-LPS) exposure to human primary brain cells is an exceptionally potent inducer of the pro-inflammatory transcription factor NF-κB (p50/p65) complex, which is a known trigger in the expression of pathogenic pathways involved in inflammatory degenerative neuropathology in the AD brain [17].
It has been hinted that diet and specific nutrients can affect the composition of the gut microbiota, and might influence the production or aggregation of amyloid proteins. This scenario predicts that modulating the gut microbiome through specific nutritional interventions and the use of prebiotics and probiotics might represent an effective strategy to reduce the level of chronic inflammation associated with AD, thus possibly moderating the progression of AD symptoms [18]. Recently, it was reported that prolonged shifts in gut microbial species composition and diversity induced by a long-term broad-spectrum combinatorial antibiotic treatment regime attenuated cerebral Aβ plaque deposition in the APPswe/PS1 ΔE9 mouse model of AD [19]. Furthermore, Akbari et al. demonstrated that probiotic food consumption for 12 weeks positively affects cognitive function and some aspects of metabolic status in human AD patients [20]. As such, the accumulating data strongly hint for a link between gut microbes and AD. However, the alteration of gut microbial composition and diversity has not yet been confirmed in AD patients or in AD model mice. Thus, we compared the fecal microbiome of an AD male mice model and littermate controls at different ages under specific pathogen-free (SPF) conditions, thus excluding the possible influences of factors such as diet, weight, gender, cage illumination, living habit, and medications.
MATERIALS AND METHODS
Animals and sample collection
The APPswe/PS1 ΔE9 (PAP) transgenic male mice were generated as previously described [21]. Age and weight-matched littermate mice were chosen as the wild-type control (WT). To eliminating the interference of sex, fresh fecal samples were collected from male mice at 1, 3, 5-6, and 8–12 months of age (n = 6/group) [22]. A total of 48 fecal samples were snap-frozen in liquid nitrogen and stored at –80°C before analysis. All mice were maintained under SPF and controlled environmental conditions. Our use of experimental animals was in compliance with the Health Guide for Care and Use of Laboratory Animals. The study protocol was approved by the Animal Care and Use Committee of the Institute of Laboratory Animal Science of Peking Union Medical College (QC16004) [23, 24].
DNA extraction and sequencing
DNA was extracted from 0.18–0.22 g stool samples using a QIA amp DNA Stool Mini Kit (Qiagen) according to the manufacturer’s instruction. The 16SrRNA gene was analyzed to evaluate the bacterial diversity by using Illumina Miseq 2500 platform (Novogene Bioinformatics Technology Co., Ltd). DNA was amplified by using the 341F/806R primer set (341F: 5’-CCTAYGGGRBGCASCAG-3’; 806R:5’-GGACTACNNGGGTATCTAAT-3’), which targets the V3+V4 region of the bacterial 16S rDNA [25].
Bioinformatics and statistical analysis
According to previous reports, the process of the bioinformatics and statistical analysis (http://h3abionet.org/tools-and-resources/sops/16s-rrna-diversity-analysis) [26, 27] is as follows: (1) raw tags were assembled through overlap sequences of the raw paired-end reads after illumina sequencing using Mothur v1.3213; (2) then clean tags were obtained by a series of preprocessing, including the removal of low quality bases, ambiguous bases and adapter sequences, the stitching together of paired tags, and the detection of chimeric tags using the USEARCH software based on the UCHIME algorithm14 [28]; (3) the clean tags were clustered into operational taxonomic unit (OTU) based on sequence identity. Sequences that were more than 97% identical were assumed to be derived from the same bacterial species. After the sequences clustering into OTUs and counting to estimate OTU abundance, the most abundant sequence was picked as a representative sequence for each OUT using Uparse software (Uparse v7.0.1001, http://drive5.com/uparse/) [28]; Each OTU was then classified by comparison to Mothur and SILVA database with aligned, validated and annotated 16S rRNA genes; (4) a taxonomic identity was assigned to each representative sequence using Mothur and SILVA database (http://www.arb-silva.de/). A taxon (plural taxa) was any taxonomic grouping, such as a phylum, class, order, family, genus or species; (5) using PyNAST and GreenGene database, phylogeny inference was made based on sequence alignment. In downsteam analysis the phylogenetic information was used for calculating the Unifrac distance [29]; (6) alpha diversity, a measure of diversity within a sample, gives an indication of richness/diversity of species present in a sample. It was measured based on the rarefied OTU tables using Mothur including cataloging of observed species, Chao1 [30], Shannon [31], Simpson [32], ACE [33], and Good coverage indices [34] (Fig. 1b, Supplementary Table 2); (7) beta diversity was performed to measure the diversity between samples, including principal component analysis (PCA) based on Euclidean distance [35], unweighted and weighted Unifrac based on phylogenetic distance calculated by UPGMA using Mothur [27 , 36–39]. Unweighted UniFrac measures the distance between two communities by calculating the fraction of the branch length in a phylogenetic tree that leads to descendants in either, but not both, of the two communities [38]; whereas weighted UniFrac is a quantitative measure that weights the branches of a phylogenetic tree based on the abundance of information, which is thus of beta diversity that can detect changes in how many sequences from each lineage are present, as well as detect changes in which taxa are present [40]; (8) both alpha and beta diversity were calculated according to previous report and analyzed by the Wilcoxon rank-sum test (Table 1, Supplementary Table 2) [27 , 36–39]. And a two-sided Student’s t-test was used to test for significance of relative abundance of fecal microbiota at genus and species level between sample groups (Fig. 4); (9) linear discriminant analysis (LDA) coupled with effect size (LEfSe), an algorithm for high-dimensional biomarker discovery and explanation, was performed to identify the bacterial taxa differentially represented between groups at the genus or higher taxonomic levels as previously reported [41]. Then LDA scores were used to estimate the effect size of each differentially abundant feature and for biomarker discovery among groups and LDA scores were positive correlated to the effect [41]. Additionally, to demonstrate whether the variations of gut microbiota were associated with age or AD model status, we performed Pearson’s correlation analysis based on the microbial community difference matrix using R Studio software.
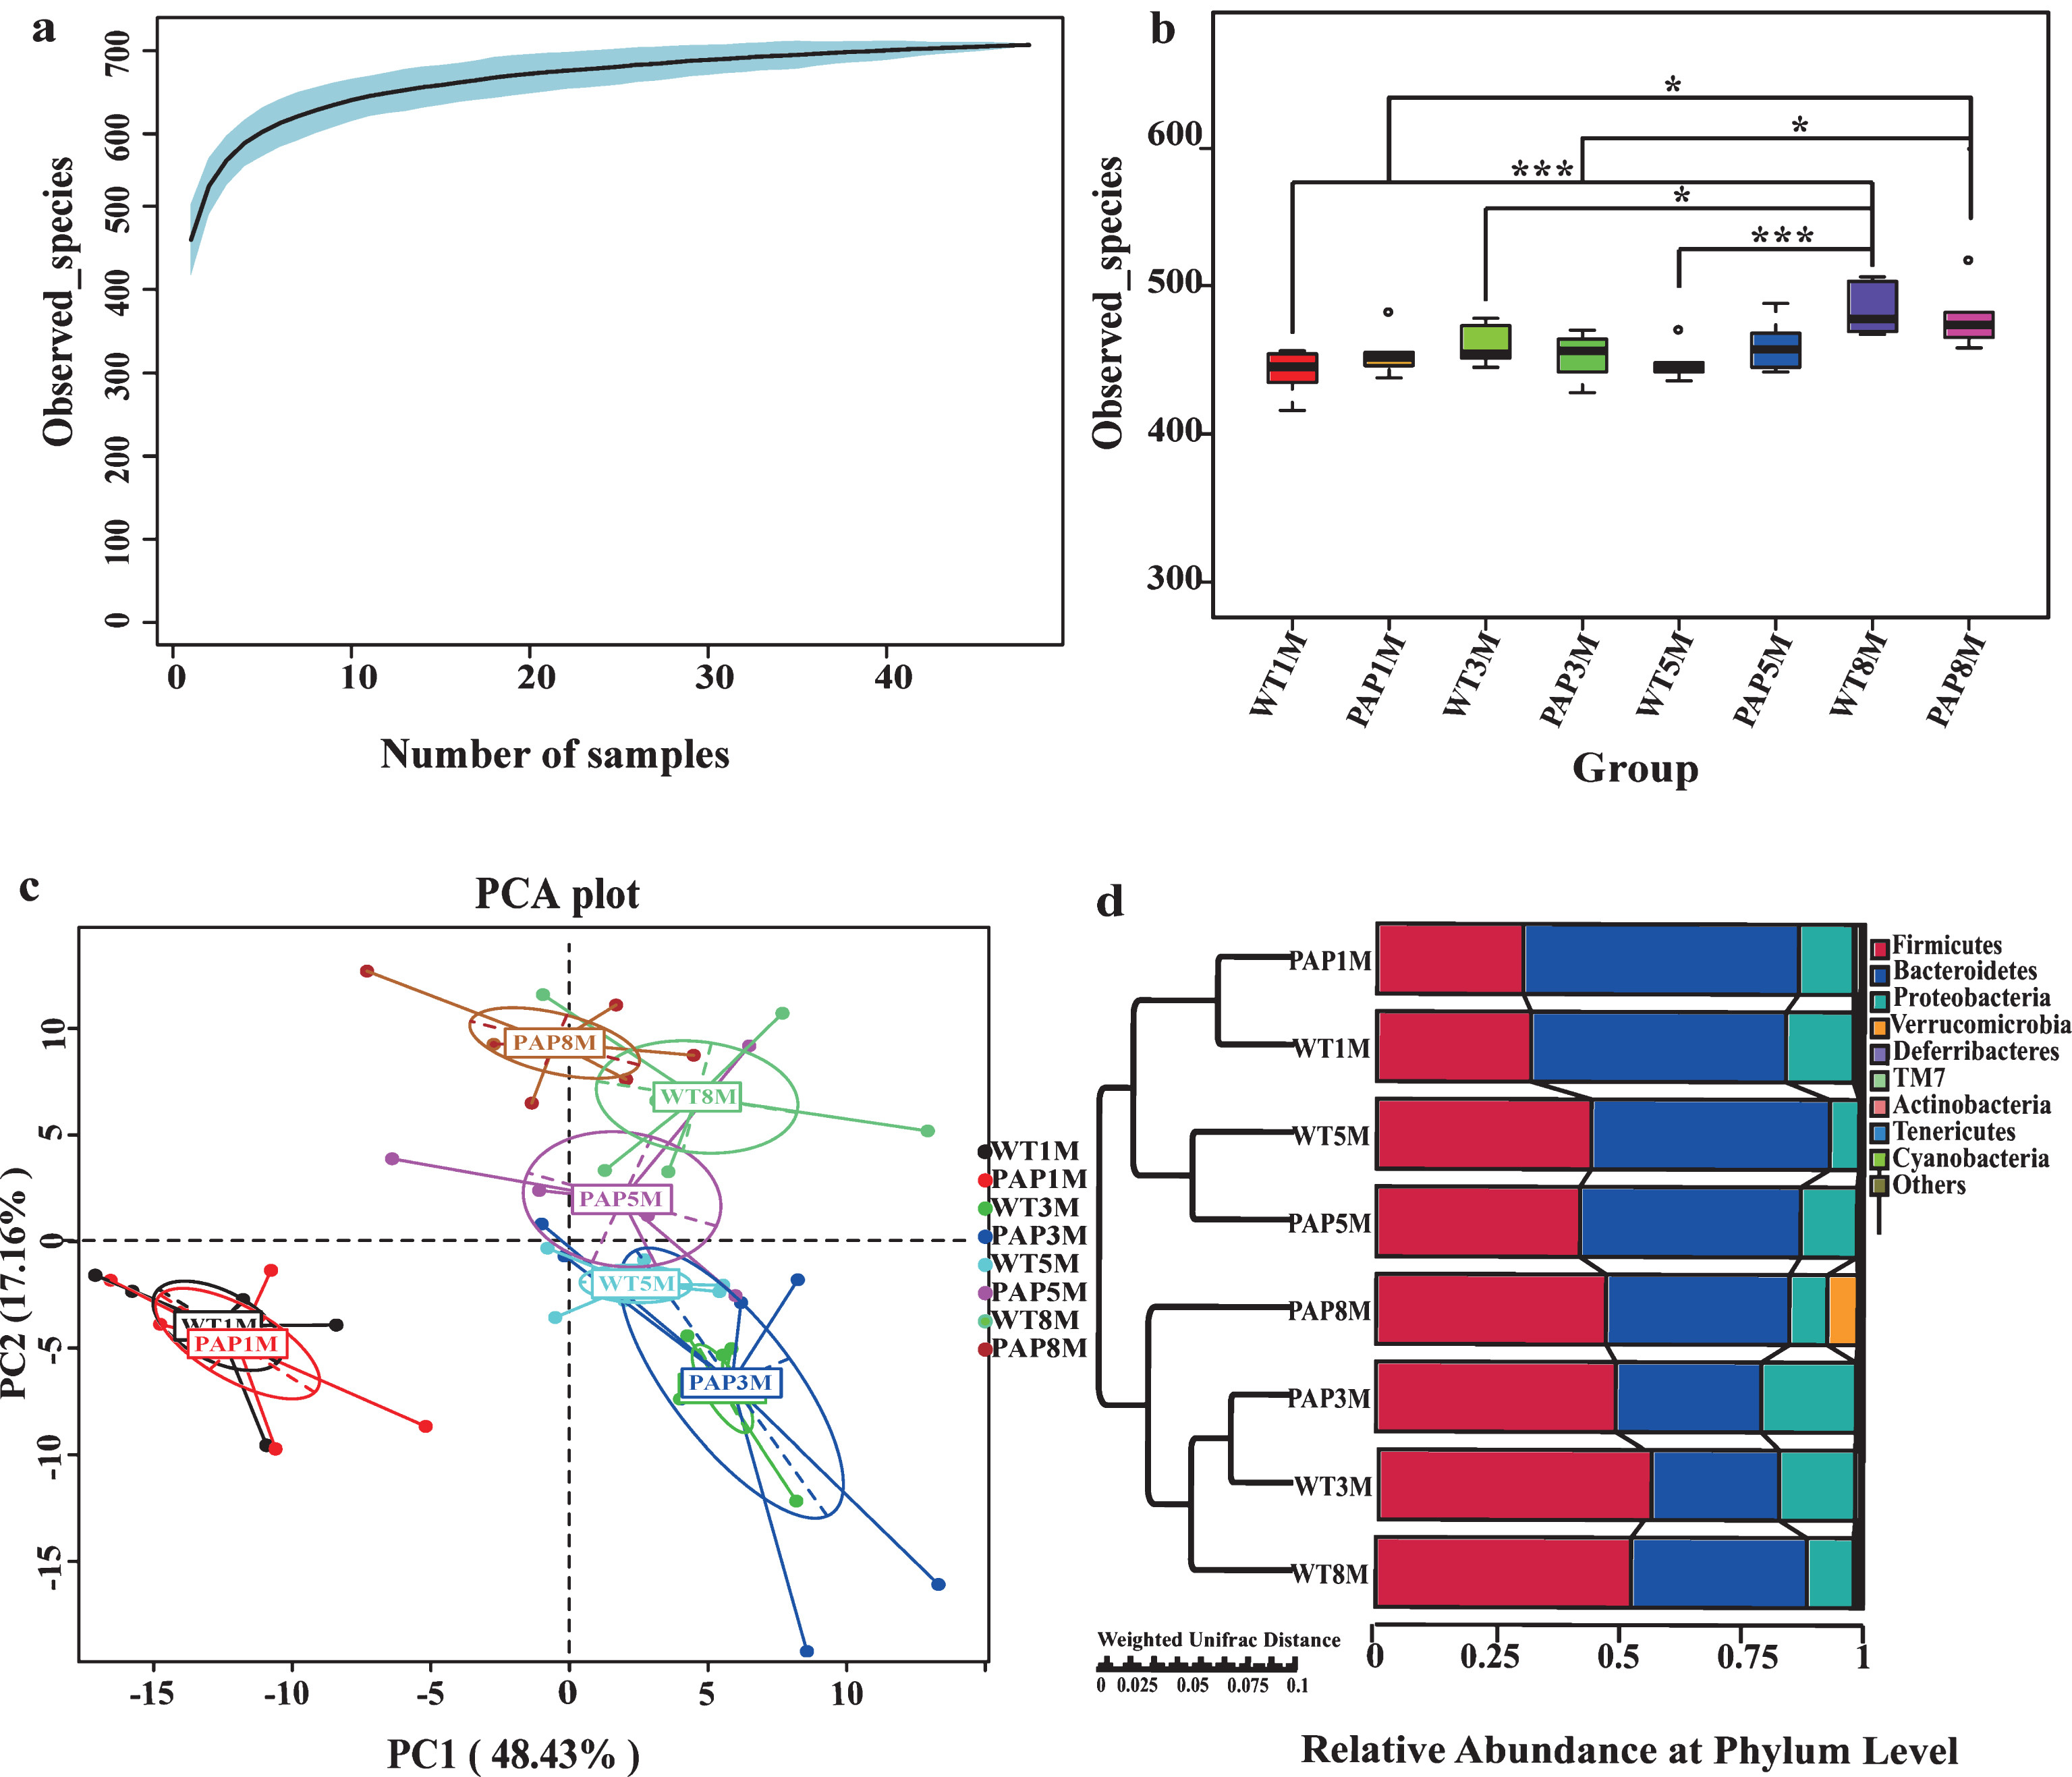
Diversity and richness of the gut microbiota in mice. a) The species accumulation curve (smooth tendency) shows the sufficient sample number a boxplot of observed species. X axis represents the number of samples, and Y axis represents the observed species (OTU number). b) The Chao1 index displays the microbial diversity of each sample. c) Principal components analysis (PCA) for gut microbial composition in all groups, which is achieved by computing Euclidean distance between the samples based on OTUs. The first two principal components are plotted. d) The left side shows the group clustering based on weighted Unifrac distance calculated using UPGMA; the right histogram shows the relative abundance of microbiota at the phylum level. Differences were assessed by the Wilcoxon rank-sum test, and denoted as follows: * p < 0.05, *** p < 0.001. PAP1M, PAP3M, PAP5M, PAP8M, WT1M, WT3M, WT5M, and WT8M represent the APPswe/PS1 ΔE9 transgenic mice and littermate mice at 1, 3, 5-6, and 8–12 months of age, respectively.
Results of Wilcoxon rank-sum test analysis of the Unweighted and Weighted UniFrac distances depicting differences of β diversity in different gut compartments
95% CI represents 95% confidence interval of unweighted and weighted UniFrac distances. * p < 0.05, ** p < 0.01. PAP1M, PAP3M, PAP5M, PAP8M, WT1M, WT3M, WT5M, and WT8M represent the APPswe/PS1 Δ E9 transgenic mice and littermate mice at 1, 3, 5-6, and 8–12 months of age, respectively.
Microbial function prediction
The functional profiles of microbial communities were predicted by using PICRUSt. The OTUs were mapped to gg13.5 database at 97% similarity by applying QIIME’s command “pick_closed_otus”. The OTUs abundance was normalized automatically using 16S rRNA gene copy numbers from known bacterial genomes in the Integrated Microbial Genomes (IMG) database. The relevant predicted genes and their function were aligned to KEGG database and the differences among groups were compared with the STAMP software (http://kiwi.cs.dal.ca/Software/STAMP). The two-side Welch’s t-test and Benjamini-Hochberg FDR correction were used in the between-group analysis. ANOVA with the Tukey-Kramer test with the Benjamini-Hochberg correction were chosen for multiple-group analysis [42].
Fecal short-chain fatty acids (SCFAs) quantification by GC-MS
SCFAs were analyzed by GC-MS using an Agilent 7890A/5975C instrument equipped with an HP-5MS column (0.25×30 mm, 0.25 μm particle size) as previously described (Suzhou Bionovogene Co., Ltd). Helium was used as a carrier gas at a constant flow rate of 1 mL/min. The initial oven temperature was held at 60°C for 5 min, ramped to 250°C at a rate of 10°C/min, and finally held at this temperature for 5 min. The temperature of the front inlet, transfer line and electron impact (EI) ion source were set as 280, 250, and 230°C, respectively. Data handing was performed with an Agilent’s MSDChemStation [43].
Morphological examination
Intestinal tissue from the mice was fixed by immersion in 10% neutral buffered formalin and embedded in paraffin. After dewaxing, 4 μm thick intestinal sections were cut with a microtome and washed in PBS for H&E staining. The immunohistochemistry procedures were carried out according to conventional methods. In brief, sections were probed with primary antibody: 4G8 (1 : 1000, anti-Aβ17–24, Convance) or anti-Aβ1–42 (ab10148, Abcam) overnight at 4°C. Then, the immunoreaction was visualized after incubating with the secondary antibody (HRP-labeled anti-mouse IgG) and, following 3 washes in PBS, addition of DAB (ZSGB-BIO, Beijing, China) [21, 44]. ThioflavinT (T3516, Sigma) staining was performed by a standard method [45]. Fluorescence was measured using inverted fluorescence microscope (IX71, Olympus) at an excitation wavelength of 450 nm and an emission wave lengthof 482 nm.
Ultrastructural analysis was performed as in previous studies. In brief, the intestines were carefully dissected and fixed in 2.5% glutaraldehyde solution at 4°C for 2 h. Ultrathin sections were cut, stained with uranyl acetate and lead citrate, and examined under JEM-1400 transmission electron microscope (Jeol Ltd., Tokyo, Japan) at 80 kV [21].
RESULTS
Characteristics of the high-throughput sequence data
A total of 2,077,384 of V3+V4 16S rRNA sequences reads (Taxon Tag) from the 48 samples with an average of 38,860 sequences (the minimum of one sample was 25,746 and the maximum was 55,643) reads for each sample were obtained for this study. The average length of sequence reads was 415 bp, and they were taxonomically classified using MGRAST15 (http://metagenomics.anl.gov/) (Supplementary Table 1). After OTU picking and chimera checking, each sample had an average of 494 OTUs. The taxon abundance of each sample was classified to Phylum, Class, Order, Family, Genera, and Species levels, mainly using the RDP database, aided by the Greengene, and SSU databases. For all samples, the species accumulation curve (Fig. 1a) showed that samples reached the saturation phase. Furthermore, the Good coverage index (Supplementary Table 2) indicated adequate depth ofsequencing.
Changes in bacterial communities in mice with advanced ages
Five alpha diversity measures were calculated, including observed species (OTUs) (Fig. 1b), Chao1, Shannon, Simpson and ACE’s diversity indices (Supplementary Table 2). We found no significant difference in the Simpson diversity between the two groups at any age. However, OTUs number, Chao1, Shannon, and ACE indices showed higher diversity and richness in 8–12-month-old WT mice (WT8M) when compared with other WT groups. Also, the samples from 8–12-month-old PAP mice (PAP8M) showed significantly increased diversity and richness than did PAP mice at 3 months of age (PAP3M) as indicated by the number of observed species, Chao1, and ACE index, and also greater diversity than 1-month-old PAP mice (PAP1M) by the observed species index. The relationships between the community structures were examined by PCA (Fig. 1c) and unweighted/weighted Unifrac analysis (Fig. 1d, Table 1). It was shown that PC1 can explain 48.43% of the variance and PC2 can explain 17.16% of the variance. The total explanation rate of the two axes reached 65.59%. The samples were clustered into six groups: (1) PAP8M; (2) WT8M; (3) PAP5M; (4) WT5M; (5) PAP3M&WT3M; (6) PAP1M&WT1M. Based on the distribution of the sample point, the WT and PAP group were both separated by age obviously (Fig. 1c). The Unifrac analysis also indicated that the community structures of fecal microbiota differed as a function of age (Fig. 1d, Table 1).
Concerning the abundance of Phylaein fecal samples, Firmicutes and Bacteroidetes were the two most dominant at all ages. The relative abundance of the top ten phyla is shown in Fig. 2a and 2b (Supplementary Table 3). For 1-month-old mice, the abundance of Firmicutes (WT1M-32%, PAP1M-30%) was significantly lower than that of the older mice (>40%). The abundance of Bacteroidetes was conspicuously low at 3 months of age of WT (28%) and AD (30%) mice relative to the other age groups. The ratio of Firmicutes to Bacteroidetes was 0.60 (WT) and 0.53 (AD) at 1 month of age, increasing more than 3-fold to 2.00 (WT) and 1.65 (AD) at 3 months of age, and then decreasing to 0.99 (WT) and 0.92 (AD) at 5-6 months, finally reaching 1.45 (WT) and 1.25 (AD) at 8–12 months of age. Proteobacteria, as the third most abundant Phylum, also showed a dynamic pattern with age, as shown in Fig. 2a and 2b, having a tendency to decrease with age. In addition, the relative abundance of Actinobacteria and Deferribacteres decreased with age for both groups. Notably, Verrucomicrobia was dramatically increased at the oldest mouse age, especially in AD transgenic mice (Fig. 1d, Fig. 2a, b). The top 10 most abundant microbes in mouse stool at the rank of Class (c), Order (d), and Family (e) are shown in Fig. 2.

Profiles of top 10 microbes in mice stool at the rank of phylum: pie chart (a), histogram (b) (with relative abundance over 1% in at least one sample), class (c), order (d), and family (e). PAP1M, PAP3M, PAP5M, PAP8M, WT1M, WT3M, WT5M, and WT8M represent the APPswe/PS1 ΔE9 transgenic mice and littermate mice at 1, 3, 5-6, and 8–12 months of age, respectively.
On the genus level, the top 35 differentiated taxa with high relative abundance at different ages were shown in the hierarchy cluster heat-map (Fig. 3a). Our LEfSe analysis of the 55 top taxa showed that eight bacterial taxa were differentially represented in 1-month-old, 5 taxa in 3-month-old, 4 taxa in 5-6-month-old, and only 1 taxon in 8–12-month-old WT mice (Fig. 3b). In contrast, we saw differential representation of 4 taxa in 1-month-old, 3 taxa in 3-month-old, 4 taxa in 5-6-month-old, and 6 taxa in 8–12-month-old AD mice (Fig. 3d) (p < 0.05,respectively).
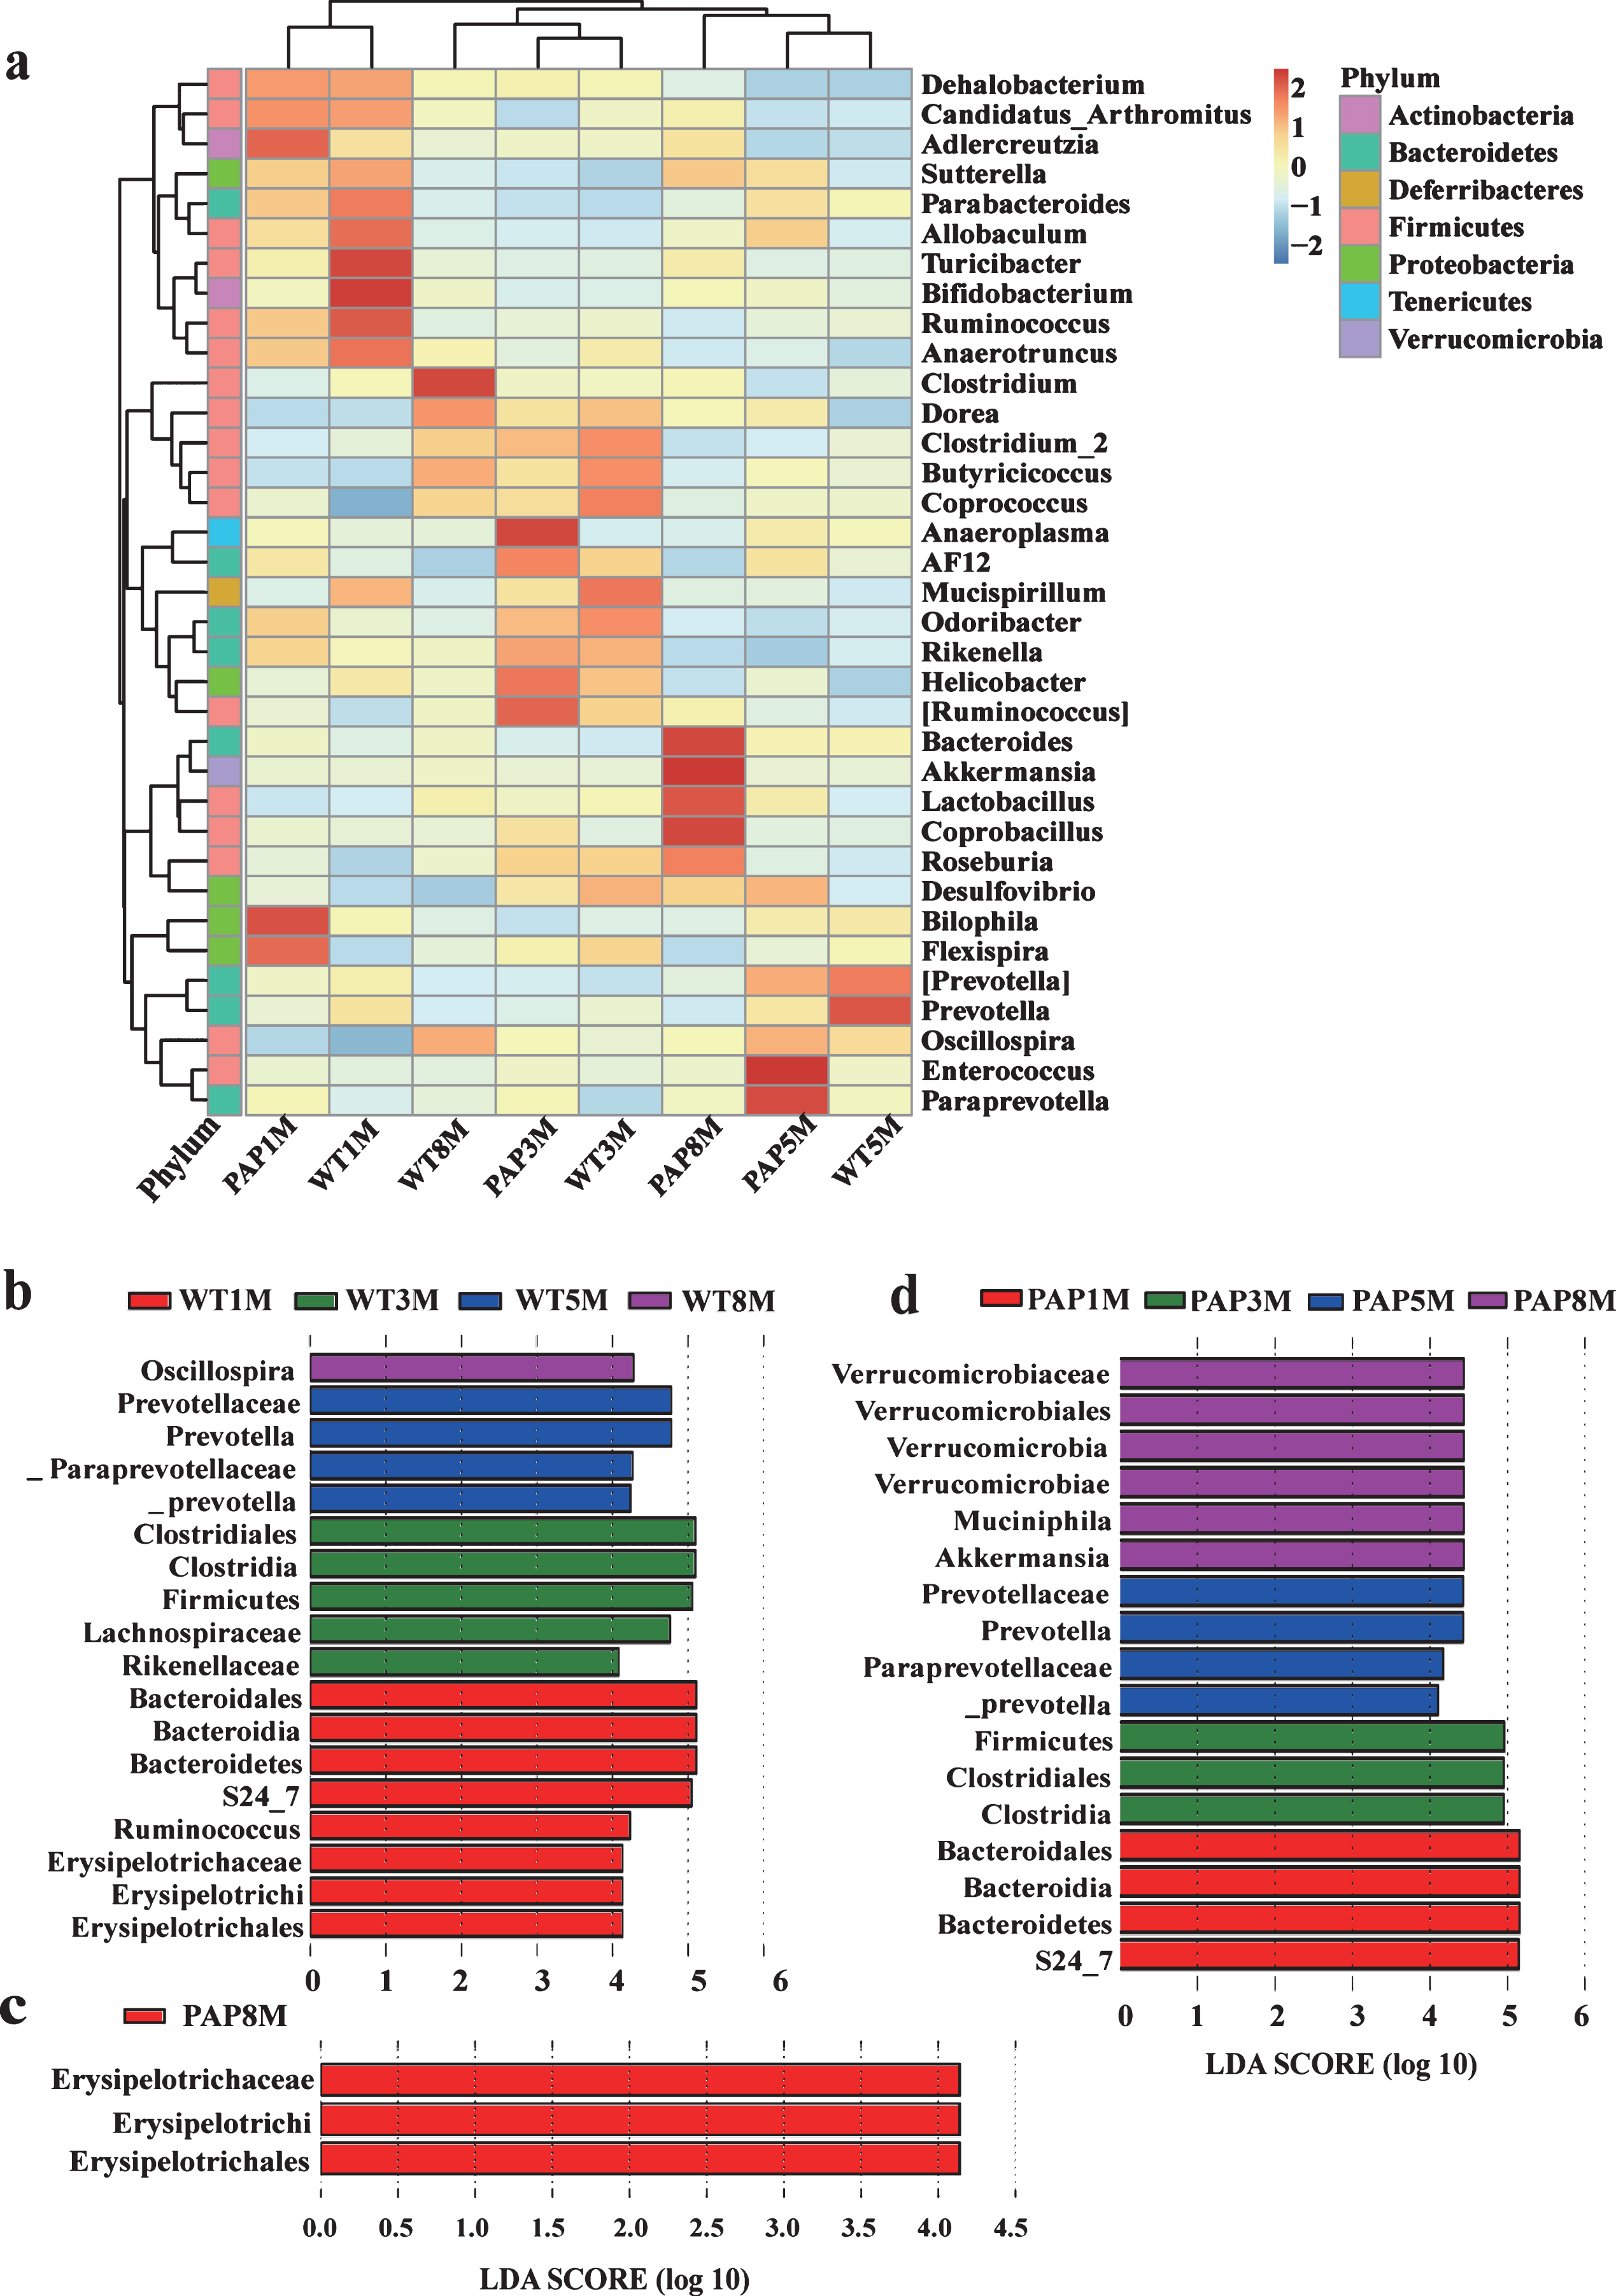
OUT heat-map of hierarchy cluster results for the genus abundance in each group of mice and bacterial taxa, which significantly differed in mice, as revealed by LEfSe using the default parameters. a) Heat map illustrating the abundance of the major genera. Each column in the heatmap represents a group. Each row represents a family level taxon. The family level taxon name is represented on the right side of heatmap. The color bar (log scale) indicates the range of the relative abundance of the genus in groups at the top right, and it is proportional to the abundance of certain taxon. (b) and (d) show different taxa of WT and AD model mice at different ages, respectively; (c) shows the differing taxa between WT and AD model mice at 8–12 months old. Histogram of the LDA scores computed for features differentially abundant among tested samples. LDA scores can be interpreted as the degree of consistent difference in relative abundance between features in analyzed microbial communities. PAP1M, PAP3M, PAP5M, PAP8M, WT1M, WT3M, WT5M, and WT8M represent the APPswe/PS1 ΔE9 transgenic mice and littermate mice at 1, 3, 5-6, and 8–12 months of age, respectively.
To be more specific, we further calculated multiple comparisons to show the conspicuous group differences at each age on the genus (Fig. 4a) and species levels (Fig. 4b). Generally, the different genera were similar in older and younger WT mice. The significantly increased genera in the older mice included Oscillospira, Roseburia, Bacteroides, Coprococcus, Ruminococcus, Paraprevotella, etc. In contrast, the representation of some genera such as Prevotella, Sutterella, Parabacteroides, and Allobaculum reduced with age. In terms of the recognized probiotics, Bifidobacterium had relatively high abundance in 1-month-old WT mice, but no remarkable difference between each two groups, as likewise seen for Lactobacillus (Fig. 3a). The abundance of Ruminococcus gnavus (R. gnavus) increased, whereas Parabacteroides distasonis (P. distasonis) decreased with age of both WT and AD mice (Fig. 4b). Correlation analysis showed a significant correlation of gut microbiota with age (Pearson’s R = 0.2779, p = 0.0001) (Supplementary Table 3).
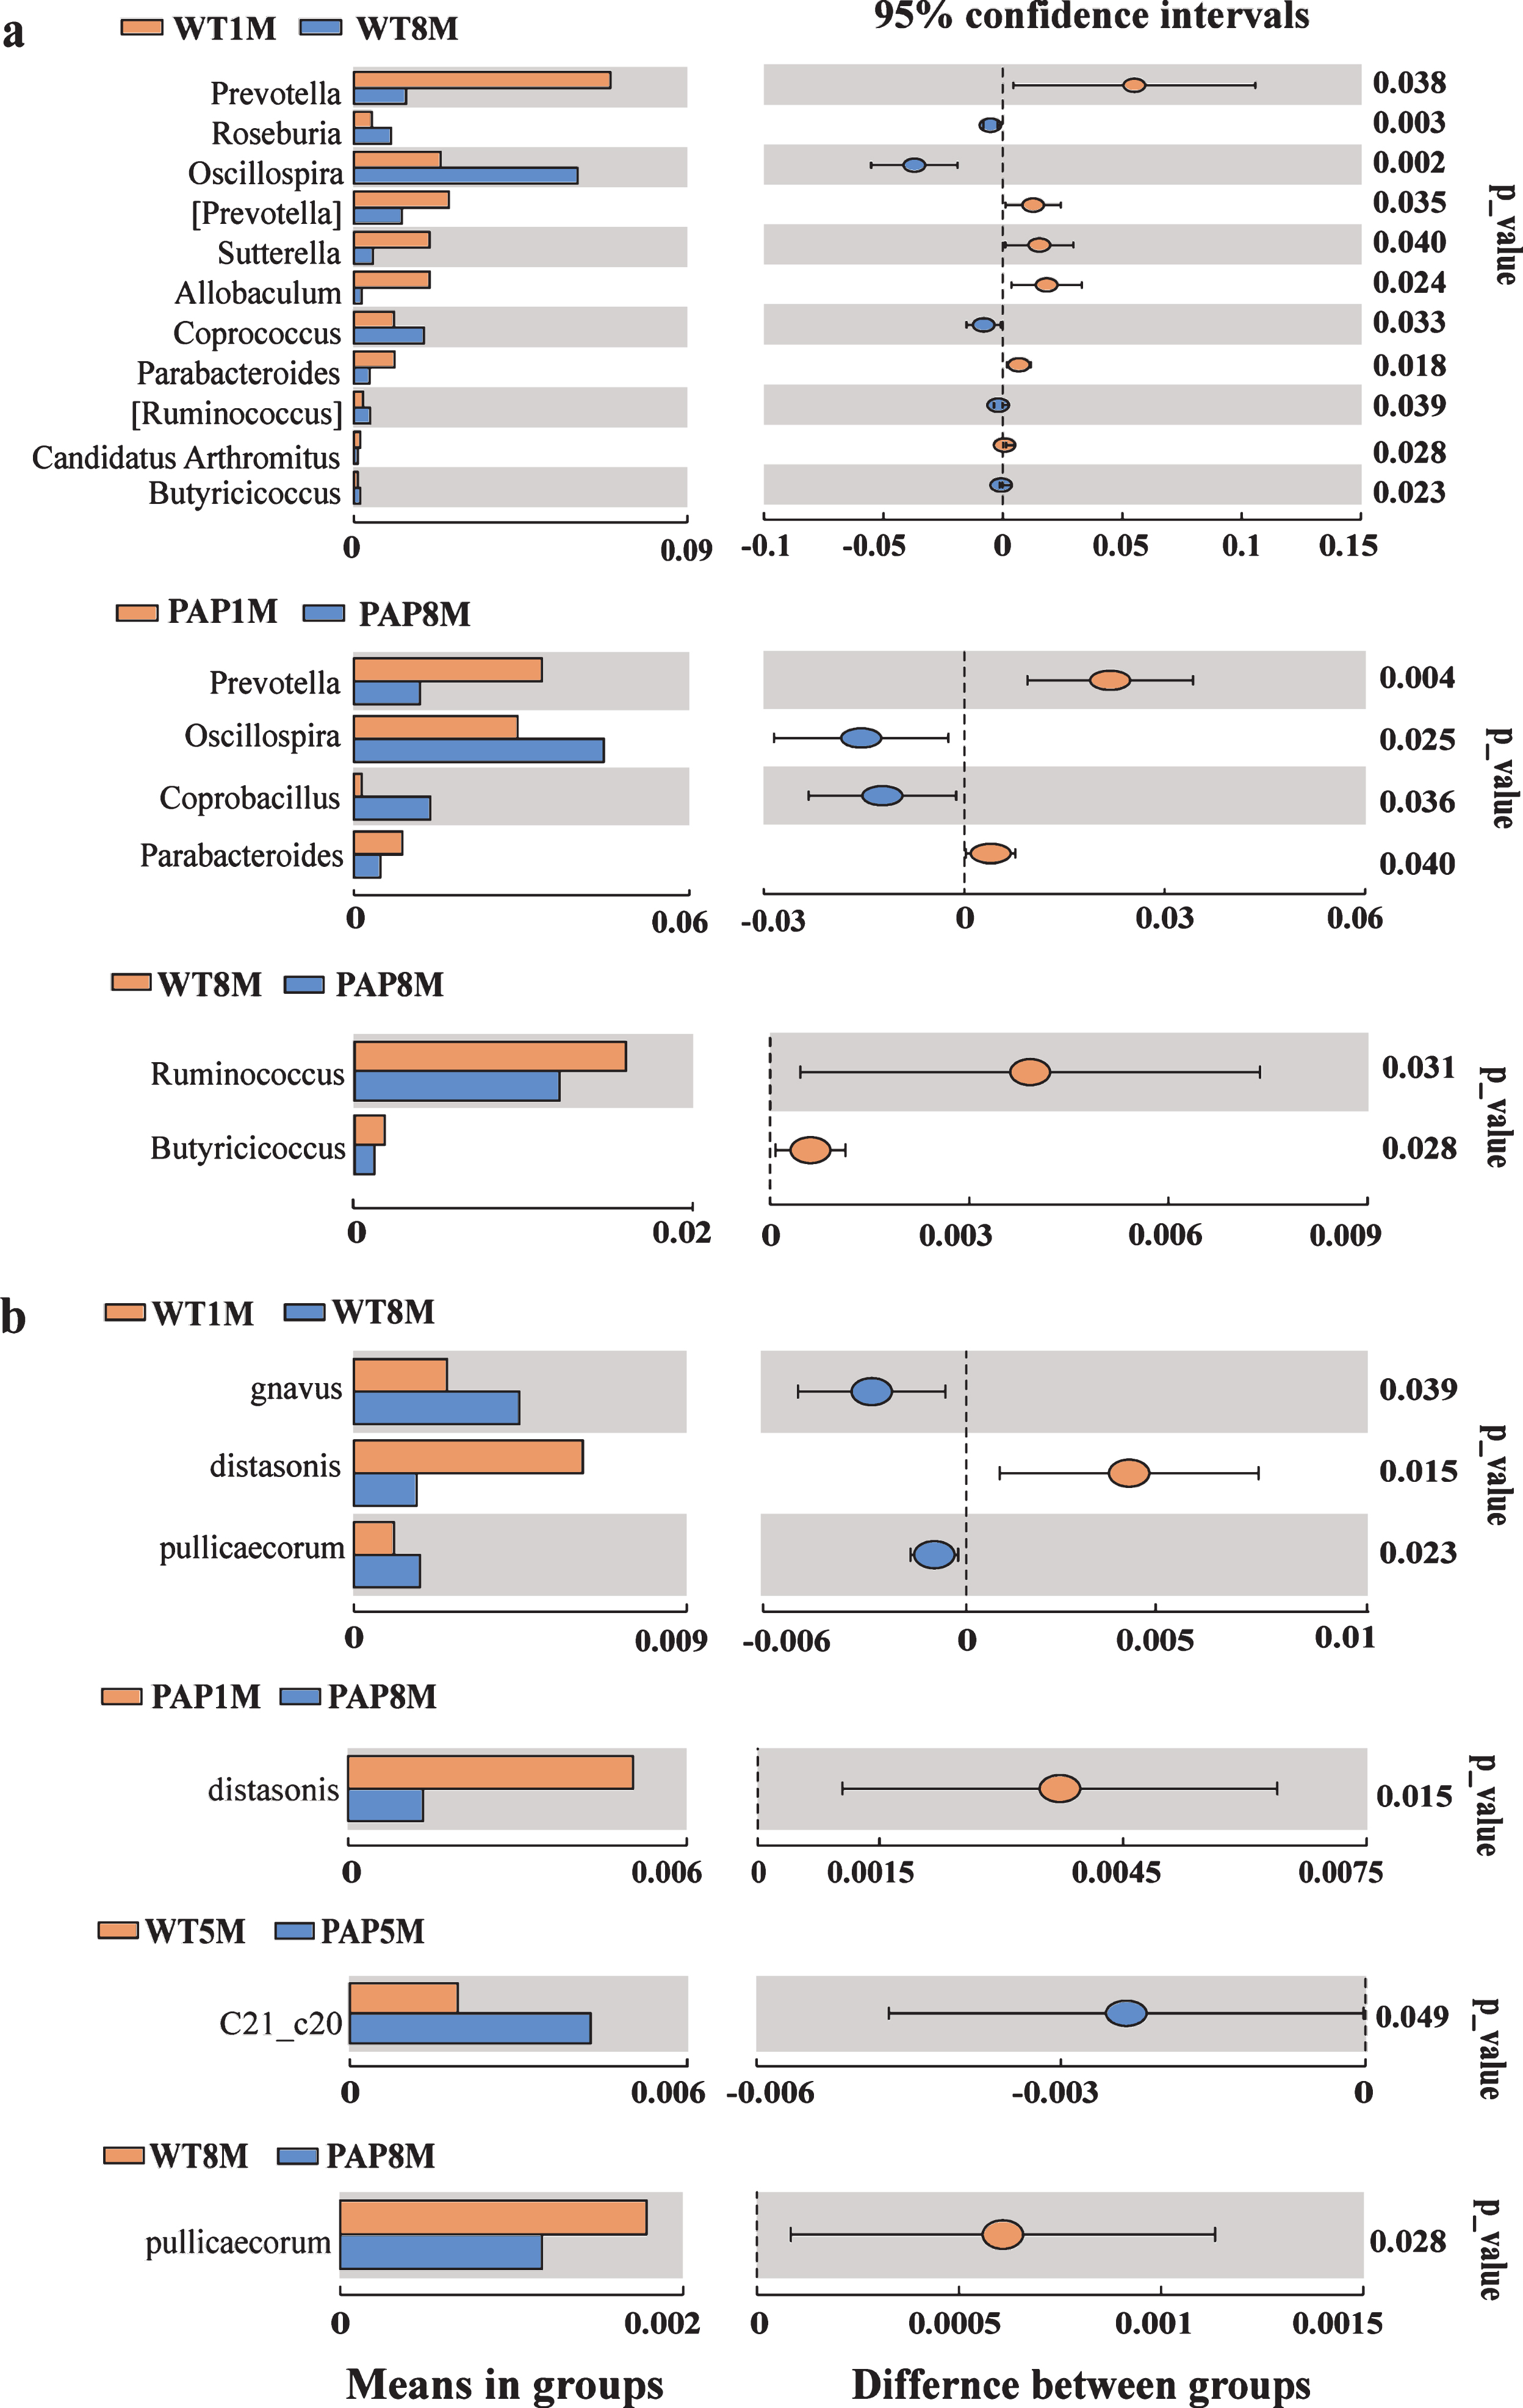
Different fecal microbiota of mice in genus (a) and species level (b). The left histograms represented means of relative abundance of microbiota in group and the right side represented P values and the 95% confidence intervals of difference between groups. Significant statistical difference by student’s t-test (p < 0.05). PAP1M, PAP3M, PAP5M, PAP8M, WT1M, WT3M, WT5M, and WT8M represent the APPswe/PS1 ΔE9 transgenic mice and littermate mice at 1, 3, 5-6, and 8–12 months of age, respectively.
Functional analysis using PICRUSt indicated that more than 50 pathways were predicted from KEGG to change with age. In general, microbiota in the older mice had lower abundance of pathways involved in cell growth and death, immune system, metabolism, translation, replication and repair, cellular processes and signaling, and protein folding, sorting, and degradation, while membrane transport pathways were over-represented with increasingage (Fig. 5a).
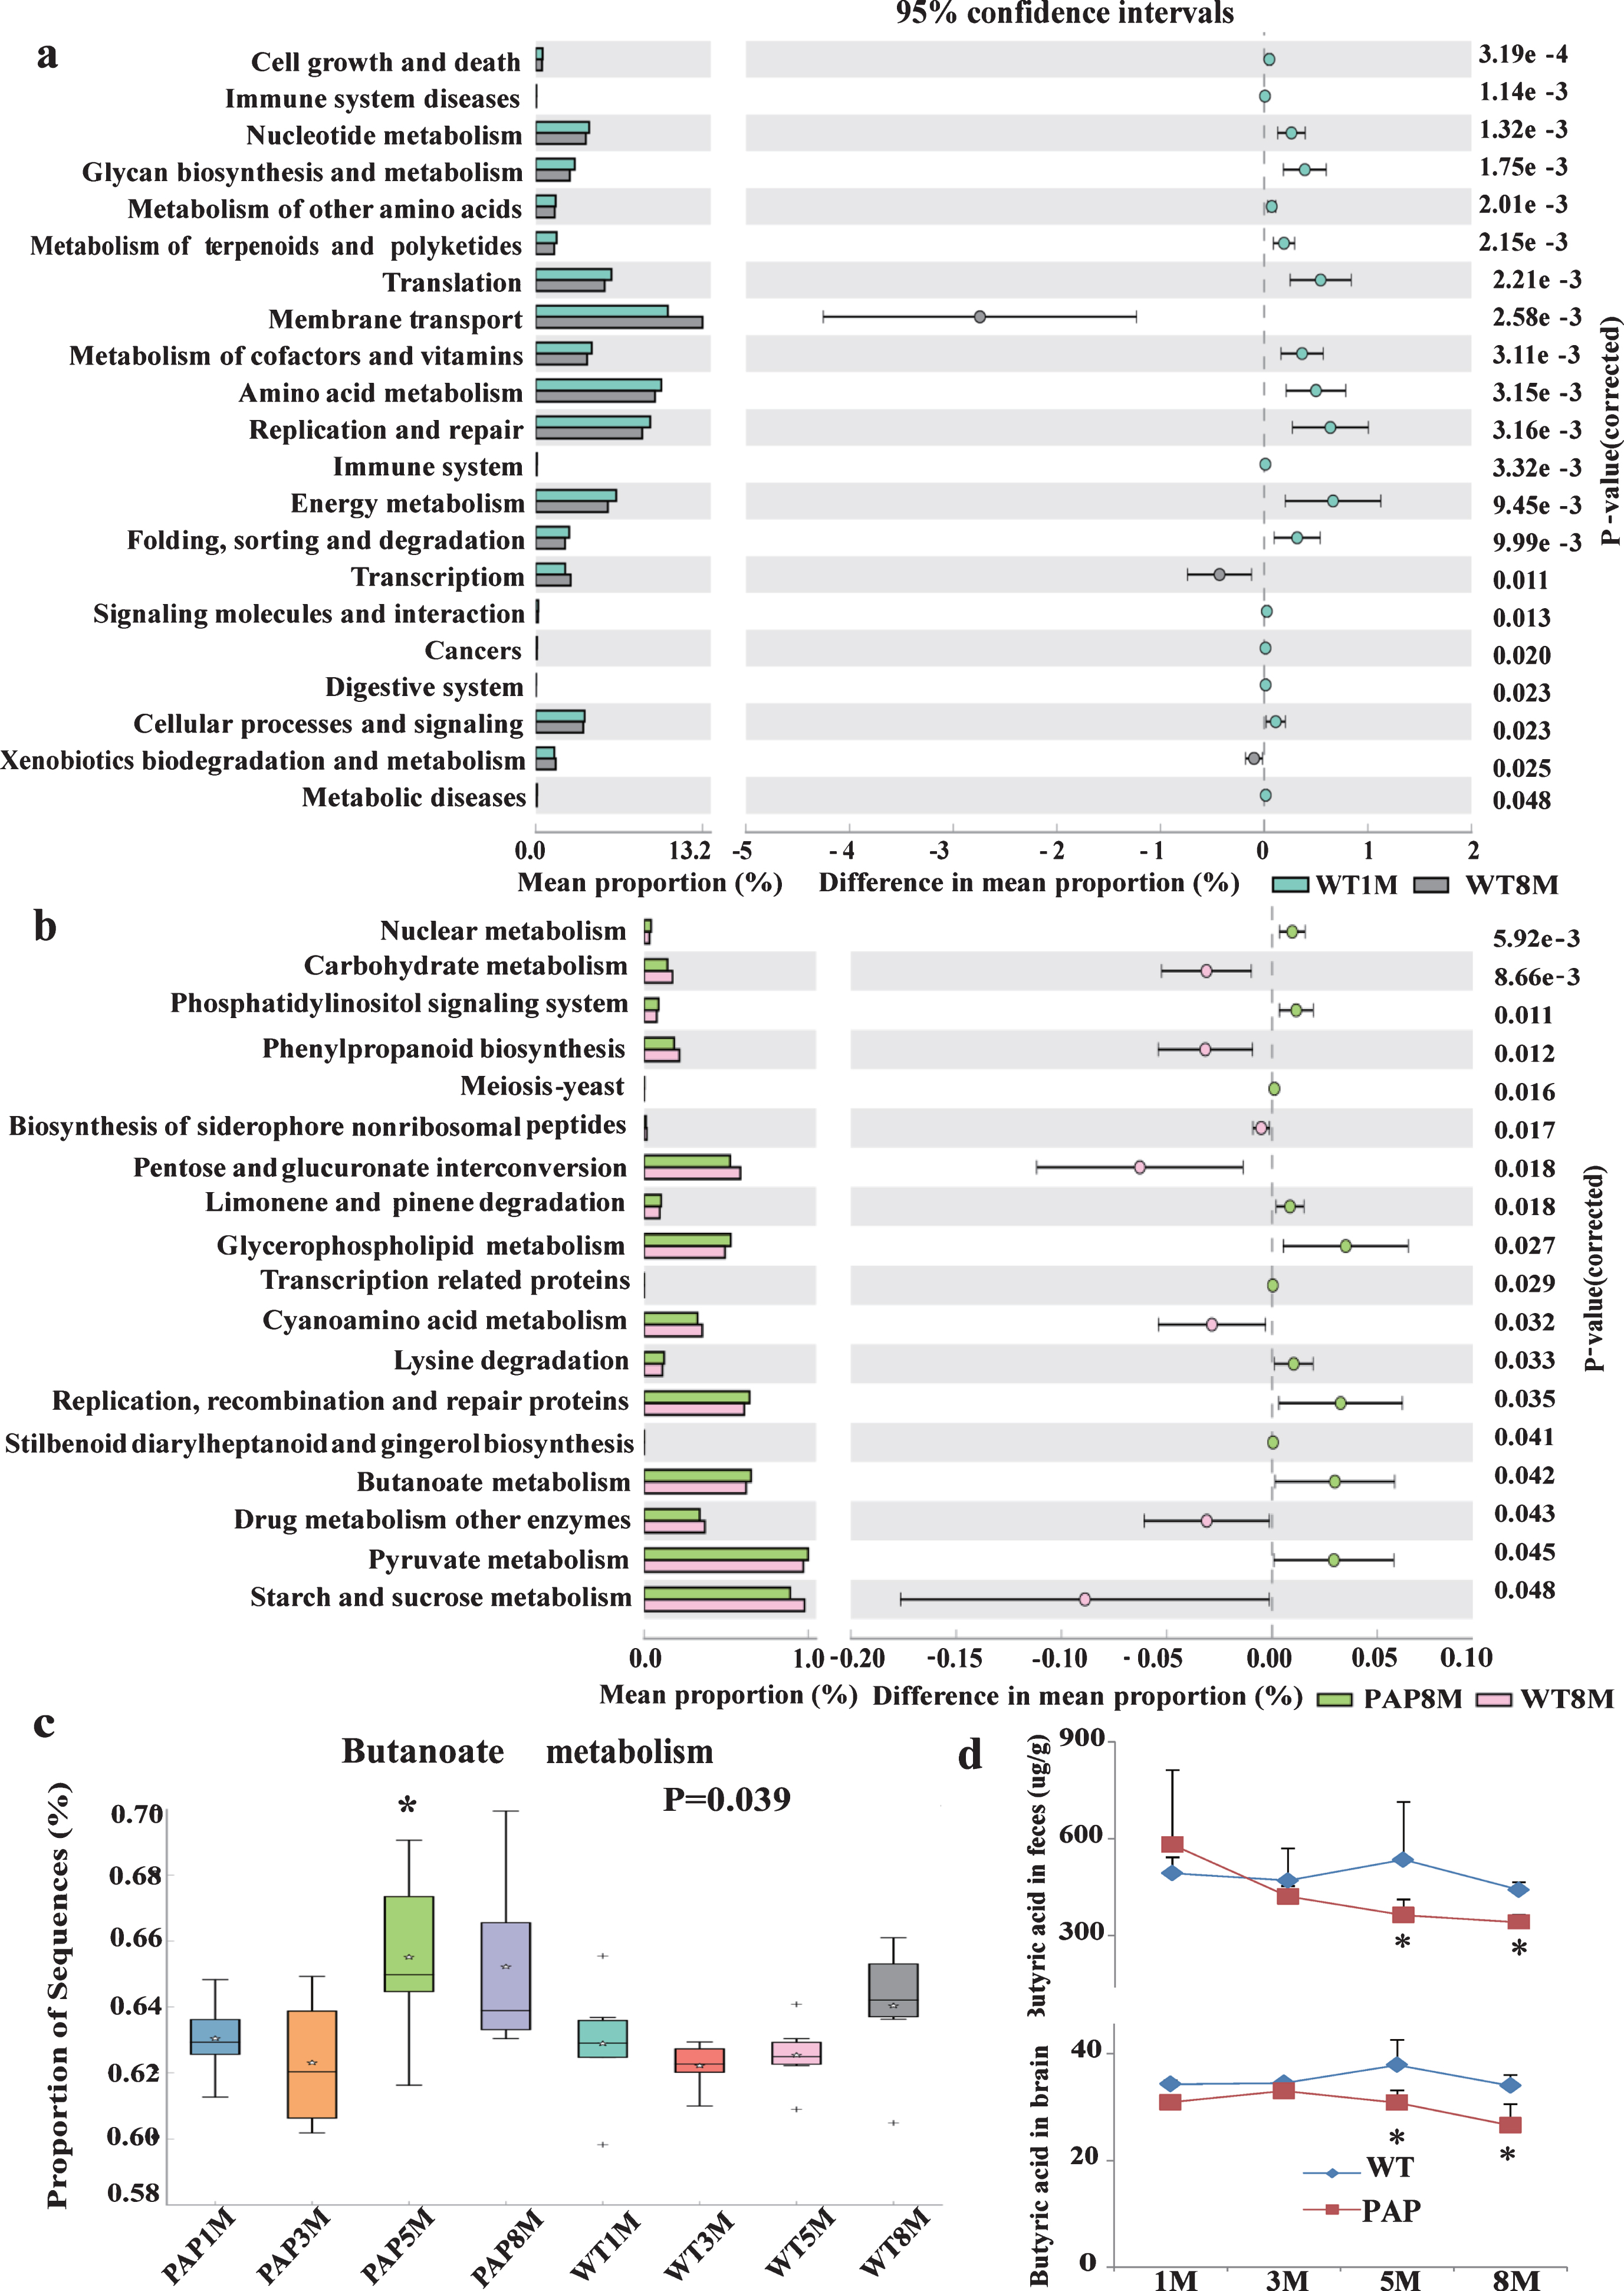
Comparison of microbial functional pathways associated with metabolism and disease. KEGG pathways enriched or depleted in the fecal microbiomes of WT1M versus WT4M (a), AD mode versus WT mice at 8–12 (b) and 5-6 month of age (c). d) Significant statistical difference in butanoate metabolism between AD model and WT mice at 5-6 month of age by post-hoc test of ANOVA test. e) The concentrations of butyrate acid in feces and brain of mice. * p < 0.05. PAP1, PAP2, PAP3, PAP84 WT1, WT2, WT3, and WT4 represent the APPswe/PS1 Δ E9 transgenic mice and littermate mice at 1, 3, 5-6, and 8–12 months of age, respectively.
Changes in bacterial communities in AD mice
Alpha diversity analysis by the Chao1 index revealed significantly higher richness in fecal microbiota of 5-6-month-old AD mice than age-matched WT controls (Supplementary Table 2), while 8–12-month-old AD mice displayed lower diversity than littermate controls by the Shannon index (Supplementary Table 2). The PCA plot showed that the gut microbiota between the WT and PAP group for the younger mice (1M, 3M) were much more similar and the difference enlarged with the age growth (5M, 8M) (Fig. 1c). Additionally, Unifrac analysis showed distinct bacterial community structures between AD and WT mice at 5-6 and 8–12-months of age (Fig. 1d, Table 1).
On the phylum level, the abundance of Proteobacteria in 5-6-month-old AD mice was doubled compared to WT controls (12% versus 6%). The Verrucomicrobia was dramatically increased by 6-fold in 8–12-month-old AD mice compared to age-matched WT controls (Fig. 1d, 2a, b). Concerning the genus abundance in feces samples, the hierarchy cluster heat-map revealed the top 35 most abundant differentiated taxa (Fig. 3a). The 10 most abundant microbes in mice stool at the rank of class (c), order (d), and family (e) are shown in Fig. 2.
LEfSe analysis displayed three bacterial taxa (Erysipelotrichaceae, Erysipelotrichales, and Erysipelotrichales) that were differentially represented in 8–12-month-old AD mice compared to the age-matched controls (Fig. 3c) (p < 0.05, respectively) and no differences at other ages. This might indicate the three bacterial taxa could be the bacterial biomarker in 8–12-month-old AD mice.
We further corrected for multiple comparisons to show significant differences between AD and WT mice on the genus and species levels (Fig. 4). When compared with age-matched controls, Ruminococcus and Butyricicoccus were significantly decreased in 8–12-month-old AD mice. Among species that could be identified, Desulfovibrio C21_c20 was increased in 5-6-month-old PAP mice, and the abundance of Butyricicoccus pullicaecorum (B. pullicaecorum), a butyrate producer with probiotic potential, was reduced in 8–12-month-old AD mice. In addition, we observed the correlation between gut microbiota and AD model status (Pearson’s R = 0.2325, p = 0.0037) (Supplementary Table 3).
The functional analysis predicted more than 30 metabolic and cellular pathways to be altered in AD mice. Overall, these results suggested that AD mice hosted fewer microbial functions than WT mice for many metabolism and biosynthesis processes. However, the AD mice had more functions in phosphatidylinositol signaling system, limonene and pinene degradation, butanoate/pyruvate metabolism, among other pathways (Fig. 5b-d). The observations of altered butanoate/pyruvate metabolism and decreased abundance of B. pullicaecorum provoked us to measure the fecal concentration of SCFAs. As Table 2 shows, the SCFAs, including butyric acid and isobutyric acid, had a tendency to be lower in both feces and brain of AD mice. Interestingly, the level of butyric acid in brain correlated positively with that in feces (Pearson’s R = 0.8197) (Fig. 5d, Table 2).
The content (μg/g) of SCFAs in feces and brain in WT and AD mice (n = 6)
* p < 0.05, ** p < 0.01 (PAP versus WT at the same age). PAP1M, PAP3M, PAP5M, PAP8M, WT1M, WT3M, WT5M, and WT8M represent the APPswe/PS1 Δ E9 transgenic mice and littermate mice at 1, 3, 5-6, and 8–12 months of age, respectively.
The alterations of gut microbiota in AD may be associated with perturbed intestinal structure
H&E staining showed amyloid deposition (as homogeneous red-stained substance) in intestinal villous stroma of AD mice (Fig. 6a-c). We further investigated samples from the AD group using anti-Aβ immunohistochemistry staining, including anti-Aβ1–42 (Fig. 6d, e), 4G8 (Fig. 6f, g), and also thioflavine T staining (Fig. 6h-k), to explore the characteristics of the homogeneous H&E positive substance. Using these methods, we found that Aβ deposition could be detected as early as 5 months of age in AD mice. The results confirmed the presence of Aβ deposition in the intestinal villous stroma. Furthermore, transmission electron microscopy also showed filamentary structures in the small intestinal stroma (Fig. 6o), similar in appearance to the senile plaques (Fig. 6l) in hippocampus of AD mice. In addition, electronic microscopy results revealed that the intestinal villous of AD mice was significantly shorter, sparser, and irregularly arranged (Fig. 6n) when compare with WT mice at five months of age (Fig. 6m). Obvious mitochondrial degeneration was present in the AD group, including mitochondrial swelling, hypertrophy, pykenosis, and crista fragmentation, as well as vacuolar degeneration (Fig. 6n, o).
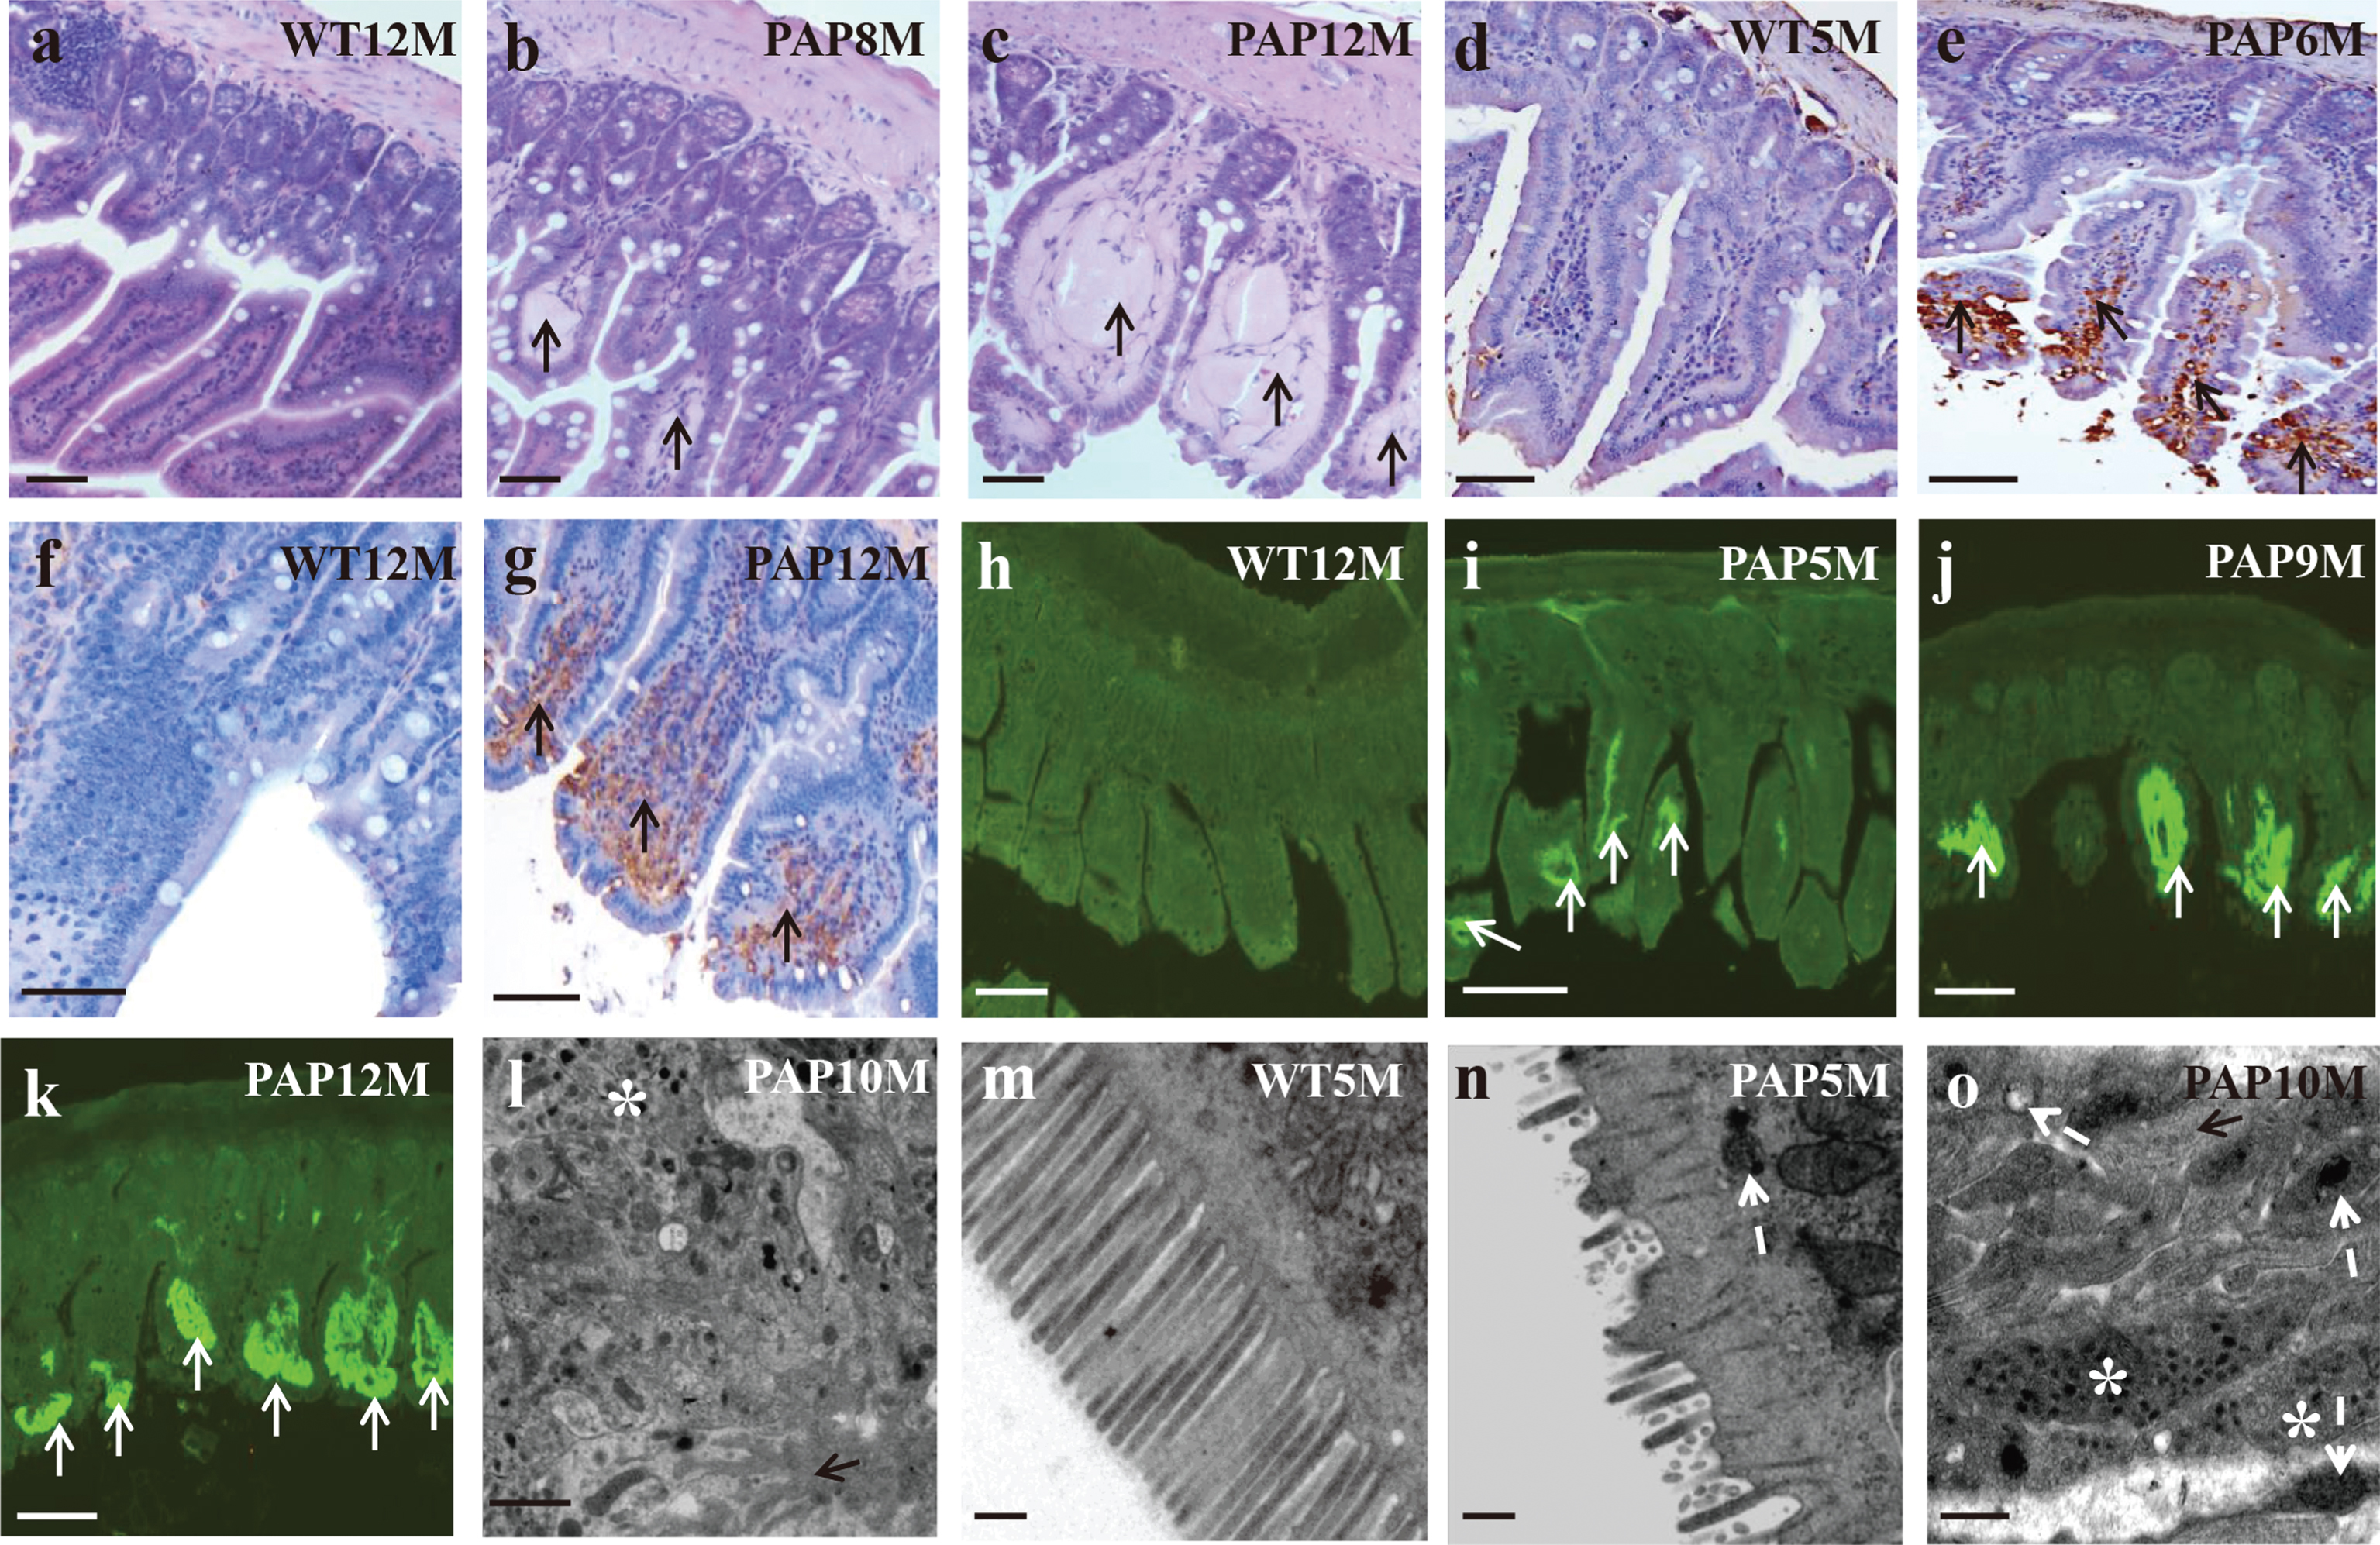
Morphological and ultra-microstructure of intestine. (a-c) reveal amyloid deposition in AD mice to H&E staining; (d, e) to 4G8 immumohistochemical staining; (f, g) to anti-Aβ1–42 immumohistochemical staining; (h-k) to thioflavine T staining; (l) shows an amyloid plaque and surrounding autophagosome in brain of 10-month-old AD model mice; (m, n) shows the ultrastructure of microvilli in 5-month-old mice; (o) the ultrastructural abnormality in intestine of AD model mice. ↑, amyloid deposition; *, autophagosome; white arrow, mitochondria. Scale: (a-e):100 μm; (f): 50 μm; (g): 100 μm; (h-k): 50 μm; (l): 1 μm; (m-o): 500 nm.
DISCUSSION
The present study compared the fecal microbiome and SCFAs of WT and AD model mice at different ages. We found that the diversity and microbiota composition changed especially at 8–12 month of age. Overall, the abundance of Verrucomicrobia and Proteobacteria was dramatically increased, whereas Ruminococcus and Butyricicoccus were significantly decreased in 8–12-month-old AD mice compared with age-matched WT controls. Notably, the abundance of B. pullicaecorum, a butyrate producer with probiotic potential, was reduced in AD mice. Meanwhile, the functional analysis predicted butanoate/pyruvate metabolism was altered in AD mice. Consistent with this finding, concentrations of the SCFAs, including butyric acid and isobutyric acid, were lower in both feces and brain in AD mice. Interestingly, the level of butyric acid in brain correlated positively with that in feces. Additionally, amyloid deposition and ultrastructural abnormalities were observed in AD intestine as early as five months.
Based on the above-mentioned overall results, this discussion will emphasize (1) the significant alteration of gut microbiome on the level of phylum, genus, and species with age, with comparison of the similarities and differences in relation to earlier research and prediction of altered function likely associated with age-related changes in microbiome; (2) the changes of gut microbiome in AD mice and the possible function/effects of the altered gut microbiota according to our bioinformatic analysis; (3) speculation about the possible cause of the altered gut microbiome in AD mice.
Emerging evidence indicates a link between gut microbiome with aging and age-related diseases. While human studies provide clinically relevant insight, mouse models are (due to their potential controllability), valuable for researching the association between gut microbiome and host health or disease. Thus, we use the most widely-used mouse AD model to characterize alterations of gut microbiota in AD mice reared under controlled conditions. Our results are consistent with previous data that Firmicutes and Bacteroidetes are the top dominating phyla in mouse gut, and there are clear differences in gut microbiota composition between young and adult mice, thus suggesting there may be some parallel shifts occurring in aging human and mouse [46]. Unlike in some previous reports, we found that Proteobacteria was the third most abundant phylum in mice, but had a tendency to decrease in abundance with age. Notably, Verrucomicrobia was dramatically increased at the older mouse group, especially in the AD model transgenic mice. Studies in humans have shown age-related declines in the abundance of Eubacteriaceae, i.e., Faecalibacterium, Lactoba cillus, and Bifidobacterium. We found virtually no Eubacteriaceae within any of our mouse stool samples, and no difference in the proportions of Faecalibacterium and Lactobacillus across age, in accordance with the data of Langille et al. [46]. These species-disparate findings could be due to characteristic differences in the murine and human microbiomes, or could arise due to confounding effects of diet or habitat change in the study of elderly humans. We indeed noted that the genus Bifidobacterium had relatively high abundance in 1-month-old WT mice, but with no significant difference between AD and WT groups. Additionally, our data revealed that the relative abundance of Oscillospira, Roseburia, Bacteroides, Coprococcus, Ruminococcus, and Paraprevotella were higher in older mice, irrespective of genotype. Abundance of R. gnavus was increased and P. distasonis decreased in the older WT and PAP mice. As KEGG analysis predicted, these age-related changes in microbiome may have effects on diverse processes, including cell growth and death, the immune system, metabolism, DNA translation, replication and repair, cellular processes and signaling, as well as protein folding, sorting, and degradation [3]. Any of these changes may be factors influencing the aging phenotype, with potential effects in the central nervous system.
Moreover, we found distinct differences in gut microbiota in AD and WT mice. On the phylum level, the abundance of Proteobacteria in 5-6-month-old AD mice was double that in WT controls. Proteobacteria have been reported to have an association with immunological reactions and inflammation, which are two known factors relating to AD pathogenesis [48]. Park et al. indicated that rearing of mice with a Western-style diet plus rifaximim treatment induces a significant dysbiosis with a bloom of Proteobacteria and ileal inflammation [49]. Moreover, an increase of Proteobacteria has also been described in irritable bowel syndrome (IBS), which is itself associated with an increased risk of dementia [50].
The newly identified phylum Verrucomicrobia was dramatically increased by 6-fold in 8–12-month-old AD mice relative to age-matched controls. Verrucomicrobia possess several unusual features, such as the presence of a eukaryotic-like tubulin and a functional SOS response [51]. But interest in this phylum has grown in recent years due mainly to metagenomics analyses revealing its association with several eukaryotic hosts. Indeed, Verrucomicrobia is reported to play a significant role in the adaptability of the human gut microbiome, and Sait et al. has found that it is even capable of pathogenic activity toward an invertebrate host [52]. We now report that Akkermansiamuciniphila (A. muciniphila), belonging to Verrucomicrobia, had relatively high abundance in older AD mice. In the normal gastrointestinal tract, this species degrades mucin and oligosaccharides, to produce SCFAs, respectively, which are carbon sources for aerobic energy metabolism in the host, and also promote colonization of the bacterium. The presence of A. muciniphila in the gut is negatively associated with obesity and intestinal inflammatory diseases (IBD) [53]. However, another report showed increased populations of A. muciniphila in patients with ulcerative colitis-associated pouchitis [54]. Concentrations of A. muciniphila were also significantly increased in fecal samples from colon cancer patients [55]. All this considered, we suppose that A. muciniphila-induced mucin degradation will increase intestinal mucosa permeability, with potential consequences for cognitive function propagating through the brain-gut axis.
LEfSe analysis displayed three bacterial taxa (Erysipelotrichi Class, Erysipelotrichales Order, and Erysipelotrichaceae Family) to be differentially represented in 8–12-month-old AD mice. The Erysipelotrichi class of bacteria within the Firmicutes phylum has been reported to increase in mice reared with western diet and in human cases of IBD [56, 57]. A similar increase in Erysipelotrichales has been found in mice reared on a high-fat diet. Magnusson and colleagues have provided evidence that an increase in this order can impact cognition [58], thus possibly contributing to the cognitive deficits in AD. On the other hand, Buffington et al. revealed that Erysipelotrichales abundance moderated against maternal diet-induced social and synaptic deficits in offspring [59], indicating a complex role of Erysipelotrichi in cognitive function.
Compared with age-matched controls, the 8–12-month-old AD mice had significantly decreased Ruminococcus and Butyricicoccusalbus populations. Among species that could be identified, Desulfovibrio C21_c20 was increased in 5-6-month-old AD mice, and B. pullicaecorum was reduced in 8–12-month-old AD mice. Ruminococcus is another organism considered to modulate mucin expression or degradation, with effects on IBD [60]. In particular, R. gnavus ATCC 29149 and ATCC 35913 strains have been demonstrated to use terminal mucin glycans to degrade mucin, similarly to Akkermansia, whereas strains such as R. gnavus E1 were shown to increase the expression of mucin and the intestinal glycosylation level, thus representing a beneficial bacterial strain for the host [61 –63]. As noted above, R. gnavus was increased in older WT and AD mice, but metagenomic analysis would be necessary to ascertain if there are relevant strain differences in WT and AD mice.
We are particularly struck by the decrease abundance among AD mice in B. pullicaecorum, a butyrate producer with probiotic potential [64]. In recent years, B. pullicaecorum abundance was reported to be reduced in human IBD patients, which itself an increased risk of dementia [46]. Furthermore, inoculation with B. pullicaecorum remarkably rescued intestinal injury in IBD patients, seemingly through increased production of butyrate [64, 65]. Indeed, it is clear that butyrate, by virtue of its HDAC inhibition, is poised to exert potent neuropharmacological effects on synaptic function in AD [66 –68]. Our present PICRUSt analysis predicted that AD mice hosted more microbial functions in relation to the butyrate metabolite butanoate. This elevated metabolism is apt to decrease cerebral butyrate levels, which may be a factor compromising cognition in AD.
Recently, Brandscheid et al. [69] analyzed the whole bacterial phyla and other four bacteria (Akkermansia muciniphila, the genus Bifidobacterium, Escherichia coli, and the Clostridium leptum group) by PCR amplification in another AD model, namely 5xFAD mice. They found no difference between 5xFAD and WT mice in populations of several bacteria, i.e., the Bifidobacterium and Escherichia coli. On the other hand, they did observe other changes at the age of nine weeks of age; the amount of Firmicutes and the Clostridium leptum group was increased in the 5xFAD model mice while Bacteroidetes were decreased in comparison to the WT littermates. In line with present findings, another recent report showed Ruminococcus to be significantly decreased in APP/PS1 mice. However, that study also reported the abundance of Helicobacteraceae and Desulfovibrionaceae at the family level; Odoribacter and Helicobacter at the genus level and Coriobacteriaceae increased significantly in APP/PS1 mice compared to WT mice, while Prevotella abundance decreased [70]. It is beyond dispute that the gut microbiota is inherently diverse, and its composition changes due to various factors, including, but not limited to the specific AD model, experimental method, breeding environment, even regional differences. As such, it is important to identify general principles relating gut flora to AD models. Furthermore, we consider it noteworthy that Cattano and colleagues recently revealed an association between pro-inflammatory gut bacterial taxa and peripheral inflammation markers as well as brain amyloidosis in cognitively-impaired elderly subjects [71]. In particular, they found increased abundance of Escherichia/Shigella, and reduced abundance of an anti-inflammatory taxon, Eubacteriumrectale, in stool of AD patients, which we did not observe in the present mouse study. This may reflect species differences between mice and humans, or could reflect diverse confounding factors such as diet, weight, gender, habitat, emotional state, living habits, medication status, or comorbid diseases in the clinicalstudy.
Concerning the possible role of gut microbiota in the AD clinical course, we might suppose that perturbed gut microbiota was not a primary defect leading to AD, but arose secondary to systemic factors such as amyloidosis, and then contributed to the cognitive impairment of AD. The transgenic AD model mice used in the present study are known to display impairments in spatial learning and memory, first evident at 3 months of age, and progressing thereafter [72]. Whereas the present AD mouse strain exhibits the first discernible cerebral amyloid deposition at 4-5 months of age [72], we detected Aβ deposition in the intestinal villous stroma at 5 months of age. The later amyloid deposition in AD intestine may be caused by the mutant APP gene. In the present study, the amyloid deposition and ultrastructural injury of intestinal tract was first seen at 5 months of age, coincident with onset of distinct differences in fecal microbiota of the AD mice. Thus, we speculate that structural and functional abnormalities in the intestine may influence in turn the colonization and homeostasis of intestinal flora. Population changes of certain taxa might independently exacerbate cognitive defects through their effects on specific metabolic pathways, notable when there is a net reduction in SCFA levels. Certainly, much work is needed to verify this hypothesis and clarify the relationship between microbiome alteration and AD. We present preliminary evidence for a mechanism by which microbiome changes in an AD mouse model may propagate to cognitivedysfunction.
Footnotes
ACKNOWLEDGMENTS
This work was supported by National Science Fund for Young Scholars (No. 81500938) and PUMC Youth Fund, Fundamental Research Funds for the Central Universities (No. 3332015151), and a grant (No.2016-I2M-1-010) from CAMS Innovation Fund for Medical Sciences (CIFMS). We also wish to sincerely thank Medjaden Bioscience Limited for the valuable advice in the writing of the article.