
Abstract
Higher body mass index (BMI) at midlife is associated with greater decreases in cognitive function at older age as well as increased Alzheimer’s disease (AD) risk, compared to those with normal BMI. Here, we tested whether BMI at midlife was associated with cortical thinning in brain regions known to be affected in early AD. We examined a large sample (n = 404) of midlife individuals (44–49 years) from the PATH population-based study. Individuals were scanned with magnetic resonance imaging (1.5T) on up to three occasions over eight years. Change in cortical thickness was modeled as a linear function of BMI and change in BMI longitudinally. Being obese was associated with thinner right frontal cortex at baseline (44–49 years). Across all individuals, increasing BMI over the 8-year study period was associated with increased cortical thinning in posterior cingulate bilaterally, as well as right lingual gyrus, anterior cingulate, and the peri-calcarine sulcus. Accelerated age-related cortical atrophy at midlife, particularly in posterior cingulate, is consistent with increased risk of AD in individuals with high BMI at this age. The findings suggest that management of body weight at midlife could reduce the risk of AD.
INTRODUCTION
Recent evidence suggests overweight or obesity in midlife is associated with lower cognition [1, 2] and an increased risk for dementia and Alzheimer’s disease (AD) at later life [3, 4]. One mechanism through which obesity might amplify AD risk is by worsening cerebral atrophy [5], as cerebral atrophy is a feature of dementia [6, 7].
A growing body of human and animal studies suggests that BMI is associated with brain atrophy. At midlife, higher hip-to-waist ratio was associated with greater decline in total brain volume [2], and across the lifespan, higher BMI (measured at one time-point) was associated with extensive cortical thinning [8]. In elderly individuals, findings have been mixed. For example, Raji et al. found higher BMI was associated with lower brain volumes in overweight and obese elderly subjects [5], whereas Albanese et al. found no association between midlife overweight and obesity and total brain volume at later life [9]. Given animal studies suggest that obesity has an even greater impact on oxidative stress and inflammatory processes at older age [10], contradictory associations between BMI and brain health in the elderly may be due to complicating factors including the impact of age-related pathology on BMI.
Taken together, animal studies support the link between BMI and brain atrophy, and in humans the relationship may change over the lifespan or be obscured by other factors in later life. In order to understand the link between midlife obesity and AD risk, it is therefore important to study longitudinal brain atrophy within a healthy midlife group of individuals. In this prospective community-based study, we investigated cortical thinning in association with BMI, as well as changes in BMI, in a large group (n = 404) of 44–49 year olds scanned up to three times over eight years with magnetic resonance imaging (MRI) with BMI measured at each time-point. We hypothesized that cortical thickness would be lower in overweight and obese individuals at baseline, and that the extent of cortical atrophy would be greater with increasing BMI, particularly in regions known to be vulnerable in AD. Our overall goal is to understand whether BMI is associated with neurodegenerative processes that underlie the increased risk of AD in association with higher BMI at midlife.
MATERIAL AND METHODS
Study population
Participants were sampled from the Personality and Total Health through Life (PATH) project, a large population-based longitudinal study of aging aimed at investigating the course of mood disorders, cognition, health and other individual characteristics across the lifespan [11]. PATH surveyed 2,530 individuals, aged 40–44 years at baseline, who were residents of the city of Canberra and the adjacent town of Queanbeyan, Australia, and who were randomly recruited through the electoral roll (enrolment to vote is compulsory for Australian citizens). The study was approved by the Australian National University Ethics Committee and all participants provided written informed consent. Follow-up is approximately every four years. For midlife participants, MRI data was available beginning at the second wave of data collection and is referred to here as the ‘baseline MRI’. There were two follow-up scans (here referred to as ‘second MRI’ and ‘third MRI’) with a mean follow-up time between scans of 4.0±0.1 years such that the total follow-up time was 8.0±0.1 years.
Of the 2,530 PATH participants aged 44–49 included in the study at baseline, 2,354 were assessed at the second assessment when MRI were first conducted. A randomly selected subsample of 656 participants was offered an MRI scan and 431 were eventually scanned.
Of these, 29 scans were excluded due to epilepsy (6), stroke (6), or failed Freesurfer processing that could not be corrected (17), leaving 402 participants. Of the 431 participants scanned at baseline MRI, 324 were rescanned for the second MRI. Of these, 3 scans were lost and 19 were excluded due to epilepsy (4), stroke (5) or failed Freesurfer processing (10), leaving 302 participants with a second MRI. Of the 324 participants with a second MRI, 282 were rescanned for the third MRI. Of these, 2 scans were lost, 19 were excluded due to epilepsy (3), stroke (4), or failed Freesurfer processing (12), leaving 261 participants with a third MRI. Our final analyses were based on 405 participants, including 402 participants scanned at baseline (46% male, age range: 44.7–49.8 years), 302 participants with a second MRI (46% male, age range: 48.6–53.9 years), and 261 participants with a third MRI (46% male, age range: 53.2–58.3 years).
BMI and health measures
BMI (kg/m2) was computed with the formula weight/height2 based on self-report of weight and height. For one wave of data collection, waist circumference measurements (taken by an interviewer) were available and were found to be highly correlated with BMI (r = 0.77, p < 1e-10), suggesting that self-reported weight and height were reliable. At each measurement, changing BMI was the difference between current and previous BMI measurements, as a percentage of the previous BMI measurement divided by the time between measurements (% change/year). The presence of systemic hypertension was defined as a mean systolic blood pressure >140 mmHg or diastolic blood pressure >90 mmHg, or the use of antihypertensive medication. Physical activity was assessed by self-report hours of average weekly activity, categorized as mild (e.g., walking), moderate (e.g., cycling), and vigorous (e.g., running). Different activity levels were combined using the formula (mild PA x1)+(moderate PAx2)+(vigorous PAx3) based on evidence that moderate PA for typical activities expends about twice the energy as mild PA and vigorous PA expends 3 times [12]. Smoking (current), depression symptomatology, stroke status, and type 2 diabetes mellitus status were assessed byself-report.
MRI scan acquisition
T1-weighted three-dimensional structural MRI scans were obtained using 1.5T MRI scanners. For the baseline MRI, scans were acquired using a Philips Gyroscan ACS-NT scanner (Philips Medical Systems, Best, The Netherlands) in coronal orientation using a fast-field echo sequence. For the first 164 participants, repetition time (TR/TE/flip_angle/slice_thickness) = (8.84 ms/3.55 ms/ 8°/1.5 mm) and matrix size 256×256. For the remaining 268 participants (TR/TE/flip_angle/slice_thickness) = (8.93 ms/3.57 ms/8°/1.5 mm) with matrix size 256×256 and voxel size 1×1×1.5 mm. For the second MRI, scans were acquired using a Siemens Avanto scanner with (TR/TE/flip_angle/slice_thickness) = (1.16/4.17 ms/15°/1 mm), matrix size 256×256 and voxel size 1×1×1 mm. For the third MRI, scans were acquired using a Siemens Espree scanner with (TR/TE/flip_angle/slice_thickness) = (1.16/4.24 ms/15°/1 mm), matrix size 256×256 and voxel size 1×1×1 mm.
Image processing
Further image analysis was carried out using FreeSurfer v5.3, including the estimation of the cortical surfaces and the cortical thickness for each participant [13]. Processing quality control was implemented through an in-house script which identified outlier scans based on total gray and white matter volumes. These scans were visually checked and if confirmed to have failed Freesurfer processing, removed from further analysis (numbers provided in study population). We used the longitudinal FreeSurfer pipeline, where a within-subject template is created, which allows equal treatment of all input images, thus limiting processing bias associated with the use of a particular time-point as the reference image [14]. Thickness estimates were orthogonalized with respect to a scanner covariate, to remove scanner-specific variance that might confound estimates of age-related change in thickness, as outlined in more detail elsewhere [15, 16]. Surface-based spatial smoothing was applied to the wave-corrected data (12 mm FWHM).
Linear mixed effects modeling within ROIs and across the cortical surface
We used linear mixed effects (LME) modeling, as implemented recently in Freesurfer, to investigate the longitudinal association between BMI and cortical thickness [17]. Cortical thickness was assessed point-wise across the cortex as well as averaged within regions of interest. LME is a standard analysis approach for longitudinal data and correctly models the mean and covariance structure of repeated measures within participants and across assessments. The temporal covariance structure was assumed to be shared across vertices within homogenous regions of interest [18].
We used two models. For the first model, change in cortical thickness was modeled as a linear function of BMI (up to three measures per individual, over eight years), with separate slopes and intercept terms for normal weight (BMI = 18.5–25), overweight (BMI = 25–30), and obese (BMI > 30) individuals and controlling for age, age2, sex, diabetes status, depression, smoking, hypertension, physical activity, and intra-cranial volume (ICV). For the second model, we modeled change in cortical thickness with change in BMI over eight years, with intercept terms for normal weight (BMI = 18.5–25), overweight (BMI = 25–30), and obesity (BMI > 30). Change in BMI was modeled as two separate variables reflecting decreasing and increasing scores while controlling for age, age2, sex, diabetes status, depression, smoking, hypertension, physical activity, and ICV. Both the subject-specific intercept and age were modeled as random effects. The analyses were carried out across the whole cortical surface (∼300K vertices). Because we hypothesized increased thinning with increasing BMI (based on previous literature), we defined vertices as significant if they reached p < 0.05 with a one-sided (negative) FDR correction. We also modeled mean cortical thinning within regions of interest, selected based on significant surfaced-based results, using the same LME model.
RESULTS
Demographic and clinical characteristics of the participants at the time of the baseline MRI are presented in Table 1. A single individual was underweight (<18.5 kg/m2) and was excluded from analysis. There were no differences between the study sample and the original PATH sample in mean age, race, BMI, gender balance, or proportion of smokers or diabetics, although the study sample had fewer years of education and a lower rate of hypertension. Within the study sample, females were more likely to be normal weight and less likely to be overweight. Obese individuals had slightly less education and were more likely to have diabetes than individuals in the normal weight range and they were also more likely to have hypertension compared to the whole study sample.
Demographic and health characteristics for individuals within the whole PATH sample at baseline MRI, as well as within the study sample for all individuals (all) and subgroups of individuals with normal BMI (NW) as well as overweight (OW) and obese (OB) individuals. Highlighted cells denote significant differences as outlined in the results section
At baseline, 153 individuals were in the normal weight range (18.5–24.99 kg/m2), 156 were overweight (25–30 kg/m2), and 95 were obese (>30 kg/m2). The longitudinal association between BMI and age showed significantly increasing BMI with age (B = 0.08 kg/m2/year, F (322) = 19.2, p < 0.001). 205 individuals had a mean positive BMI change and 134 individuals showed stable or declining BMI.
Mean thinning across the whole cortical surface: Age, BMI, and BMI status
Within BMI categories, mean cortical thinning across the whole cortical surface showed a trend toward being greater in obese individuals, compared to those with normal weight (F (929) = 3.32, p = 0.07). For obese individuals, annual thinning rate was 0.25% (95% confidence interval, 0.10–0.40%), compared to 0.18% (0.03–0.33%) for individuals with normal weight and 0.20% (0.05–0.34%) for overweight individuals. Over all individuals, there was a trend toward higher BMIs being associated with increased cortical thinning (p = 0.18) such that, over the 8-year year follow-up, there was a 2.7% increased thinning for every point increase in BMI above 25 kg/m2.
Thinning across the cortical surface and within regions: Age, BMI, and BMI status
Being obese was associated with lower cortical thickness in the right medial superior frontal gyrus at the baseline measurement (44–49 years) (Fig. 1, Table 2). There were no regions with significant thinning in association with BMI over time; however, there were a number of regions showing a significant association between increasing BMI and cortical thinning, including the posterior cingulate bilaterally, as well as the right lingual gyrus, anterior cingulate, and the peri-calcarine sulcus (Table 2, Fig. 2). Mean cortical thinning within the right posterior cingulate (Fig. 3), in association with increasing BMI, was 0.008 mm per 1% change in BMI per year (95% confidence interval, 0.0005–0.016 mm/% BMI change/year). Figure 4 shows a projection, based on coefficients from the mixed-effects model, of how increasing BMI might be associated with cortical thinning from age 44 years until age 54 years, both for hypothesized individuals with 0.5% increase in BMI over ten years and also for hypothesized individuals with 5% increase in BMI (Fig. 4). Individuals with 5% increase in BMI had approximately twice as much cortical thinning over ten years, compared those with 0.5% increase.

Significance map (F) for cortical thickness difference between obese individuals and individuals with normal weight at midlife, controlling for age, age2, sex, diabetes status, depression, smoking, hypertension, physical activity, and ICV. Significant regions of thickness difference (p < 0.05, one-sided FDR corrected) are listed in Table 2.
The association between baseline cortical thickness and BMI classification (top) as well as the longitudinal association between cortical thinning over eight years (mm) with increasing BMI (% /year), controlling for age, age2, sex, diabetes status, depression, smoking, hypertension, physical activity, and ICV (p < 0.05, one-sided FDR corrected). LHS/RHS = left and right hemisphere, max. F = maximum F statistic. Note that the (unsigned) F statistics have been multiplied by the sign of the parameter estimate
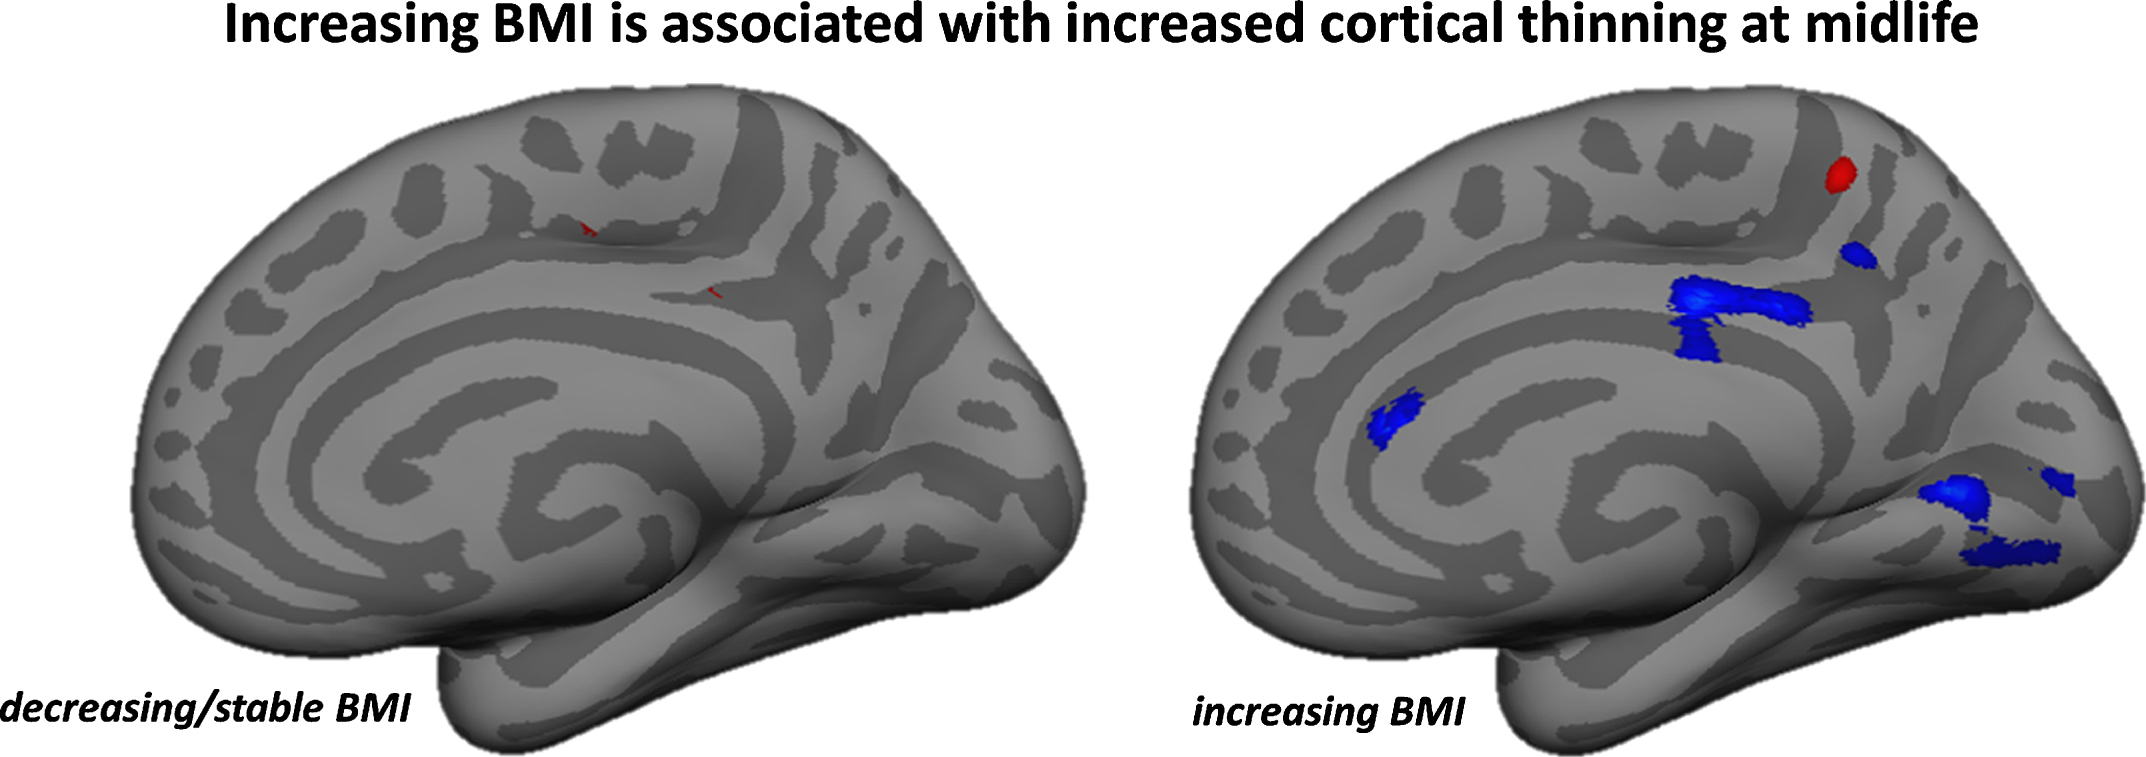
Significance maps of regions with increased cortical thinning in association with increasing BMI, controlling for age, age2, sex, diabetes status, depression, smoking, hypertension, physical activity, and ICV (p < 0.01, uncorrected). Significant regions of thinning (p < 0.05, one-sided FDR corrected) are listed in Table 2.
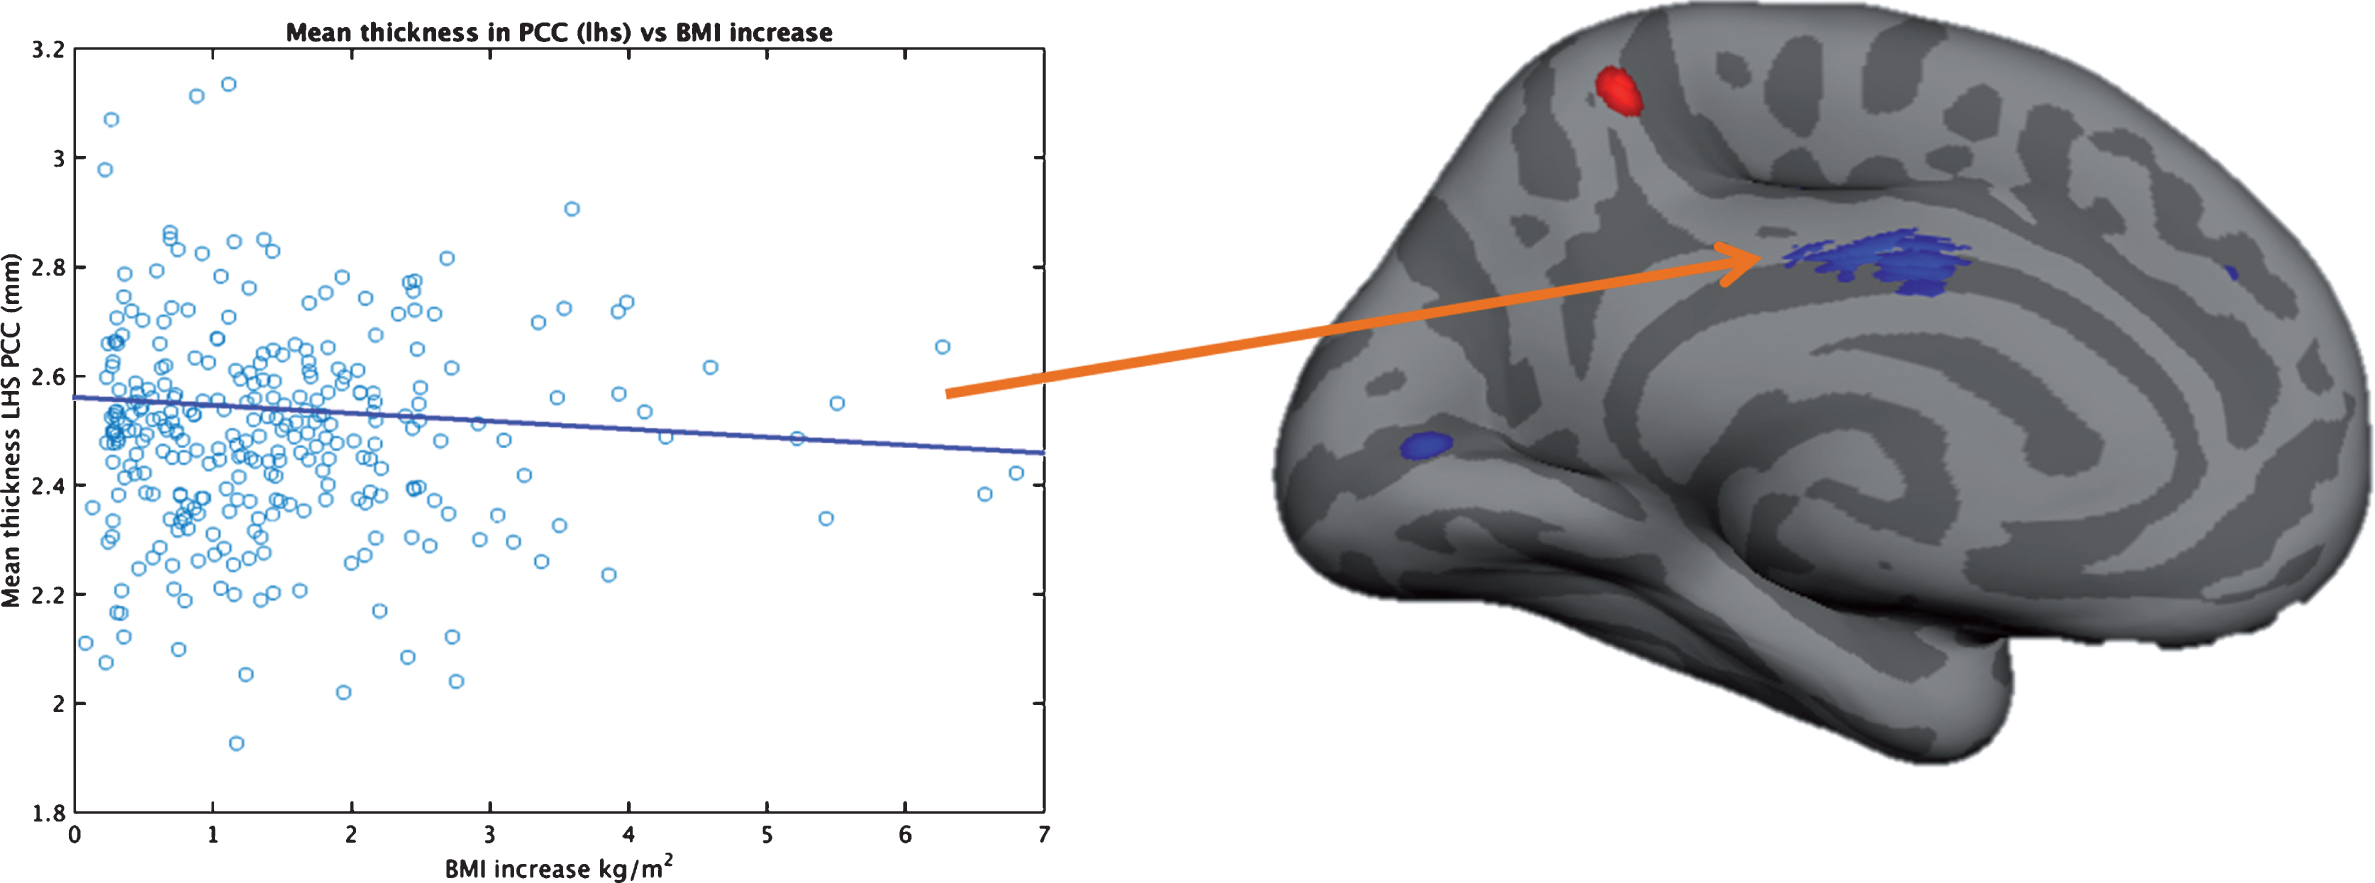
Significance map (p < 0.01 uncorrected) of regions with decreasing cortical thickness with increasing BMI over 8 years at midlife (44–49 years at baseline). The plot shows decreasing cortical thickness with increasing BMI in the posterior cingulate. Outliers were identified with multivariate Mahalanobis distance measurement (p < 0.05) and removed.

Schematic of change in cortical thickness in posterior cingulate over 10 years for 0.5% increase in BMI (over 10 years) versus 5% increase. Projection is based on mixed-effect model estimates including the 95% confidence interval for age-related cortical thinning (shaded).
DISCUSSION
Here we present novel evidence that individuals with increasing BMI at midlife show increased brain atrophy in AD-vulnerable regions. This association may underlie, at least partly, the link between high BMI at midlife and increased risk of AD (and earlier onset), compared to individuals with normal BMI. Most notably, BMI-related atrophy was observed in the posterior cingulate (bilaterally), which has been extensively studied as one of the first brain regions affected by AD and has been shown to have early neurofibrillary tangles [19], abnormal metabolism [20], abnormal connectivity [21], and reduced volume [22] in AD. AD-related change in posterior cingulate cortex is thought to affect learning and memory, key features of early AD [20]. Increasing BMI at midlife was also associated with atrophy in right lingual gyrus, anterior cingulate, and the peri-calcarine sulcus. A recent cross-sectional study by Medic et al. also found a negative association between anterior cingulate thickness and BMI, which they postulated might have relevance for reward evaluation and decision control in obesity [23].
We found that being obese was associated with thinner frontal cortex at baseline. Although other studies have found evidence of cortical atrophy in frontal cortex associated with obesity [24, 25], the current study is the first to show that obesity-related differences in cortical structure are already evident at midlife. Across the time-frame of our 8-year study, we measured an additional 0.008 mm thinning per 1% change in BMI per year in the posterior cingulate. Based on these estimates, we projected that an individual with 5% increase in BMI over 10 years would have almost twice the cortical thinning in posterior cingulate as an individual with 0.5% BMI increase (shown schematically in Fig. 4).
The mechanisms underlying the link between BMI and neurodegenerative processes leading to brain atrophy are not well understood. Excess adipose tissue is thought to play a role, perhaps via adipocyte-produced hormones and pro-inflammatory cytokines (interleukin 6, for example) that are known to cross the blood-brain barrier [9]. Interestingly, obesity has been associated with tauopathy in a mousemodel [26] and AD-related brain atrophy has been shown to reflect tau-related neurodegeneration [19, 27]. Of relevance to the current findings, one of the first regions affected by tau-related neurodegeneration is the posterior cingulate [19]. It is possible that BMI directly contributes to the development of tauopathy, one of the two proteinopathies associated with AD pathology [7], or alternatively, BMI may be associated with non-specific atrophy that raises an individual’s risk profile for AD.
One limitation of the current study is the fact that our study sample is not representative of the general population. We used a random sample from a large group of study participants who consented to be contacted regarding an MRI scan (n = 2,076). The study participants had a relatively high level of education and social-economic status [11], which may result in lower atrophy estimates than would be expected in a less educated cohort. Furthermore, as is common with large, longitudinal imaging studies, different scanners and different scan parameters were used across waves of data collection (outlined in methods), although a robust and published method was used to effectively control for these effects [15, 16] and we have previously shown that, in this sample, scanner model did not bias measurement of cortical thickness [16]. Another limitation of the current work is that body weight and height were obtained by self-report, although recent work in a large sample of older participants found strong correlations between measured and reported height and weight data [28] and the self-reported weight and height measurements in the current study were highly correlated (r = 0.77) with waist circumference measures taken by an independent interviewer at one wave of data collection. One notable strength of the current study is that we examined BMI change across the BMI spectrum including normal weight (32% of individuals studied), overweight (31%), and obese (27%) individuals. Because obesity is an established risk factor for hypertension and cardio-metabolic health (although we controlled for these factors here), a relationship between BMI and cortical atrophy across the BMI spectrum gives greater evidence that the effects observed are indeed due to BMI. Another strength of the current study is the relatively large number of participants within a tight age-range, imaged using a longitudinal design over an 8-year follow-up. We used analysis techniques specifically designed for the optimal analysis of longitudinal neuroimaging data. Finally, although a study of healthy participants always involves the possibility that undetecteddisease in the study population will bias outcomes, we have extensive measures of the cognitive and physical health of our participants. Although we did not use the mini mental state examination (as the rate of cognitive impairment in this age group and demographic was expected to be very low), we have removed any participants with a history of stroke, epilepsy, or Parkinson’s disease.
Taken together, we provide novel evidence that BMI-related atrophy is already evident at midlife and that BMI-related atrophy at midlife occurs in AD-vulnerable brain regions, an association that may underlie the link between high BMI at midlife and increased risk of AD. Studies to determine the impact of BMI on age-related brain atrophy are important for understanding whether BMI is a modifiable risk factor for cognitive decline and dementia.
Footnotes
ACKNOWLEDGMENTS
The authors are grateful to Peter Butterworth, Simon Easteal, Helen Christensen, Patricia Jacomb, Karen Maxwell, and the PATH interviewers. This work was supported by NHMRC grant No. 973302, 179805,350833 157125, ARC grant No. 130101705, and the Dementia Collaborative Research Centres. NC is funded by ARC Fellowship No. 12010227 and KA by and NHMRC Fellowship No.1002560. This research was partly undertaken on the National Computational Infrastructure facility in Canberra, Australia, which is supported by the Australian Commonwealth Government.