
Abstract
Body weight loss in late-life is known to occur at a very early stage of Alzheimer’s disease (AD). Apolipoprotein E4 (ApoE4) represents a major genetic risk factor for AD and is linked to an increased cortical amyloid-β (Aβ) accumulation. Since the relationship between body weight, ApoE4, and AD pathology is poorly investigated, we aimed to evaluate whether ApoE4 allelic status modifies the association of body mass index (BMI) with markers of AD pathology. A total of 368 Aβ-positive cognitively healthy or mild cognitive impaired subjects had undergone [18F]-AV45-PET, [18F]-FDG-PET, and T1w-MRI examinations. Composite cortical [18F]-AV45 uptake and [18F]-FDG uptake in posterior cingulate cortex were calculated as surrogates of cortical Aβ load and glucose metabolism, respectively. Multiple linear regressions were performed to assess the relationships between these PET biomarkers with BMI, present cognitive performance, and cognitive changes over time. Multivariate analysis of covariance was conducted to test for statistical differences between ApoE4/BMI categories on the PET markers and cognitive scores. In carriers of the ApoE4 allele only, BMI was inversely associated with cortical amlyoid load (β= –0.193, p < 0.005) and recent cognitive decline (β= –0.209, p < 0.05), and positively associated with cortical glucose metabolism in an AD-vulnerable region (β= 0.145, p < 0.05). ApoE4/BMI category analyses demonstrated lower Aβ load, higher posterior cingulate glucose metabolism, improved cognitive performance, and lower progression of cognitive decline in obese ApoE4 carriers. The effect of ApoE4 in promoting the accumulation of cortical amyoid, which may itself be a driver for weight loss, may be moderated by altering leptin signaling in the hypothalamus.
INTRODUCTION
Declining body weight in late-life is known to be associated with early stages of Alzheimer’s disease (AD) and other dementias, occurring several years prior to the onset of overt cognitive symptoms [1–7]. Later-life weight loss has been also associated with mild cognitive impairment (MCI) [8], which is considered a prodromal stage of AD [9], having an annual conversion rate as high as 10% [10]. Low initial body mass index (BMI) in late life and recent weight loss are two factors that significantly increase the risk of progressing from MCI to dementia [11]. The reasons for the association between MCI/dementia and low body weight in late life are not fully understood.
The neurodegenerative process underlying AD is characterized by intracerebral accumulation of amyloid-β (Aβ) plaques and neurofibrillary tangles, which together represent the core histopathological hallmarks of the disease [12]. One of the major genetic risk factors for the disease is possession of one or more E4 alles of the apolipoprotein, i.e., ApoE4 [13, 14], which occurs in up to 60% of AD-patients [15]. In MCI subjects, the presence of ApoE4 is associated with greater impairments in memory and functional activities [16] and an increased risk of progression to AD [17]. The presence of ApoE4 is also linked to an increased Aβ accumulation and aggregation in the brain and is associated with cerebral glucose hypometabolism, which together constitute core pathologies of AD [18]. The causative mechanism is unknown, but ApoE4 plays an important role in physiological processes relevant to lipid metabolism, suggesting complex pathways by which the ApoE4-allele may contribute to the development of AD-pathology (reviewed in [19]).
The Aβ burden in brain of AD patients and subjects with MCI can be detected and quantified in vivo by positron emission tomography (PET) using specific Aβ binding radioligands such as [18F]-AV45 [20–22]. Moreover, PET imaging with 2-[18F]fluoro-2-deoxy-D-glucose (FDG) enables the detection of an AD-specific pattern of reduced cerebral metabolic rate of glucose; impaired energy metabolism, which is indicative of reduced neuronal activity, typically encompasses the parietotemporal, posterior cingulate, and medial temporal and/or frontal cortices of AD patients [23]; the extent of glucose hypometabolism bears a direct relationship with disease severity [24]. Reduced glucose metabolism in AD-typical regions also occurs in MCI patients who are at the cusp of conversion to AD [25].
Given the role of ApoE4 in the regulation of lipid metabolism, one might predict some relationship between ApoE4 status and adiposity. However, little is known about the relationship between BMI, ApoE4, and AD pathology. Previously published data has suggested an association between lower BMI and markers of increased AD burden in cognitively normal elderly and MCI individuals [26]. A more recent study by Hsu et al. conducted in clinically normal older individuals reported that lower baseline BMI in late-life is associated with greater cortical Aß burden, and that this relationship is modified by ApoE4 carrierstatus [27]. Considering the significance of ApoE4 as a major genetic risk factor for AD, we aimed to investigate in the current study the extent to which ApoE4 modifies the relationship between BMI and AD pathology in late life. To this end, we availed ourselves of data from a large cohort of Aß positive, but cognitively healthy individuals and also MCI cases in the Alzheimer’s Disease Neuroimaging Initiative (ADNI) database. The rationale for including Aβ positive cases only was based on the considerable risk of these individuals for progression to clinically manifest AD. Biomarkers of AD pathology included the degree of brain amyloidosis and brain glucose metabolism, as well as cognitive performance at baseline and cognitive changes over a period of three years.
METHODS
Alzheimer’s disease neuroimaging initiative
Data used in the preparation of this article were obtained from the Alzheimer’s Disease Neuroimaging Initiative (ADNI) database (http://adni.loni.usc.edu). The ADNI was launched in 2003 as a public-private partnership, led by Principal Investigator Michael W. Weiner, MD. The primary goal of ADNI has been to test whether serial magnetic resonance imaging (MRI), PET, other biological markers, and clinical and neuropsychological assessment can be combined to measure the progression of MCI and early AD. Data from ADNI-1, ADNI-GO, and ADNI-2 were included in this work as available on March 31, 2015.
Subjects and study data
The study group consisted of 368 Aβ positive cognitively normal or MCI subjects who had undergone standard [18F]-AV45-PET, [18F]-FDG-PET, and T1w-MRI within the framework of ADNI. Subjects’ Aβ positivity was defined according to the SUVR threshold of ≥1.10, a score deriving from the ADNI database. This cut-off represents the upper 95% confidence interval of the cortical mean in a sample of young, healthy subjects and was thus proposed as an objective criterion for quantitative classification of Aβ positive and negative cases using [18F]-AV45-PET [21]; this threshold has been further validated in histopathology studies, which confirm its fitness to detect moderate to dense neuritic plaque deposition with an excellent degree of sensitivity (97%), specificity (100%), and accuracy (98%) [28]. Further subject data obtained from ADNI included age, gender, education level (y), ApoE4 status as well as body weight and height as recorded at the time of imaging. We also obtained the Alzheimer’s disease Assessment Score (ADAS; score 0–70), a measure of cognitive function, as evaluated at the time of imaging and at follow-up. The BMI was calculated as each subject’s weight in kilograms divided by height in meters squared.
For the purpose of statistical analyses, subjects were stratified according to their ApoE4 status or as well as to their joint ApoE4 status and BMI. Subjects carrying one or two ApoE4-alleles were deemed ApoE4 positive (ApoE4(+)), and those without an ApoE4-allele were classified as ApoE4 negative (ApoE4(–)). In accordance with the Word Health Organization (WHO) criteria, subjects with a BMI <25 kg/m2 were classified as having low or normal weight, those with a BMI 25–30 kg/m2 as being overweight, and those with a BMI >30 kg/m2 as being obese. Following this initial assignment, we created six combined categories for the ApoE4/BMI stratification: (1) ApoE4(–) & BMI <25, (2) ApoE4(+) & BMI <25, (3) ApoE4(–) & BMI 25–30, (4) ApoE4(+) & BMI 25–30, (5) ApoE4(–) & BMI >30, and (6) ApoE4(+) & BMI >30 (see Table 1 for demographics).
Demographics of the Aβ positive study group
The bottom row gives the statistical significance of differences in age, gender, education, and cognitive performance (ADAS) in the contrast between ApoE4(+) and ApoE4(–) study participants, with correction of the the p-value for ADAS for age. n.s., non-significant.
Image data
Pre-processed brain [18F]-AV45-PET, [18F]-FDG, and temporally corresponding T1-weighted MPRAGE images were downloaded from the ADNI database.
ADNI [18F]-AV45 [18F]-FDG PET acquisition and pre-processing
PET data had been acquired using Siemens, GE, and Philips PET scanners according to standard dynamic protocols following the intravenous injection of 370±37 MBq of [18F]-AV45 (50–70 min p.i.) and 185±18.5 MBq of [18F]-FDG (30–60 min p.i.), respectively. Correction was performed for both scatter and measured attenuation, which was determined using the CT scan for PET/CT scanners or a transmission scan with [68Ge] or [137Cs] rotating rod sources for PET-only scanners. Images were reconstructed using scanner-specific algorithms and sent to the University of Michigan, where they were reviewed for artifacts and, upon approval, transmitted to the Laboratory of NeuroImaging (LONI) forstorage.
Downloaded [18F]-AV45 and [18F]-FDG PET images in DICOM format had been preprocessed in four steps: 1) motion correction by co-registration of single 5 min frames; 2) time frame averaging; 3) reorientation in a standardized 160×160×96 matrix with 1.5 mm cubic voxels; 4) smoothing with a scanner-specific filter function to an isotropicresolution of 8 mm.
ADNI MRI acquisition and pre-processing
T1-weighted MRI scans had been acquired using Siemens, GE, or Philips MRI scanners according to a standard protocol [29] involving acquisitions of two 3D MPRAGE imaging sequences per subject. Of the two sequences acquired per subject and time-point, the ADNI quality assurance team selected the better data set for preprocessing, based on the presence and severity of commonly occurring image artifacts. MRI pre-processing involved: 1) application of a scanner-specific correction for gradient nonlinearity distortion (Gradwarp) [30]; 2) correction for image intensity non-uniformity (B1) [29]; 3) histogram peak sharpening algorithm for bias field correction (N3) [31]; 4) application of spatial scaling factors obtained by phantom measurements. For MRI data acquired on Philips scanners, B1 correction was already implemented, and the gradient systems with this instrument tended to be linear [29].
Image processing and analysis
The processing of the ADNI MRI and both PET data sets, including quality control procedures as well as a volume-of-interest (VOI)-based partial volume effect correction (PVEC), was performed automatically in PNEURO (V3.5, PMOD technologies, Basel, Switzerland) as previously described in detail by Brendel et al. [32, 33]. In brief, T1-weighted MRI data were co-registered to the corresponding PET images (linear co-registration) and to the Montreal Neurology Institute (MNI) standard space (nonlinear co-registration), and also segmented in native space into gray matter, white matter (WM), and cerebrospinal fluid. MRI derived segmentations were co-registered to the corresponding PET images for PVEC, and the PVE-corrected PET images were then spatially normalized to the MNI space, in which VOI-based analyses were performed using the atlas of Hammers [34]. For [18F]-AV45 PET analyses, an individual standard uptake value (SUV) was determined for a composite (COMP) VOI consisting of frontal, parietal, temporal, and posterior cingulate cortices; the COMP VOI SUV was then scaled relative to the SUV in subcortical WM to calculate an individual SUV ratio (SUVR). For [18F]-FDG PET analyses, an individual SUVR was calculated by scaling the posterior cingulate cortex (PCC) VOI SUV relative to the whole cerebellum (CBL) SUV. Thus, our two PET biomarkers were COMP/WM [18F]-AV45 SUVR for cortical Aβ deposition and PCC/CBL [18F]-FDG SUVR for glucose metabolism in PCC, which is the metabolically most-compromised region in AD. The subjects (N = 18) for whom automatic PET processing failed were excluded prior to the study based on earlier experience with the dataset [32].
Statistical data analysis
In a first statistical model using multiple linear regression, we investigated the relationships between BMI and PET biomarkers, cognitive performance, and changes of cognitive performance over time (% Δ ADAS per year) as a function of ApoE4 status. In a second model, we conducted a multivariate analysis of covariance (MANCOVA) to test for statistical differences between the six combined ApoE4/BMI categories with respect to PET biomarkers and cognitive performance (ADAS). In order to test for category effects on change of cognitive performance in the longitudinal run, we performed an additional ANCOVA. For analyses of cognitive change over time, we used the first and last ADAS evaluation of each participant, including only those subjects with at least two years between baseline testing and the last available ADAS-score. This yielded a total of 259 subjects, with mean time to follow-up of 3.30±0.84 years.
All statistical analyses were controlled for age, gender, and education level (y) as covariates. Statistical data was computed with SPSS, version 23.0 (IBM, Chicago, IL). We considered results statistically significant for p < 0.05.
In order to also obtain a possible timecourse of BMI changes in our study population, participants were grouped according to their ApoE4 status, neurodegeneration status (as measured by PCC/CBL [18F]-FDG SUVR), and cognitive performance; please see Supplementary Material for further details.
RESULTS
ApoE4 carriers versus non-carriers
There were no statistically significant differences in gender or education level between ApoE4 carriers and non-carriers (p > 0.05), but ApoE4 carriers were significantly younger (p < 0.005, Table 1). After adjustment for age, the ApoE4(+) subjects had in comparison to ApoE4(–) participants a significantly increased cortical Aβ burden ([18F]-AV45 SUVR: +12.5%, 0.99±0.19 versus 0.88±0.22, p < 0.001), a decreased PCC glucose metabolism ([18F]-FDG SUVR: –4.35%, 1.32±0.15 versus 1.38±0.13, p < 0.001), a higher baseline ADAS-score (+26%, p < 0.001, Table 1), increased ADAS-score changes over time (1.82±2.83% versus 0.86±2.68% per year, p < 0.01), and a lower baseline BMI (–6.55%, 26.54±4.99 versus 28.40±5.79 kg/m2, p < 0.001).
Relationship between BMI and Markers of AD Pathology according to ApoE4 Status
In ApoE4(+) subjects, BMI was inversely associated with cortical amlyoid load (β= –0.193, p < 0.005) and positively associated with glucose metabolism in the PCC (β= 0.145, p < 0.05), suggesting that higher BMI moderates against pathologically alterated biomarkers of AD otherwise attributable to ApoE4-positivity. A trend towards greater cognitive deficits was observed among ApoE4(+) subjects with lower BMI (β= –0.126, p = 0.068). In the longitudinal run, lower baseline BMI was associated with more substantial cognitive decline in the ApoE4(+) subjects (β= –0.209, p < 0.05). There were no significant relationships between BMI and PET biomarkers or cognitive performance in the ApoE4(–) group (p > 0.05). Figure 1 illustrates the associations of BMI with cortical amlyoid load (A), PCC glucose metabolism (B), cognitive performance (C), and changes of cognitive performance (D) in ApoE4 carriers by means of partial regression plots.
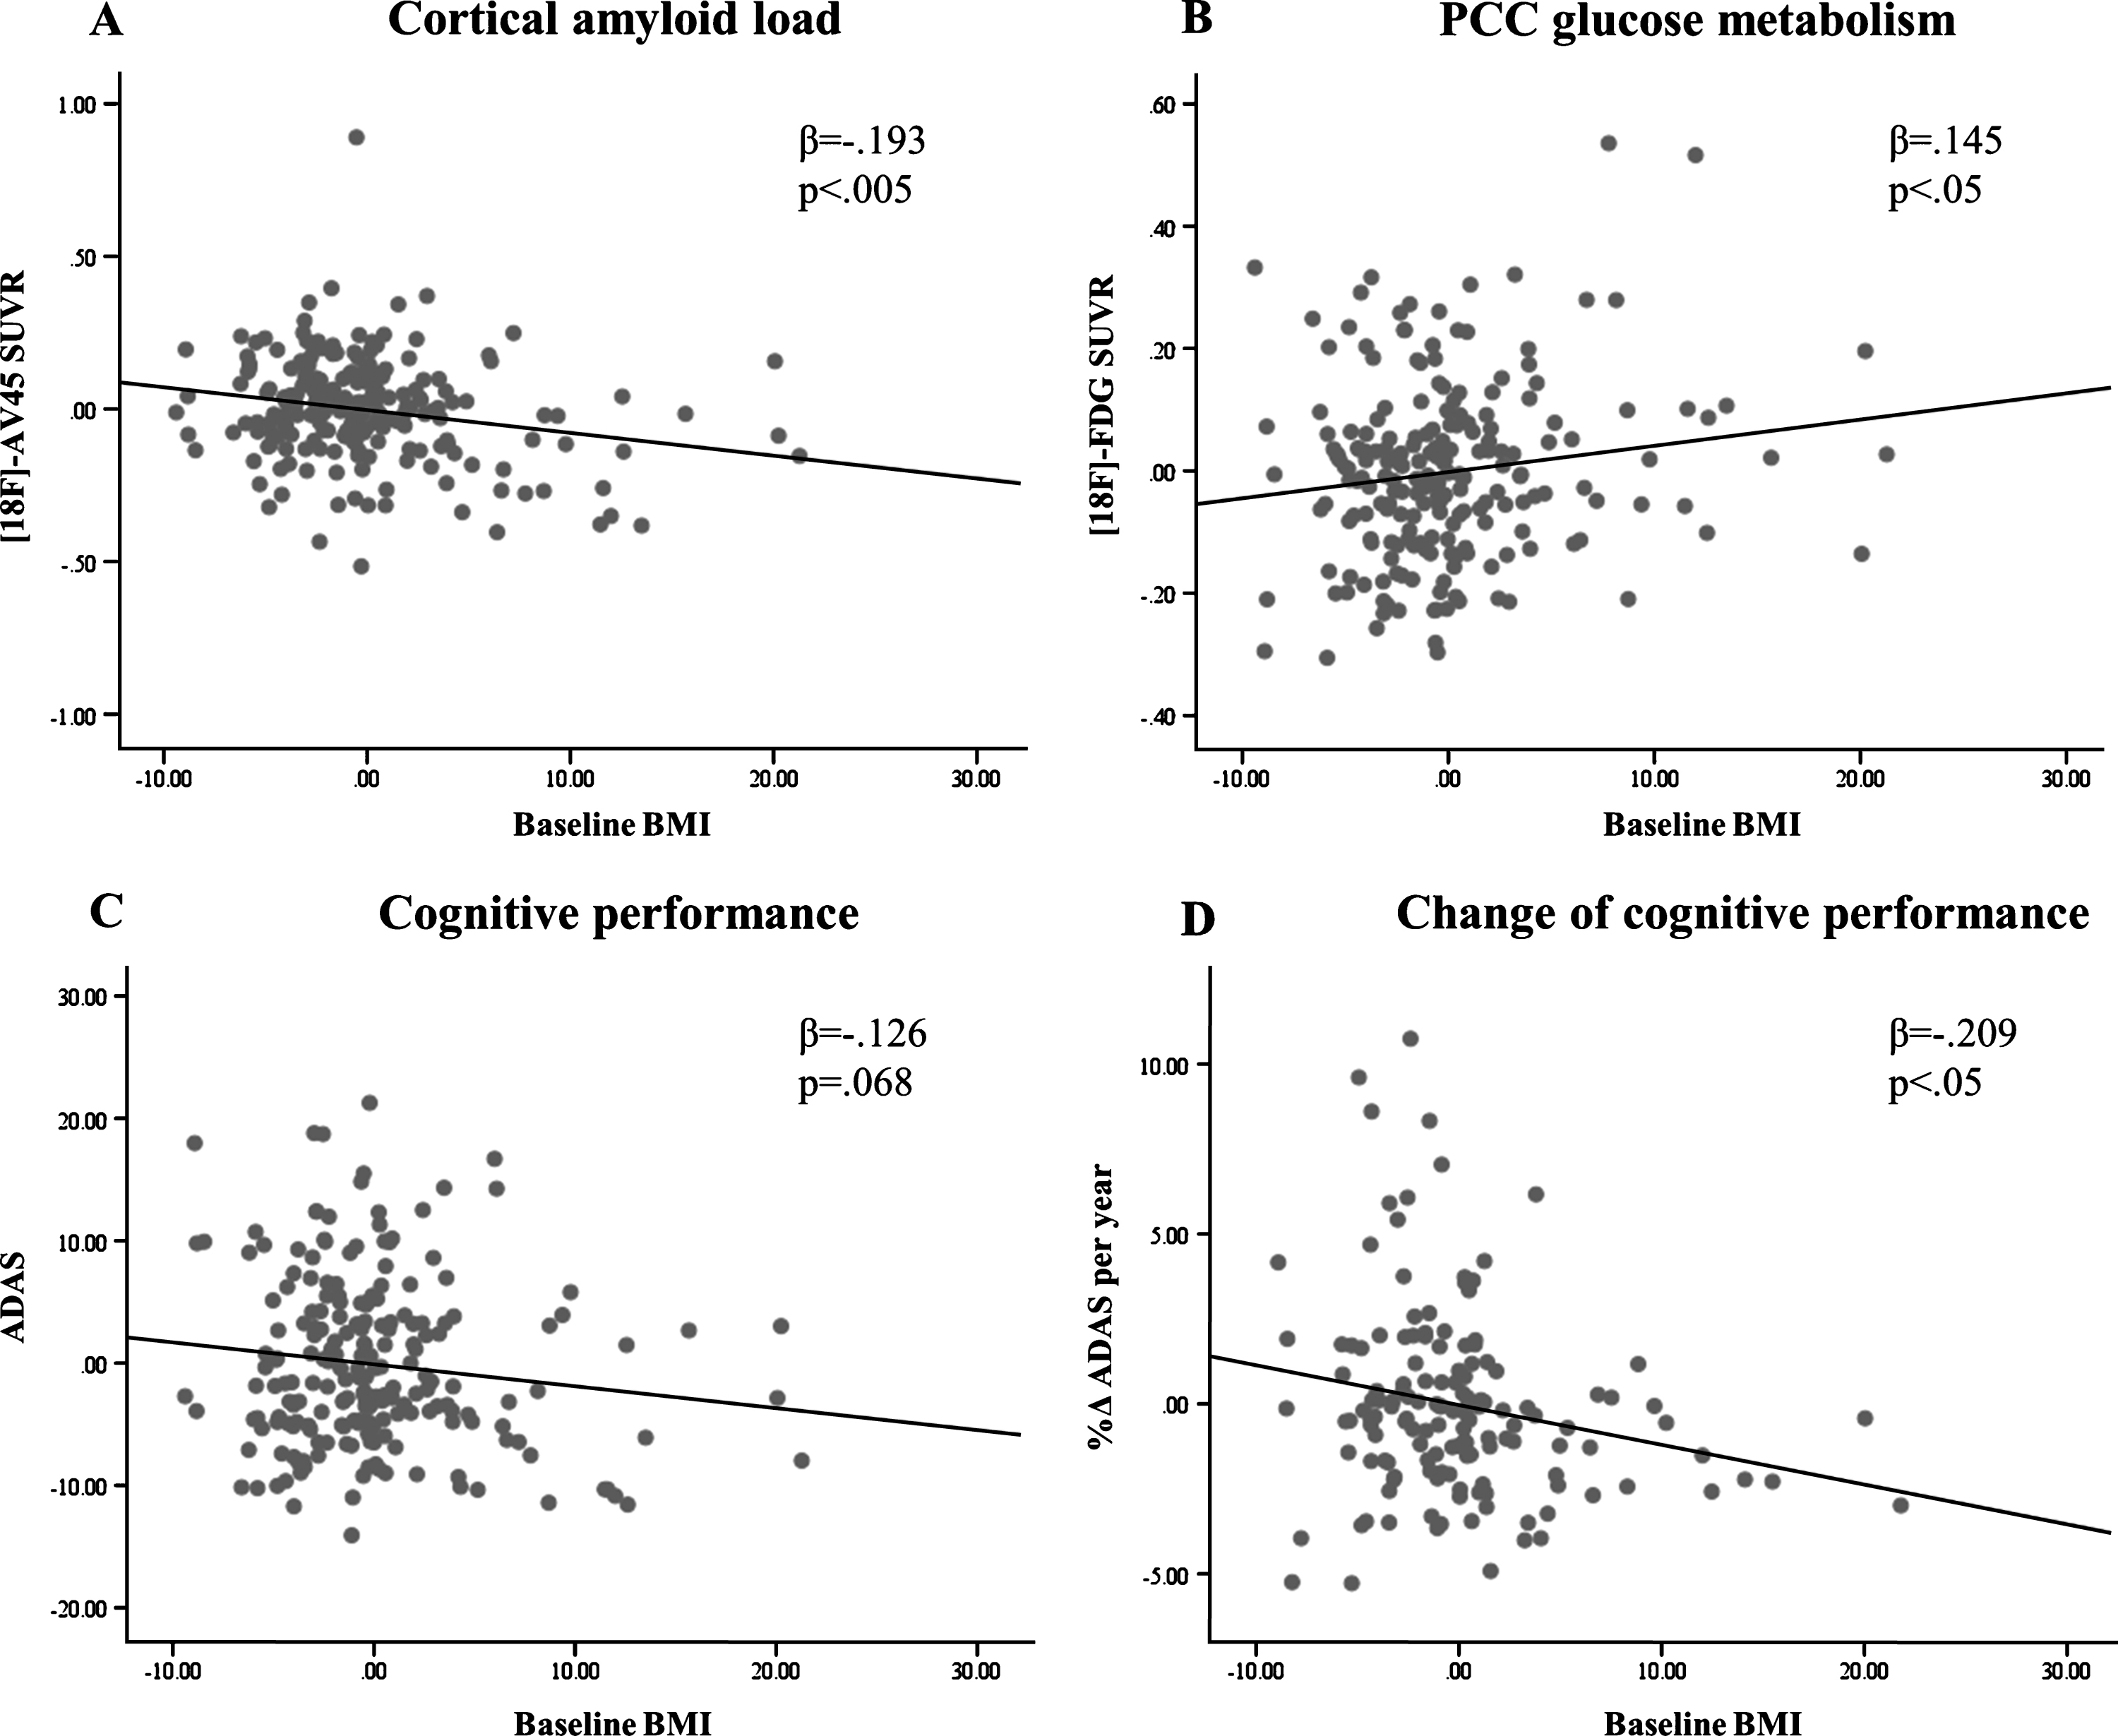
Partial regression analyses for BMI and PET biomarkers, cognitive performance as well as change of cognitive performance over time in ApoE4(+) subjects (controlled for age, gender, and education).
ApoE4/BMI category effects on markers of AD pathology
The ApoE4/BMI categories had a statistically significant effect on COMP/WM SUVR (F (5, 359) = 12.52; p < 0.001; partial η2 = 0.15), PCC/CBL SUVR (F (5, 359) = 4.62; p < 0.001; partial η2 = 0.06), and the ADAS score at baseline (F (5, 359) = 6.0; p < 0.001; partial η2 = 0.08). Among ApoE4 carriers, those classified as obese had lower Aβ-load when compared to those with a normal weight (p < 0.005) or the overweight group (p < 0.05), respectively (Fig. 2A, Table 2). Similarly, glucose metabolism within the PCC was increased in obese ApoE4(+) subjects in comparison with normal weight (p < 0.01) and overweight participants (p < 0.05) (Fig. 2B, Table 2). Cognitive impairment as measured by ADAS was less pronounced in the obese ApoE4(+) subjects when compared to the overweight ApoE4(+) group (p < 0.05), as tended to be lower than in normal weight participants (p = 0.065) (Fig. 2C, Table 2). In the longitudinal run, obese ApoE4 carriers had slower progression of cognitive deficits when compared to the normal and overweight groups (p < 0.05 each, Fig. 2D). There were no statistically significant differences between ApoE4(–) BMI groups in imaging parameters and ADAS scores (p > 0.05, Table 2). In the obese ApoE4(+) group, none of the four markers of AD pathology differed significantly from those in obese, over-weight, and normal-weight ApoE4(–) group (p > 0.05).
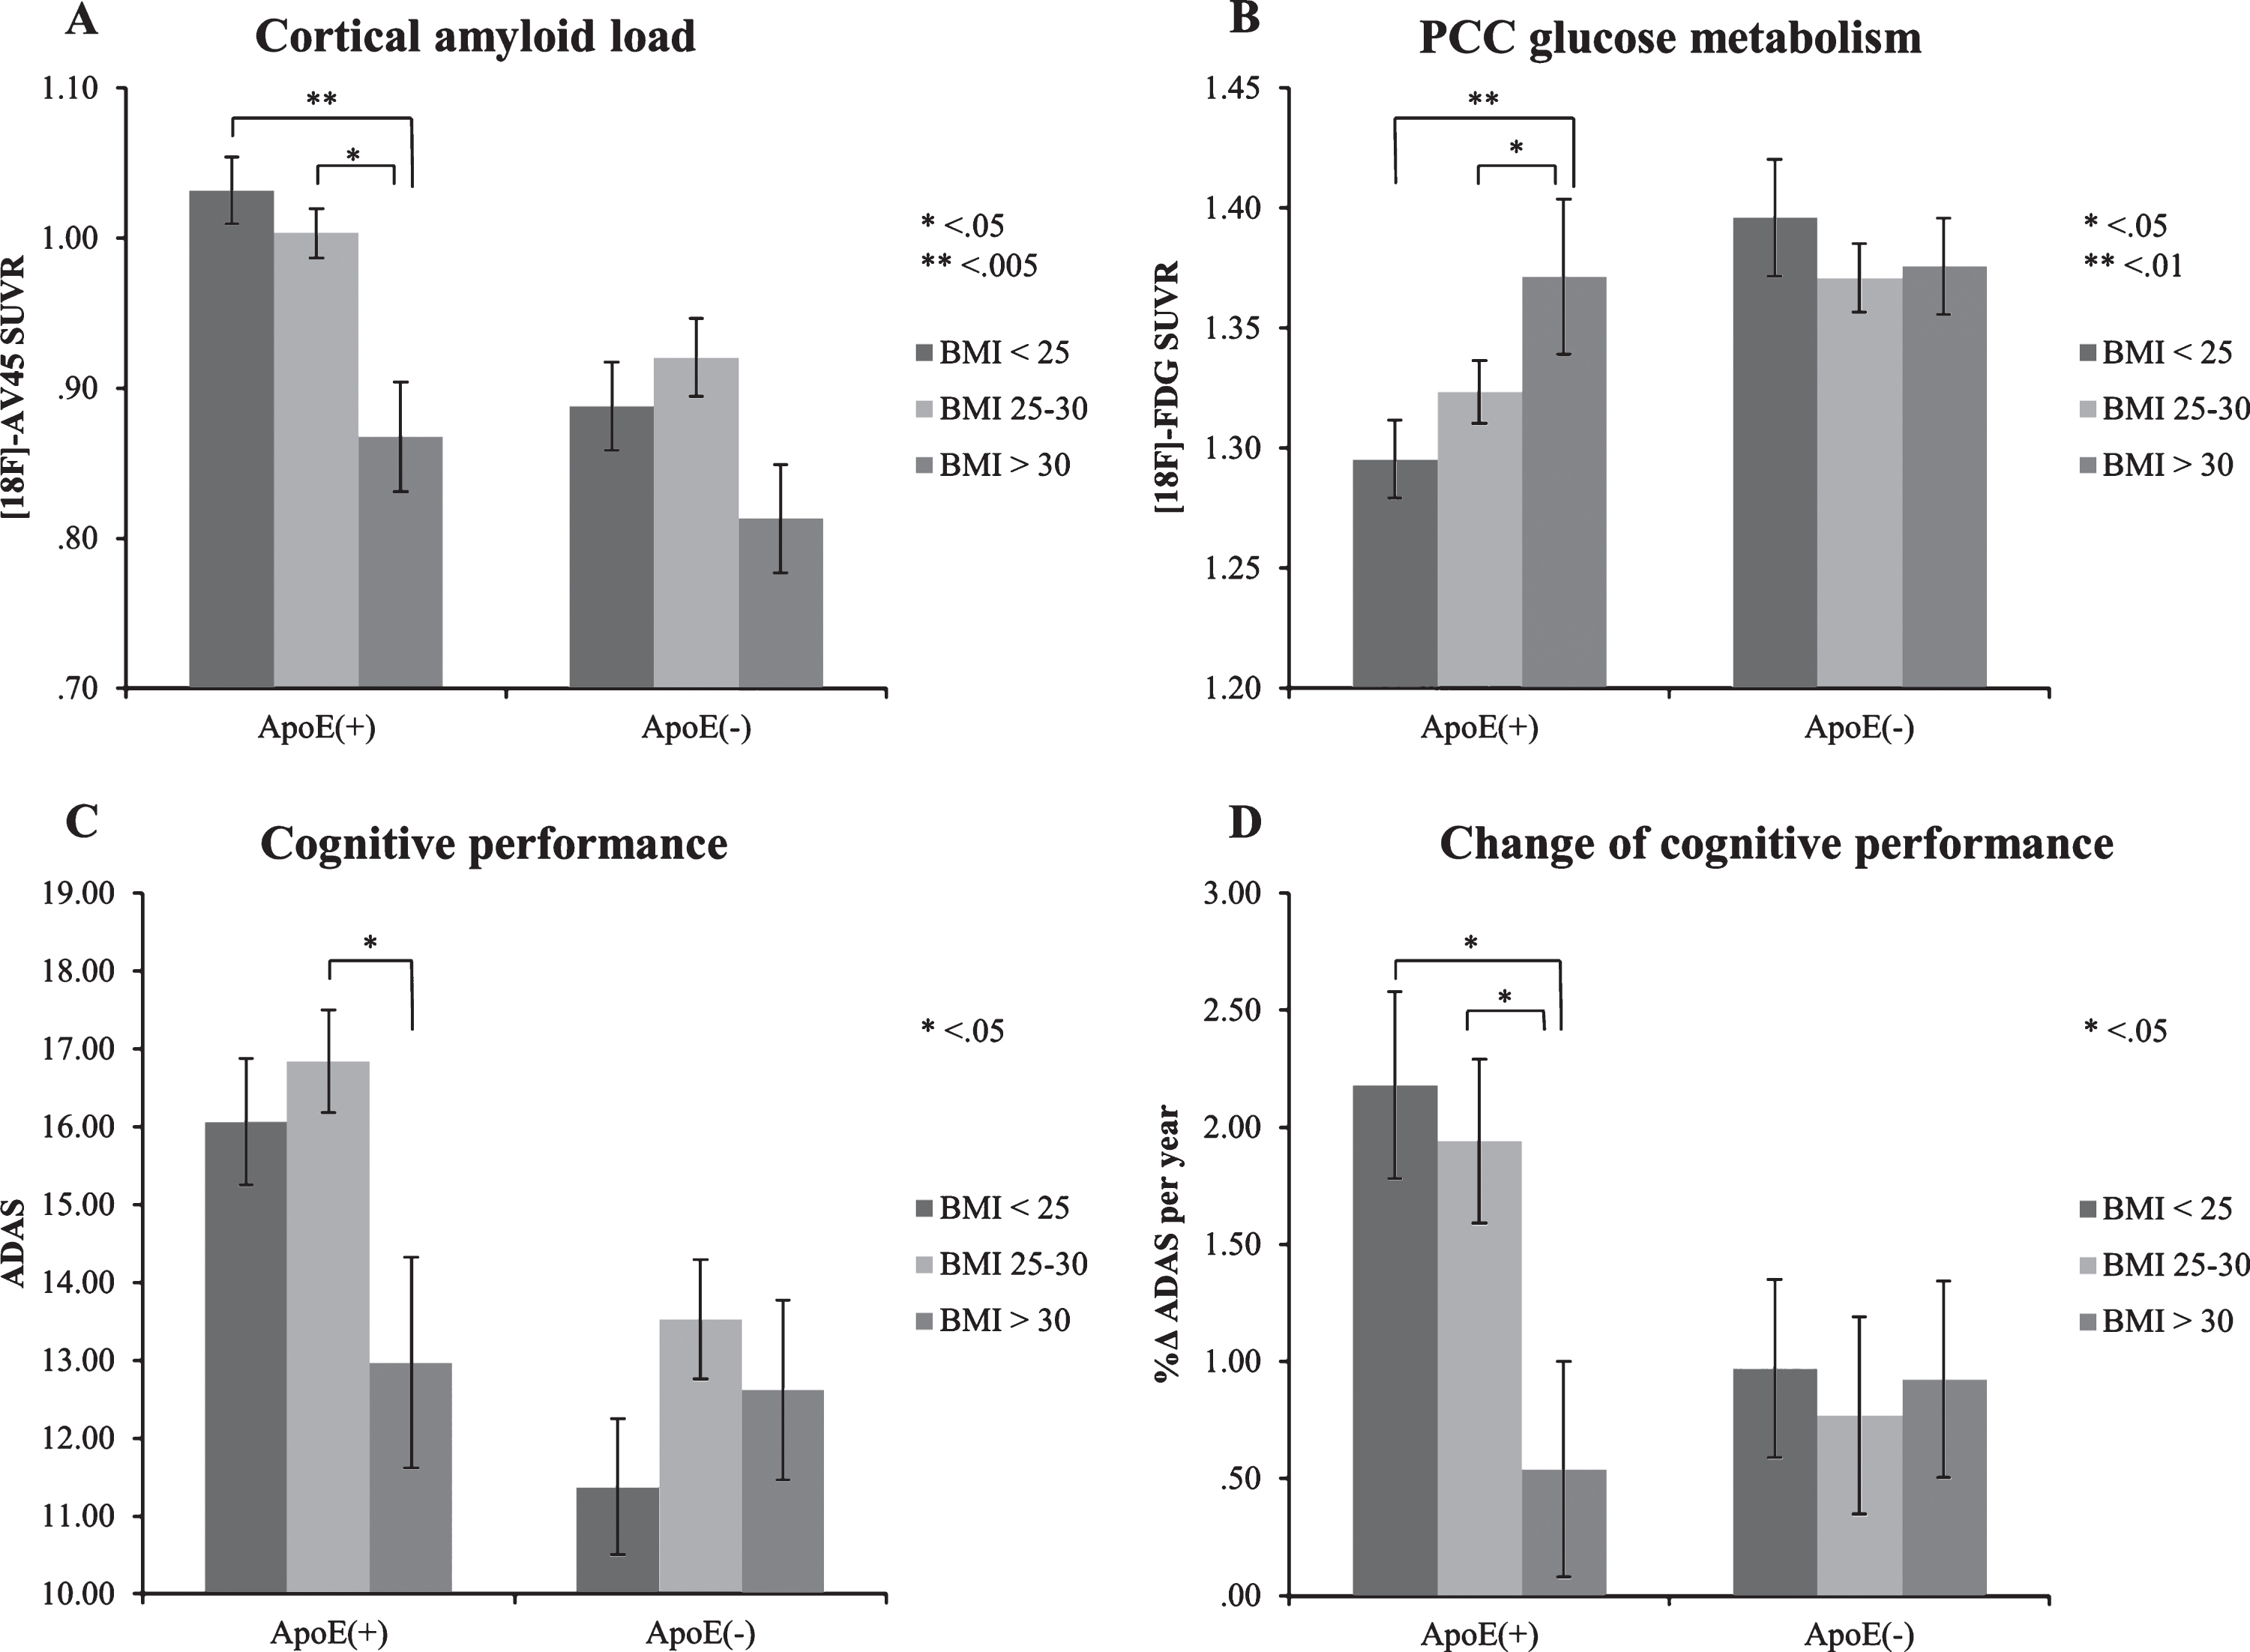
Effects of ApoE4/BMI categories on PET biomarkers, cognitive performance, and changes of cognitive performance over time (controlled for age, gender, and education). Bars depict mean±standard error of mean.
Mean values±standard deviation of AD pathology markers for ApoE4/BMI categories
DISCUSSION
We selected to study an ADNI cohort consisting of 368 cognitively normal and MCI subjects who were positive for Aβ PET, and thus at considerable risk for progression to clinically manifest AD. In this group, we found that late-life BMI is associated with biomarkers of AD pathology in ApoE4 carriers, but not in ApoE4 non-carriers. In particular, we found that obese ApoE4(+) subjects (BMI >30) had less cortical Aβ load and higher PCC glucose metabolism in comparison with those ApoE4(+) subjects who were simply overweight (BMI 25–30) or of normal weight (BMI <25). Likewise, the obese ApoE4 carriers also had superior cognitive performance at baseline and less cognitive decline over time. In contrast, there were no significant differences between BMI categories on markers of AD pathology in the ApoE4-negative group.
Modifying effect of ApoE4 on the relationship between BMI and AD pathology
The effect of ApoE4 status on the association between BMI and AD has not hitherto been investigated in detail. Among the few such studies, we note the work of Rajan et al. [35] and Hsu et al. [27]. Rajan and co-workers’ study, which was based on a cohort of older subjects including AD patients, showed that cognitive decline over time was more pronounced among ApoE4 carriers in comparison with ApoE4(–) subjects, irrespective of body weight category; however, the association between rate of cognitive decline and ApoE4 status was less pronounced in obese participants compared to those with a normal BMI, and the rate of cognitive decline in the obese ApoE4 carriers did not differ significantly from that in ApoE4(–) subjects of normal weight [35]. This is in line with the finding of our current work that the degree of cognitive decline, and the results of other markers of AD pathology, did not statistically differ between obese ApoE4 carriers and normal-weight ApoE4 non-carriers. Our findings also match the results from Hsu et al. who reported a modifying effect of the ApoE4 status on the relationship between BMI and the brain Aβ burden in late-life [27]. Extending upon both previous studies, we now show that ApoE4 carrier status modifies the relationship between BMI and markers of AD to a greater extent than previously indicated; the present markers include not only cognitive decline over time and the cortical Aβ load, but also current cognitive performanceand impaired cortical glucose metabolism in the brain region typically most affected in AD.
Possible Explanations for the Relation between AD Pathology and ApoE4 with BMI
In general, the relationship between AD and body weight in late-life is likely to be influenced by several factors. Depending on the stage of disease, the relevant factors include a hypermetabolic state, increased physical activity due to agitation typical of early AD, and (later in the disease progression) declining food consumption due either to depressive mood secondary to AD, or in relation to morphological and functional changes in brain structures that contribute to the regulation of appetite (reviewedin [36]). The net effect of these factors could plausibly be progressive weight loss in AD patients. Thus, one might speculate that our finding of an association between BMI and AD markers in ApoE4 carriers reflects mainly the severity of the (preclinical) disease in this group, i.e., subjects with advanced AD pathology, without having yet undergone cognitive decompensation, may already have experienced weight loss. Such individuals would naturally have a lower BMI at the time of measurement, whereas individuals at an earlier disease stage might be apt to have maintained their normal body weight, or indeed have remained obese. This brings us to a possible timecourse of BMI changes in ApoE4 carriers: here, our data indicate that in relation to non-carriers a slight BMI decrease is already present— although not at a significant level— in ApoE4 carriers classified as neurodegeneration-negative and cognitively normal; it further advances in those classified as neurodegeneration-positive and cognitively normal and eventually accelerates in subjects exhibiting both neurodegeneration and cognitive dysfunction, i.e., with advanced AD pathology (details in the Supplementary Material).
It still remains a question how ApoE4 status might contribute to this association. In this context, it has been previously established that the ApoE4 allele in particular promotes cerebral amyloidosis, which is one of the hallmarks of AD pathology, by somehow impairing the brain's capacity to eliminate soluble Aß [37]. In keeping with this scenario, we found a significantly increased Aβ burden in ApoE4-carriers compared to non-carriers in the ADNI population. Given the lack of association in ApoE4 non-carriers, this suggests that potential forcing of BMI changes by Aβ may only become manifest after exceeding aspecific threshold of cortical Aβ aggregation. Increasing Aβ burden in association with the transition to AD may lead to progressive BMI reductions due to non-specific effects on metabolic state, as speculated above. On the other hand, brain amyloidosis may also lead to weight loss by more specific pathways, for example, through effects on central signaling of the appetite-regulating adipokine leptin. This hormone is predominantly produced and secreted by adipose tissue, such that its plasma concentration is usually proportional to fat mass; the key central nervous system effect of leptin signaling lies in the control of food intake and energy-balance by inducing the sensation of satiety via action at leptin receptors on specific hypothalamic neurons [38]. Data from a transgenic mouse model show that Aβ has an inherent capacity to inhibit the function of these hypothalamic neurons, thus disabling the leptin signalling pathway with the consequence of promoting weight loss and a pathologically low leptin state [39]. In the present context, it is notable that leptin additionally exhibits a variety of neuroprotective effects, which include the promoting neurogenesis and synaptogenesis in the hippocampus, as well as attenuating of Aβ production and tau phosphorylation, while potentiating Aβ clearance (reviewed in [40]). Accordingly, an inverse relation for the risk of developing AD and other dementias with circulating leptin levels has been described [41]. Given this background and the present observations, we speculate that ApoE4 carriers may be subject to a process in which the accumulation of cortical Aβ promotes loss of body weight (via general AD pathology, or due to specific effects mediated by leptin signaling dysfunction). This speculation is corroborated by the finding that BMI was also significantly reduced in ApoE4 non-carriers with the largest cortical Aβ load (defined as COMP/WM SUVR >mean COMP/WM SUVR + 1.0 std) compared to those with the lowest cortical Aβ load (defined as COMP/WM SUVR <mean COMP/WM SUVR –1.0 std; p < 0.05; data not shown here). Additively, the resultant decline in plasma leptin levels may undermine the neuroprotective effects of leptin, thus exacerbating the progression of AD pathology in a feed-forward mechanism of disease propagation.
Limitations
We note some limitations of the present study. First, by pooling all ApoE4 carriers, we cannot discern a possible gene dose effect. We elected to pool because there were only 39 ApoE4 homozygotes in the present ADNI datset, which did not impart sufficient statistical power. We have therefore elected to compile results for all carriers that had one or two copies of the ApoE4 allele. Our analysis of the homo- and heterozygotic subgroups (not presented) indicated a non-significant trend towards an effect of ApoE4 allelic dose on the association between BMI and AD markers, which seems consistent with our supposition. Also, due to insufficient power, we could not add underweight (BMI <18.5 kg/m2 according to the WHO classification) as an additional stratification for the MANCOVA analysis. Nonetheless, addition of this BMI category also tended to support our general finding that ApoE4 status modulates the relationship between BMI and markers of AD pathology and progression.
We note that BMI is an imperfect parameter for the quantification of adiposity, as it does not differentiate between fat tissue and lean muscle mass; moreover, BMI is gender, age, and race specific [44], which limits its applicability in comparison with direct measurements of body fat through CT or MRI. Nevertheless, BMI is the most widely-used and available biometric index of adiposity, based on its robust correlation with percentage body fat and due to its accessibility in studies of retrospective design [44].
For our needs, the ADNI dataset allows an explorative analysis only but not the clarification of a causal relationship. Given this inherent limitation, we can only speculate about the reasons underlying the observed association between BMI, AD pathology, and ApoE4. The exact underlying pathophysiological mechanisms remain to be illucidated, perhaps through a better understanding of the role of ApoE4 on lipid homeostasis and the mechanisms by which lipid metabolism may participate in ADpathology.
Conclusion
Our results suggest that late-life BMI in subjects at increased risk of developing clinically manifest AD, as revealed by increased cerebral Aβ deposition, is associated with several markers of AD pathology in ApoE4 carriers but not in ApoE4 non-carriers. We speculate that the modifying effect of ApoE4 is based on its property to promote the accumulation of cortical Aß, which in turn has the potential to reduce body weight, in particular via altering leptin signaling in the hypothalamus; reduced body weight may itself facilitate ongoing neurodegenerative processes by lowering plasma levels of the neuroprotective adipokine leptin.
Footnotes
ACKNOWLEDGMENTS
Language editing was provided by Inglewood Biomedical Editing. This paper originated from the doctoral thesis of Sebastian Kotz.
Data collection and sharing for this project was funded by the Alzheimer’s Disease Neuroimaging Initiative (ADNI) (National Institutes of Health Grant U01 AG024904) and DOD ADNI (Department of Defense award number W81XWH-12-2-0012). ADNI is funded by the National Institute on Aging, the National Institute of Biomedical Imaging and Bioengineering, and through generous contributions from the following: AbbVie, Alzheimer’s Association; Alzheimer’s Drug Discovery Foundation; Araclon Biotech; BioClinica, Inc.; Biogen; Bristol-Myers Squibb Company; CereSpir, Inc.; Cogstate; Eisai Inc.; Elan Pharmaceuticals, Inc.; Eli Lilly and Company; EuroImmun; F. Hoffmann-La Roche Ltd and its affiliated company Genentech, Inc.; Fujirebio; GE Healthcare; IXICO Ltd.; Janssen Alzheimer Immunotherapy Research & Development, LLC.; Johnson & Johnson Pharmaceutical Research & Development LLC.; Lumosity; Lundbeck; Merck & Co., Inc.; Meso Scale Diagnostics, LLC.; NeuroRx Research; Neurotrack Technologies; Novartis Pharmaceuticals Corporation; Pfizer Inc.; Piramal Imaging; Servier; Takeda Pharmaceutical Company; and Transition Therapeutics. The Canadian Institutes of Health Research is providing funds to support ADNI clinical sites in Canada. Private sector contributions are facilitated by the Foundation for the National Institutes of Health (![]() ). The grantee organization is the Northern California Institute for Research and Education, and the study is coordinated by the Alzheimer’s Therapeutic Research Institute at the University of Southern California. ADNI data are disseminated by the Laboratory for Neuro Imaging at the University of Southern California.
). The grantee organization is the Northern California Institute for Research and Education, and the study is coordinated by the Alzheimer’s Therapeutic Research Institute at the University of Southern California. ADNI data are disseminated by the Laboratory for Neuro Imaging at the University of Southern California.