
Abstract
Alterations in tau synaptic distribution are considered to underlie synaptic dysfunction observed in Alzheimer’s disease (AD). In the present study, brain blood hypoperfusion was simulated in mouse brain slices, and tau levels and phosphorylation were investigated in total extracts, as well as in postsynaptic density fractions (PSDs) and non-PSDs obtained through differential extraction and centrifugation. Oxygen deprivation (OD) resulted in tau dephosphorylation at several AD-related residues and activation of GSK3β and phosphatase PP2A. On the contrary, glucose deprivation (GD) did not affect total levels of cellular tau or its phosphorylation despite inactivation of GSK3β. However, tau distribution in PSD and non-PSD fractions and the pattern of tau phosphorylation in these compartments is highly complex. In PSDs, tau was increased under GD conditions and decreased under OD conditions. GD resulted in tau dephosphorylation at Ser199, Ser262, and Ser396 while OD resulted in tau hyperphosphorylation at Ser199 and Ser404. In the non-PSD fraction, GD or OD resulted in lower levels of tau, but the phosphorylation status of tau was differentially affected. In GD conditions, tau was found dephosphorylated at Ser199, Thr205, and Ser404 and hyperphosphorylated at Ser262. However, in OD conditions tau was found hyperphosphorylated at Thr205, SerSer356, Ser396, and Ser404. Combined OD and GD resulted in degradation of cellular tau and dephosphorylation of PSD tau at Ser396 and Ser404. These results indicate that oxygen deprivation causes dephosphorylation of tau, while GD and OD differentially affect distribution of total tau and tau phosphorylation variants in neuronal compartments by activating different mechanisms.
Keywords
INTRODUCTION
Tau, a member of the microtubule-associated proteins family, is abundant in neuronal axons and promotes the polymerization and stabilization of axonal microtubules [1]. In the brains of healthy individuals as well as of patients with Alzheimer’s disease (AD), tau has also been found in the presynaptic, the somatodendritic compartment, and in post synaptic density fractions [2 –4]. In AD, tau is hyperphosphorylated, forms neurofibrillary tangles [5 –7], and accumulates in the form of p-tau oligomers on both sides of the synapse [3]. Similarly, an age-dependent increase in somatodendritic accumulation of wild type human tau has been observed in a mouse model of tauopathy [8, 9]. Overexpression of mutant human tau in animal models of tauopathy also resulted in redistribution of tau to the somatodendritic compartment [10, 11]. Interestingly, similar redistribution of endogenous murine tau has also been observed following synaptic activation, induction of long-term potentiation or treatment with amyloid-β peptide (Aβ) of primary neuronal cultures [12 –14]. The subcellular redistribution of tau has been associated with alterations in its phosphorylation [8 , 16]. Numerous possible phosphorylation sites have been suggested to play a role in AD pathology; however, the precise mechanism remains unclear [17, 18]. Tau phosphorylation is regulated by a balance between kinase and phosphatase activities, disruption of which is possible to lead to tau hyper-phosphorylation and aggregation. Among many kinases, glycogen synthase kinase 3β (GSK3β) is thought to be most involved in tau hyperphosphorylation in AD [19, 20], while protein phosphatase 2A (PP2A) is a principal tau dephosphorylating enzyme [21, 22].
About 98–99% of all AD cases appear at ages higher than 65 years old and are caused by a combination of polymorphisms in genes like apoE, apoJ, trem2, with other genetic, biological, and environmental factors [23]. Among those factors are decreased delivery of glucose and oxygen and decreased production of ATP needed to maintain the neuronal energy metabolism, function, and viability as a result of cerebral blood hypoperfusion which advances with aging [24 –26]. Interestingly, this outcome is also the result of ischemic episodes [27]. Several studies have indicated that transient ischemia causes tau dephosphorylation, which is followed by restoration of phosphorylation and finally hyperphosphorylation [28 –35]. In in-vitro systems, acute anoxia was found to induce tau dephosphorylation [36], while the combination of oxygen and glucose deprivation (OGD) induced tau dephosphorylation or hyperphosphorylation [37, 38]. On the other hand, glucose deprivation (GD) was found to induce tau phosphorylation [39, 40] or to have no effect [36]. Interestingly, so far there are no studies examining the effect of these factors on the subcellular distribution of tau in neurons.
In the present study, we examined the possible role of GD and oxygen deprivation (OD) in the phosphorylation of tau and its synaptic distribution.
To achieve this goal, we compared the distribution of total tau and tau phosphorylation variants in a PSD-95 enriched postsynaptic density fraction (PSD) and in a non-PSD fraction, all prepared using an established biochemical approach from mouse brain cortical slices. Our results indicate that OD, but not GD, reduces cellular tau phosphorylation. In addition, both GD and OD alter differentially the phosphorylation profile and distribution of tau in PSD and non-PSD fractions suggesting that tau has a synaptic function and dynamic stress-dependent synaptic distribution.
MATERIALS AND METHODS
Animal models
C57BL/6JOlaHsd mice were obtained from Envigo (Italy) and transgenic glut3 +/–mice in C57BL/6 background were available, under an MTA agreement, from Dr. Juan M. Pascual (Departments of Neurology and Neurotherapeutics, Physiology and Pediatrics, University of Texas, Southwestern Medical Center). Animals were maintained under specific pathogen-free conditions in the facilities of the Department of Experimental Animal Models for Biomedical Research of Hellenic Pasteur Institute (Facilities License Numbers: ELBIO13 and ELBIO12). All animal procedures were approved by Institutional Protocol Evaluation Committee, and licenses were issued by national authorities, according to the Greek Law 56/2013, in conformity with European Union guidelines. Animals were used at ages 6–12 months.
Antibodies
The primary antibodies used were: pSer473 Akt, total Akt, pSer9 GSK3β, total GSK3β (Cell Signaling, Danvers, MA, USA), pTyr307, pPP2A (Abcam, Cambridge, UK), total PP2A (Santa Cruz, Dallas, TXs, USA), PSD-95, pSer396, pThr205, pSer356, pSer404, pSer262 tau (Acris, Herford, Germany), pSer199 tau, and total tau (C-terminal) kindly provided by Dr. Luc Buee (Inserm, Fac de Medecine, Univ Lille 2, Lille France). Anti-mouse and anti-rabbit conjugated with HRP were from Millipore (Billerica, MA, USA) and Jackson (West Grove, PA, USA), respectively.
Preparation and perfusion of mouse cortical slices
Mice were humanly sacrificed by decapitation. The brain was rapidly removed and placed into ice cold isotonic saline buffer containing 2.14 mM KCl, 2.2 mM MgSO4, 27 mM NaHCO3, 1.47 mM NaH2PO4, 2 mM CaCl2, 10 mM D(+)-Glucose, 200 mM sucrose, 10 mM HEPES, pH 7.4 for 15 min. Forebrains were separated and 400 μm thick coronal slices were prepared using a Mcllwain Tissue Chopper. Slices were placed into closed chambers, perfused with artificial cerebrospinal fluid (aCSF) consisting of 126 mM NaCl, 3.53 mM KCl, 1 mM MgSO4, 26 mM NaHCO3, 1.25 mM NaH2PO4, 2 mM CaCl2, 10 mM D(+)-Glucose,10 mM HEPES, pH 7.4, bubbled with 95% O2, 5% CO2, at a flow rate of 3 ml/min. Following equilibration at 37C for 1 h, the slices were exposed to conditions of OD or/and GD for 3 h. Then, the slices were perfused with an ice cold stop solution; aCSF containing the phosphatase inhibitors NaF (100 mM) and Na3VO4 (100 μM), for 10 min and transferred immediately in liquid nitrogen. Whole slices or slice subcellular fractions were processed for protein extraction.
Subcellular fractionation
Subcellular fractionation was performed at 4°C as described previously [13]. In brief, mouse brain slices were homogenized in cold buffer (0.32 M sucrose, 10 mM HEPES, pH 7.4) and homogenates were centrifuged at 1.000xg for 10 min. The pellet containing nuclei, membrane fractions, organelles, cytoskeletal elements, and possibly aggregated or non-aggregated tau associated with membranes or the cytoskeleton was lysed in 1% SDS buffer before analysis by western blot. The supernatant was centrifuged at 12.000xg for 20 min. The resulting pellet that contained synaptosomes with or without the postsynaptic membrane attached and other membranes, was washed twice (4 mM HEPES, 1 mM EDTA, pH 7.4) and resuspended in cold buffer containing 20 mM HEPES, 100 mM NaCl, 0.5% Triton X-100, pH 7.2, incubated for 1 h with mild agitation and centrifuged at 12.000xg for 20 min. The supernatant, which includes Triton X-100 soluble proteins and membrane components, was collected as the non-postsynaptic density fraction (non-PSD). The remaining pellet, which contains Triton X-100 insoluble membrane components, was solubilized in a buffer containing 20 mM HEPES, 0.15 mM NaCl, 1% Triton X-100, 1% deoxycholic acid, 1% SDS, pH 7.5, incubated for 1 h, and centrifuged at 10.000xg for 15 min. The supernatant was collected as the PSD fraction. Applying the above described protocol, several subcellular fractions were discarded and not analyzed.
Preparation of protein extracts and western blot
Brain slices were homogenized in lysis buffer consisting of 25 mM Tris-HCl, 75 mM NaCl, 1 mM EDTA, 1% SDS, and protease and phosphatase inhibitors, and incubated for 30 min at 100C. Lysates were then centrifuged at 15.000xg for 15 min, and the supernatant (total protein extract) was collected. Protein concentration was determined by the Bradford assay (BioRad Laboratories, CA, USA). After quantification, the samples were supplemented with 0.33 volumes of SDS-PAGE sample buffer [330 mM Tris-HCl, pH6.8, 10% (w/v) SDS, 13% (v/v) glycerol, 20% (v/v) 2-mercaptoethanol, 0.2% (w/v) bromophenol blue] and boiled for 3 min before electrophoresis. Western blot analysis of protein extracts was performed as previously described [41].
Quantification and statistical analysis
Densitometric analysis of the western blot bands was performed using Image J software. For each antibody, the ratio of the intensity of the band of the treated sample versus the untreated was calculated, and the data were plotted in a bar graph as fold change of the untreated control. Where indicated, the data were normalized by dividing the ratio obtained above with the corresponding ratio for total tau, and the data were plotted in a bar graph as fold change of the untreated control that is set at 1. All data are presented as means±SE. Comparisons between control and treated samples were performed using Student’s unpaired t-test. A value of p < 0.05 was considered to be statistically significant.
RESULTS
Glucose deprivation decreases the levels of activated GSK3β without affecting total tau levels and phosphorylation
As previously mentioned, reduced blood flow to the brain limits delivery of glucose and oxygen needed to maintain the high-energy metabolism of neurons. In this study, brain hypoglycemia was simulated by perfusion of mouse brain slices with aCSF supplied with different concentrations [10 mM (control), 5 mM, 2 mM, 0 mM] of D-glucose for 3 hrs, under normal oxygen conditions (95% O2:5% CO2). We examined the effect of GD on the phosphorylation of Ser199, Ser262, Ser396, and Ser404. Of all these residues Ser262 is found phosphorylated in AD while all the others (Ser199, Ser396, and Ser404) are phosphorylated both in normal brain and in AD brain [17]. Western blot analysis of brain slice lysates (Fig. 1) shows that GD (2 and 5 mM) did not affect the levels of total tau or of the phosphorylation variants pSer199tau, pSer262tau, pSer396tau, and pSer404tau. This result indicates that reduction of glucose to 2 mM does not induce tau degradation. On the contrary, complete glucose deprivation led to almost undetectable tau levels, probably due to specific tau degradation since the levels of Akt, GSK3β, PP2A, and β-actin proteins were not affected. In parallel, we examined the effect of GD on the activation of Akt kinase, its target GSK3β and PP2A. As shown in Fig. 1, perfusion with 2 mM glucose resulted in significant activation of Akt and, as expected, increased phosphorylation and thus inactivation of GSK3β. On the contrary, activation of PP2A was not affected. Similar results were obtained following perfusion of slices with 2-deoxy-D-glucose (2DG) in combination with D-glucose at ratios 1:3, 1:1 and 3:1 or using brain slices derived from a mouse model of chronic hypoglycemia (glut3 +/–) (Supplementary Figure 1).
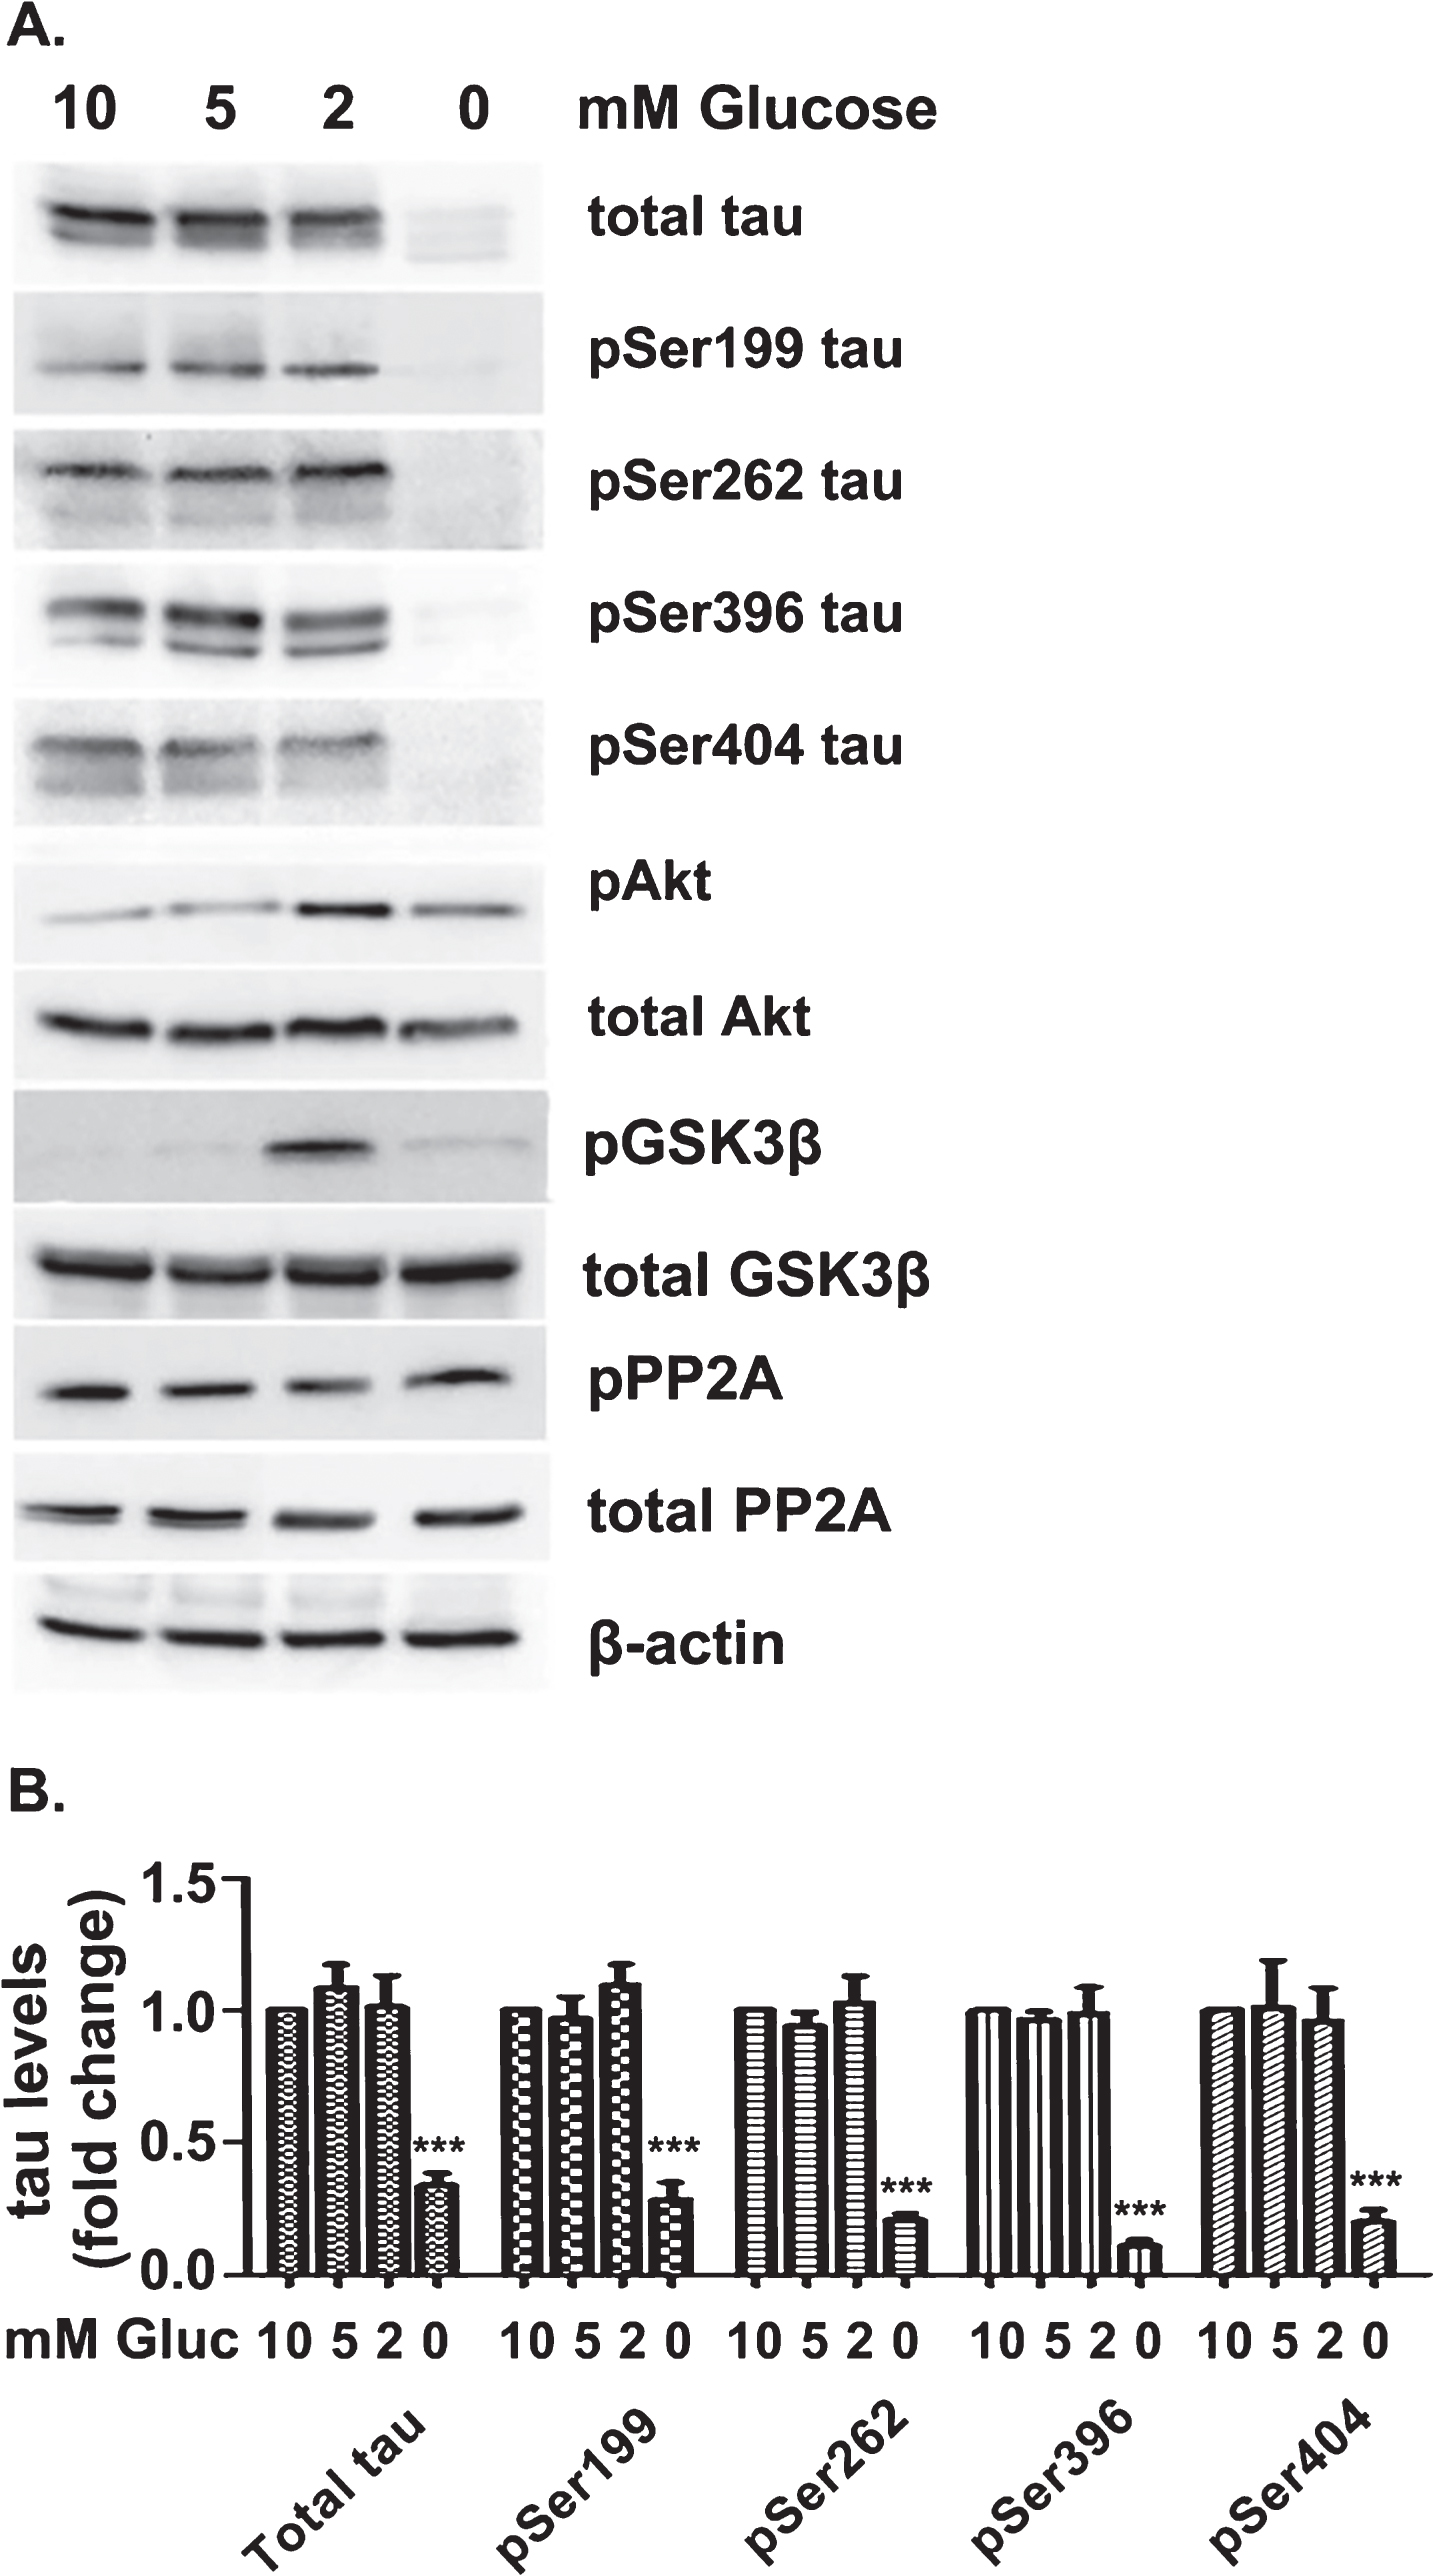
GD reduces the levels of active GSK3β without affecting total levels of tau or the levels of certain phosphorylation variants of tau. A) Brain slices from C57BL/6 wild type mice were perfused with aCSF buffer supplied with different concentrations of D-glucose (0, 2, 5 and 10 mM). The perfusion buffer was bubbled with a mixture of 95% O2:5% CO2. Brain tissue was then homogenized and total protein extracts were analyzed by western blot. Equal loading was verified by detection of β-actin levels. The blots are representative of at least three independent experiments. B) Quantification of the levels of total tau in various glucose concentrations (10, 5, 2, and 0 mM). Results are expressed as fold increase relative to control (10 mM Glucose). Quantification and normalization of the levels of phosphorylated tau proteins for the total levels of tau. Data are means±SE of at least three independent experiments ***p < 0.001 compared with control (10 mM Glucose).
Oxygen deprivation results in tau dephosphorylation and activation of both GSK3β and PP2A
To examine the effect of OD, mouse brain slices were perfused with normal aCSF (10 mM glucose), bubbled with a hypoxic gas mixture of 92.5% N2:2.5% O2:5% CO2 (designated as 2.5% O2) for 3 h. Control samples were bubbled with 95% O2:5% CO2 (designated as 95% O2). In contrast to GD, exposure to hypoxic conditions resulted in significant hypophosphorylation of tau on all four serine residues examined without significantly affecting total tau levels (Fig. 2A, B). GSK3β, as well as its upstream Akt kinase, were found dephosphorylated, indicating activation of GSK3β (Fig. 2A). However, tau was found dephosphorylated suggesting that the effect of GSK3β is reversed by enhanced phosphatase activity. Indeed, PP2A was found activated, as indicated by its significant dephosphorylation.
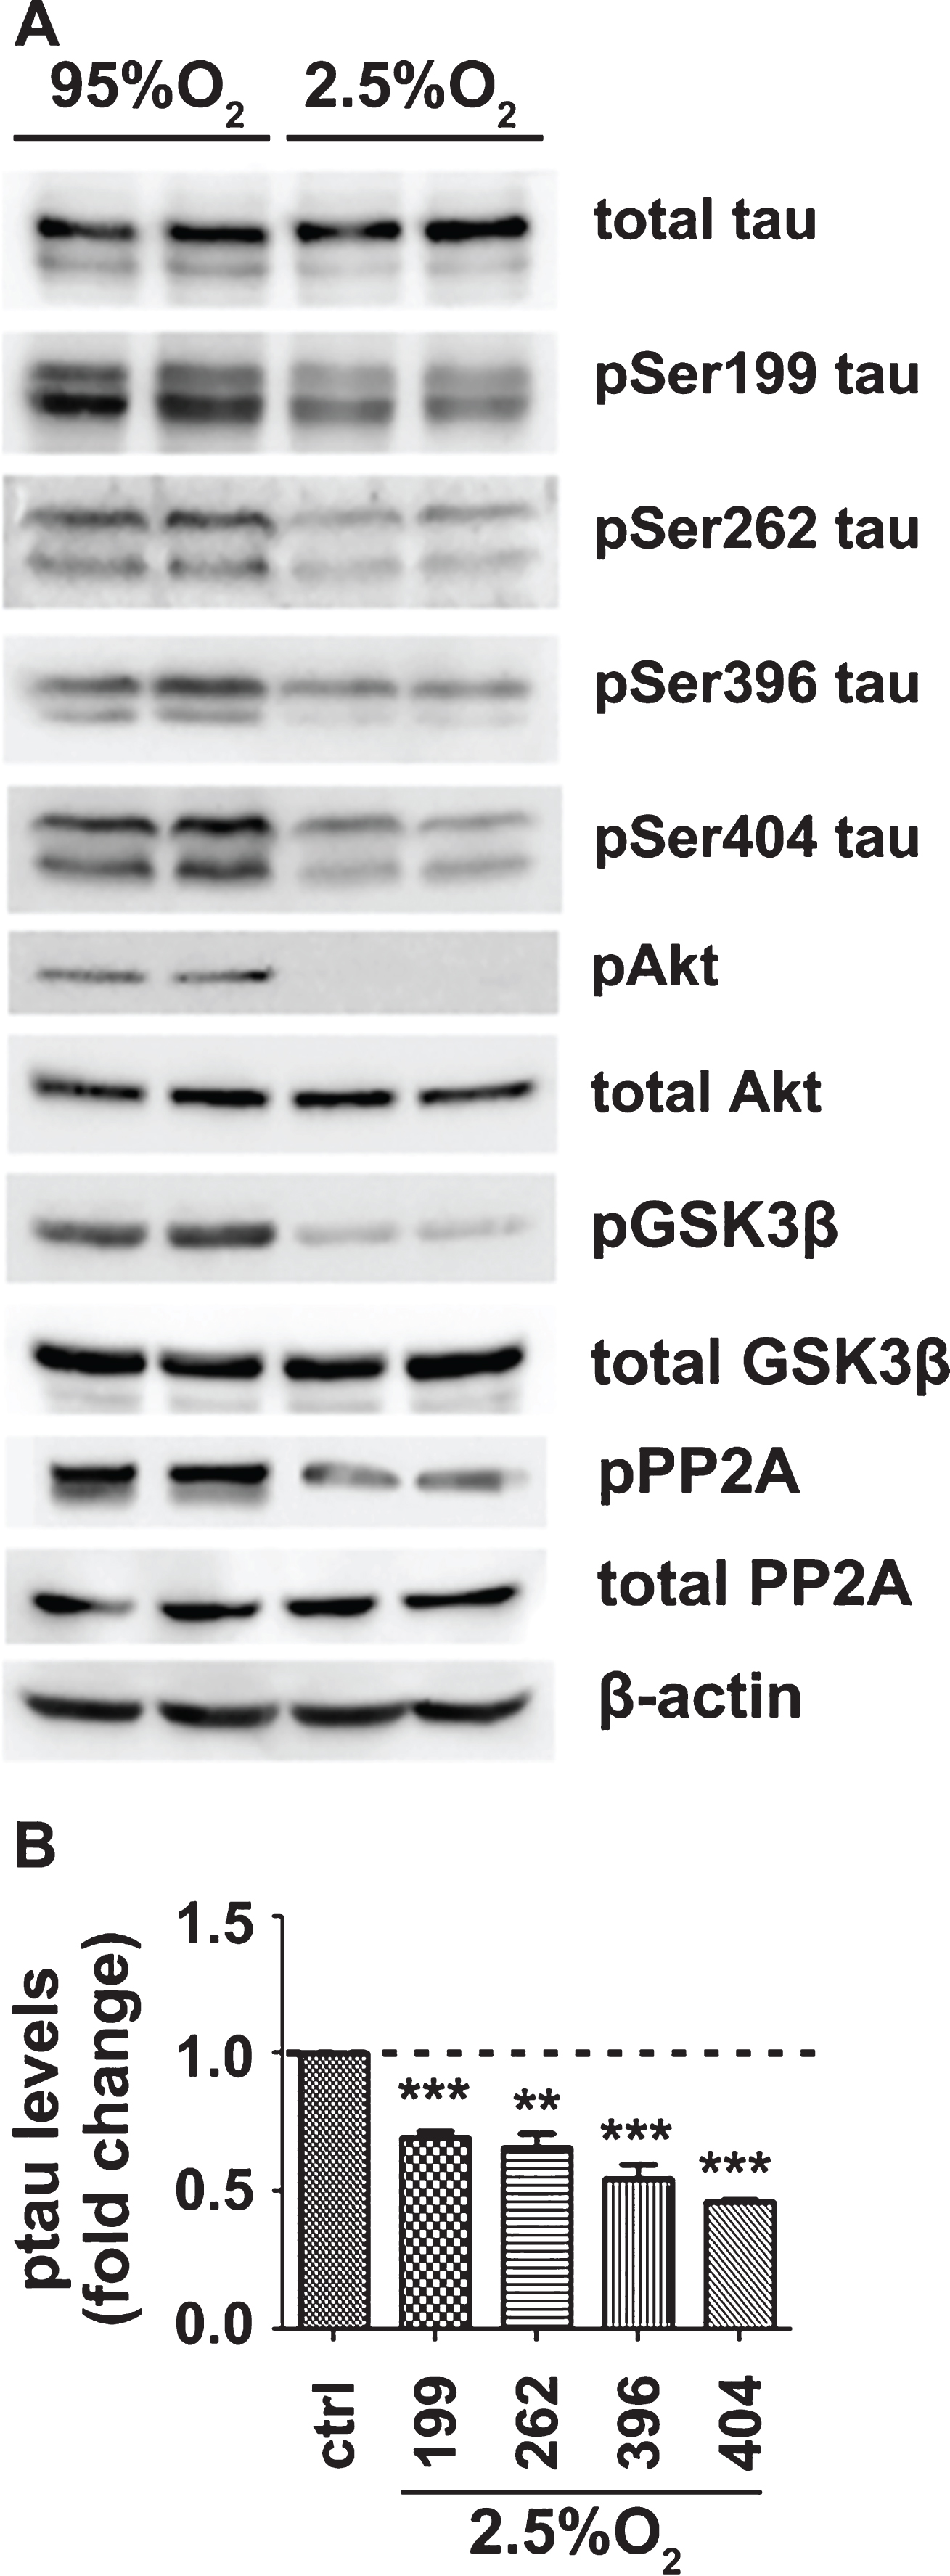
OD downregulates tau phosphorylation and causes activation of both GSK3β and PP2A. A) Brain slices from C57Bl/6 wild type mice were perfused with aCSF containing normal glucose concentration (10 mM) and bubbled with normal 95% O2 or hypoxic 2.5% O2 mixture for 3 h. Total protein extracts were analyzed by western blot. Equal loading was verified by detection of β-actin levels, B) Quantification and normalization of the levels of phosphorylated tau proteins for the total levels of tau. Data are means±SE of at least three independent experiments. **p < 0.01 and ***p < 0.001 compared with control.
To examine whether phosphatase activity is involved in the observed downregulation of tau phosphorylation, brain slices perfused with aCSF bubbled with 95% O2 or 2.5% O2 were treated in the absence or the presence of 1 μM okadaic acid (Cayman Chemical, Ann Arbor, Michigan, USA). Figure 3 shows that okadaic acid treatment restored the levels of tau variants phosphorylated at Ser199, Ser262, Ser396, and Ser404.
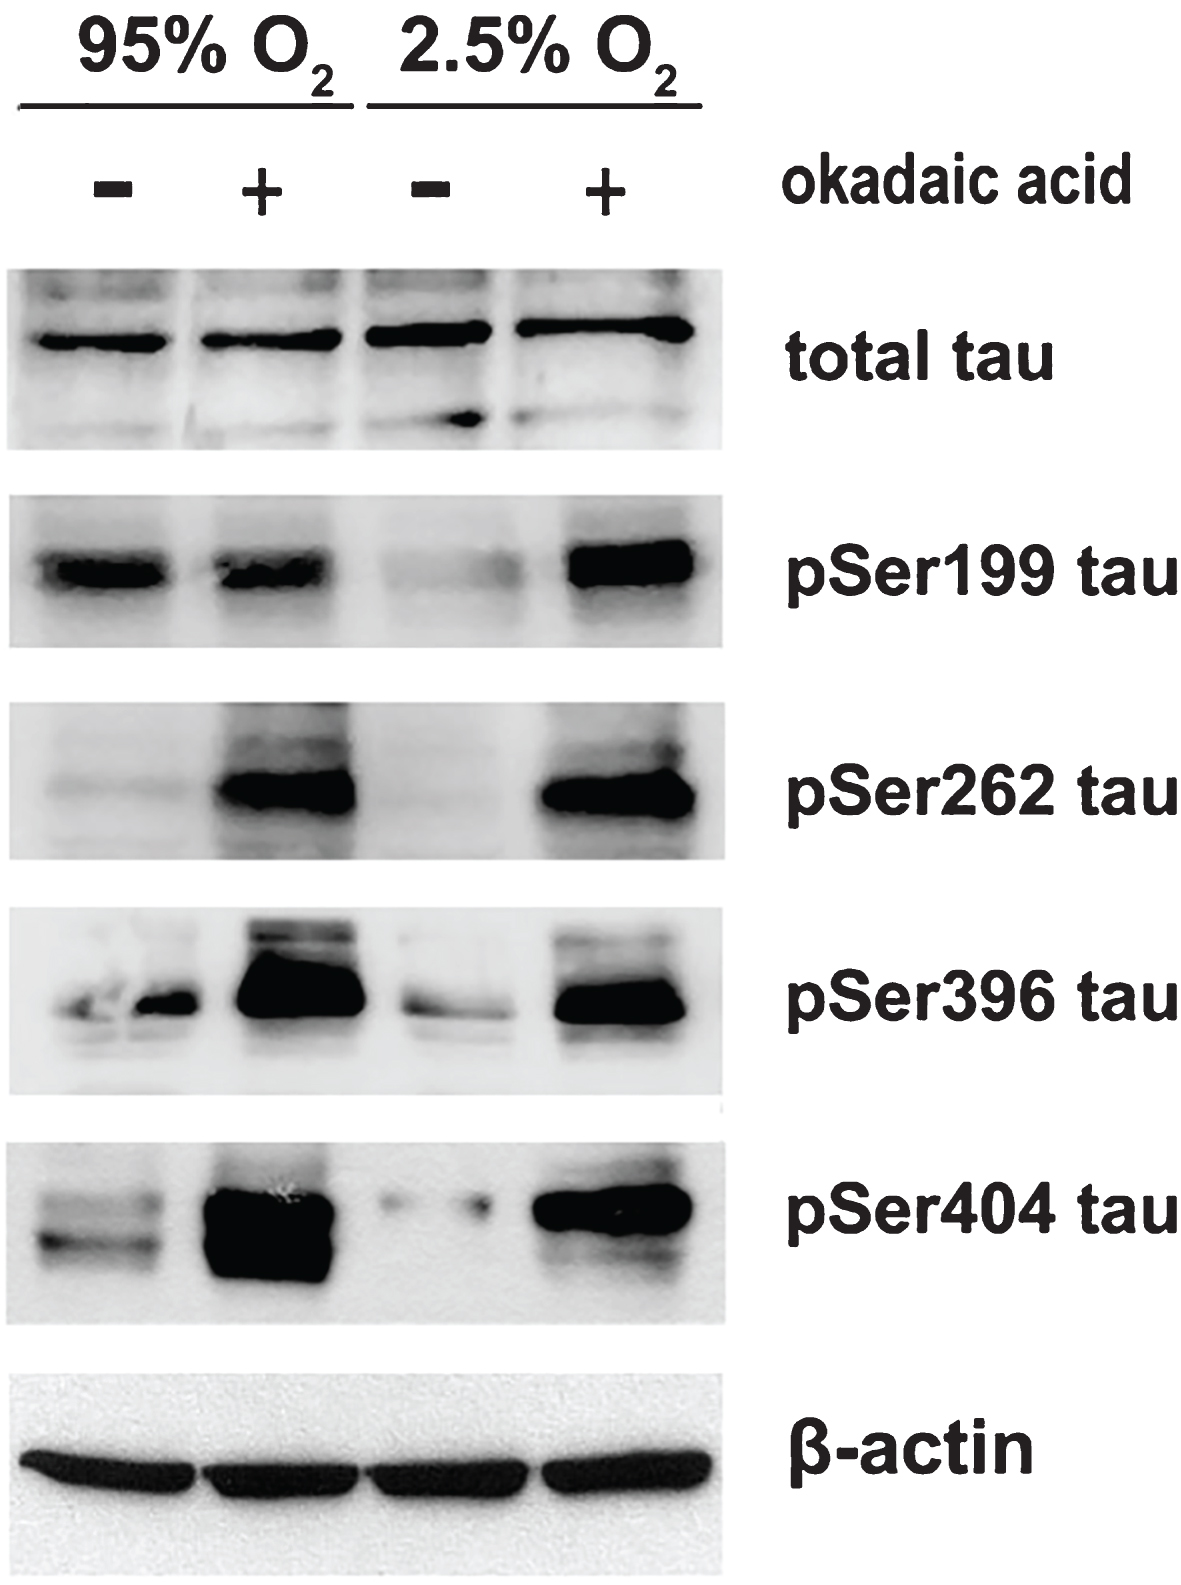
Inhibition of phosphatase activity by okadaic acid restores tau phosphorylation upon OD. Brain slices from C57Bl/6 wild type mice were perfused with aCSF containing normal glucose concentration (10 mM) and bubbled with normal 95% O2 or hypoxic 2.5% O2 mixture for 3 h in the absence or the presence of 1 μM okadaic acid. Total protein extracts were analyzed by western blot. Equal loading was verified by detection of β-actin levels.
Combination of oxygen and glucose deprivation enhances tau dephosphorylation and degradation
To better simulate in vivo ischemic conditions of aged brain, GD and OD were combined (OGD) using aCSF containing 2 mM glucose and bubbled with 2.5% O2 for 3 h. Although each of these stress conditions when applied alone had no effect on total tau levels, their combination resulted in a significant decrease of total tau (Fig. 4A). This indicates specific tau protein degradation since the levels of actin, Akt, PP2A, and GSK3β were not affected. Treatment with the proteasomal inhibitor MG132 reversed this effect of OGD and stabilized tau (Supplementary Figure 2). In addition, OGD resulted in tau hypo-phosphorylation. In order to evaluate whether the changes seen in the levels of phosphorylated variants of tau are due to changes in phosphorylation or the levels of total tau, the data were normalized as described in the Materials and Methods. This analysis revealed significantly higher reduction in the phosphorylation of tau relative to reduction in its total levels (Fig. 4A, B). Similarly to OD, tau hypophosphorylation was accompanied by deactivation of Akt and activation of its downstream target, GSK3β, indicating that tau hypophosphorylation could again be attributed to the enhanced PP2A activation (Fig. 4A).
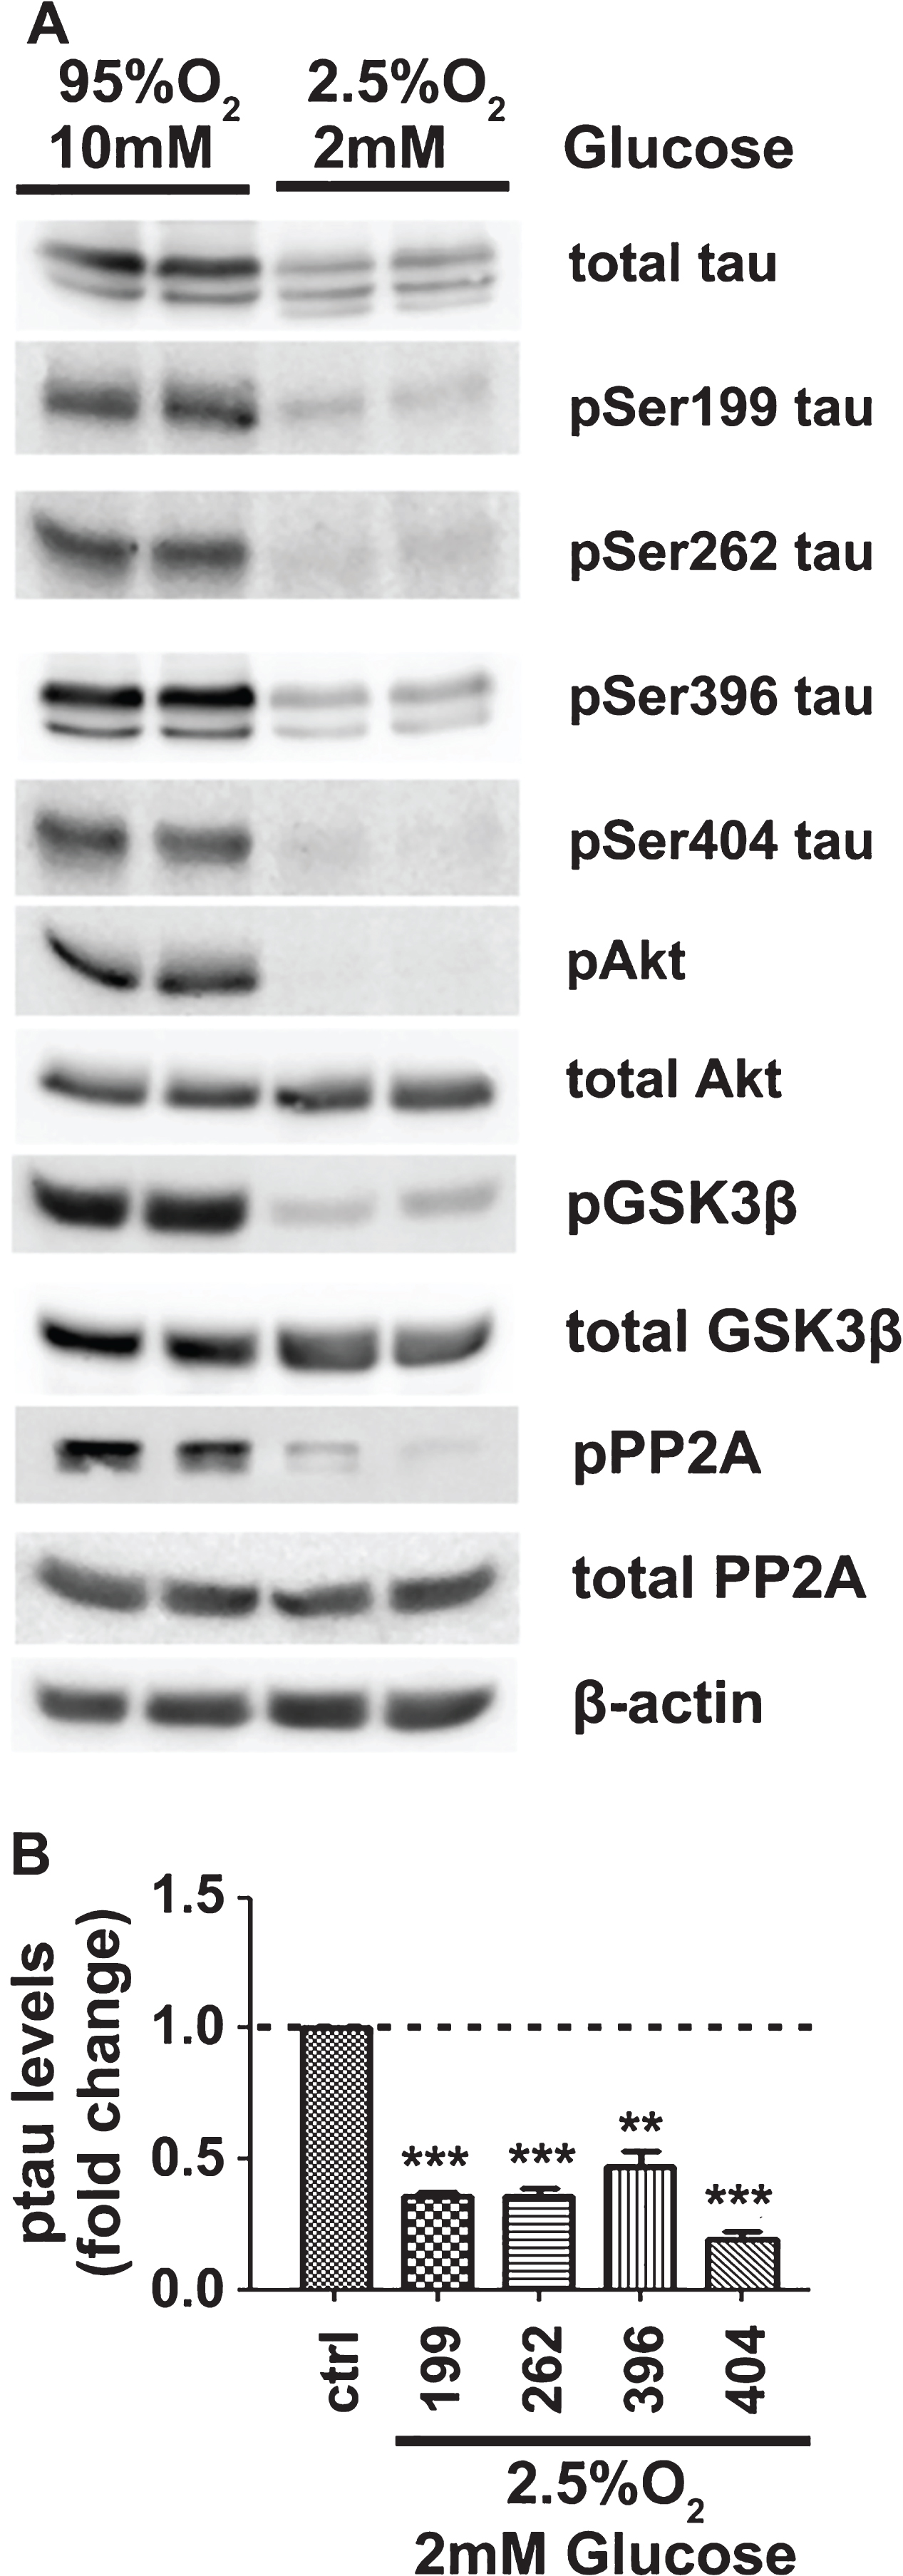
OGD results in tau degradation and hypophosphorylation. A) Brain slices from C57BL/6 wild type mice were perfused with aCSF under control conditions (10mM D-glucose, 95% O2) or OGD conditions (2 mM of D-glucose, 2.5% O2) for 3 h. Total protein extracts were analyzed by western blot. Equal loading was verified by detection of β-actin levels. B) Quantification and normalization of the levels of phosphorylated tau proteins for the total levels of tau. Data are means±SE of at least three independent experiments. **p < 0.01 and ***p < 0.001 compared with control.
The effect of glucose deprivation on the subcellular distribution of total tau and certain phosphorylation tau variants
Various stress factors, including Aβ or serum deprivation, are found to induce alterations in tau subcellular distribution and phosphorylation [12]. In line with this, the effect of GD (2 mM glucose for 3 h) on the subcellular distribution of tau in the fractions, pellet, non-PSD, and PSD, prepared using biochemical methods as described in Materials and Methods, was examined. The biochemical fractionation provides a PSD fraction that is significantly enriched in the synaptic component of PSDs and thus firmly suggesting the presence of tau variants at a very specific synaptic structure. As shown in Fig. 5A, last row of panels on the right, this protocol results in a fraction that is tremendously enriched in PSD-95 protein, a marker of PSDs. The total levels of tau were significantly increased in the pellet and the PSD fraction and decreased in the non-PSD fraction (Fig. 5A, first row of panels). Given that the cellular levels of total tau were not affected (Fig. 1), these results indicate that tau moves into the fractions pellet and PSD and moves out of the non-PSD fraction. Normalization of the phosphorylation data for the levels of total tau revealed that tau present in the pellet is significantly hyperphosphorylated at Thr205, Ser262, Ser356, Ser396, and Ser404 (Fig. 5). Non-PSD tau was found significantly hyperphosphorylated at Ser262 and dephosphorylated at residues Ser199, Thr205, and Ser404. PSD tau was found significantly dephosphorylated at Ser199, Ser262, and Ser396.
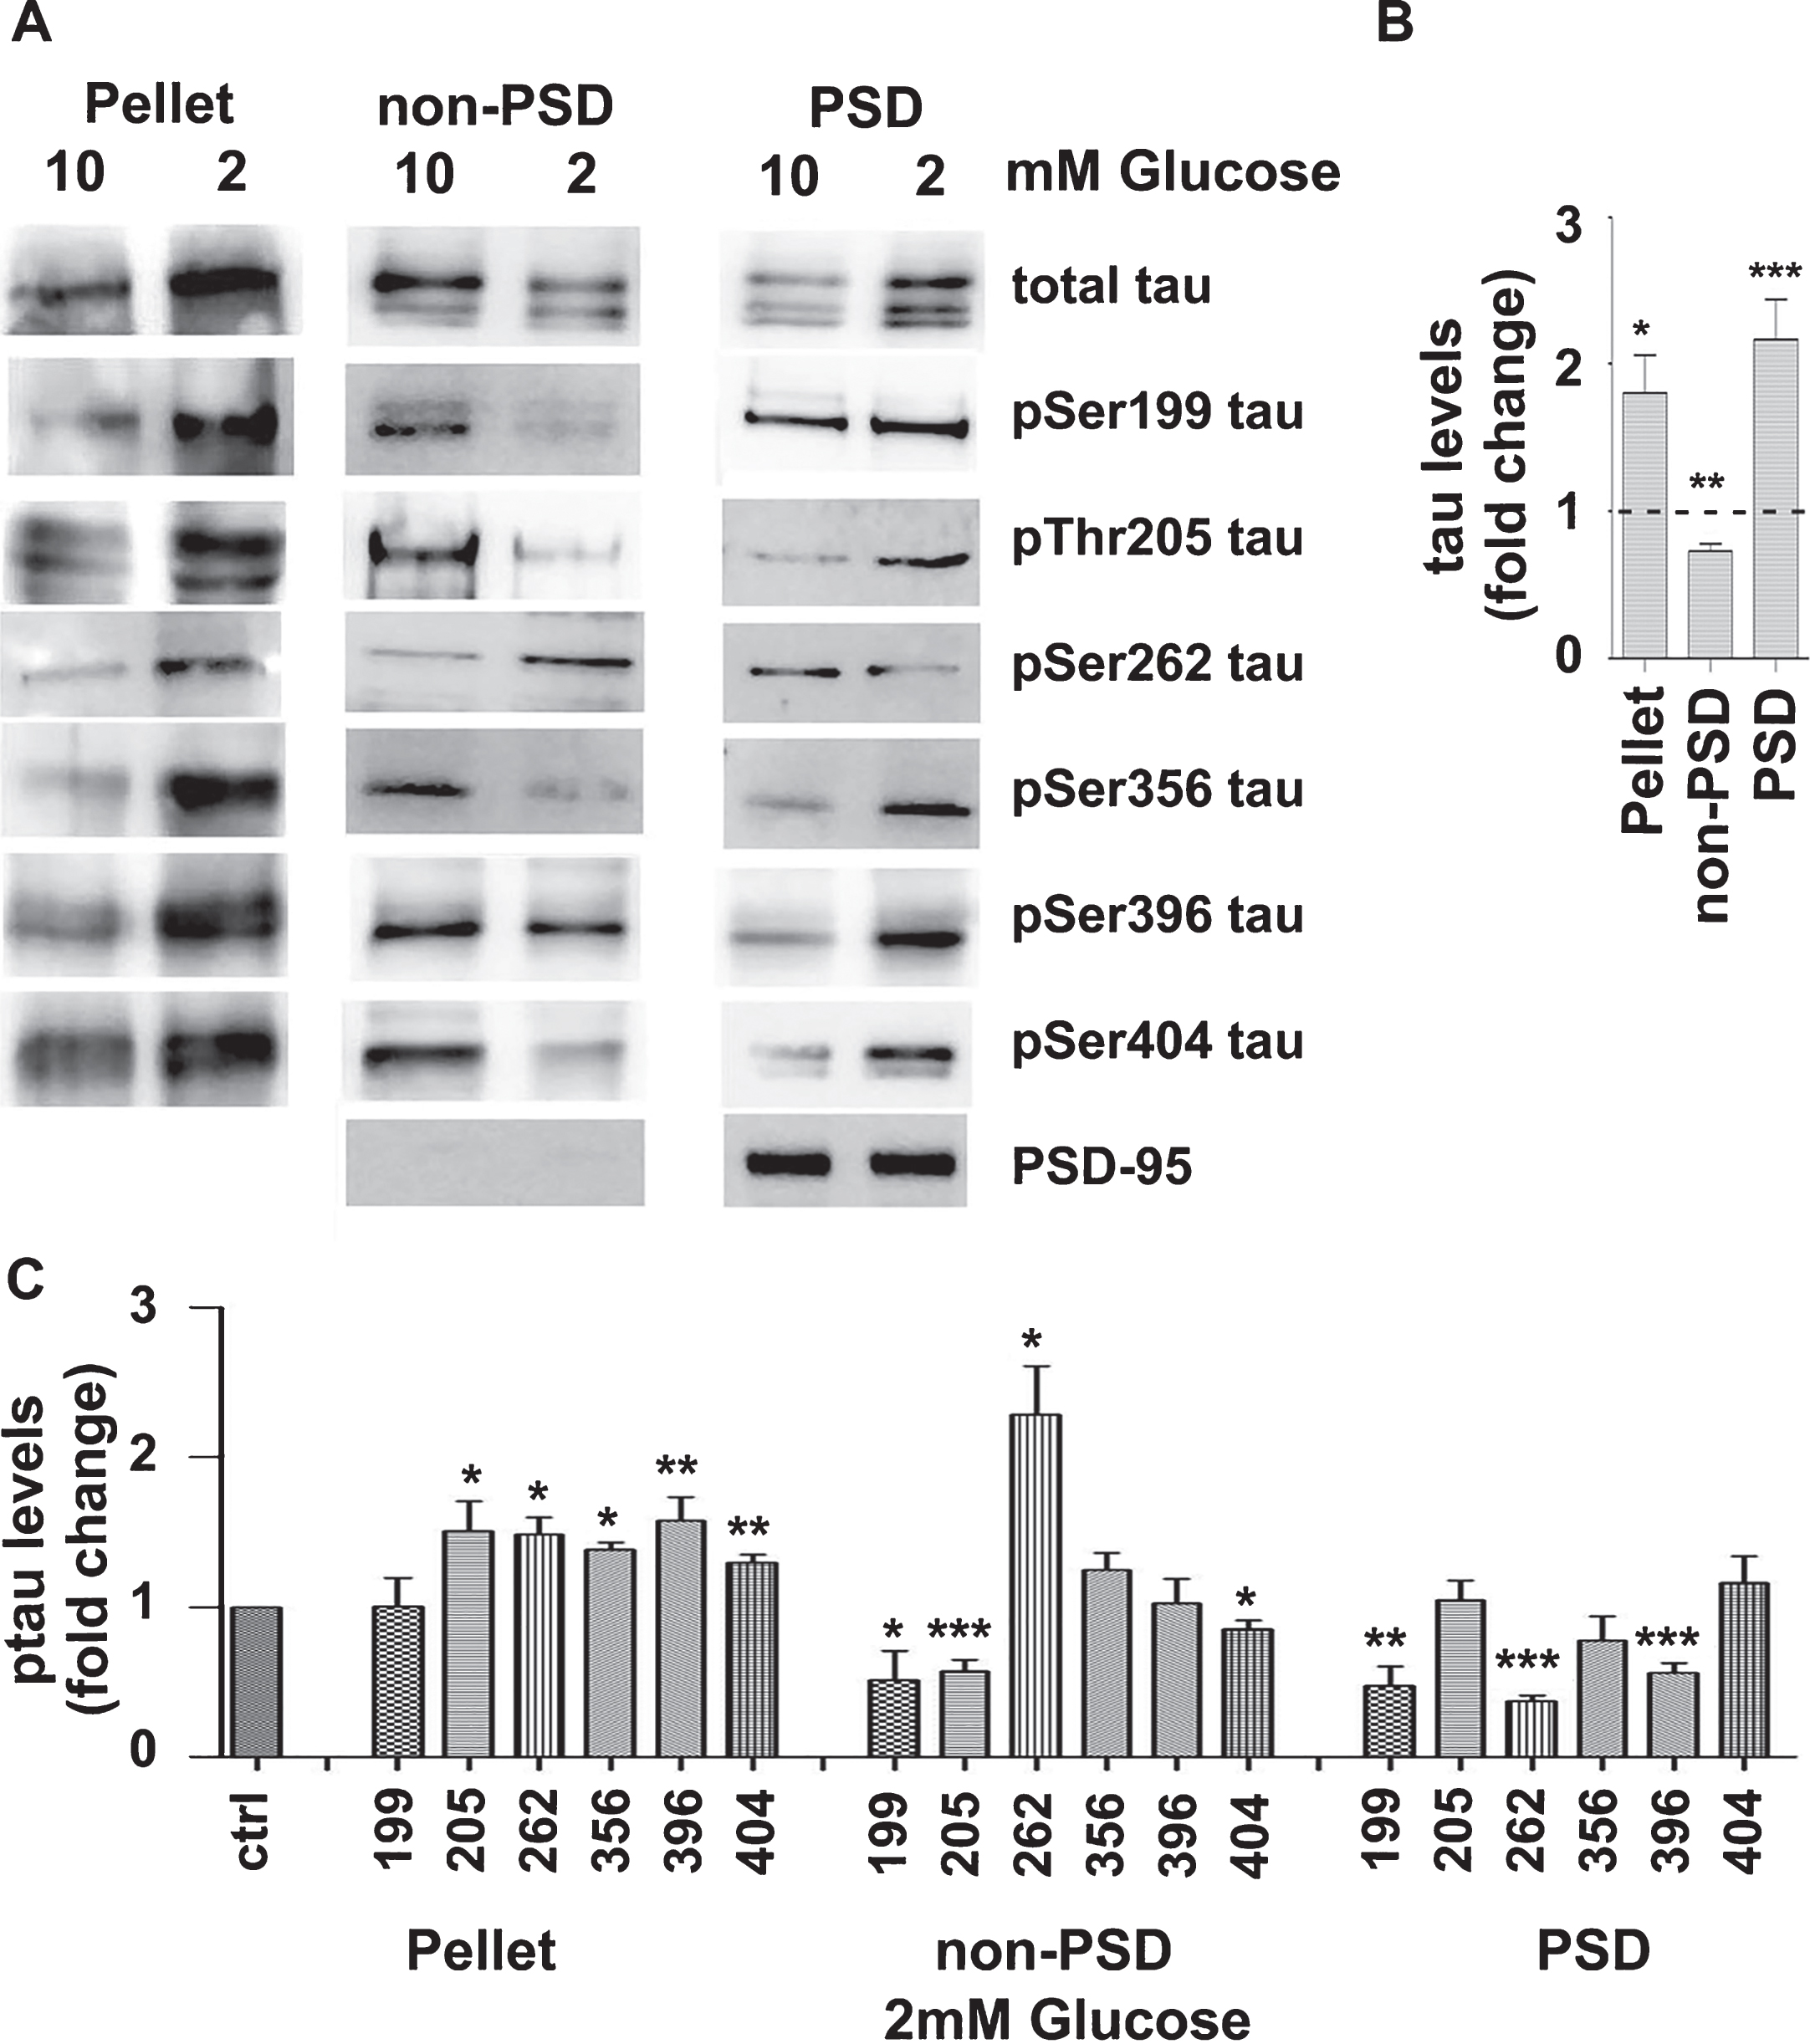
GD affects the distribution of total tau and certain phosphorylation tau variants. Brain slices from C57BL/6 wild type mice were perfused with aCSF containing 10 or 2 mM glucose and bubbled with 95% O2. Following 3 h perfusion, mouse brain cortical slices were fractionated as described in the Materials and Methods to yield a pellet, a non-PSD fraction and a PSD fraction. A) Protein extracts of the various fractions were analyzed by western blot using antibodies against the proteins shown on the right of the panels. The blots are representative of at least five independent experiments. B) Total tau protein levels in the presence of 2 mM glucose expressed as ratio over the corresponding controls (10 mM glucose). C) Normalization of the phosphorylation levels (data shown in A) for the total levels of tau in the corresponding fraction. Data are means±SE of at least five independent experiments. *p < 0.05, **p < 0.01, and ***p < 0.001 compared with control.
The effect of oxygen deprivation on the distribution of total tau and certain phosphorylation tau variants
Brain slices perfused under OD conditions were fractionated to obtain a pellet, non-PSD, and PSD fractions. As expected, the PSD fraction was found to be significantly enriched in PSD-95 protein (Fig. 6A, last row of panels). The analysis of the above fractions showed that the total levels of tau were significantly increased in the pellet and decreased in the non-PSD and PSD fractions (Fig. 6). Since total levels of cellular tau were not affected (Fig. 2), these results indicate that, upon OD, tau traffics into the fraction pellet and out of the non-PSD and PSD fractions. Normalization of the data, indicates that following OD, tau present in the pellet is significantly dephosphorylated at Ser199, Thr205, Ser356, and Ser404 and hyperphosphorylated at Ser262 and Ser396 (Fig. 6). Non-PSD tau was significantly hyperphosphorylated at Thr205, Ser396, Ser404, and Ser356. PSD tau was found significantly hyperphosphorylated at Ser199 and especially Ser404.
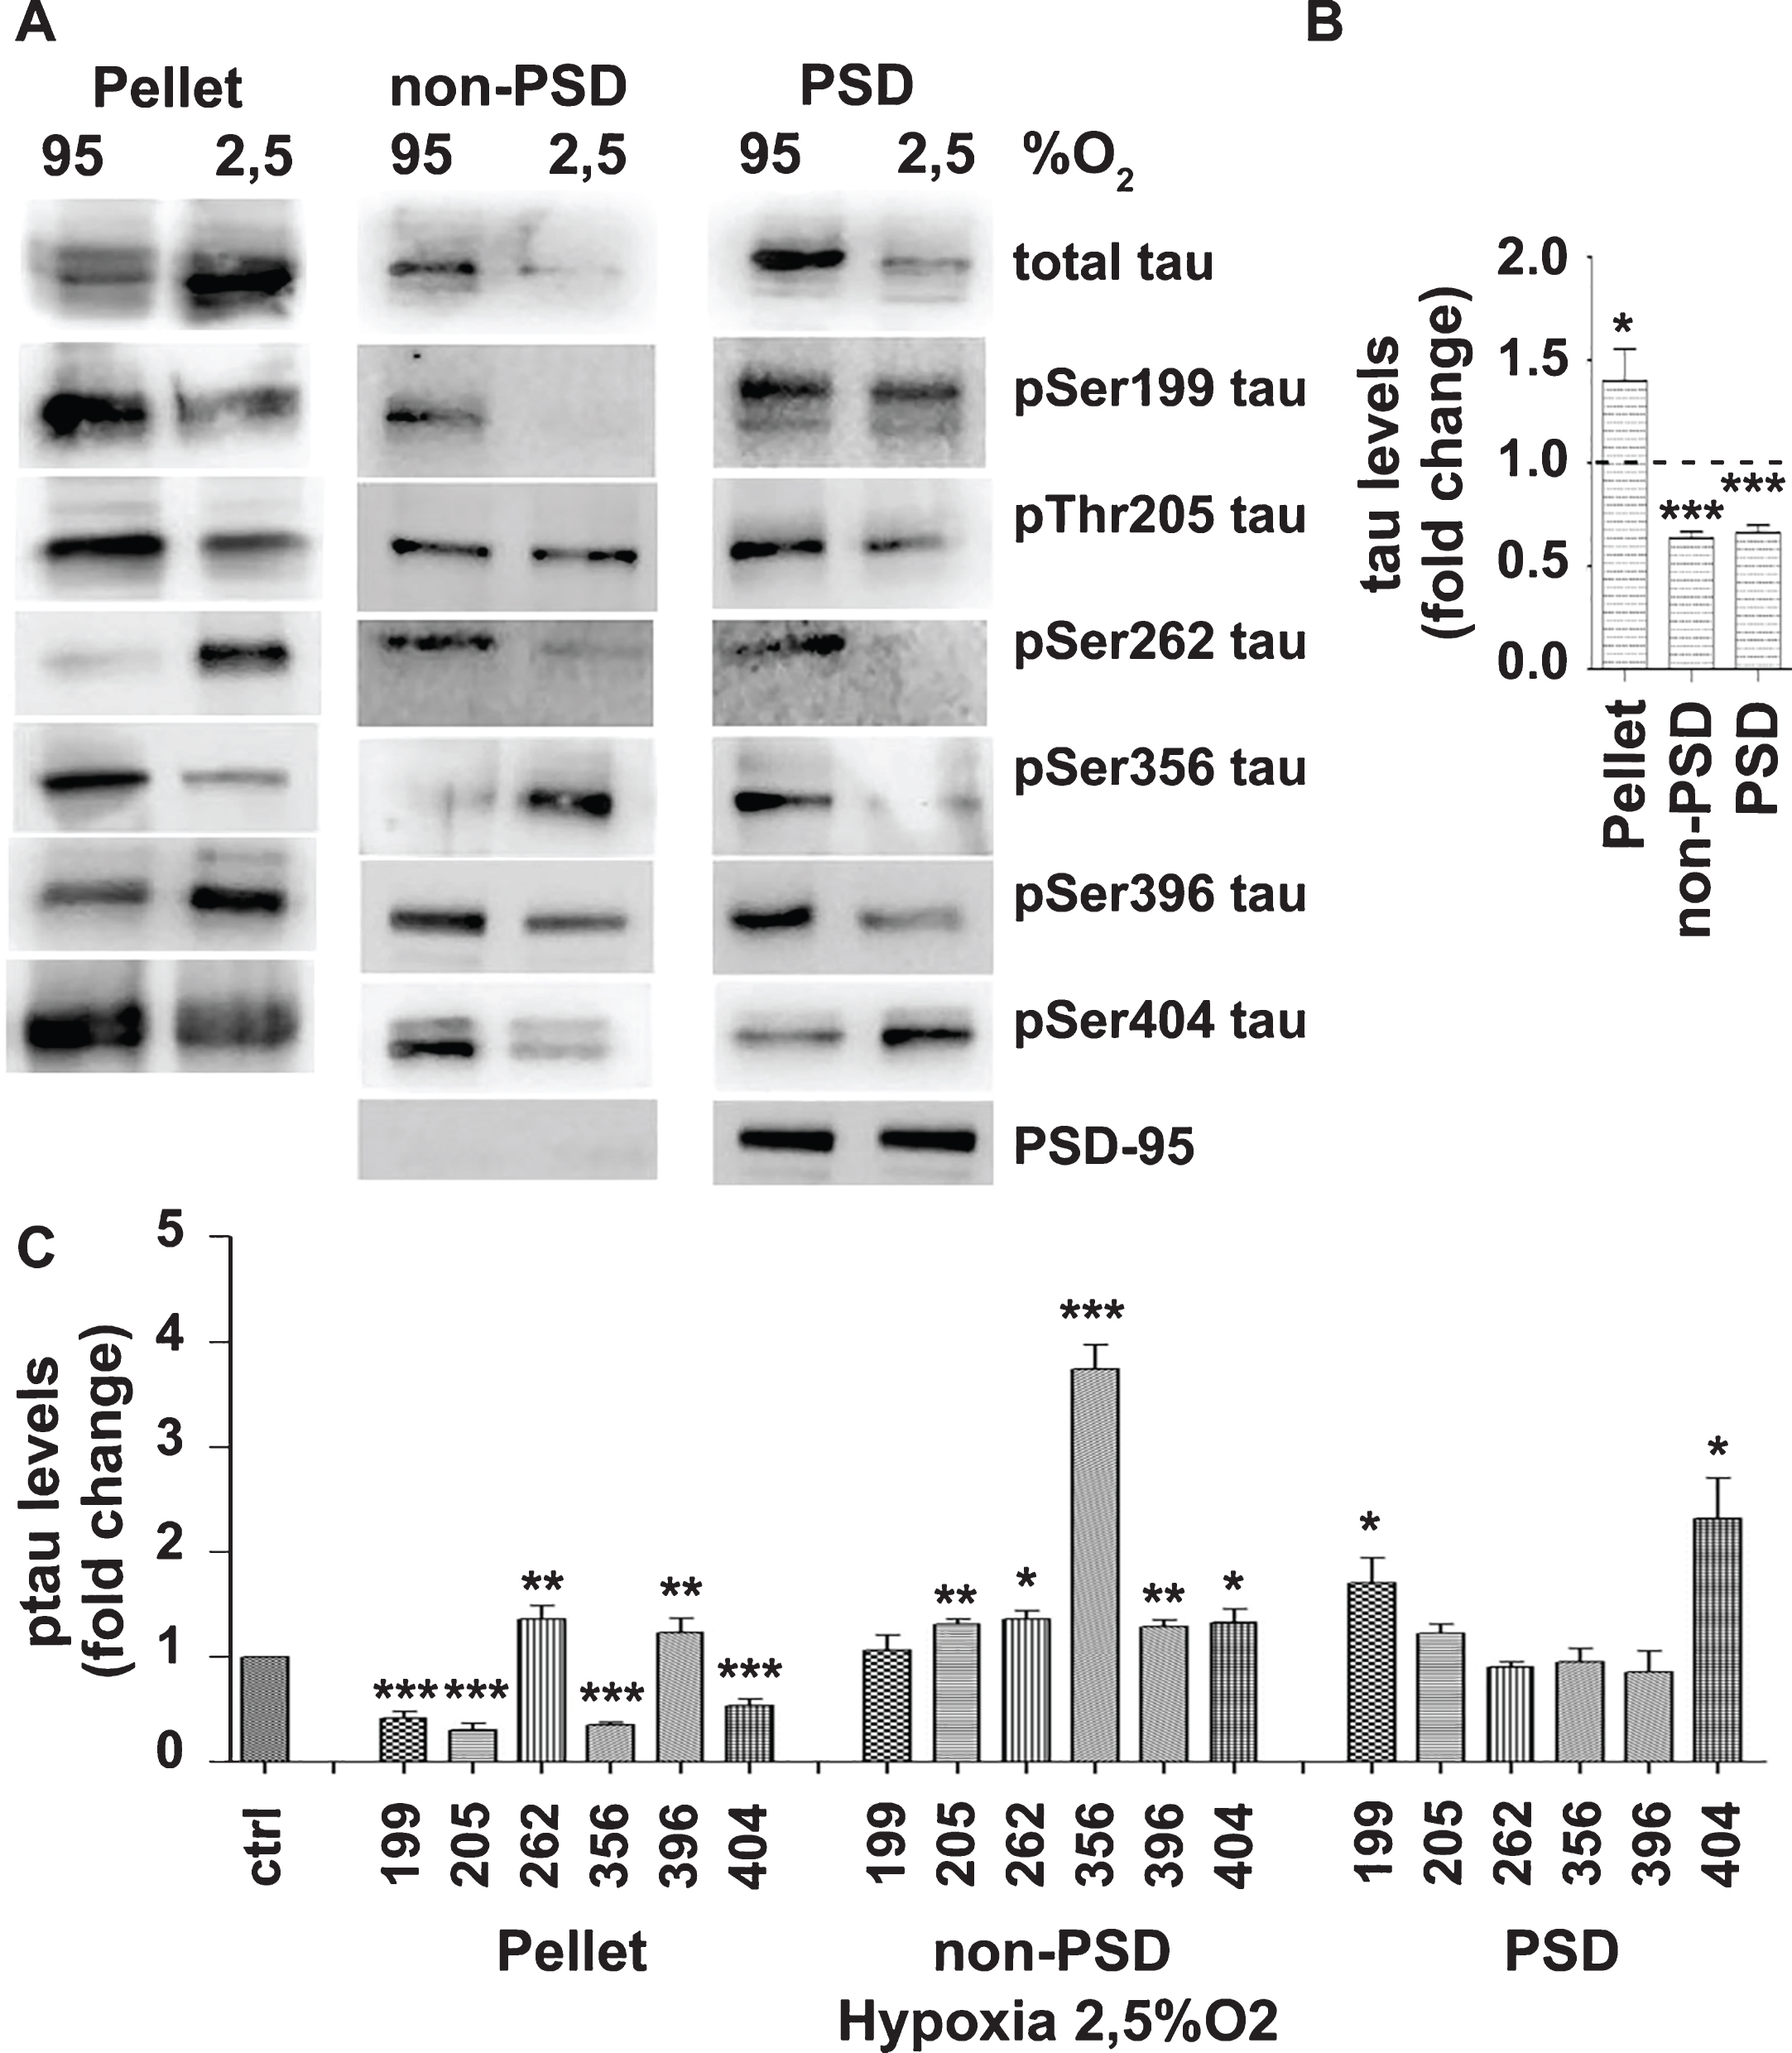
OD affects the distribution of total tau and certain phosphorylation tau variants. Brain slices from C57Bl/6 wild type mice were perfused with aCSF-containing 10 mM glucose and bubbled with 95% O2 or 2.5% O2. A) Following perfusion for 3 h, samples were fractionated (pellet, non-PSD, PSD) and protein extracts were analyzed by western blot using antibodies against the proteins shown on the right of the panels. The blots are representative of at least three independent experiments. B) Total tau protein levels in samples treated with 2.5% O2 expressed as ratio over the corresponding controls (95% O2). C) Normalization of the phosphorylation levels (shown in A) for the total levels of tau in the corresponding fraction. Data are means±SE of at least three independent experiments. *p < 0.05, **p < 0.01, and ***p < 0.001 compared with control.
The effect of combined oxygen and glucose deprivation on the distribution of total tau and certain phosphorylation tau variants
Finally, the effect of OGD was examined and it was found that the levels of total tau were decreased in all fractions examined (Fig. 7). This finding is in line with the data presented in Fig. 3 indicating tau degradation. Normalization of the data revealed that, following OGD, pellet tau was significantly hyperphosphorylated at Ser262, non-PSD tau was not affected while PSD tau was significantly dephosphorylated at Ser396 and Ser404 (Fig. 7).
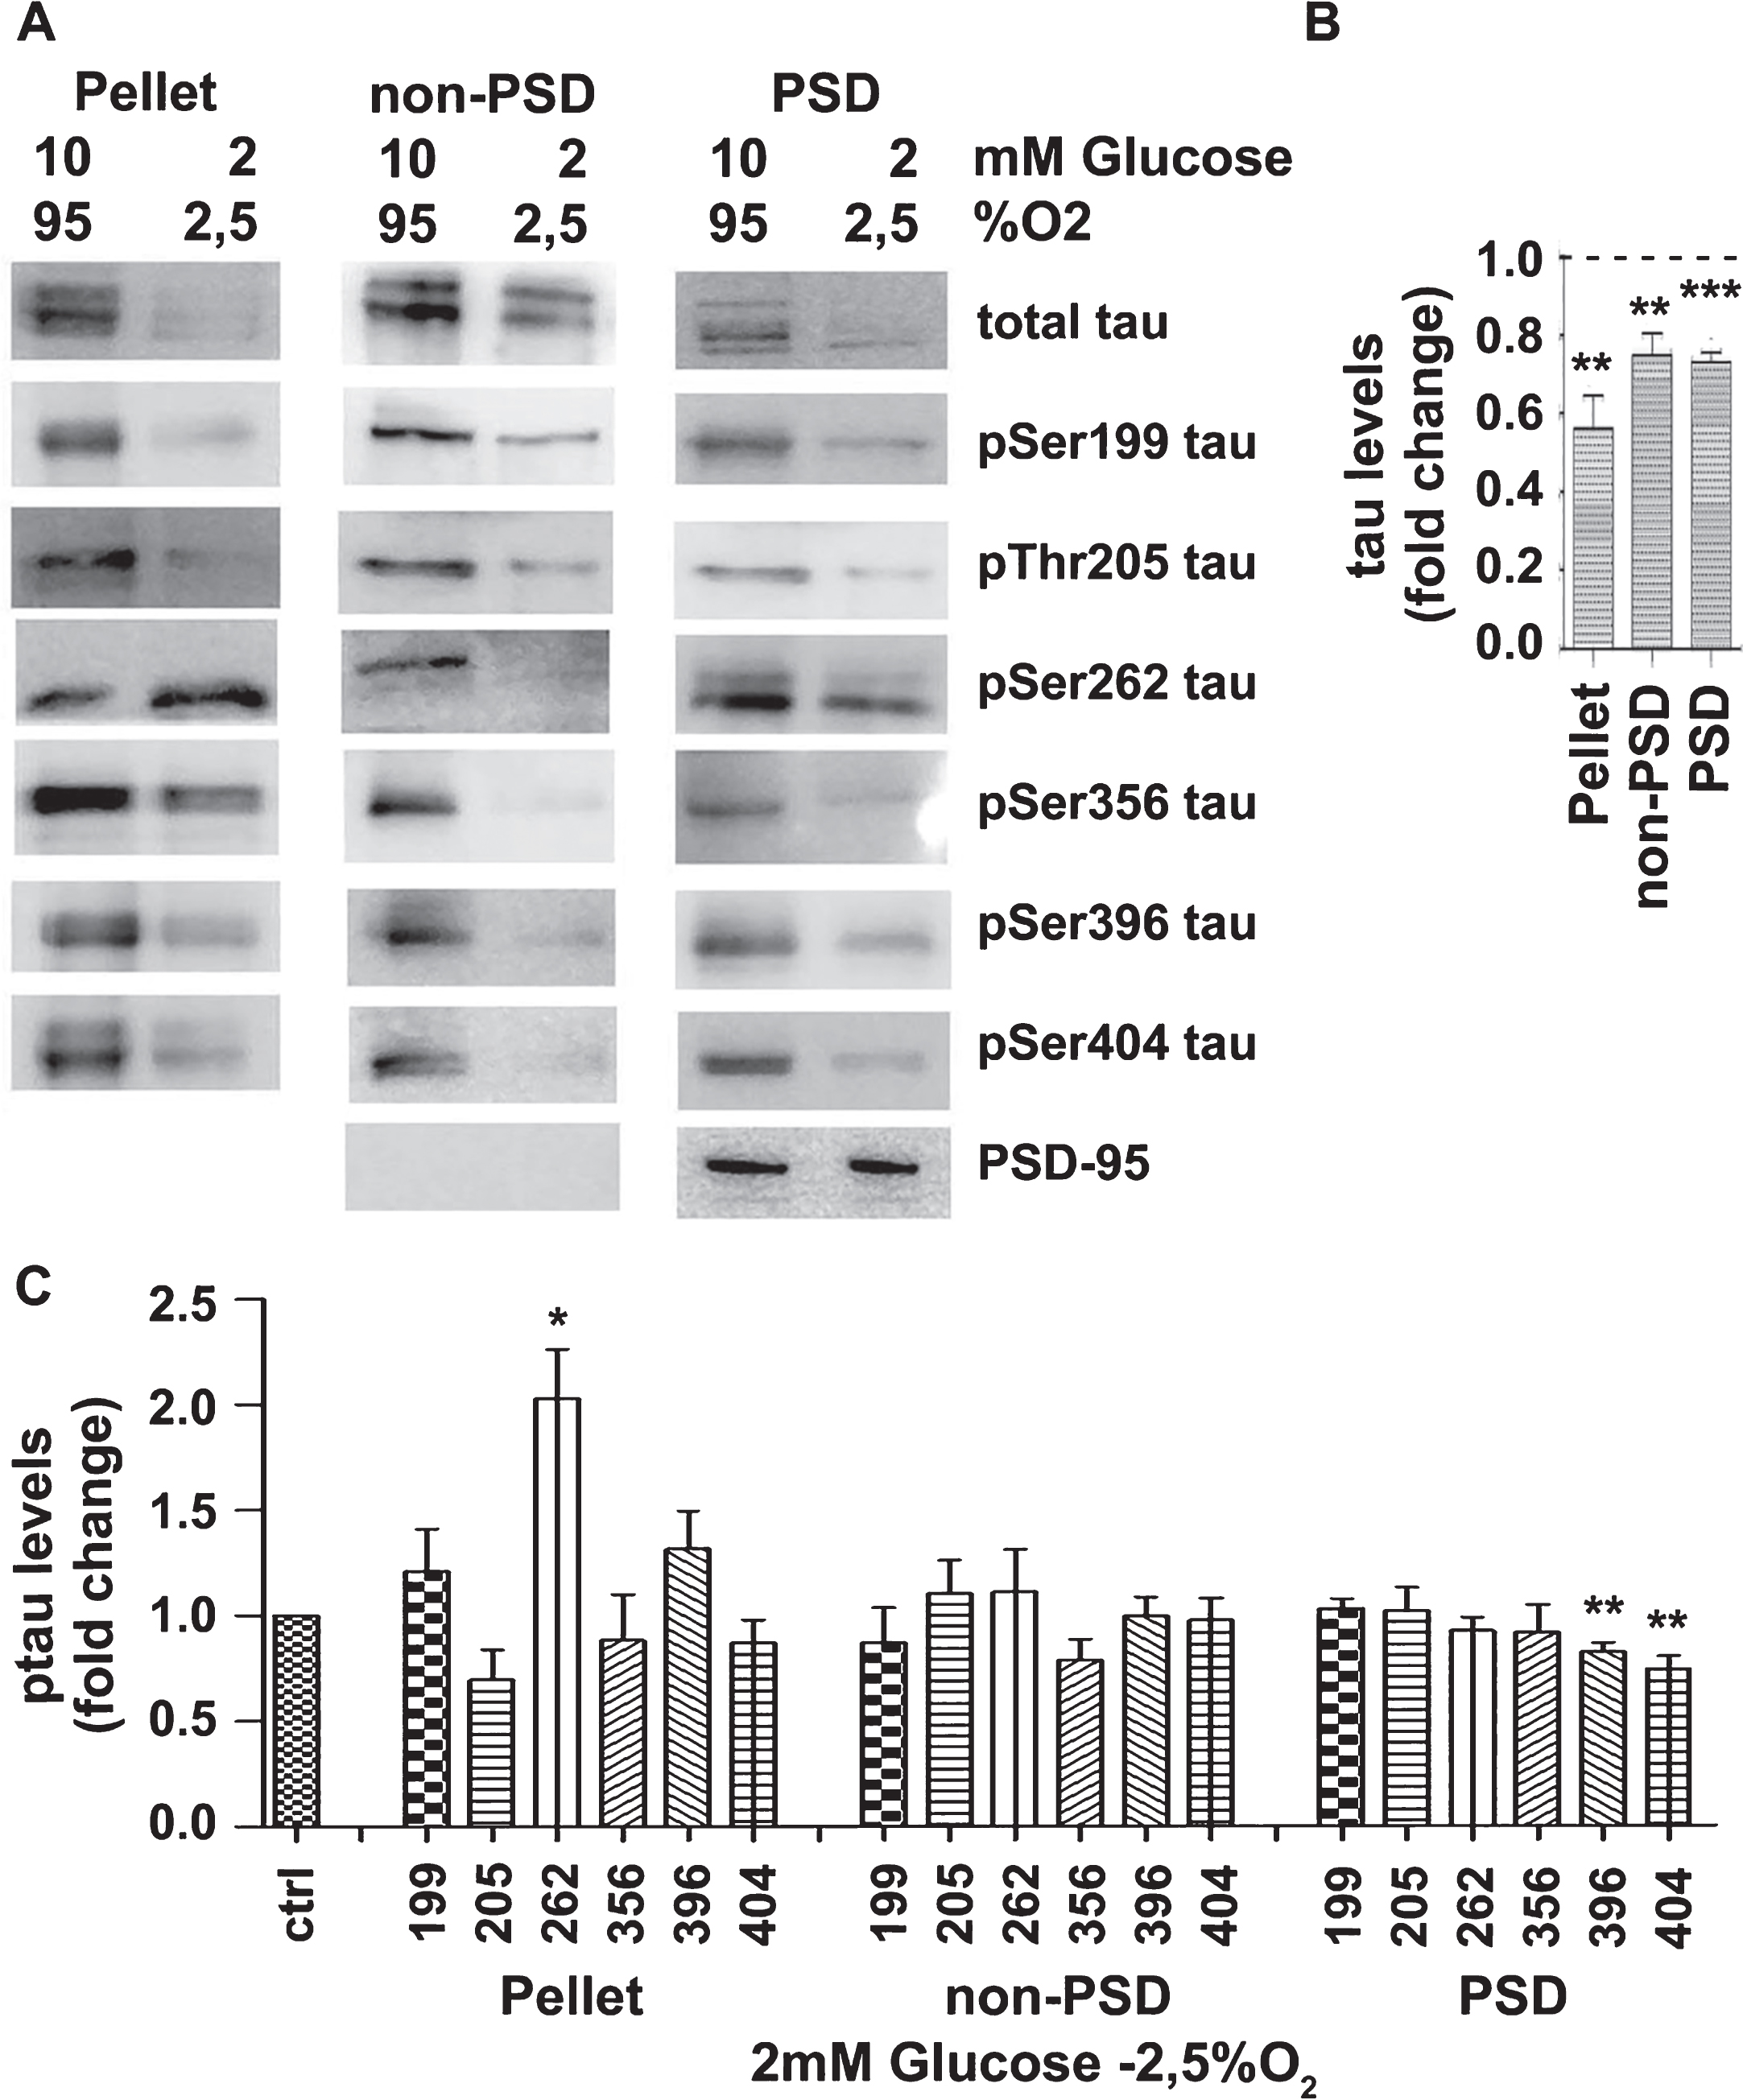
Oxygen and glucose deprivation affects the distribution of total tau and certain phosphorylation tau variants. Brain slices from C57BL/6 wild type mice were perfused with aCSF under control conditions (10 mM D-glucose, 95% O2) or ischemic conditions (2 mM of D-glucose, 2.5% O2). Following perfusion for 3 h, samples were fractionated and protein extracts were analyzed by western blot using antibodies against the proteins shown on the right of the panels. The blots are representative of at least three independent experiments. B) Total tau protein levels in samples treated with ischemic conditions (2 mM glucose, 2.5% O2) expressed as ratio over the corresponding controls (10 mM glucose, 95% O2). C) Normalization of the phosphorylation levels (shown A) for the total levels of tau in the corresponding fraction. Data are means±SE of at least three independent experiments. *p < 0.05, **p < 0.01, and ***p < 0.001 compared with control.
DISCUSSION
Among the biological factors that have been implicated in the development of Late Onset AD is blood hypoperfusion of the brain as a result of aging, cardiovascular diseases, and other factors. Even mild but prolonged blood hypoperfusion of the brain will result in reduced supply of oxygen and glucose, which is the primary source of energy in neuronal cells. On this basis, the effect of GD and/or OD on the levels and phosphorylation of tau as well as the distribution of tau and certain tau phosphorylation variants in various subcellular fractions was examined.
Previous studies focused on the effect of OD and GD on tau phosphorylation yielded inconsistent results. Burkhart et al. have found that tau undergoes rapid but reversible de-phosphorylation after short exposure of brain slices to OGD, while Zhao et al. have shown that OGD of rat cortical neurons results in hyperphosphorylation of tau [37, 38]. GD of neuronal cells was found to induce tau phosphorylation [39, 40] or to have no effect [36].
Our results indicate that GD (2 mM and 5 mM glucose) had no effect on the total levels of cellular tau, clearly indicating that it does not cause tau degradation. This is in contrast to a previous study indicating that GD increased total levels of tau [36]. GD had also no effect on tau phosphorylation at Ser199, Ser262, Ser396, and Ser404. In support, Liu et al. have shown that GD of rat brain slices did not affect tau phosphorylation at Ser199/202 and Ser396/404 [36]. Contrarily, GD of neuronal cells resulted in tau hyperphosphorylation [39, 40]. Tau phosphorylation is regulated by a balance between several kinases and phosphatases. Among those, activation of GSK3β kinase and PP2A phosphatase, the prominent enzymes suggested to regulate tau phosphorylation, was also examined. GSK3β, a downstream kinase in the PI3K/Akt signaling pathway, is known to phosphorylate tau at the residues examined [19 , 42], while PP2A is a serine/threonine phosphatase that dephosphorylates tau [21, 22]. Our results indicate that perfusion of mouse brain slices with 2 mM Glucose results in inactivation of GSK3β but had no effect on PP2A activity. However, tau dephosphorylation was not observed; therefore, the reduced activity of GSK3β may be compensated by the activation of other kinases including cyclin-dependent protein kinase-5 (Cdk-5), microtubule affinity regulating kinases (MARK), cAMP-dependent protein kinase (PKA), and others [19 , 43]. The use of kinase inhibitors may allow the determination of the specific kinases involved. It is important to note that other studies have also shown dissociation of the activity of GSK3β and tau phosphorylation [35, 39]. Similar results were obtained in brain slices derived from glut3 + /–mice, which lack one copy of the neuronal transporter of glucose, or in brain slices perfused with aCSF containing 2-Deoxy-Glucose and D-Glucose at ratios 1:3, 1:1, or 3:1 (Supplementary Figure 1).
OD had also no effect on the levels of total cellular tau, indicating that tau is not degraded. However, significant reduction of tau phosphorylation in all serine residues examined was detected, indicating an unbalance between the activity of kinases and phosphatases. Notably, OD resulted in activation of both GSK3β and PP2A. These results lead to the hypothesis that OD-induced activation of PP2A and possibly of other phosphatases, including protein phosphatase-1 (PP1) and PP2B, overcomes that of GSK3β [21, 22]. The involvement of PP2A is supported by our results, indicating that treatment with okadaic acid reversed the effect of OD. The putative role of other phosphatase may be clarified by using additional phosphatase inhibitors. In support of our results, Liu et al. have shown that acute anoxia of perfused rat brain slices resulted in dephosphorylation of tau and increased activity of PP2A [36].
Interestingly, we found that dephosphorylation of tau was further enhanced under OGD, which better simulates brain ischemia, and both GSK3β and PP2A were activated. These results are in agreement with other studies, indicating that brain ischemia induces dephosphorylation of tau, which is followed by hyperphosphorylation during reperfusion [28 –35] and that OGD results in tau hypophosphorylation [37].
Studies have shown that various factors, including mutations of tau or Aβ treatment, result in redistribution of tau between the post-synaptic compartment and the non-synaptosomal compartment, as well as in differential phosphorylation of tau in these compartments. Zempel et al. have provided evidence that Aβ treatment resulted in increased tau phosphorylation at residues Ser202/Thr205 and Ser262/Ser356 in dendritic regions [12]. They reported that similar changes were evoked by other cell stressors including H2O2, glutamate, and serum deprivation, suggesting a common mechanism of signaling. The importance of phosphorylation in targeting tau to the somatodendritic compartment is highlighted by the fact that mutation of 14 residues of Serine and Threonine (T111, T153, T175, T181, S199, S202, T205, T212, T217, T231, S235, S396, S404, and S422) to negatively charged glutamate residues, in order to mimic phosphorylation, resulted in increased localization of tau to spines [15]. We examined whether GD and/or OD affect distribution of total tau and whether there is a common phosphorylation signature of tau that targets it to certain intraneuronal compartments.
We obtained data showing that GD reduces the total levels of non-PSD tau without affecting total cellular levels of tau. This result indicates that GD triggers exit of tau from this compartment. The phosphorylation profile of non-PSD tau indicates that phosphorylation at Ser262 and dephosphorylation at Ser199, Thr205, and/or Ser404 is important for maintaining or even for moving tau into this compartment. GD resulted in increased levels of total PSD tau, suggesting that tau moves into this compartment. The phosphorylation profile of PSD tau indicates that dephosphorylation at Ser199, Ser262 and Ser396 is important for moving tau into this fraction.
OD resulted in decreased levels of total non-PSD and PSD tau without affecting total cellular tau. These results suggest that OD triggers the trafficking of tau out of these compartments. The phosphorylation profile of non-PSD tau suggests that phosphorylation at Thr205, Ser396, Ser404, and especially Ser356 is important for maintaining or even for moving tau into this compartment. The phosphorylation profile of PSD tau suggests that phosphorylation at Ser199 and Ser404 is important for localizing tau in this fraction.
In the pellet, both OD and GD, increase the levels of total tau. However, again the phosphorylation status of tau is differentially affected. In GD conditions, tau present in the pellet is hyperphosphorylated at Thr205, Ser262, Ser356, Ser396, and Ser404. In OD conditions, tau present in the pellet is dephosphorylated at Ser199, Thr205, Ser356, and Ser404.
Taken together, our results indicate that GD and OD differentially affect tau distribution and phosphorylation in the various subcellular fractions, suggesting the involvement of different mechanisms. In support, Frandemiche et al. have shown that pharmacological synaptic activation resulted in increased levels of tau phosphorylated at Thr205 in PSDs, while Aβ-treatment resulted in decreased levels of tau phosphorylated at Thr205 and increased levels of tau phosphorylated at Ser404 [13].
These results do not allow us to indicate a signature of phosphorylations/dephosphorylations that determine/predict the subcellular location of tau in neurons under stress conditions in general. Different stressors may affect tau distribution by different mechanisms, and tau distribution to a particular subcellular compartment depends on specific signatures of phosphorylation. In addition, different phosphorylation signatures may target tau to the same compartment. This could be conceived if a specific conformation of tau, rather than specific posttranslational modifications, is important for targeting tau to a subcellular compartment. Further research is required in order to clarify this issue and to provide evidence regarding the mechanism by which phosphorylation of tau affects its subcellular distribution. Several studies have shown that phosphorylation regulates subcellular distribution of proteins but the mechanism is unclear [44 –46]. Our hypothesis is that phosphorylation affects the interaction of tau with chaperone proteins that regulate its trafficking and/or the affinity of the interaction of tau with proteins located at certain subcellular compartments.
OGD resulted in reduced levels of total cellular tau and of total tau present in the subcellular compartments examined. These results indicate that under these conditions, tau is specifically degraded, since the levels of GSK3β, Akt, or PP2A are not affected (Fig. 3). We obtained evidence indicating that the proteasome is involved in tau degradation. Unraveling the signaling pathway that results in specific tau degradation may indicate means of pharmacological intervention for AD.
In summary, our study indicates that (1) OD leads to decreased cellular tau phosphorylation, (2) GD does not affect the levels and the phosphorylation of total cellular tau, (3) OGD results in tau degradation and further downregulation of cellular tau phosphorylation, (4) GD or OD affect the levels of tau and the levels of certain phosphorylated variants of tau at certain subcellular compartments, including the PSD, (5) activation of GSK3β does not consistently correlate with tau phosphorylation.
Footnotes
ACKNOWLEDGMENTS
Special thanks to Fotis Badounas for technical support related to mice.
This research has been co-financed by the European Union and Greek national funds through the Operational Program “Education and Lifelong Learning” of the National Strategic Reference Framework (NSRF)-Research Funding Program: APIΣTEIA–UOA-“The effect of glucose deprivation on the development of Alzheimer’s disease neuropathology” GLUCOSAD/1507 and partly supported by the Transgenic Technology Lab of Hellenic Pasteur Institute.