
Abstract
Alzheimer’s disease (AD) is an age-related neurodegenerative pathology associated with accumulation of DNA damage. Inflammation and cell cycle alterations seem to be implicated in the pathogenesis of AD, although the molecular mechanisms have not been thoroughly elucidated to date. The aim of the present study was to evaluate whether peripheral blood mononuclear cells (PBMCs) of AD patients display alterations in gene expression profiles, focusing on finding markers that might improve the diagnosis of AD. Blood samples were collected from 22 AD patients and 13 healthy individuals to perform genome-wide mRNA expression. We found 593 differentially expressed genes in AD compared to controls, from which 428 were upregulated, and 165 were downregulated. By performing a gene set enrichment analysis, we observed pathways involved in inflammation, DNA damage response, cell cycle, and neuronal processes. Moreover, functional annotation analyses indicated that differentially expressed genes are strongly related to pathways associated with the cell cycle and the immune system. The results were compared with those of an independent study on hippocampus samples, and a number of genes in common between both studies were identified as potential peripheral biomarkers for AD, including DUSP1, FOS, SLC7A2, RGS1, GFAP, CCL2, ANGPTL4, and SSPN. Taken together, our results demonstrate that PBMCs of AD patients do present alterations in gene expression profiles, and these results are comparable to those previously reported in the literature for AD neurons, supporting the hypothesis that blood peripheral mononuclear cells express molecular changes that occur in the neurons of AD patients.
Keywords
INTRODUCTION
Alzheimer’s disease (AD) is an age-related chronic neurodegenerative disorder that has an immense impact on the healthcare system, considering the overall increasing age of the population worldwide [1]. The pathophysiology of AD is complex, and many hypotheses have been formulated to explain the basis and development of this disease. Several alterations in AD patients have been reported, such as protein deposition, neuronal cytoskeleton modifications, neuronal and white matter loss, mitochondrial dysfunction, ion calcium dysregulation, inflammation, cell cycle dysfunction, and others [2–7]. Thus, AD characteristics suggest that many pathways are dysregulated in the pathology [8], and attempts have been made to define which factors are involved as causal, and which might be involved as a consequence of AD. However, despite extensive studies in recent decades, the pathogenesis of AD remains to be elucidated.
Moreover, an accurate diagnosis of AD is complicated and depends on clinical and neuropsychological examinations, and requires the exclusion of other types of dementia [9, 10]. Thus, AD diagnosis is generally late and inaccurate. However, it has been proposed that early diagnosis and early treatment are crucial to achieving a better response and delaying the progress of the disease [11].
Imaging techniques and cerebrospinal fluid (CSF) biomarkers have improved diagnostics. However, those methods are either costly or invasive, posing a significant limitation for clinical applications [12]. The use of blood cells may offer possibilities to improve AD diagnosis in clinical practice. The easier sampling of blood compared to CSF and the availability of sensitive methods may allow detection of AD alterations at early phases of the disease.
The use of blood cells for AD diagnostics has already been studied by Booij et al. [12] and Rye et al. [13]. The first work performed a whole genome screening using an oligonucleotide microarray analysis on blood samples from a large cohort of AD patients and healthy cognitive controls. The authors accurately identified and validated gene expression signatures of AD patients at early stages of the disease. Moreover, Rye et al. [13] selected some genes that were already pointed by Booij et al. [12] and created a 96-gene expression array test to detect early stages of AD, and they obtained 80% clinical accuracy in AD diagnostic. Although these results are promising, further studies are needed to confirm those findings in other populations worldwide.
In the present study, we aimed to compare gene expression profiles of peripheral blood mononuclear cells (PBMCs) from Brazilian AD patients and age-matched controls to identify differentially expressed genes that might be relevant to the etiology and/or progression of the disease, thus providing information to validate PBMCs as a reliable tool for AD diagnostics. As a whole, our results showed that PBMCs present alterations in biological pathways that correlate with functional modifications observed in AD patients, supporting the idea that blood cells are an important source of information regarding the changes that occur in AD brains, reinforcing AD as a systemic disease. Furthermore, we found eight genes (DUSP1, FOS, SLC7A2, RGS1, GFAP, CCL2, ANGPTL4, and SSPN) that were upregulated in both blood cells and hippocampus regions, and they are candidates to be further investigated in the search for biomarkers that may characterize AD.
MATERIALS AND METHODS
Subjects
The patients were selected and recruited from the Geriatrics section of the Clinical Hospital at Ribeirão Preto Medical School, University of São Paulo, Brazil. Blood samples were collected from a total of 22 AD patients and 13 age-matched healthy controls. All AD patients were diagnosed based on the criteria established by the DSM-IV (Diagnostic and Statistical Manual of Mental Disorders 4th Edition) and NINCDS-ADRDA (National Institute of Neurological and Communicative Disorders and Stroke and The Alzheimer’s Disease Related Disorders Association). It should be noted that neuropathological exams were not performed, and patients were classified as probable sporadic AD once their symptoms appeared later than 65 years of age (late onset). The AD group was divided into two subgroups according to their Clinical Dementia Rating (CDR), which is the cognitive impairment scale most often used to determine the clinical phase of the dementia. In this study, 15 individuals were classified as CDR1, or mild AD, and 7 as CDR3, or severe AD. Age-matched controls were also recruited while undergoing regular follow-up at the Clinical Hospital. Control individuals were also submitted to all cognitive evaluations and were considered to present normal memory and cognitive capacity. AD and control individuals underwent a series of clinical exams to exclude other diseases. Smokers and individuals with other dementia subtypes were also excluded. Only patients with low Hachinski ischemic scores were included. Characteristics presented by patients are shown in Table 1. The local Ethical Committee from the Clinical Hospital - Ribeirão Preto Medical School, USP, approved the study and informed consents were obtained from all subjects enrolled in the study.
Characteristics of AD and controls samples utilized in microarrays
aPDA, patients with DA and CDA: age-matched healthy controls. bCDR, Clinical Dementia Rating (1-mild, 2-moderate, 3-severe). cMMSE (Mini-Mental State Examination): exam extensively used to estimate the severity of the cognitive impairment in dementia.
Blood collection and isolation of peripheral blood mononuclear cells
Peripheral blood from all patients was collected by venipuncture in vacuum blood tubes containing EDTA (0.054 mL/tube) (BD Vacutainer). The PBMCs were then separated by density gradient using Ficoll-Hypaque (Sigma, St. Louis, MO), following the manufacturer’s instructions.
RNA extraction
Total RNA isolation was performed using the Trizol reagent (Invitrogen, Carlsbad, CA), according to the manufacturer’s protocol. Samples were quantified and evaluated for purity using a NanoDrop ND-1000 (NanoDrop Products, Wilmington, DE). Sample integrity was also evaluated by electrophoresis in a nanofluidic device, the Bioanalyzer 2100 (Agilent Technologies, Santa Clara, CA). RNA samples used for microarray analysis were suitable for the experiments only when the RNA integrity number (RIN) was higher than 7.0.
Microarrays
PBMCs expression profiles were carried out using the Human GE 4×44K V2 Microarray kit (G4845A) and the QuickAmp Labeling (monocolor system-Cy3) kit (Agilent Technologies, Santa Clara, CA), according to the manufacturer’s protocol. The microarray slides cover all transcripts already described in humans. Each slide contains 4 arrays comprising 44,000 oligonucleotides representing 27,958 targets and positive controls. Briefly, RNA samples were initially submitted to cDNA synthesis by reverse transcription, followed by generation of fluorescent cRNA. cRNA was purified, and samples were then prepared and added to the slides for the hybridization process. The slides were incubated for 17 h in a hybridization oven and were subsequently washed and scanned in a high-resolution scanner Surescan (Agilent Technologies). Data from the samples included in this study are available at the public database ArrayExpress (EMBL-EBI) (https://www.ebi.ac.uk/arrayexpress/) under accession number E-MTAB-6094.
Normalization and statistical analysis
The raw data were obtained using the Feature Extraction software v.10.7 (Agilent Technologies) and analyzed in the R environment v. 3.3.0 (https://www.r-project.org/). The median signals (gMedianSignal and gBGMedianSignal) were used. Following background subtraction and log2 scale transformation, normalization was performed using the quantile method with the aroma. light package (http://www.bioconductor.org/packages/release/bioc/html/aroma.light.html). Differentially expressed mRNAs were obtained by Rank product analysis using the RankProd package [14], considering p-values and false positive predictions (pfp) ≤0.05. Moreover, we compared the data obtained in this work with the data provided in the Supplementary material of Miller et al., in which they compared hippocampus regions of AD patients and age-related controls [15].
Functional annotation analysis
Genes considered differentially expressed were submitted to functional enrichment analysis using DAVID (Database for Annotation Visualization and Integrated Discovery, http://david.abcc.ncifcrf.gov/) [16], a tool that identifies biological processes associated with differentially expressed genes by integrating a range of databases. Two types of analyses were carried out, considering biological functions according to Gene Ontology, BBID, Biocarta, and KEGG databases. Then, we performed an analysis in which the OMIM and Genetic Association databases were used to identify diseases related to the differentially expressed genes obtained in our work. Only pathways that reached a false discovery rate (FDR) < 25% and p < 0.05 were selected.
Gene set enrichment analysis (GSEA)
The normalized data was used as input into GSEA (Broad Institute). This tool is suitable to evaluate expression variations in gene sets that could be relevant to identify altered biological processes in the comparison between AD and the control group. GSEA considers minimal variations in gene expression levels that are significant when a gene set is considered. The computational method developed and described by Subramanian et al. [17] was applied to define whether a gene set that was a priori defined according to standard databases (KEGG, REACTOME, and BIOCARTA) shows statistical significance for the comparison between two biological states (AD versus controls). The analysis report comprised values for each gene set as an enrichment score, a normalized enrichment score, a false discovery rate, and a nominal p value. Then, this study considered pathways enriched according to the scores obtained for p-values < 0.05 and FDR <25%.
RESULTS
Whole genome RNA microarray analysis was performed to compare profiles of transcriptional gene expression displayed by PBMCs of AD patients compared to age-matched controls. The results generated by bioinformatics and statistical analyses indicated a list of 593 differentially expressed genes: 428 upregulated and 165 downregulated in the AD group compared to its control group (Supplementary Table 1). These lists were submitted to the DAVID tool for identifying pathways associated with those genes; the functional enrichment analysis applied to the set of 428 upregulated genes in AD indicated enriched pathways related to inflammation, immunological system, cell cycle and proliferation (Supplementary Figure 1). For the list of 165 downregulated genes, we found enriched pathways related to gas transport, hemoglobin metabolism and cell signaling (Supplementary Figure 1). Moreover, by performing GSEA on the same data set, we found 70 pathways that were enriched (Table 2 and Supplementary Table 2), such as cell cycle control and immune system.
Enriched pathways obtained in the comparison of AD and age-matched controls after performing the analysis of transcript expression by using the Gene Set Enrichment Analysis (GSEA) tool
p < 0.05 and FDR < 5%.
Considering the heterogeneity of the AD group composed of patients with mild (CDR1) and severe (CDR3) AD, the results were analyzed aiming to detect differences in gene expression levels according to the disease stages. A comparison of the 15 CDR1 patient subgroup (n = 15) with the control group (n = 13) generated a list of 449 differentially expressed genes (Supplementary Table 3). When the CDR3 (n = 7) and control groups were compared we found 251 differentially expressed genes (p < 0.05) (Supplementary Table 4). Of the genes differentially expressed between either CDR1 or CDR3 AD subgroups and the control group, 116 were common to both AD subgroups (Fig. 1).

Amount of differentially expressed genes selected in mild AD (CDR1) and severe AD (CDR3) compared to control group. Venn diagram shows the number of differentially expressed genes in each group, and common genes between the two comparisons: CDR1 versus age-matched controls and CDR3 versus age-matched controls.
Furthermore, 418 differentially expressed genes were found comparing CDR1 and CDR3, of which 332 genes were upregulated and 86 were downregulated in CDR1 relatively to CDR3 (Supplementary Table 5). For the CDR1 group, in general, the upregulated genes were related to cell proliferation, immune system, and neurological functions, while the functions of downregulated genes are linked to cell signaling and hemoglobin metabolism. Considering the upregulated genes in the CDR3 group compared to the CDR1 group, the biological classes were mostly related to neurological function and inflammation, while the downregulated genes are involved in pathways such as ion channels regulation, gas transport and olfactory transduction (Supplementary Figure 2).
In addition, functional enrichment analyses applied to the upregulated genes selected for AD subgroups (CDR1 compared to CDR3) showed pathways linked to neurological process (synaptic and nerve impulse regulation) and inflammation (Supplementary Figure 3). On the other hand, functions attributed to downregulated genes were associated with ionic regulation, cytoskeleton, gas transport, cell signaling and olfactory transduction (Supplementary Figure 3). GSEA was also applied to compare CDR1 versus CDR3, and several pathways were selected as enriched, some of which were also related to cell cycle regulation and neuronal function (Table 3).
Pathways obtained from GSEA analysis for the comparison between CDR1 and CDR3. p < 0.05 and FDR < 25%
Considering that neurodegeneration is the most prominent and harmful characteristic of AD and the potential of PBMCs to manifest important molecular changes that might occur in the brain of patients, we looked for common expressed genes between brain and blood. Then, we compared our results in PBMCs with previously published data from Miller et al. [15], in which the authors compared the results obtained for the hippocampus of 17 individuals with AD versus 16 age-matched controls. The authors used Illumina HumanHT-12 v3 Expression Beadchips (Illumina, San Diego, CA, USA) and performed the analysis for two hippocampus regions, CA1 (the most affected region in AD) and CA3 (the least affected region in AD).
Comparing the results obtained in the present work with the list of 1,028 genes differentially expressed reported by Miller et al. [15] in region CA1 of AD patient hippocampi, we found 28 common genes; from these, 14 upregulated and 3 downregulated genes were found in both works (Fig. 2). In addition, regarding Miller’s results obtained for hippocampi region CA3 (603 differentially expressed genes in AD compared to the control), the comparison with our results provided 14 genes that were common in both studies (10 upregulated, 2 downregulated genes and 2 whose regulation was in the opposite direction) (Fig. 3).
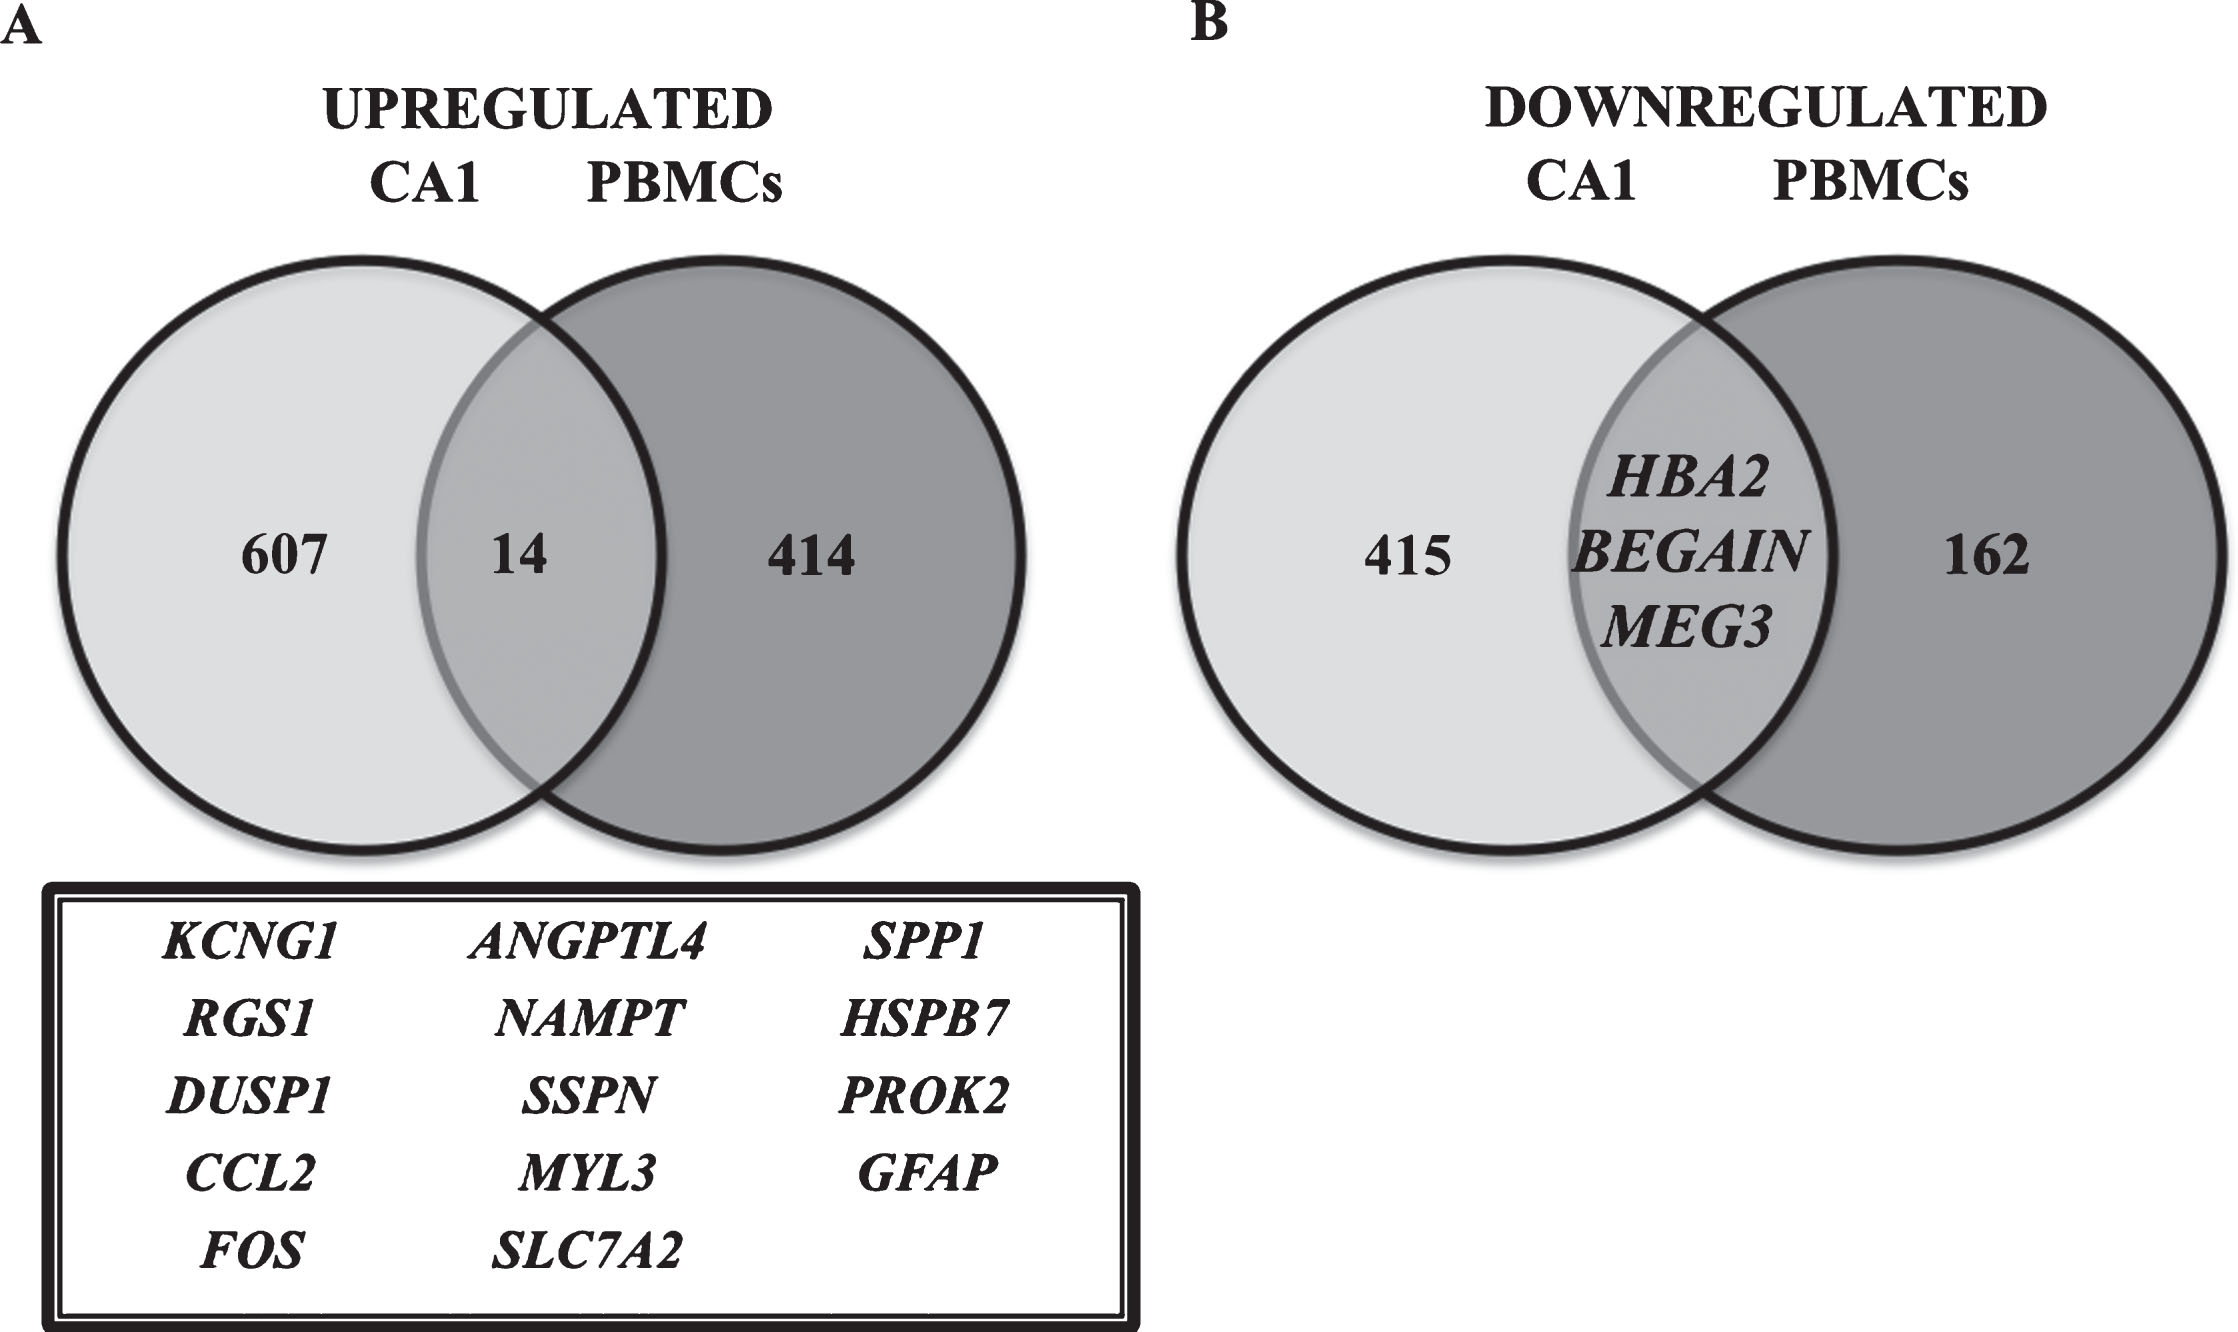
Differentially expressed genes in PBMCs and hippocampus CA1 region [14] of AD individuals, compared to age-matched controls. Venn diagram is showing differentially expressed genes that are common or exclusive when the results of this study in PBMCs were compared with Miller’s study in CA1 region of the hippocampus [14]. The number of common genes in both studies is represented, as well as the gene names (inside the box). A) Representation of the number of upregulated genes and B) downregulated genes.
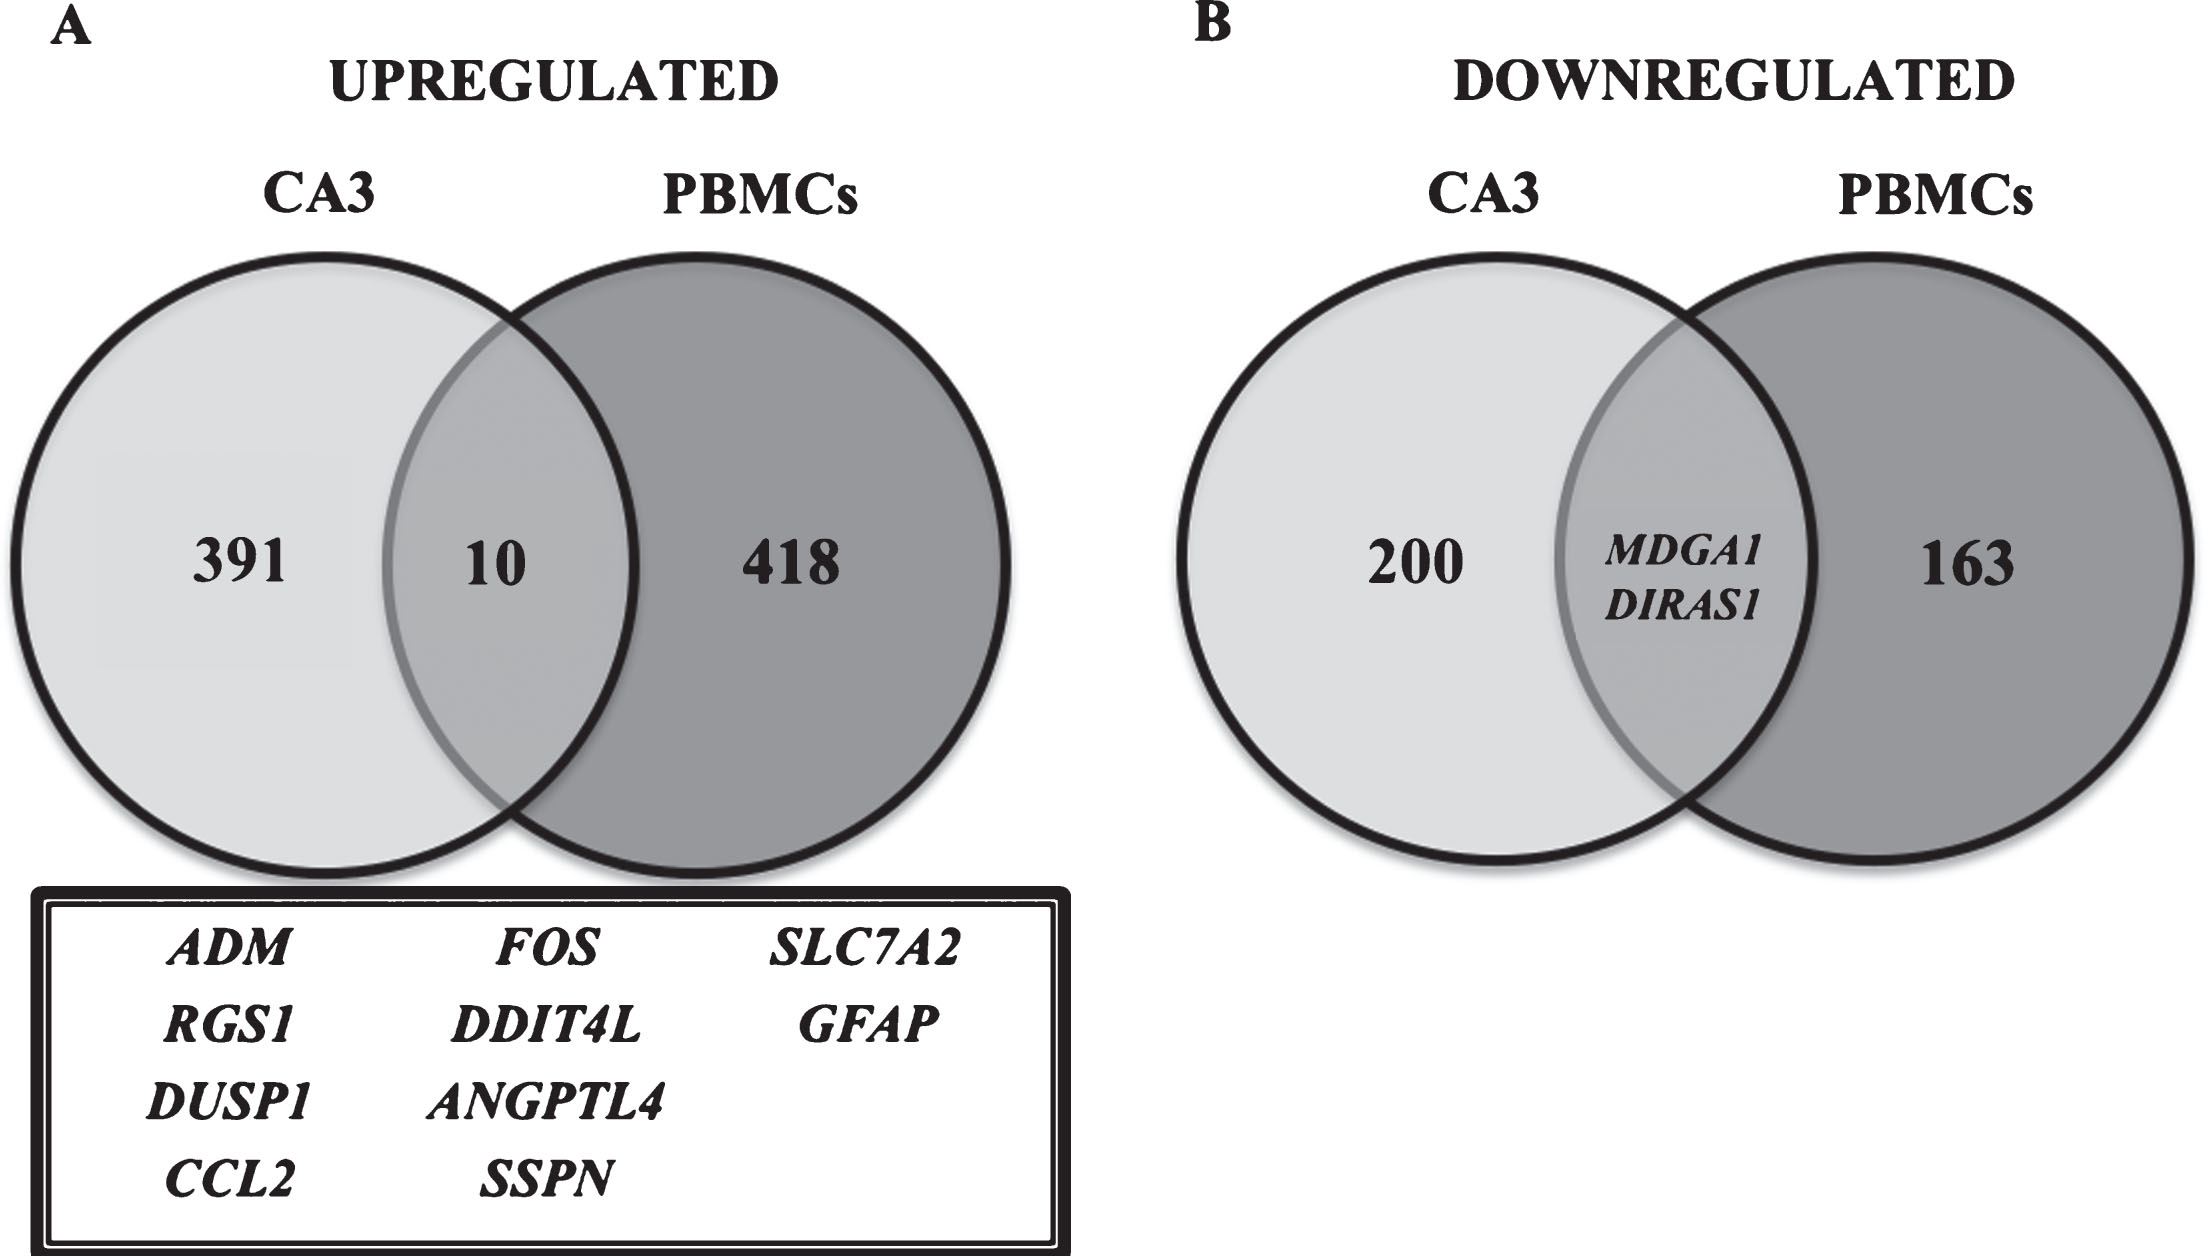
Differentially expressed genes in PBMCs and hippocampus CA3 region [14] of AD individuals compared to age-matched controls. Venn diagram showing differentially expressed genes that are common or exclusive when the results of this study in PBMCs were compared with Miller’s [14] study in CA3 region of the hippocampus. The amount of upregulated and downregulated genes in both studies is represented, as well as the names of genes (inside the box). A) Representation of the number of upregulated genes; B) downregulated genes.
Therefore, considering the abovementioned results from comparisons between hippocampi and PBMCs, we can highlight the following genes: FOS, SSPN, DUSP1, RGS1, ANGPTL4, and CCL2, which were found to be upregulated in CA1, CA3, and PBMCs.
DISCUSSION
Analysis of gene expression profiles carried out for PBMCs of AD patients compared to age-matched control subjects generated a list of 593 differentially expressed genes in AD patients, and functional analyses indicated the involvement of relevant pathways. We found 428 upregulated genes in the AD group, and most gene functions were found associated with cell proliferation, apoptosis, immune response, and learning/memory, among others. Interestingly, some of these pathways are exclusively involved in brain physiology, such as learning and memory.
Previous studies demonstrated that neurons, the principal cells implicated in AD, are able to re-enter the cell cycle following genomic instability. This process can lead to apoptosis, further culminating into neurodegeneration [18–21]. Additionally, cell cycle dysfunction was also reported in blood cells of AD patients [22–24]. Alterations in the expression of proteins that participate in cell cycle control in lymphocytes of AD patients, such as TP53, a key protein involved in cell fate after induction of DNA damage and apoptotic signaling, have also been demonstrated [25]. Moreover, an increased expression of CDKN1A, which encodes a cyclin-dependent kinase inhibitor whose role is related to the control of G1/S transition, has been observed [25]. Thus, considering that cell cycle alterations play a role in AD neurodegeneration and that most PBMCs are also postmitotic cells, alterations on cell proliferation observed in this work reinforce the results reported by other researchers [22–24]. Therefore, cell cycle dysregulation in neurons and PBMCs from AD patients seems to be an important aspect in the pathology, which deserves further investigation.
Pathways related to inflammation were also found to be enriched in our study with AD patients, and this is compatible to alterations in the immune system and inflammatory responses that were already observed in the brain and blood of AD subjects [26, 27]. Furthermore, some authors consider that immune system dysfunction can be the main cause of AD and protein deposition might be a consequence of this altered immune response [27–30]. Inflammation is an intrinsic condition associated with several alterations observed in AD, as modification of insulin metabolism, mitochondrial dysfunction, oxidative stress, leucocyte migration, apoptosis, and alterations in calcium homeostasis [29, 31]. Therefore, dysregulation of those pathways found in AD, both in brain and blood cells, reinforces the systemic nature of AD and the importance of studying those biological processes in both tissues.
Curiously, learning, and memory pathways were also found upregulated in blood cells of AD patients, despite the exclusive association of these pathways with neurons. In Booij et al. [12], pathways related to neuronal activities were also found to be enriched in blood cells. In our work, differentially expressed genes related to learning and memory, such as EGR1, FOS, EGR2, PTGS2, S100B, PRKAR1B, and PTN, are also implicated in other cellular functions. In general, they are transcription factors or growth factors. Therefore, in PBMCs, these genes can participate in different processes. Thus, alterations in their expression might be systemic and possibly could be related to the symptoms that affect learning and memory.
Moreover, the 145 downregulated genes in AD subjects are correlated with pathways such as gas transport, G-coupled receptor, hemoglobin metabolism, cell signaling, plasma membrane, and, notably, olfactory transduction. Interestingly, some studies showed a relationship between AD and deficiency in mechanisms related to hemoglobin production, culminating in anemia [32], and anemia has been considered a risk factor for AD [33].
Olfactory receptors are members of the G-protein family, and olfactory transduction was considered enriched among downregulated genes in PBMCs of AD, although this pathway has been associated with functions linked to the neuronal system. Interestingly, a decrease in the olfactory capabilities of AD patients has been reported earlier in preclinical phases of the disease [34, 35]. Thus, these findings suggest that the inhibition of the olfactory system could be a feature of AD. Additionally, alterations in pathways related to DNA damage response and DNA repair were also observed in this work in accordance with a decrease in DNA repair capacity previously reported in AD patients [25, 37].
Delvaux et al. [38] performed a multivariate analysis of transcript expression in peripheral blood leukocytes of AD patients and observed alterations in the expression of gene sets whose functions were related to cell cycle, apoptosis, cellular stress and inflammatory systems. Furthermore, these alterations could be used to distinguish AD patients from patients with Parkinson’s disease and age-related cognitive normal individuals [38].
Thus, the present results may indicate that there is a possible correlation among the alterations in transcript profiles observed in PBMCs and the functional alterations that occur along the development of AD.
Another approach in this work consisted in studying gene expression alterations according to the clinical stage of AD patients: mild AD (CDR1) and severe AD (CDR3), compared to the control group. Considering AD as a systemic disease, it is possible that exclusively expressed genes in CDR1 can represent the earliest alterations related to mechanisms responsible for triggering the disease, while genes altered just in CDR3 can be related to modifications occurring as a consequence of the pathology per se.
The results obtained by functional enrichment analyses indicate that processes such as immune response, neurological functions, and inflammation were induced in both the CDR1 and CDR3 groups when compared to the control group, confirming the importance of these pathways during different phases of AD. Bossers et al. [39] analyzed samples of prefrontal cortex of AD patients and found altered gene functions associated with synaptic plasticity, development of nervous system and plasticity. Those genes were highly expressed at early stage of AD in comparison to the later stage [39].
It is important to highlight that in our enrichment analysis, CDR3 compared to controls showed differential transcript expression for pathways related to DNA repair and telomere maintenance. Despite many studies demonstrating telomere shortening in AD blood cells [40–42], the same was not observed in brain regions such as the hippocampus [43]. Although the role of telomere stability is not well established yet in AD, our results suggest some involvement of telomere maintenance in PBMCs, which may be linked to the severity of the disease.
Genes playing a role in DNA repair pathways, such as homologous recombination (HR) and nonhomologous end-joining (NHEJ), were also found enriched in CDR3 compared to controls. Moreover, there is evidence of increased oxidized bases in brains and peripheral cells of AD [44–46], and some studies have associated such alteration with deficiency in DNA repair mechanisms [36, 47–49].
As a whole, the present results indicate that it is possible to distinguish transcriptional expression profiles between AD stages, and in spite of the small number of patients enrolled in our study, our data represent a proof of concept that supports subsequent investigations towards important signaling pathways compromised in AD.
To compare our gene expression profiles in PBMCs with studies using brain samples, we compared our results with those obtained by Miller et al. [15] regarding transcriptional profile analysis in the hippocampi of AD patients [14]. Miller et al. showed expression profiles of two hippocampus regions, highly affected (CA1) and less affected (CA3). The authors highlighted the importance of comparing CA1 and CA3 regions to define risk factors and indicate the vulnerable regions to be affected by AD. By comparing differentially expressed genes in CA1 and PBMCs, we found 28 common genes. However, 11 genes (TMEM176A, OR7A5, PRDM16, HLA-DQA1, LINGO2, TYMS, PEG3, NUAK1, GRIK1, LRRN3, and RCAN2) presented different regulation, being upregulated in CA1, but downregulated in PBMCs, or vice-versa. Moreover, for the comparison of PBMCs versus CA3, we found 14 common genes; among them, SELENBP1 and GINS2 presented opposite regulation.
Therefore, the present work emphasizes shared upregulated genes between PBMCs and brain regions (CA1, and CA3), thus supporting the hypothesis that these genes present a great potential as AD biomarkers. We found 8 common upregulated genes: FOS, SLC7A2, RGS1, GFAP, DUSP1, ANGPTL4, SSPN, and CCL2. Among them, CCL2 and ANGPTL4 were already reported as genes associated with AD in brain and blood cells [50–52]. Although SLC7A2, RGS1, and DUSP1 were not previously related to AD, they have the potential to be investigated as molecular biomarkers of AD, since they were found upregulated in both studies. Regarding gene functions, while SLC7A2 encodes a plasma membrane protein related to amino acid transportation and inflammatory response, RGS1 plays a role in signal transduction and immune response, while DUSP1 encodes a MAP kinase that functions in the cell cycle and calcium ion regulation. Therefore, these three genes present functions related to pathways that were found altered in AD in the present work and are important candidates as biomarkers for AD diagnosis.
FOS, GFAP, and SSPN have already been found to be associated with brain dysfunction in AD [53–55], but there is no similar information in PBMCs of AD patients. Thus, the present work points to the relevance of the FOS, GFAP, and SSPN genes to be investigated as candidate biomarkers of AD.
Interestingly, Blalock et al. [56] also performed whole-genome transcriptomic analysis in the hippocampus of AD patients and, among the upregulated genes selected by these authors, 8 genes (KCNJ15, GFPT2, GSTM4, IFNG, CYP4F3, RGN, SSPN, and GFAP) are in accordance with the upregulated genes found in the present study. Furthermore, SSPN and GFAP were likewise found by Miller et al. [15]. Similarly, Ravetti et al. [55] also analyzed data from AD hippocampi and found some common genes with those selected in the present study, such as EGR, GNAS, GSTA3, IL1A, LTF, SLC8A2, and SSPN.
Moreover, Ray et al. [57] performed a study in blood plasma and pointed out 18 genes as possible markers of AD, among them, EGF, G-CSF, IL3, and IL1A. In our study, the expression of these four genes was also found altered in PBMCs.
Rye et al. [13] performed extensive prospective studies aiming to find a pattern of expression in blood cells of AD patients, providing a blood test for the early detection of the pathology. Despite some concordance in the enriched pathways, such as stress response and chromatin packaging, their results do not match with the data obtained in our study. The differences in both studies may be due to different populations studied (Brazilian in our study and Norwegian in their case), and differences in the methods used in each work. In this context, more studies are needed to establish blood biomarkers that may be able to characterize AD.
In spite of the limitations of the present study, our results provide some important candidate genes that deserve further investigation in the search for blood biomarkers and can be a proof-of-concept supporting PBMCs as valuable diagnostic tools in AD. Therefore, additional studies in a broad cohort that might include previous stages of the disease (such as mild cognitive impairment) are needed to establish biomarkers of AD present in blood cells that might characterize the disease.
Conclusions
Transcriptomic profiles analyzed in PBMCs of AD patients indicate pathways involved in the disease, such as inflammation, cell cycle regulation, and neuronal process, as well as DNA damage response. Our gene expression data compared to the results obtained in the hippocampus [15] identified 8 common genes (DUSP1, FOS, SLC7A2, RGS1, GFAP, CCL2, ANGPTL4, and SSPN) that represent potential peripheral blood biomarkers of AD.
Finally, our findings reinforce the hypothesis that AD is a systemic pathology and supports the assumption that blood cells can be useful tools to understanding the etiopathogenesis and development of the disease. Moreover, our work indicates potential genes to be investigated for this purpose, on the basis of evidence that PBMCs do manifest changes in gene expression profiles compared to non-AD controls.
Footnotes
ACKNOWLEDGMENTS
The authors would like to thank Dr. Douglas V.P.N. Oliveira for the critical reading of this manuscript and Dr. Silvio Bernardes Filho for his effective participation in blood collection. This research received financial support from Brazilian agencies (FAPESP – Proc. 2012/07879-5; 2013/09352-7, CNPq and CAPES) and University of São Paulo – USP (NAP-ENV Project – Pro-Reitoria de Pesquisa-USP).