



Abstract
Alzheimer’s disease (AD) is the most common tauopathy, characterized by progressive accumulation of amyloid-β (Aβ) and hyperphosphorylated tau. While pathology associated with the 4-repeat (4R) tau isoform is more abundant in corticobasal degeneration and progressive supranuclear palsy, both 3R and 4R tau isoforms accumulate in AD. Many studies have investigated interactions between Aβ and 4R tau in double transgenic mice, but few, if any, have examined the effects of Aβ with 3R tau. To examine this relationship, we crossed our APP751 mutant line with our recently characterized 3R tau mutant model to create a bigenic line (hAPP-3RTau) to model AD neuropathology. Mice were analyzed at 3 and 6 months of age for pathological and behavioral endpoints. While both the 3RTau and the hAPP-3RTau mice showed neuronal loss, increased tau aggregation, Aβ plaques and exhibited more behavioral deficits compared to the non-tg control, the bigenic mice often displaying relatively worsening levels. We found that even in young animals we found that the presence of APP/Aβ increased the accumulation of 3R tau in the neocortex and hippocampus. This observation was accompanied by activation of GSK3 and neurodegeneration in the neocortex and CA1 region. These results suggest that in addition to 4R tau, APP/Aβ may also enhance accumulation of 3R tau, a process which may be directly relevant to pathogenic pathways in AD. Our results demonstrate that this bigenic model closely parallels the pathological course of AD and may serve as a valuable model for testing new pharmacological interventions.
Keywords
INTRODUCTION
Alzheimer’s disease (AD) is a heterogeneous neurodegenerative disorder [1–3] that affects over 5.3 million in the US alone [4]. Part of the explanation for the heterogeneity may relate to the fact that AD is, as a polyproteinopathy, characterized by the accumulation and transmission of proteins involved in synaptic function, including amyloid precursor protein (APP)/Aβ, tau, ApoE, α-synuclein (α-syn), and TDP-43 [5–7]. The mechanisms leading to the accumulation of multiple proteins in AD are not completely understood, however defective protein clearance, including alterations in autophagy [8, 9] and proteolysis [6] of aggregates, might be centrally involved. Tau is a major neuronal cytoskeletal protein encoded by an alternatively spliced gene present on chromosome 17 (MAPT) [10]. Six different isoforms of tau are found in the CNS, and are differentiated by the of microtubule binding repeats (i.e. 3R vs 4R) [11] there is 3R and 4R tau. While 4R accumulation is abundant in corticobasal degeneration, supranuclear palsy and AD; 3R tau accumulation is found in Pick’s disease and AD [12].
Hyperphosphorylation of tau is considered a critical step in tau detachment from microtubules and self-aggregation. Tau aggregates form neurofibrillary tangles (NFTs) composed of paired helical filaments (PHF), a defining characteristic of tauopathies, which may disrupt neuronal function. The damage of these occurrences is twofold; the NFTs obstruct axonal transport, while the microtubules are less stable without the normal amount of tau present in their structure [10]. A certain tauopathy often corresponds with NFTs composed primarily of either 4R or 3R tau [13], but while 4R tau is found in higher levels in AD brains, significant levels of 3R tau in NFTs are found as well [10]. Because of the relative abundance of 4R tau in AD brains, many AD animal models incorporate the 4RTau transgene with the human amyloid precursor protein (hAPP) transgene, while the effect of Aβ aggregation on 3R tau regulation has not been studied. A component of our interest in 3R tau comes from evidence of the differential regulation and biochemical properties compared with the 4R isoforms. While 3R tau has been shown to have a lower affinity for microtubules than 4R tau, studies reveal that this has little to do with the additional C-terminal segment in 4R tau, and that both forms contain a microtubule binding-domain, which includes the initial two repeated C-terminal segments and the segment they flank [14]. In addition, both groups of isoforms display differential regulation in their microtubule binding, for example, C-terminal and N-terminal sequences in the 3R tau isoforms have been shown to be relevant for such regulation, while 4R tau microtubule affinity lacks such association [15].
We previously developed and characterized a transgenic model expressing Swedish mutation hAPP under the neuronal mThy-1 promoter cassette that develop early accumulation of Aβ42, plaque formation, neurodegeneration, and behavioral deficits [16]. We also developed a transgenic mouse model expressing the mutant (L266V and G272V) 3RTau transgene also under the neuronal mThy-1 promoter, which displays time-dependent accumulation of 3R tau in the neocortex and hippocampus, with neurodegeneration and behavioral deficits that mimic aspects of Pick’s disease. We crossed our hAPP mouse line with the 3R tau line to develop a bigenic model that develops both amyloid and tau pathology. In this study, we found that the mice carrying the 3RTau transgene displayed significant increases in tau aggregation, neurodegeneration, and behavioral deficits, with the bigenic mice consistently displaying a higher level of pathology and behavioral deficits compared to the single transgenic 3RTau line.
MATERIALS AND METHODS
Generation of mThy-1 3RTau mutant transgenic mice and treatments
All experiments were approved by the University of California San Diego’s animal subjects committee. Mice expressing human 3RTau-bearing the mutations associated with familial PiD (L266V and G272V; Line 13) under the neuronal mThy-1 promoter cassette (provided by Dr. H. van der Putten) were generated as previously described [17]. Line 13 was crossed with mutant hAPP mice (K670N/761NL and V717I; Line 41), also under the mThy-1 promoter cassette, to create a bigenic line. To differentiate the pre-plaque versus fibrillar effects of APP/Aβ, mice were divided into young (3 months) and aged (6 months) groups. For biochemical analysis, non-tg (n = 3), Line 13 tg (n-3), Line 41 tg (n = 3), and bigenic mice (n = 3) 3-4 months of age were generated. A cohort of the same sample sizes of 5-9-month-old mice was also generated. For behavioral analysis, non-tg (n = 6), Line 41 tg (n = 3), Line 13 tg (n = 11), and bigenic mice (n = 11) 3-4 months of age were generated. Behavioral data for the 5-9-month-old mice was collected with non-tg (n = 3), Line 41 (APP) (n = 3), Line 13 (n = 4), and bigenic (n = 5) (data not shown).
Behavioral analysis
Spontaneous locomotor activity (SLMA) was assessed in a Kinder SmartFrame Cage Rack Station activity monitoring system (Kinder Scientific, Poway, CA), using a 3-dimensional 7×15 beam configuration. Gait and balance were investigated using a horizontal round beam test. This test consisted of three consecutive 60-s trials, all during the same day, as previously described [18]. Errors were defined as foot slips over distance traveled, while speed was recorded as distance traveled over time.
Spatial learning and memory were assessed using a water maze consisting of a 180-cm diameter pool filled with opaque water (24°C), as previously described [17]. The mice initially were trained to reach a visible platform for the first three days, and then a hidden platform for the following four days, in three daily trials, spaced 2-3 min apart. The platform location remained constant throughout the test, and mice that were not able to find the hidden platform within 90 s were placed on it for 30 s. Two alternative starting points were randomly used throughout, both the same distance from the platform. During the final day of testing (day 7), the platform was removed during the probe test and the time spent in the correct quadrant was recorded, along with a visual performance control test. The duration of the probe test was 40 s. Latency to escape (time to reach platform) was recorded with a Noldus Instruments EthoVision video tracking system (San Diego Instruments, San Diego, CA) set to record two samples per second.
Nest building is important for the conservation of warmth and offspring survival, and is displayed by both male and female mice. The scoring for nesting is based on a scale of 1–5, with a score of zero meaning the nestlet was not torn at all and a score of five meaning an ideal nest was produced [19]. This score is based on the amount of the nestlet that was used, as well as the quality of the nest. The percentage of nestlet used was based on weight of the provided nestlet that was torn.
Tissue preparation
Mice were sacrificed according to NIH guidelines. All animals were deeply anesthetized with ketamine (100 mg/kg)/xylazine (10 mg/kg) and then decapitated. The right hemi-brain was post-fixed for 48 h in 4% phosphate-buffered paraformaldehyde (pH 7.4) at 4°C and sagittal sectioned Vibratome 2000 (50 μm; Leica, Deerfield, IL). The left hemibrain was snap-frozen and stored at –70°C.
Immunohistochemistry (IHC) and image analysis
The level of tau protein was detected using free-floating, blind-coded vibratome cut (50 μm) serial sagittal sections. The sections were incubated with antibodies against 3R tau (1:250, Millipore), tTau (Tau 5; 1:1000, Millipore), and pTau (PHF-1; 1:500, CP13; 1:1000, MC1; 1:500, gifts from Dr. Peter Davies and AT8; 1:500) overnight at 4°C. The following morning, sections were incubated in biotin-tagged IgG1 secondary antibodies (1:100, Vector Laboratories, Inc., Burlingame, CA), or Avidin D-HRP (1:200, ABC Elite, Vector), and visualized with diaminobenzidine. A digital Olympus bright field digital microscope (BX41) was used to scan the sections.
Glial and neuronal pathology was quantified by incubating the sections overnight at 4°C in antibodies against the astroglial marker, glial fibrillary acidic protein (GFAP, 1:1000, Millipore), and the neuronal marker, NeuN (1:500, Millipore). These sections were then incubated with secondary antibodies, Avidin D-HRP, and visualized with diaminobenzidine. The levels of tau and GFAP were analyzed in layer 5 of the neocortex, the dentate gyrus, and area CA1 with Image J and expressed as optical density. Four images were captured for each section at 400x magnification and converted to gray scale, opened with Image J, thresholded and a dynamic scale set to determine optical density. The images were randomly obtained by automatically moving the stage along the neocortex (layers 2-3) and subregions of the hippocampus, without selection bias. The number of neurons immunoreactive with NeuN were estimated using unbiased stereological methods [20]. Sections of the hemibrain containing the hippocampus, striatum, and neocortex were outlined using an Olympus BX51 microscope running StereoInvestigator 8.21.1 software (Micro-BrightField, Cochester, VT). Grid size for the dentate gyrus was: 300×300 μm, and the counting frame was 50×50 μm. The average coefficient of error for each region was 0.09. Sections were analyzed using a 100×1.4 PlanApo oil-immersion objective. The system was calibrated to a minimum of “0” and a max optical density of “500” by utilizing an unstained slide as background and a black slide for absolute optical density. Then, the immunostained section of interest was analyzed by setting the threshold dynamically with an approximate 10% variance. The optical density in the white matter was considered background and subtracted to obtain the corrected optical density. Corrected optical density was used for sections immunostained with aforementioned antibodies and developed with diaminobenzidine. The optical density levels are displayed with respect to the percent of baseline (non-tg control) levels. A 5 μm high dissector allowed for 2 μm top and bottom guard-zones.
Biochemical analyses
Frozen samples from the posterior half of the from left mouse hemibrains (including neocortex and hippocampus) were homogenized in detergent-containing RIPA lysis buffer with phosphatase and protease inhibitors in RIPA lysis buffer (Thermo Scientific; 25 mM Tris-HCl (pH 7.6), 150 mM NaCl, 1% NP-40, 1% sodium deoxycholate, 0.1% SDS). Homogenates were separated into soluble and insoluble fractions through centrifugation at 100,000 g for 60 min. A BCA assay was used to analyze the samples; protein (20 μg/lane) was loaded into each well of a 4–12% SDS-PAGE gel and run in 5% MES (20X) running buffer at 200V for 50 min. The gels were then blotted onto a nitrocellulose membrane, using Thermo Fisher iBlot 2 western detection stacks. Blots were incubated for detection of specific target proteins using the corresponding antibody listed in Table 1 for two days at 4°C. The membrane was then washed and incubated in horseradish-peroxidase-conjugated secondary antibody of the appropriate species (1:1000, Santa Cruz Biotechnology) for 60 min at room temperature. Bands were then washed and visualized by enhanced chemiluminescence (PerkinElmer, Boston, MA), analyzed with a quantitative Versadoc XL imaging apparatus (BioRad, Hercules, CA), and analyzed with Quantity One Software. β-Actin (1:3000, Sigma Aldrich) was used as a loading control.
List of specific antibodies used for immunohistochemistry and immunoblotting
WB, western blotting; IP, immunoprecipitation; IF, immunofluorescence; ELISA, enzyme-linked immunosorbent assay; IHC, immunohistochemistry; ICC, immunocytochemistry; S.C.B., Santa Cruz Biotechnology; Cell-Sig., Cell Signaling.
Statistical analysis
GraphPad 7.0 was used for all analyses. Factoral ANOVA was used to assess the differences among means with Dunnett’s post-hoc test when comparing transgenic mice to non-tg mice. Repeated-measures two-way ANOVA was used to analyze the immunohistochemical and immunoblotting results when comparing the APP or 3RTau mice with the APP-3RTau line. The null hypothesis was rejected at the 0.05 level.
RESULTS
Behavioral analysis comparing the transgenic line of mice with the non-tg group
Because the mice carrying the 3RTau transgene are visually impaired at the age of 6 months, only the behavioral data for the young mice has been included. Motor impairments were tested with the round beam (Fig. 1a-f) where increased errors were observed in the bigenic line for both genders, as well as the 3RTau females compared with the non-tg controls (Fig. 1e). Spontaneous locomotor activity assessment displayed increased rearing for each transgenic group (Fig. 1g-j).
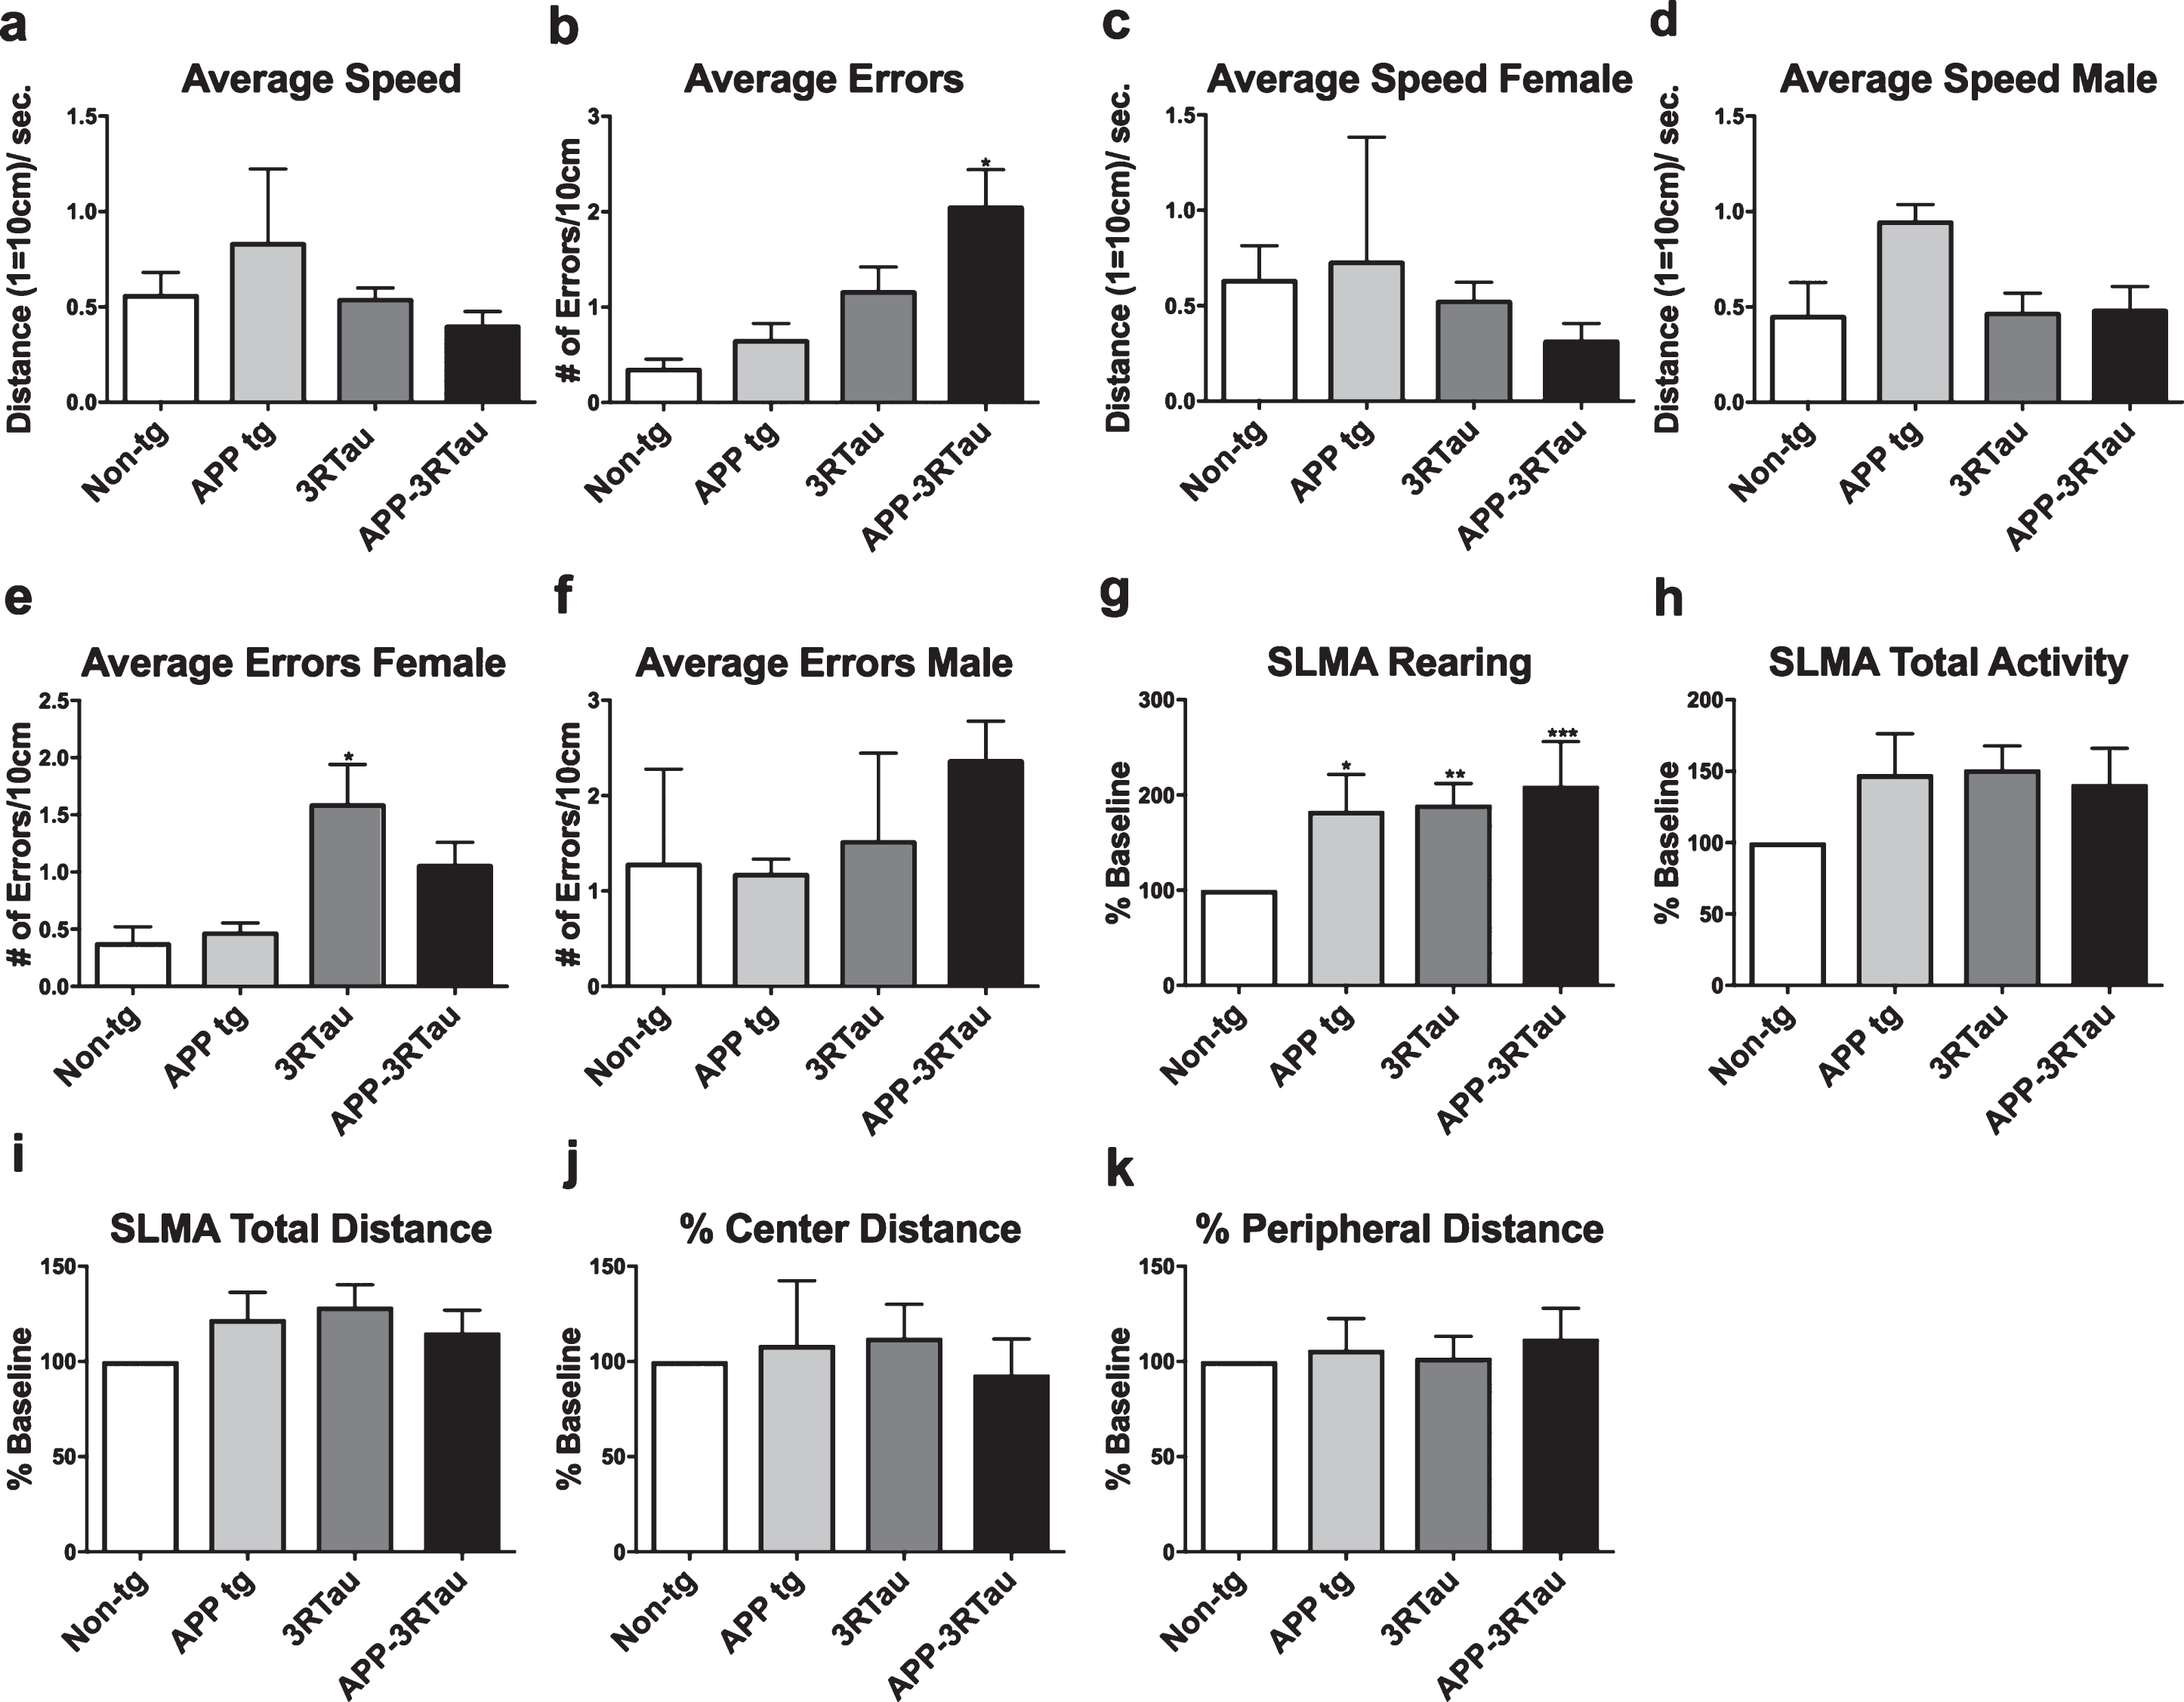
Assessment of activity, gait and balance of the four genotypes of mice. a-f) Mice were tested for gait and balance in a round beam apparatus. Compared to non-tg controls, the bigenic mice for both genders and the 3RTau female mice had more errors when walking in the round beam. g-k) Spontaneous locomotor activity of the mice was assessed in a Kinder SmartFrame Cage Rack Station activity monitoring system. Compared to the non-tg controls, all three lines of tg mice showed increased rearing. All groups traveled similar distances in the center and periphery of the monitoring apparatus. Mice were 3-4 months old: non-tg (n = 6), Line 41 tg (n = 3), Line 13 tg (n = 11), and bigenic (n = 11). When analyzing round beam results, *, **, and *** indicates p < 0.05, 0.01, and 0.001, respectively, when compared to non-tg control using a factorial ANOVA.
Memory performance was tested using the Morris water maze over a period of seven days. The bigenic and the 3RTau mice took more time and traveled farther to reach the platform both when the platform was cued and hidden when compared to the non-tg mice (Fig. 2a, b). The probe test showed less entries in the correct zone (where the platform had been) for the bigenic mice and less time spent in the correct zone for the bigenic and 3RTau mice, as well as a fewer number of passes through the correct zone for the bigenic mice (Fig. 2c-e).
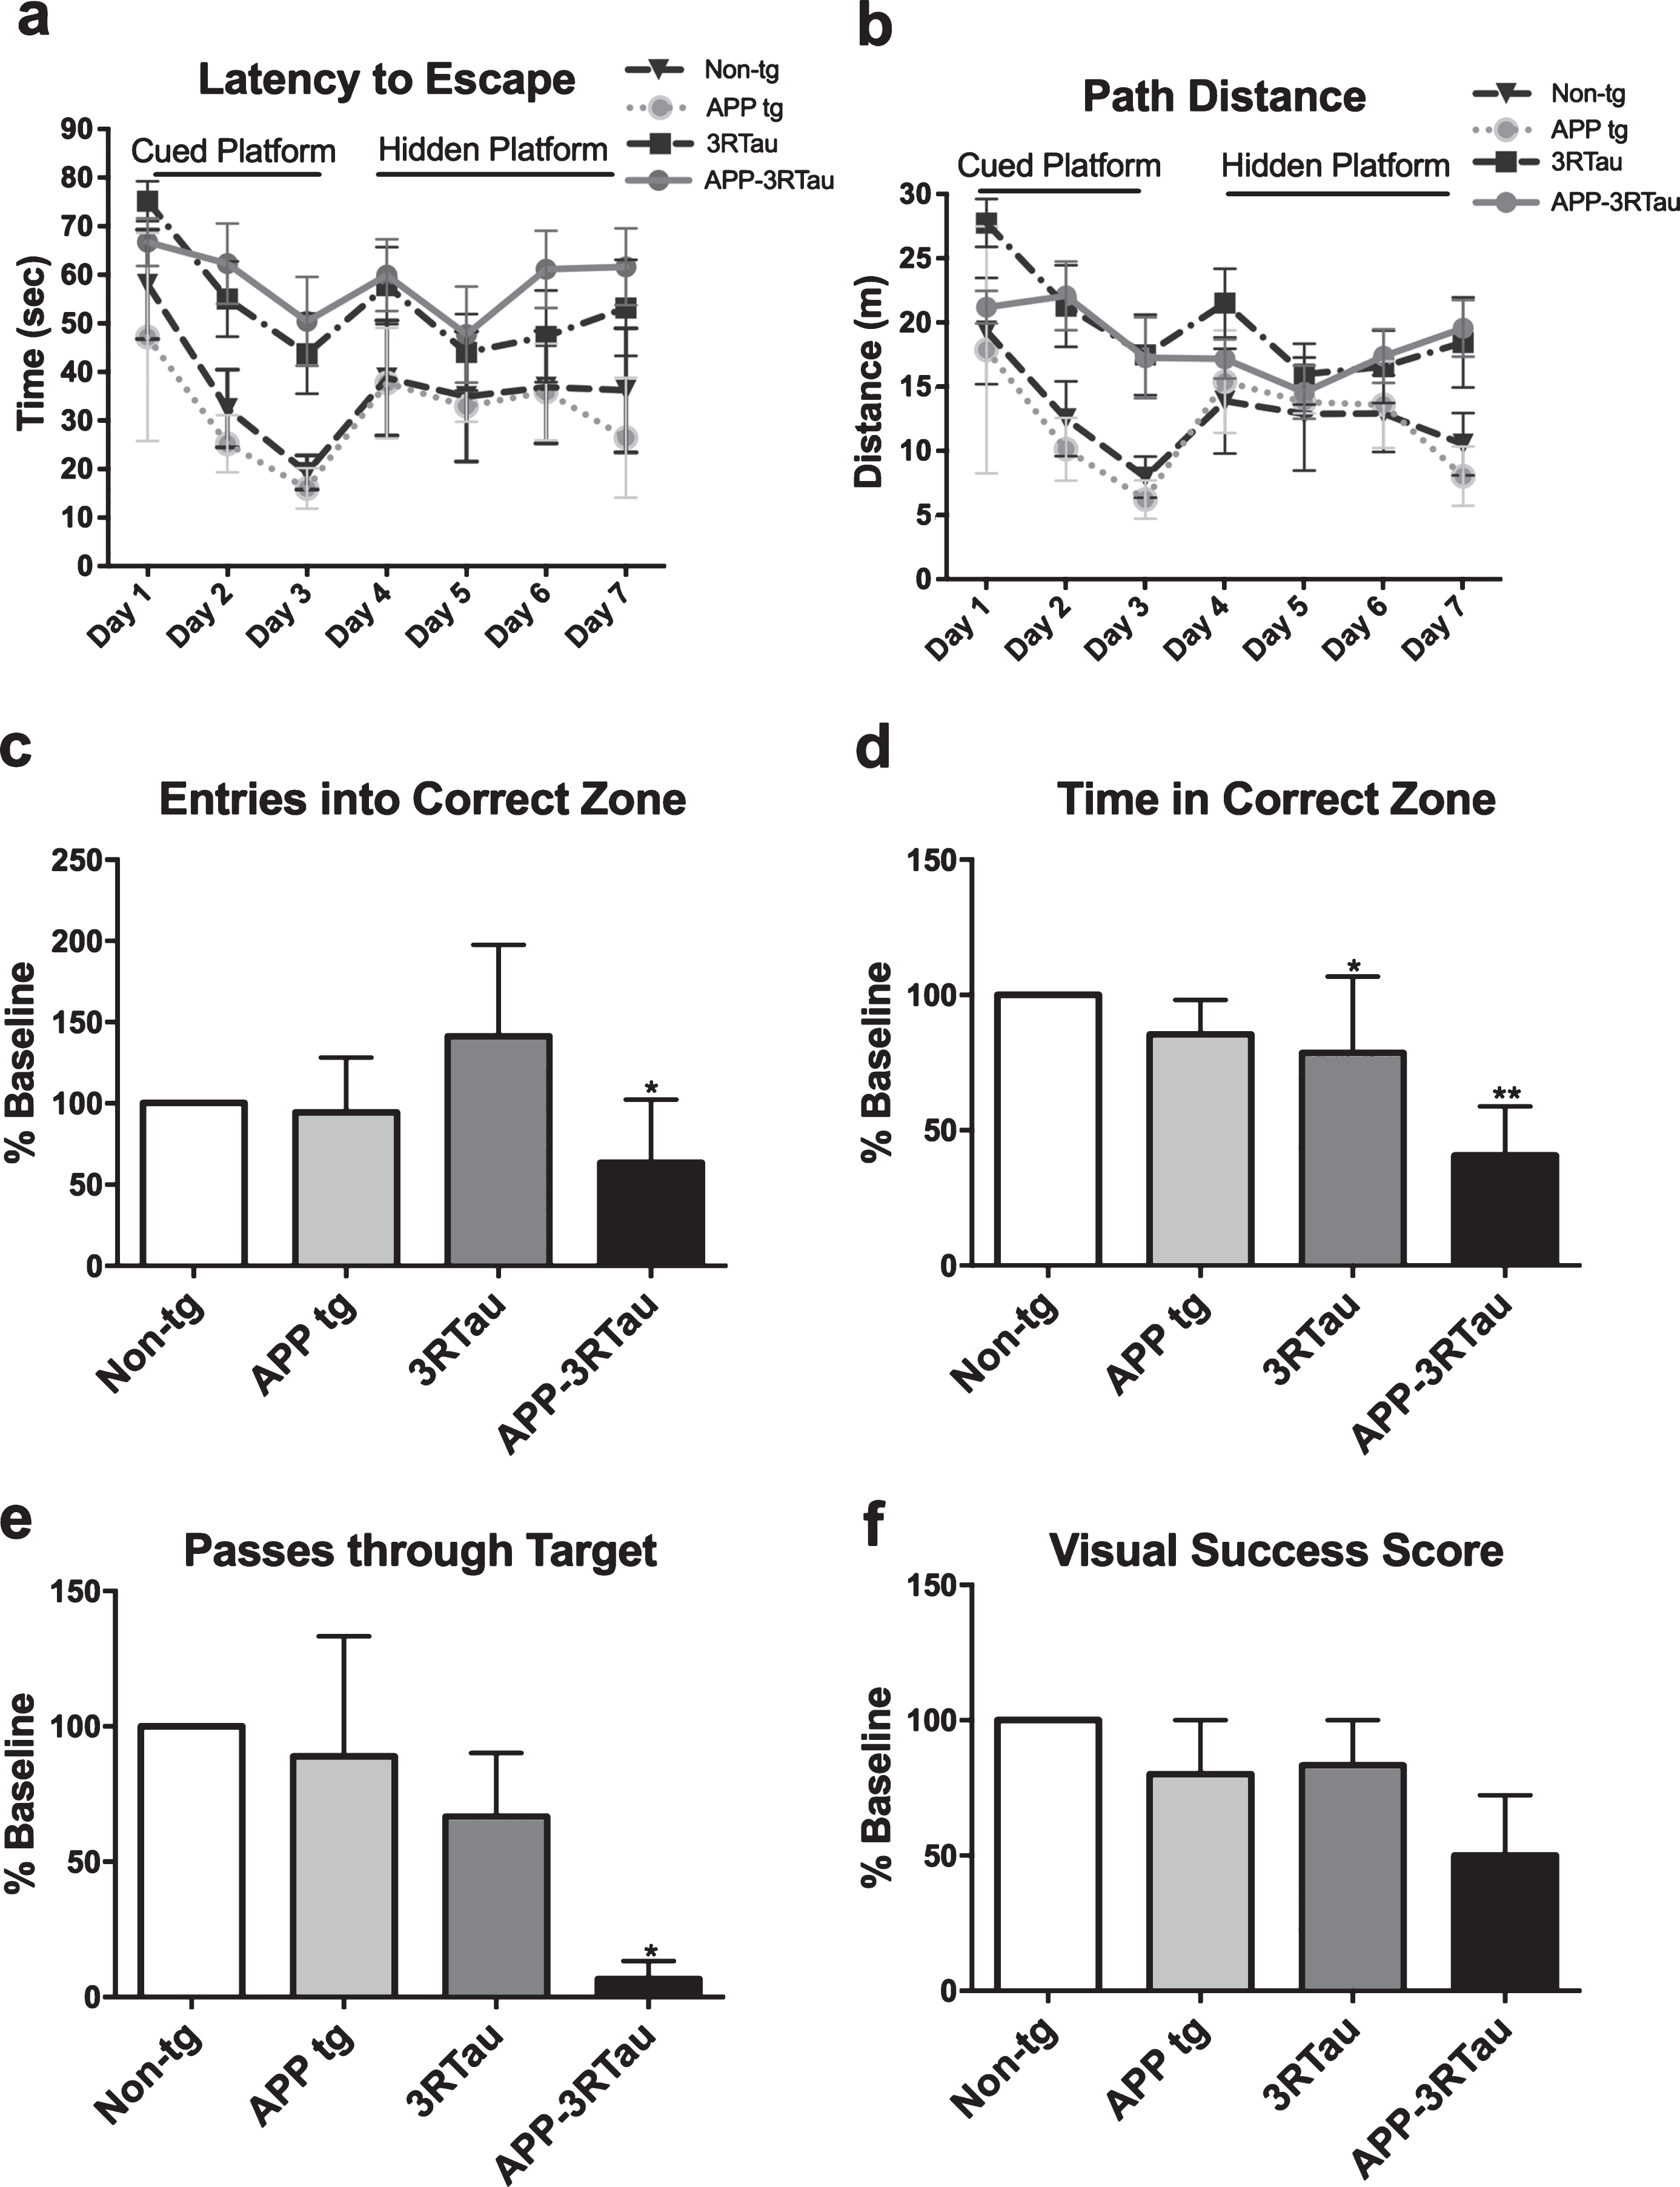
Spatial memory and learning for each line of transgenic mice compared with the non-tg mice. a, b) Results of water maze test showing time until reaching platform as well as distance traveled, respectively. During the cued portion of the test the 3RTau and bigenic mice took longer and traveled a greater distance to reach the platform. This trend remains, at a lesser extent, during the hidden portion of the test. The performance of the APP and non-tg mice remained similar for both parameters throughout the seven days. c-e) The platform was removed from the maze for the probe portion of the test, at day 7. The number of times the mice enter the quadrant where the platform was, as well as time spent in that zone and the number of times passing through that zone was recorded, respectively. f) Probe test with a visible platform showed slight, though not significant, visual alterations in the bigenic mice as well as the 3RTau mice. Mice were 3-4 months old: non-tg (n = 6), Line 41 tg (n = 3), Line 13 tg (n = 11), and bigenic (n = 11). When analyzing water maze results, * and ** indicates p < 0.05 and 0.01, respectively, when compared to non-tg control using factorial or repeated measures two-way ANOVA.
Nesting behavior was recorded using a 1-5 scale for scoring, as well as weighing the percentage of the nestlet that was torn. Bigenic and 3RTau mice showed significantly lower nesting scores and percent nestlet used compared with the non-tg mice, with the exception of the 3RTau males that did not show significant differences (Fig. 3a-d).
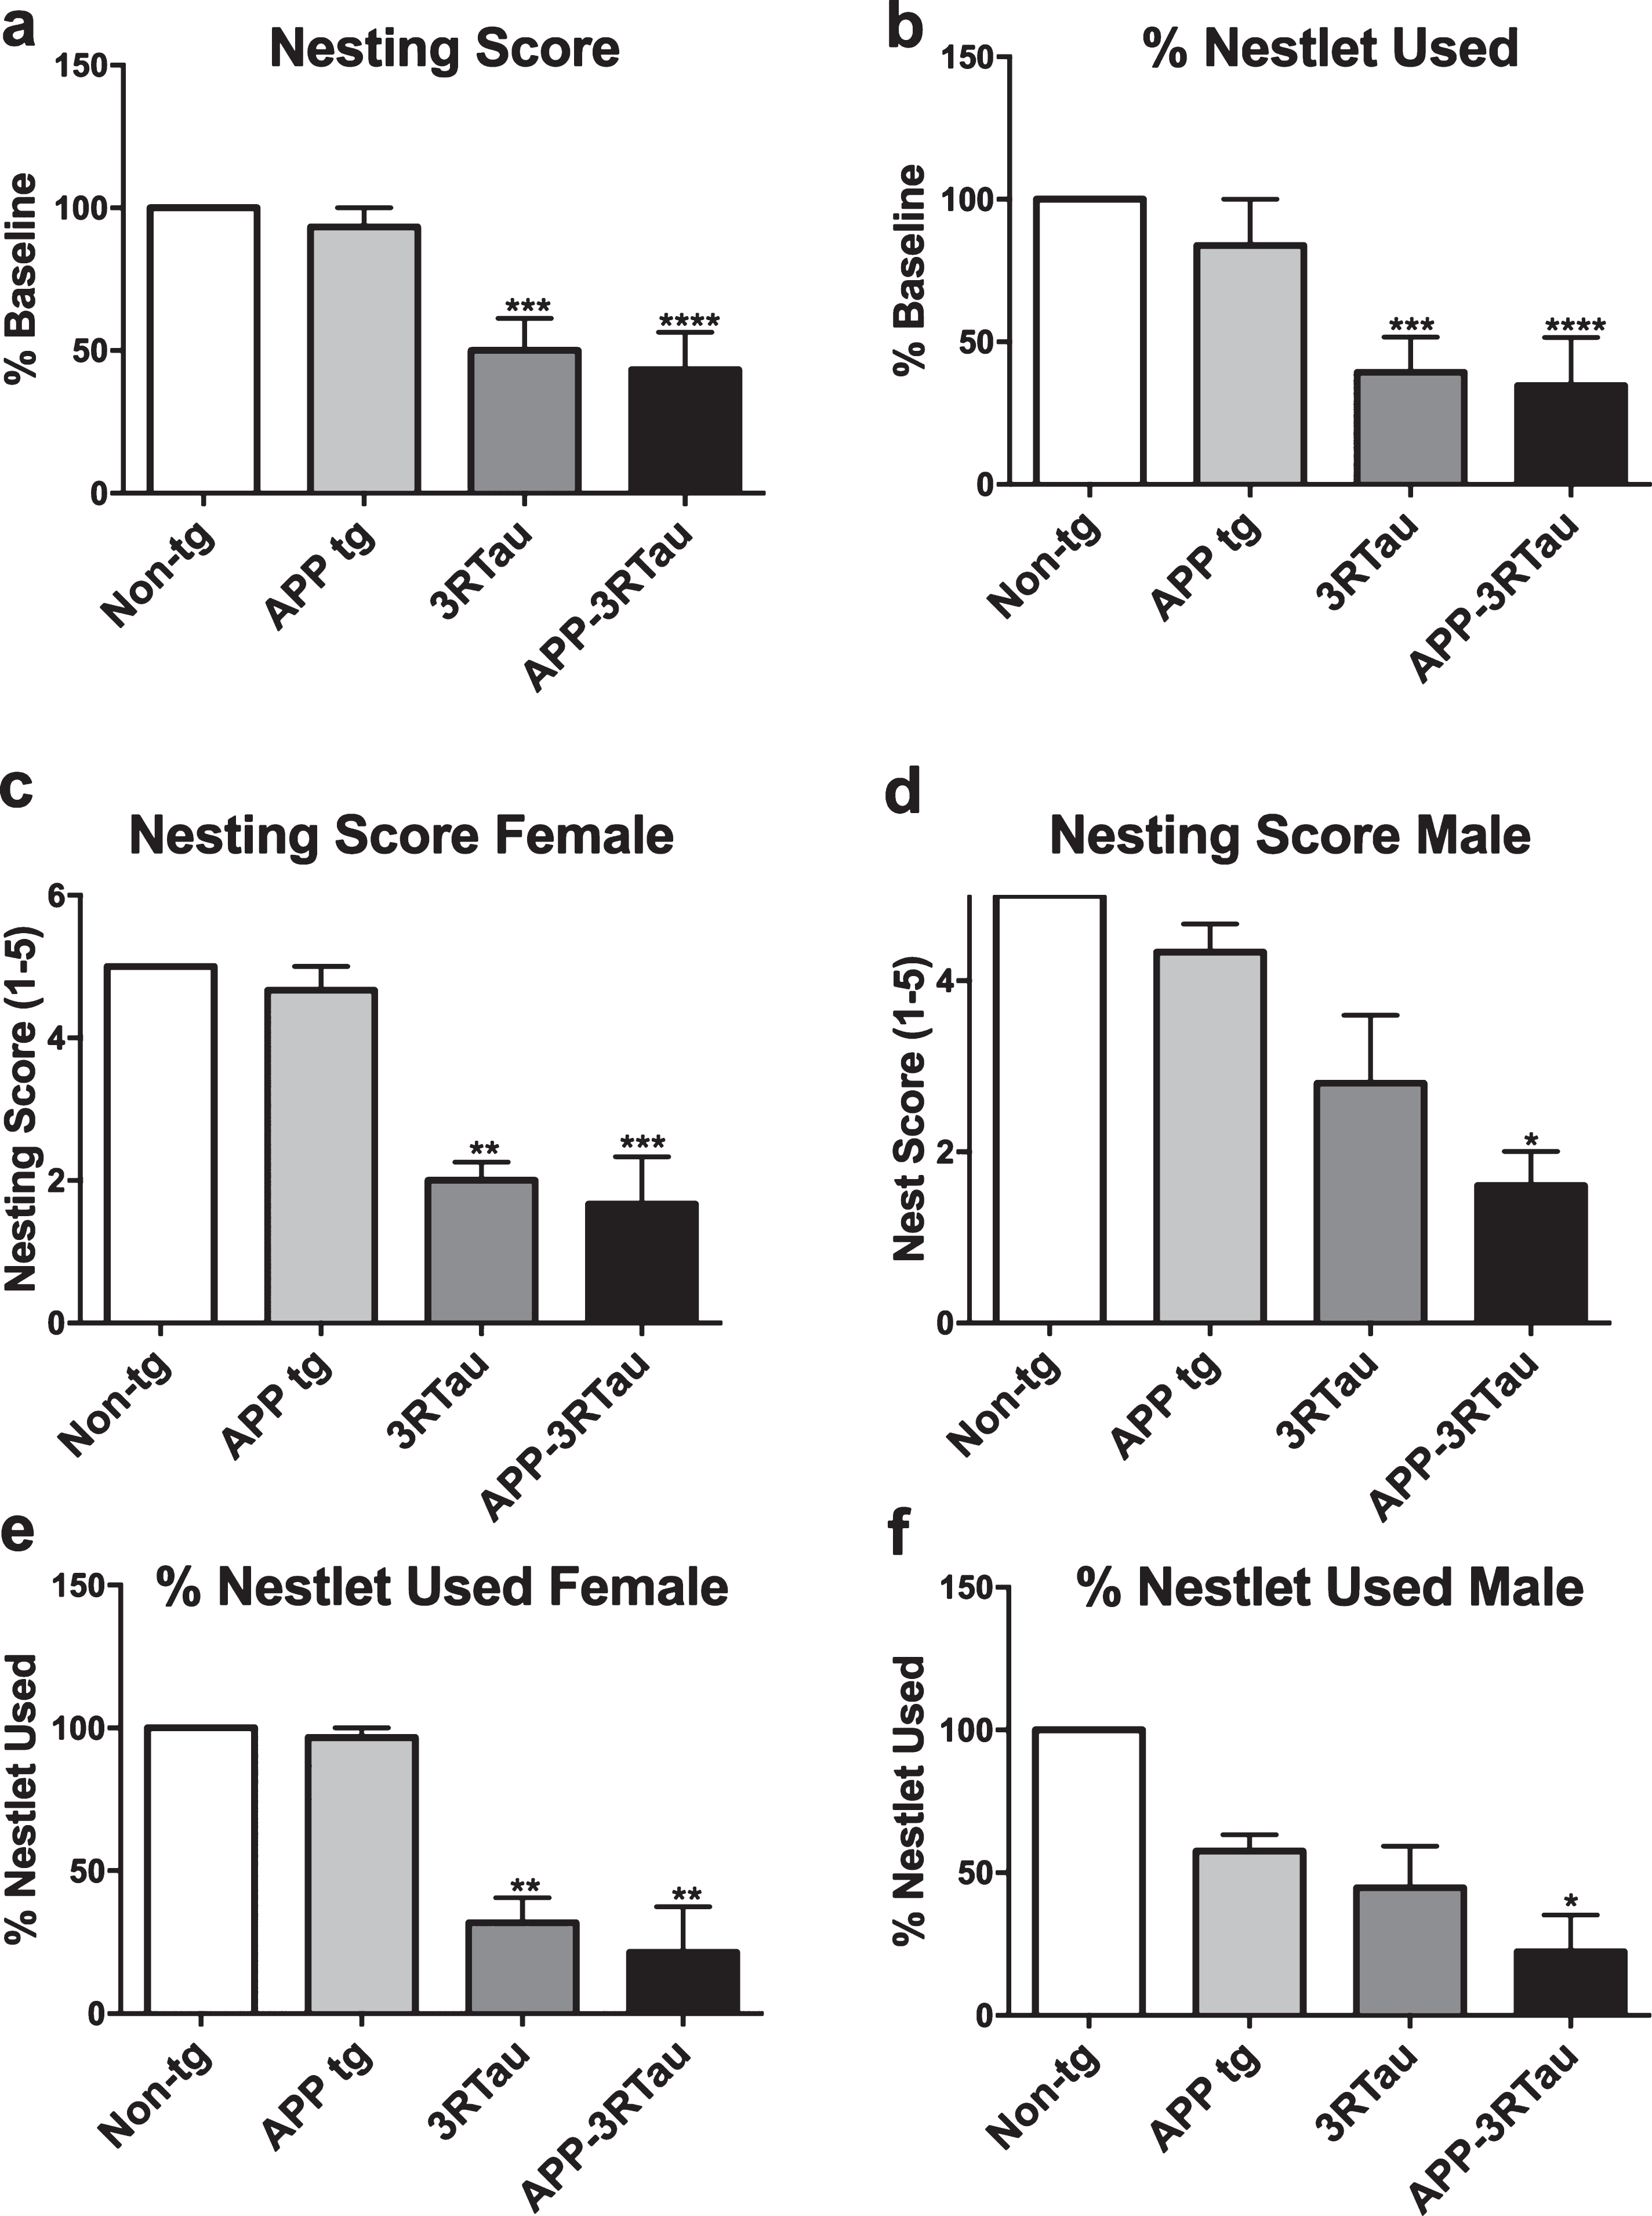
Nesting behavior of the three tg mouse lines compared with the non-tg control. a-d) The nesting score is based on a 1-5 scale, five meaning nearly all of the provided nestlet is used and in good form (large area, high walls). The percent of nestlet used displays how much of the total nestlet weight was torn. Both genders of the bigenic and 3RTau mice displayed lower nesting scores and used less nestlet compared to the non-tg control. Mice were 3-4 months old: non-tg (n = 6), Line 41 tg (n = 3), Line 13 tg (n = 11), and bigenic (n = 6). When analyzing nesting results, *, **, ***, and **** indicates p < 0.05, 0.01, 0.001, and 0.0001, respectively, when compared to non-tg control using factorial ANOVA.
Overexpression of APP/Aβ in 3RTau transgenic mice results in increased tau accumulation and phosphorylation in IHC sections
To analyze time-dependent pathology in mice carrying mutant hAPP, mutant 3RTau, or both with non-tg mice, we compared results from both aged cohorts. The young APP and non-tg mice showed lower levels of 3R tau immunoreactivity compared with the 3RTau and APP-3RTau mice in both the neocortex, dentate gyrus, and CA1 region of the hippocampus (Fig. 4a-d), with 3R tau aggregates mostly in pyramidal neurons and in the granular cells in the dentate gyrus (Fig. 4a). Similar levels of 3R tau were detected in the CA1 region for both young mice lines carrying 3RTau (Fig. 4a, d), however there were higher levels of the tau isoform found in the APP-3RTau mice in the neocortex (Fig. 4a, b) and dentate gyrus (Fig. 4a, c).
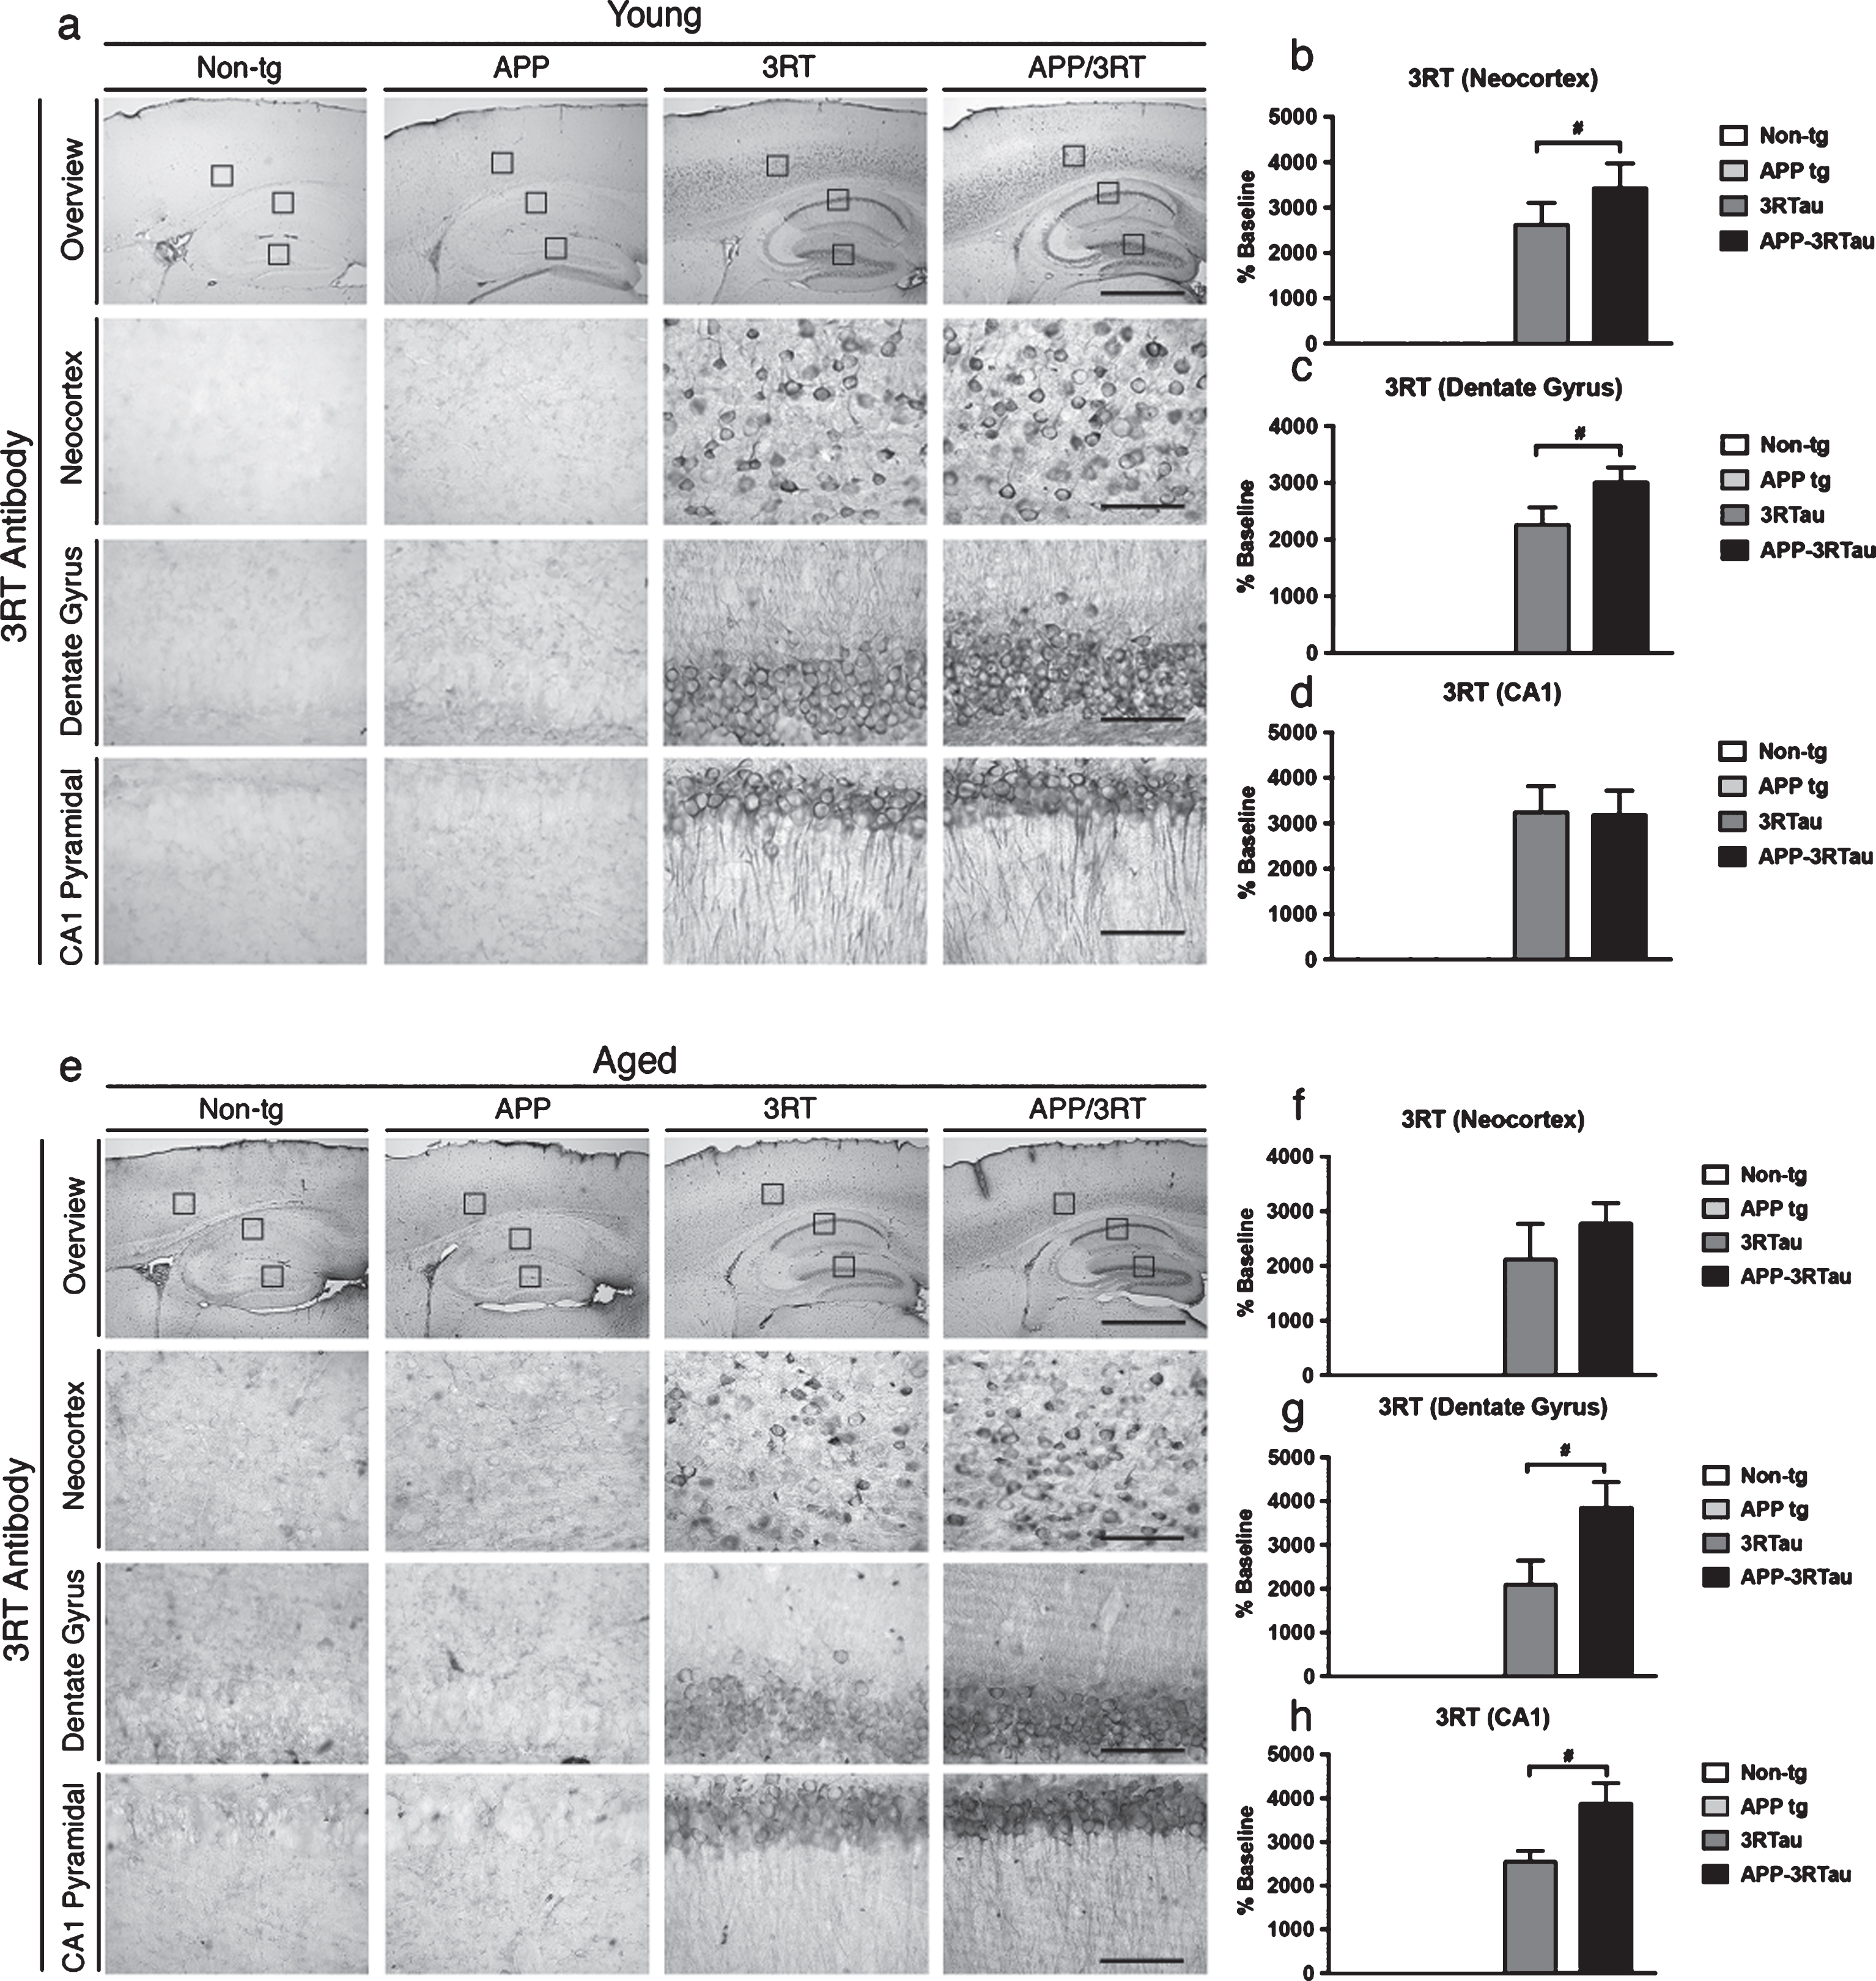
Pattern of 3R tau distribution in the brains of the three lines of mice compared with the non-tg control. a) Immunostaining with an antibody against 3R tau was used on vibratome sections of the 3-4month-old (Young) mice, followed by analysis by digital bright field microscopy. Panels on the top row are low-magnification (5x magnification) photomicrographs of the neocortex and hippocampus. The lower three rows of panels are higher magnification (40x magnification) of the corresponding regions. b) Image analysis of number of neuronal cells in the neocortex, (c) dentate gyrus, and (d) CA1 hippocampus region displaying 3R tau aggregates. e) Immunostaining with an antibody against 3R tau was used on vibratome sections of the 5-9-month-old (Aged) mice, followed by analysis by digital bright field microscopy. Panels on the top row are low-magnification (5x magnification) photomicrographs of the neocortex and hippocampus. The lower three rows of panels are higher magnification (40x magnification) of the corresponding regions. f) Image analysis of number of neuronal cells in the neocortex, (g) dentate gyrus, and (h) CA1 hippocampus region displaying 3R tau aggregates. When analyzing immunohistochemical results, **** indicates p < 0.0001 when compared to non-tg control using one-way ANOVA with post hoc Dunnett’s; while # # and # # # # indicates p < 0.01 and 0.0001, respectively, when comparing APP or 3RTau mice with the APP-3RTau line using factorial ANOVA. Low magnification panel scale bar = 100 μm; high power panel scale bar = 10 μm.
Similarly, in the aged group, higher levels of 3R tau immunoreactivity was found in the APP-3RTau mice than the single tg 3RTau mice in the dentate gyrus (Fig. 4e, g) and CA1 region of the hippocampus (Fig. 4e, h), with an insignificant trend found in the neocortex (Fig. 4e, f). Of course, both of these lines showed higher levels of 3R tau than the APP and non-tg mice in all regions observed (Fig. 4e-h).
Total tau levels for the aged mice were observed through immunoreactivity with Tau 5. Significant increased levels of tau were found in both lines mice carrying the 3RTau transgene in the neocortex and CA1 region, when compared to the non-tg control (Supplementary Figure 2d-f). The APP mice displayed decreased levels of tau compared to the APP-3RTau mice (Supplementary Figure 2d-f).
Next, to assess any effects carrying both genes may have on tau phosphorylation we performed IHC analysis using an anti-PHF-1 antibody. PHF-1 levels for the aged mice were normalized using total tau data for the same areas (Supplementary Figure 2; total tau levels for dentate gyrus not shown). For the young mice compared to non-tg controls, all three transgenic lines displayed significant increases in immunoreactivity in the neocortex (Fig. 5a, b). The 3RTau and APP-3RTau mice also showed significant increases compared to the non-tg mice in hippocampal areas (Fig. 5c, d), with aggregates mainly localized to pyramidal neurons in the neocortex and hippocampus (Fig. 5a). The levels of phosphorylated tau were found in increased amounts in the young APP-3RTau mice when compared to the 3RTau and APP mice in the neocortex (Fig. 5a, b), dentate gyrus (Fig. 5a, c), and region CA1 of the hippocampus (Fig. 5a, d).
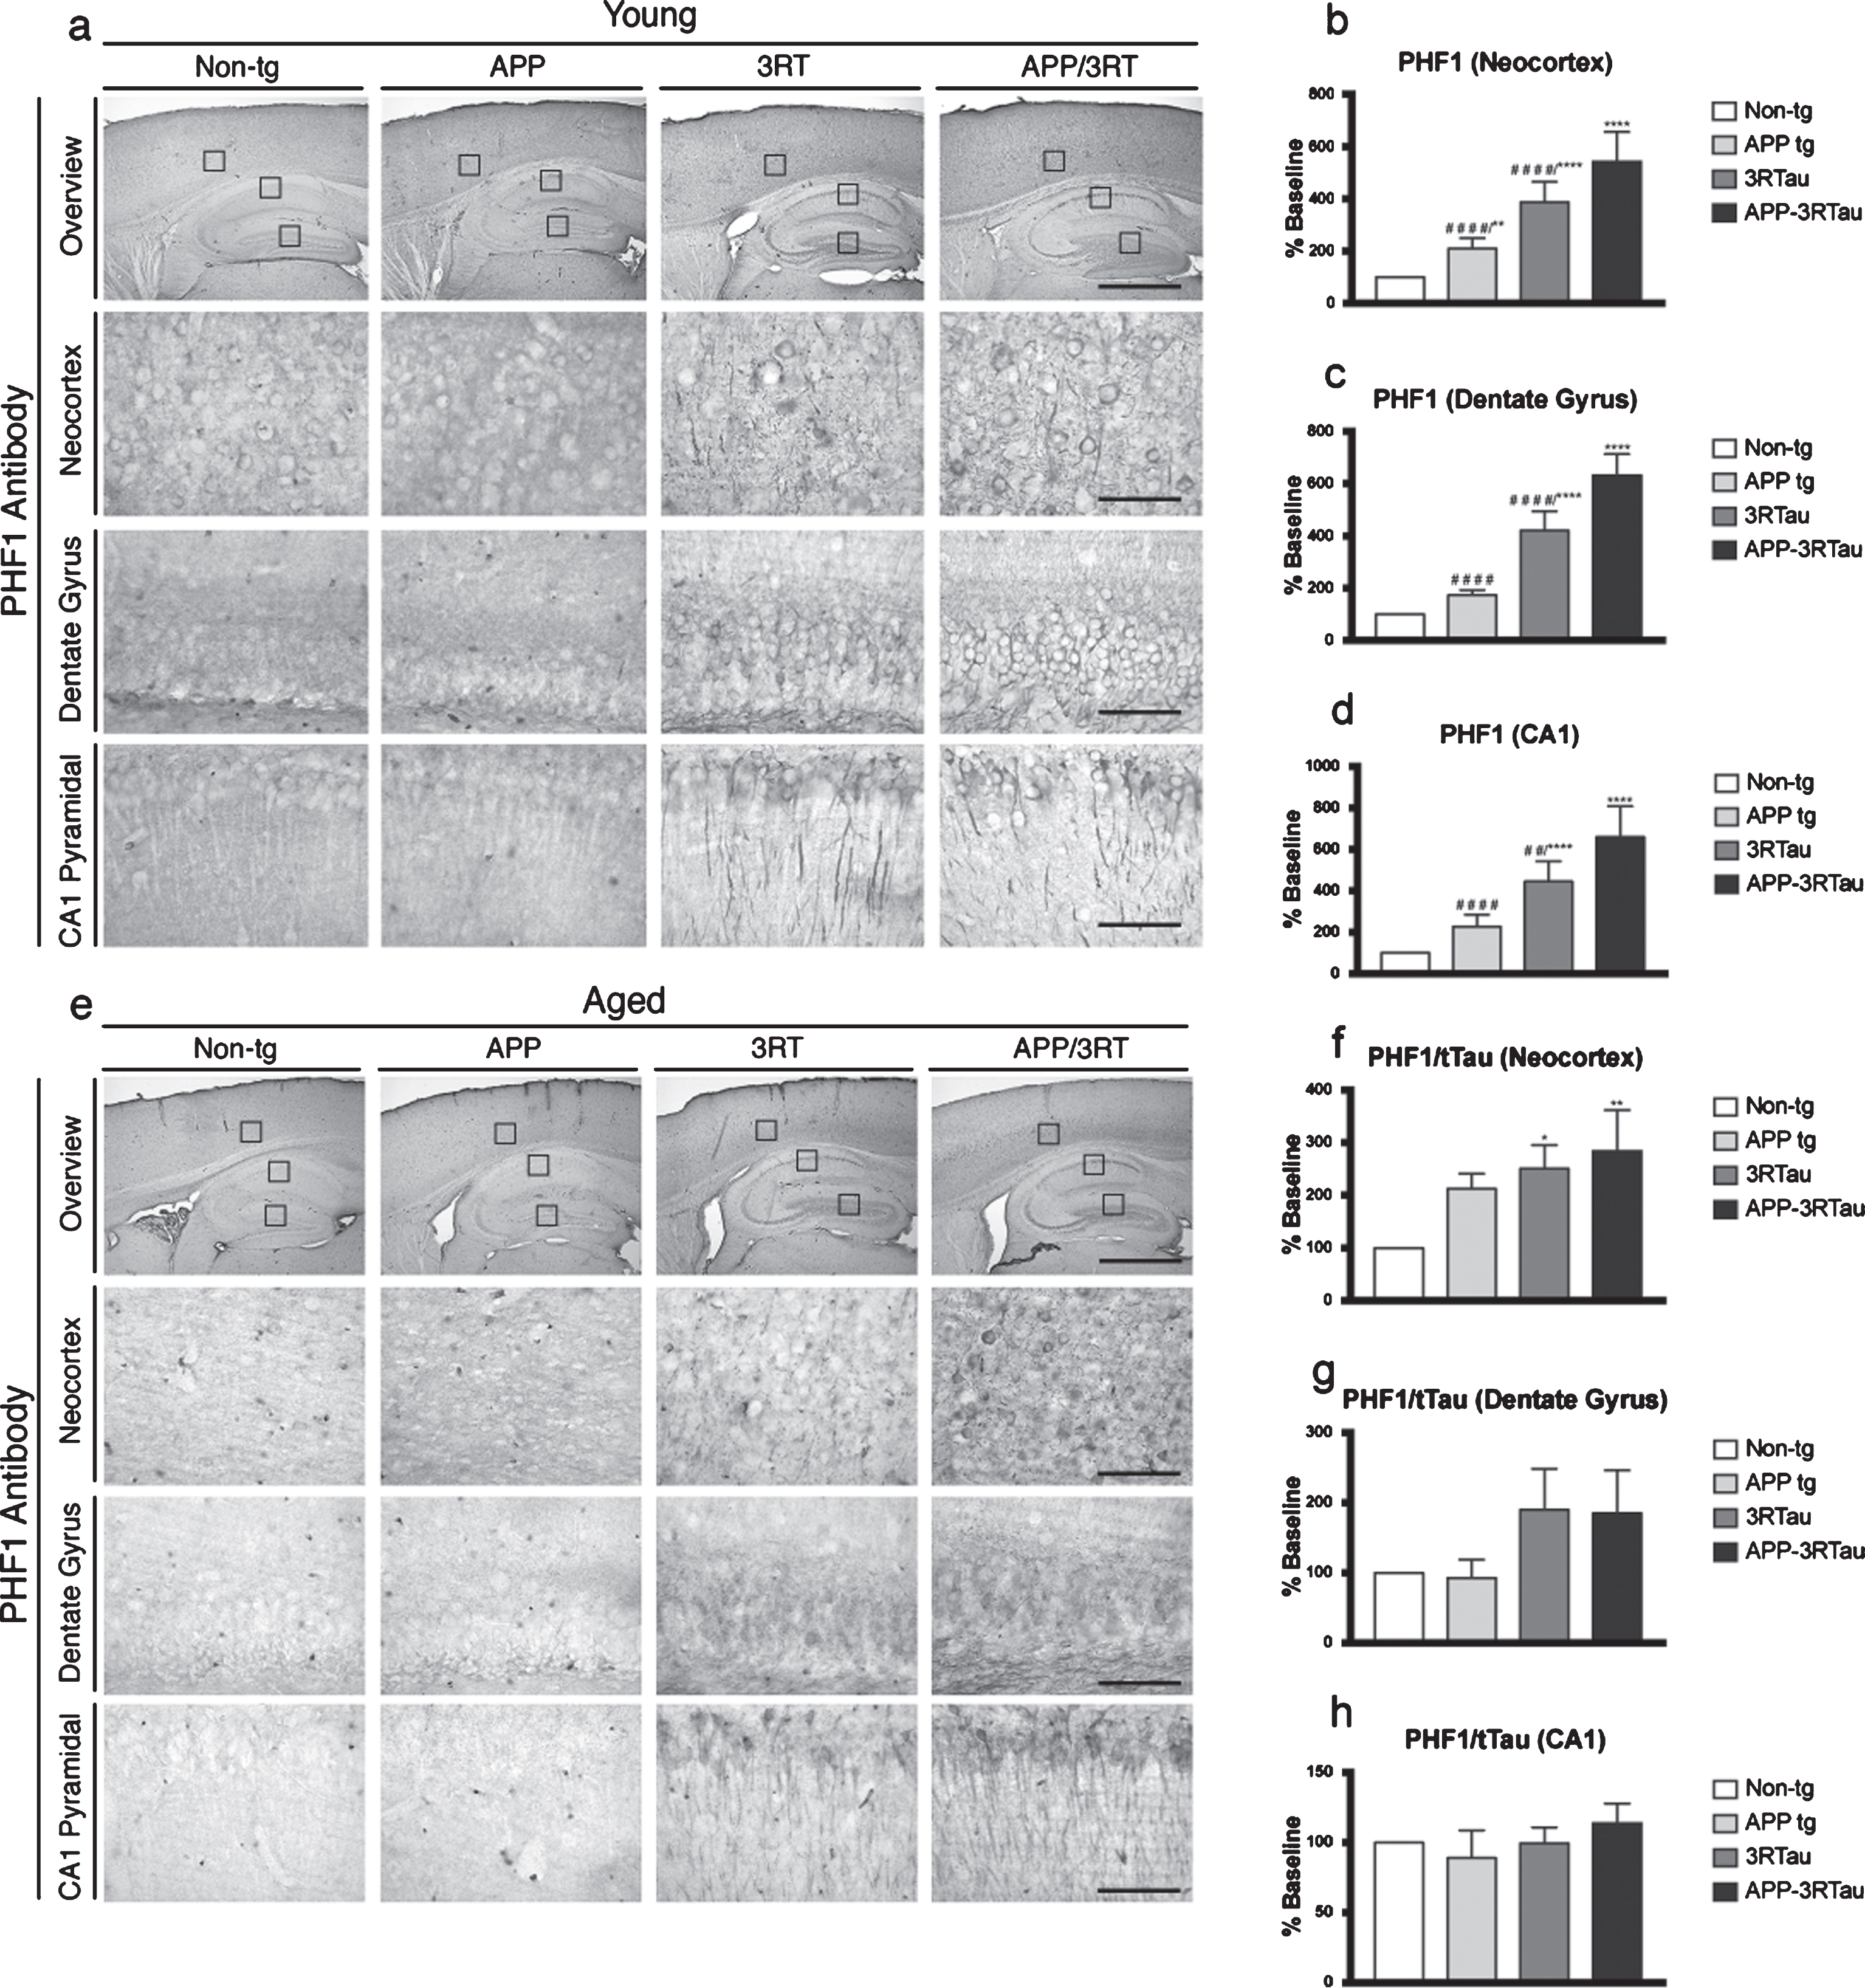
Pattern of pTau distribution in the brains of the three lines of mice compared with the non-tg control. a) Immunostaining with PHF-1 antibody was used on vibratome sections of the 3-4-month-old (Young) mice against pTau (Ser396 and Ser404), followed by analysis by digital bright field microscopy. Panels on the top row are low-magnification (5x magnification) photomicrographs of the neocortex and hippocampus. The lower three rows of panels are higher magnification (40x magnification) of the corresponding regions. b) Image analysis of number of neuronal cells in the neocortex, (c) dentate gyrus, and (d) CA1 hippocampus region displaying pTau aggregates. e) Immunostaining with a PHF-1 antibody was used on vibratome sections of the 5-9-month-old (Aged) mice against pTau (Ser396 and Ser404), followed by analysis by digital bright field microscopy. Panels on the top row are low-magnification (5x magnification) photomicrographs of the neocortex and hippocampus. The lower three rows of panels are higher magnification (40x magnification) of the corresponding regions. f) Image analysis of number of neuronal cells in the neocortex, (g) dentate gyrus, and (h) CA1 hippocampus region displaying pTau aggregates. When analyzing immunohistochemical results, *, **, and **** indicates p < 0.05, 0.01, and 0.0001, respectively, when compared to non-tg control using one-way ANOVA with post hoc Dunnett’s; while # # and # # # # indicates p < 0.01 and 0.0001, respectively, when comparing APP or 3RTau mice with the APP-3RTau line using factorial ANOVA. Low magnification panel scale bar = 100 μm; high power panel scale bar = 10 μm.
In contrast, the aged mice did not have as much deviation in normalized PHF-1 levels. The 3RTau and APP-3RTau mice only displayed significantly higher levels in the neocortex when compared to the non-tg mice (Fig. 5e, f). The 3RTau values did not vary significantly from the APP-3RTau values in any area observed (Fig. 5f, g).
To further elucidate changes in the phosphorylation of tau, IHC analysis was used with the AT8 and CP13 antibodies. Immunoreactivity to AT8 displayed increased levels in the neocortex for the three transgenic lines, while increases were observed in region CA1 for the APP-3RTau and 3RTau mice, compared to the non-tg levels (Supplementary Figure 1a-c). The levels for the APP mice levels in both regions, as well as the 3RTau mice levels in the neocortex, displayed significantly lower immunoreactivity when compared to the APP-3RTau mice (Supplementary Figure 1a-c). Similarly, IHC data using CP13 revealed increased levels in the neocortex for the three transgenic lines, while increases were observed in region CA1 for the APP-3RTau and 3RTau mice, compared to the non-tg levels (Supplementary Figure 1d-f). The APP and 3RTau mice displayed lower levels of CP13 reactivity in both areas observed when compared to the APP-3RTau mice (Supplementary Figure 1d-f).
Finally, to observe changes in the magnitude of accumulation of a pathological conformation of tau, immunoreactivity for MC1 was tested. Higher levels were observed in both regions for all three lines of transgenic mice, when compared to non-tg controls, with the most significance observed in the two lines carrying the 3RTau tg (Supplementary Figure 2a-c). The APP mice showed lower levels in both areas, while the 3RTau mice displayed decreased levels in the neocortex, when compared to the APP-3RTau mice (Supplementary Figure 2a-c).
While several data sets for both age ranges of mice did not display significant differences between the two lines of mice carrying the 3RTau tg, it is worth noting that the majority of the results acquired for tau immunoreactivity did reveal significantly increased levels in the APP-3RTau line compared to the 3RTau line.
Immunoblot analysis of levels of 3R tau and pTau in double transgenic APP-3RTau mice
Antibodies specific for 3R tau revealed that only the two lines mice carrying the 3RTau transgene had detectable levels of the protein, in both the soluble and insoluble fractions of both ages (Fig. 6a, b, f, g, and Fig. 7a, b, f, g). The 3R Tau levels were found to be significantly higher in the 3RTau mice when compared with the APP-3RTau mice in the young insoluble fraction (Fig. 7a, b). As in the IHC data, the phosphorylated tau levels detected through immunoblot analysis were normalized by using total tau levels, although for both ages in this set of data. The PHF-1 antibody revealed significantly higher levels of phosphorylated tau in both fractions of the APP-3RTau aged mice, compared with the non-tg controls and the APP mice (Fig. 6f, h). The aged APP mice displayed lower levels of pTau in both fractions when compared to the bigenic mice (Fig. 6f, h).
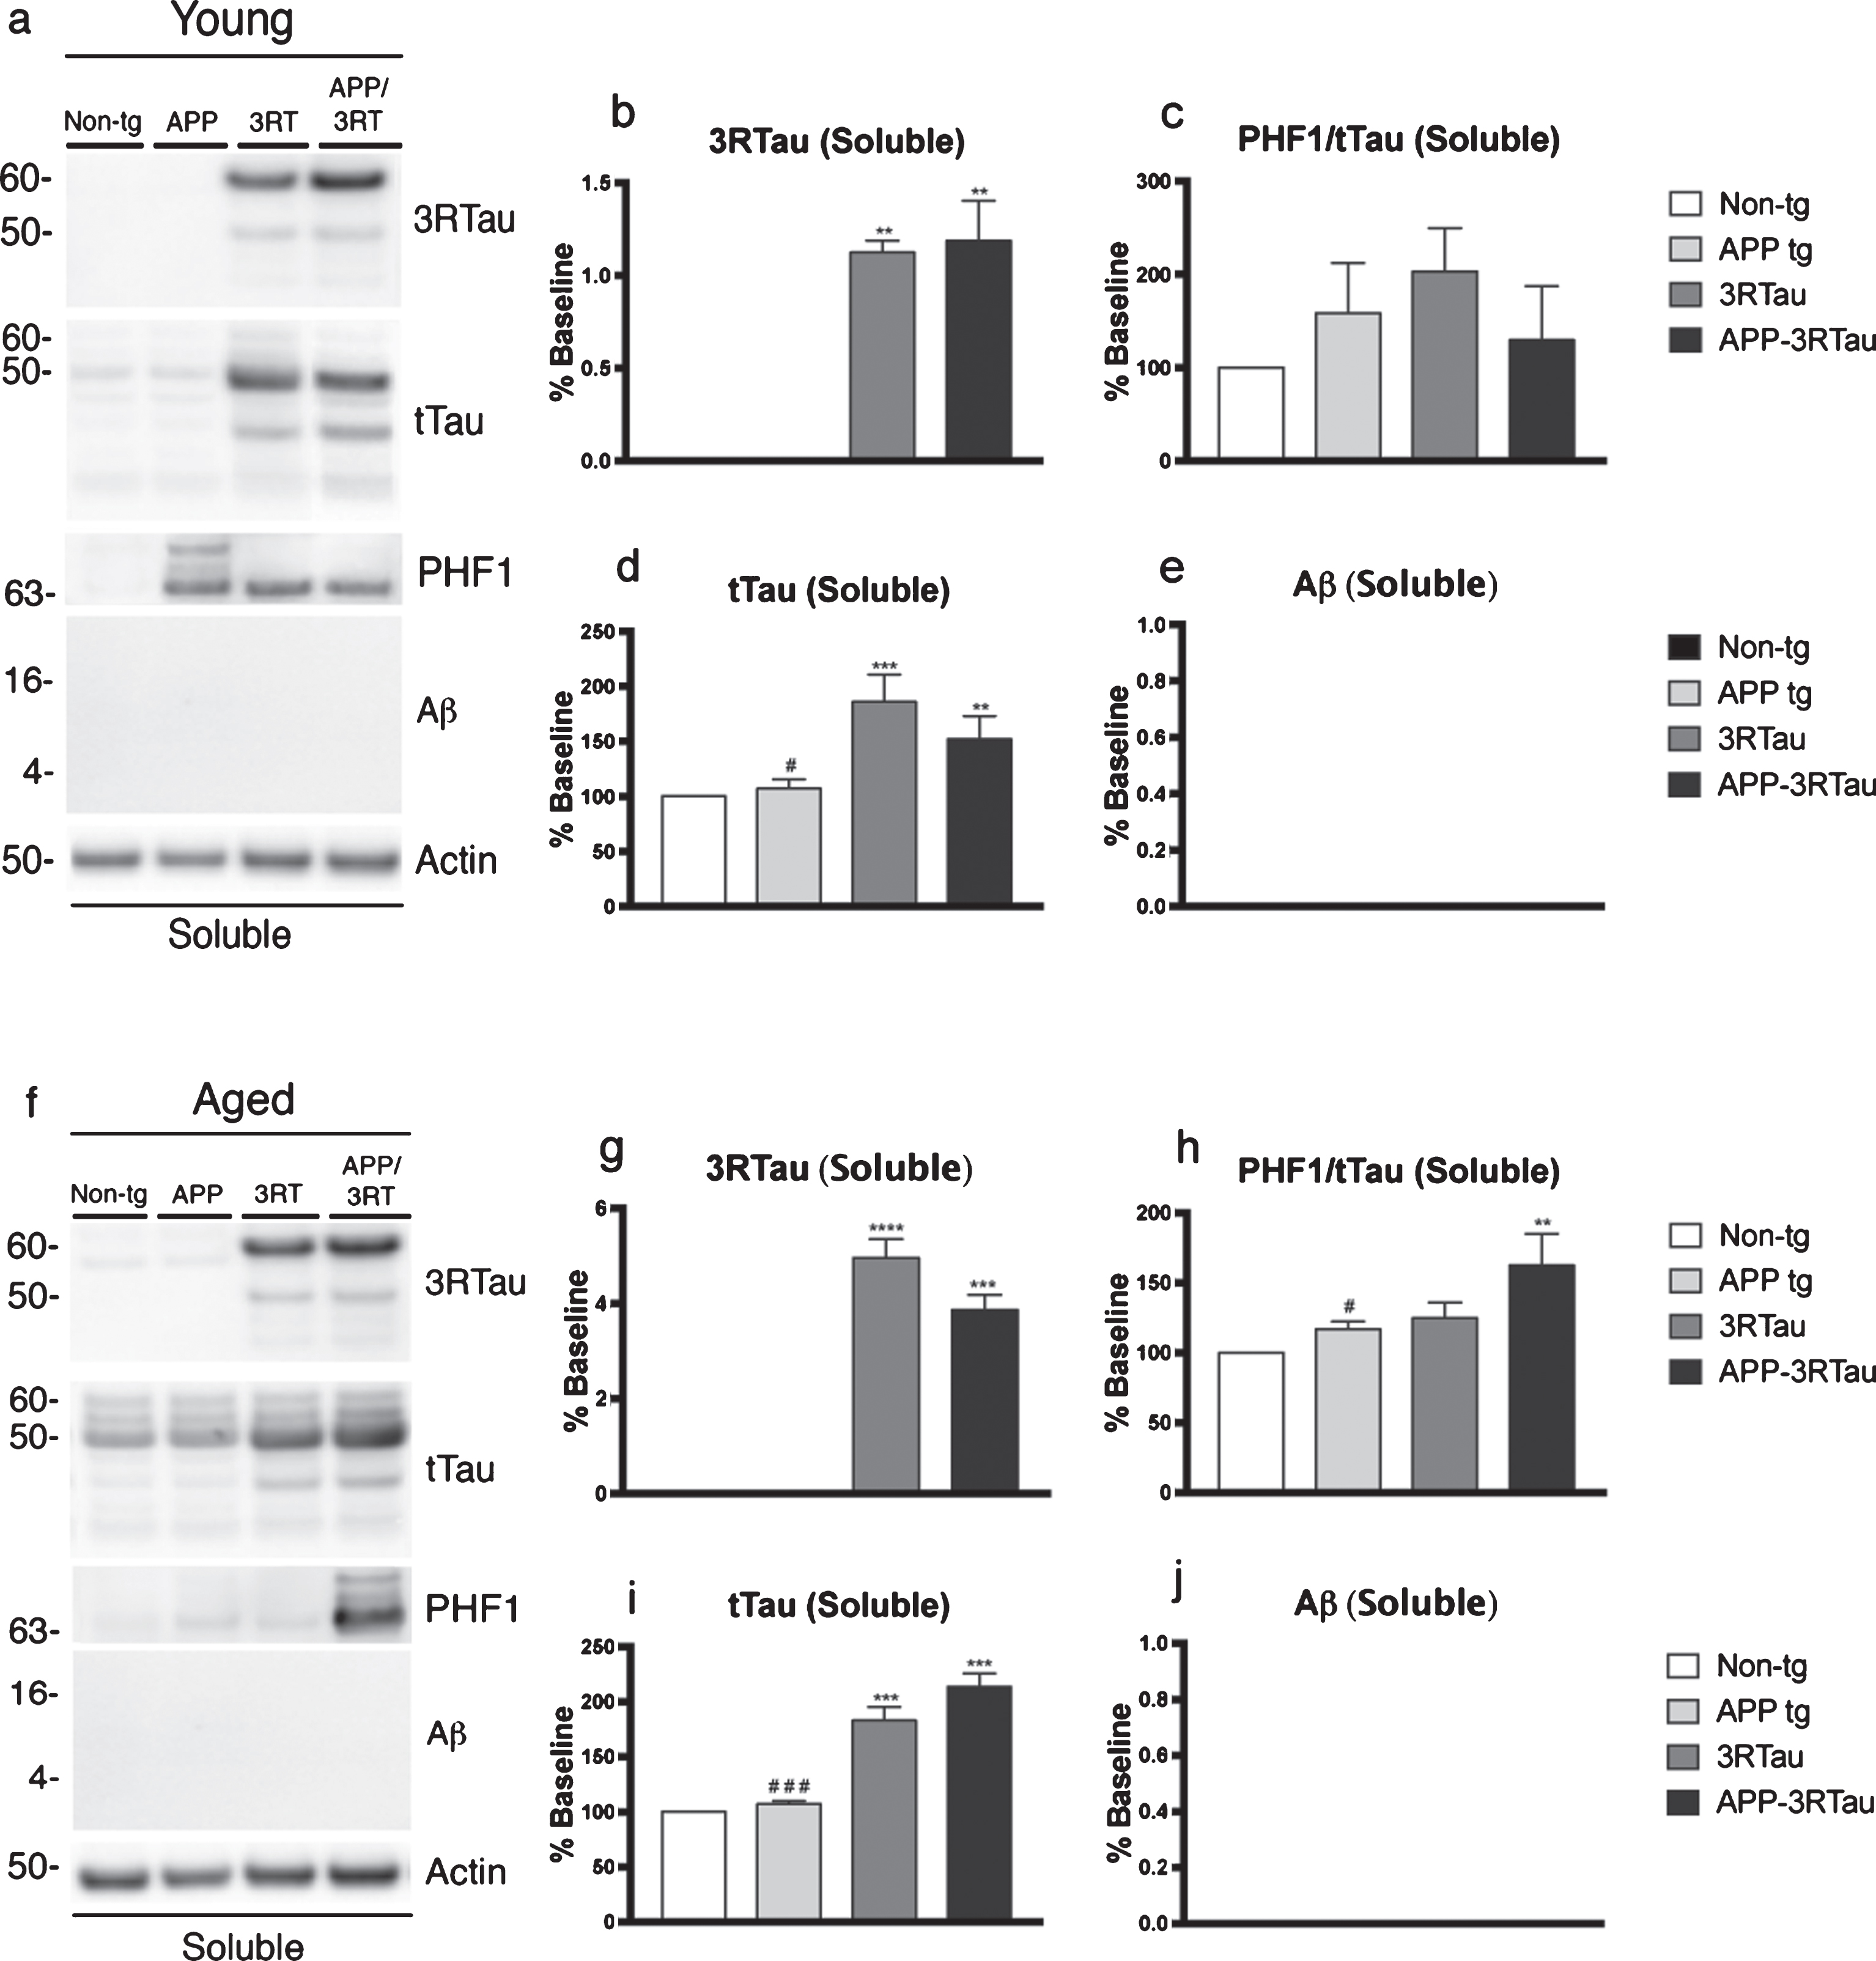
Western blot analyses of the hemibrain of the APP-3RTau, APP, 3RTau, and non-tg mice. a) Representative western blot (SDS) and analyses of levels of (b) 3R tau, (c) PHF1, (d) tTau, and (e) Aβ from the soluble fraction of the 3-4-month-old (Young) mice. f) Representative western blot (SDS) and analyses of levels of (g) 3R tau, (h) PHF1, (i) tTau, and (j) Aβ from the soluble fraction of the 5-9-month-old (Aged) mice. n = 3 for each age group. When analyzing immunoblotting results, **, ***, and **** indicates p < 0.01, 0.001, and 0.0001, respectively, when compared to non-tg control using factorial ANOVA; while # and # # # indicates p < 0.05 and 0.001, respectively, when comparing APP or 3RTau mice with the APP-3RTau line using repeated-measures two-way ANOVA.
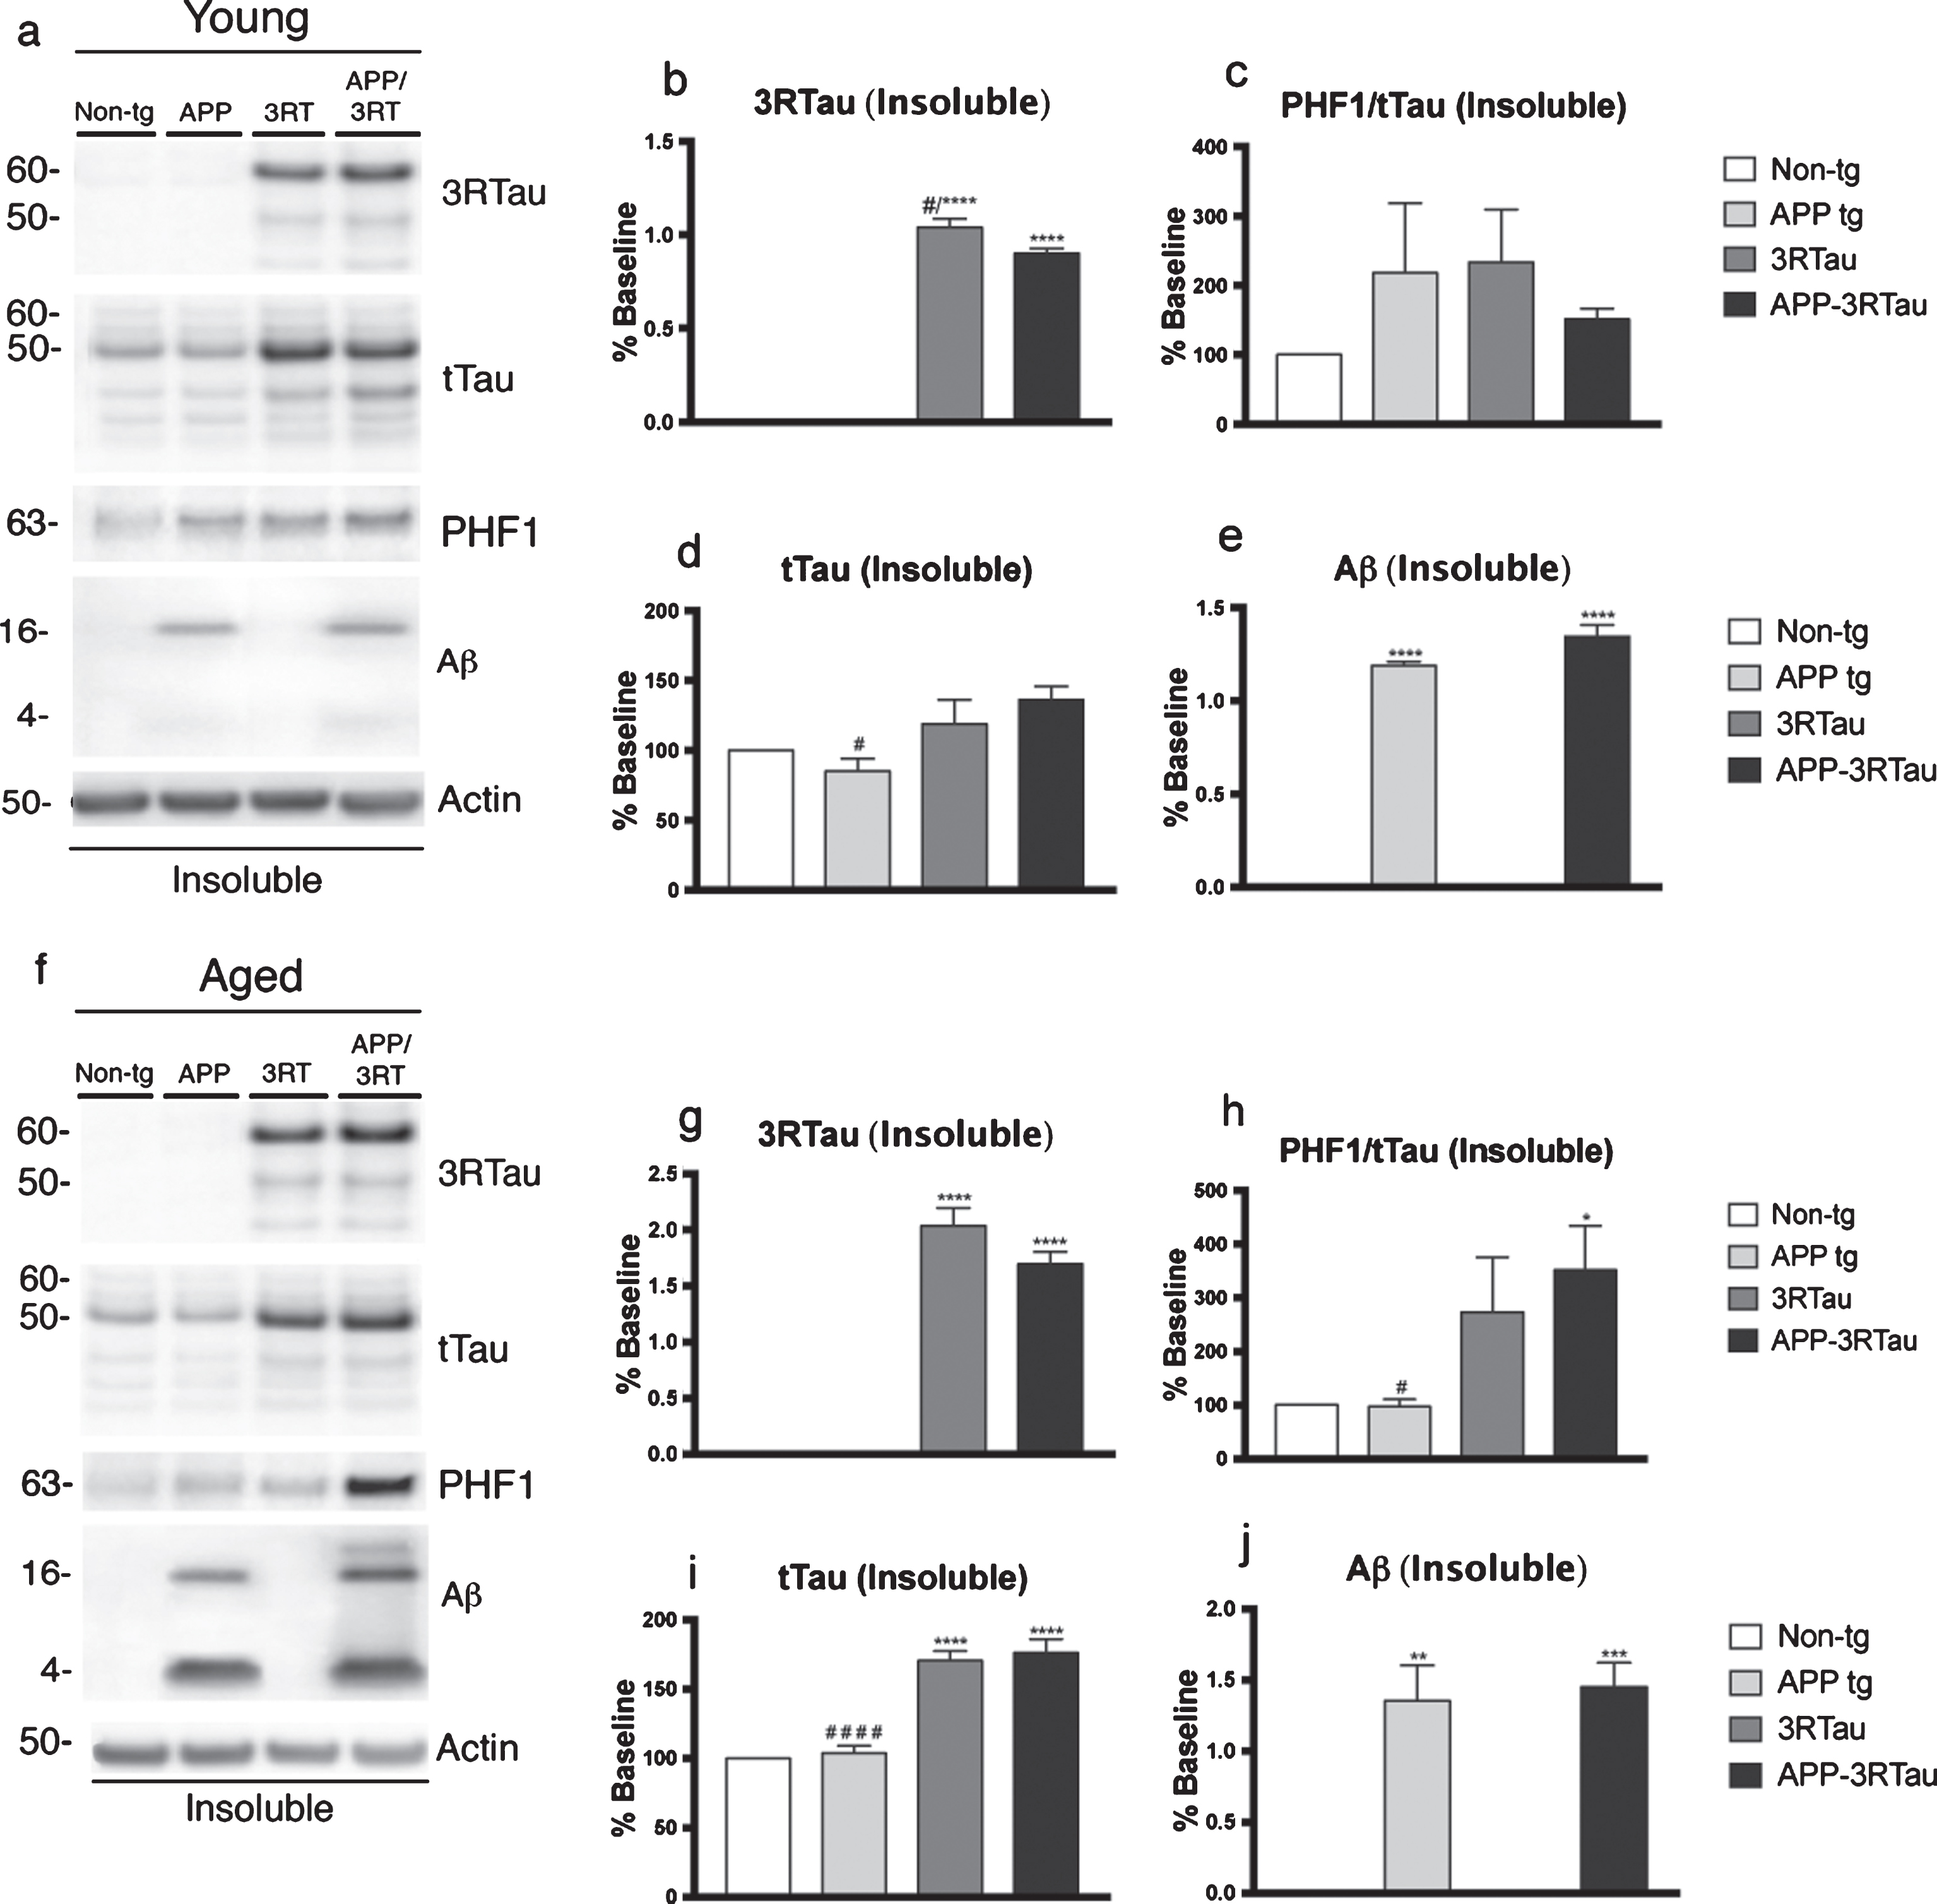
Western blot analyses of the hemibrain of the APP-3RTau, APP, 3RTau, and non-tg mice. a) Representative western blot (SDS) and analyses of levels of (b) 3R tau, (c) PHF1, (d) tTau, and (e) Aβ from the insoluble fraction of the 3-4-month-old (Young) mice. f) Representative western blot (SDS) and analyses of levels of (g) 3R tau, (h) PHF1, (i) tTau, and (j) Aβ from the insoluble fraction of the 5-9-month-old (Aged) mice. n = 3 for each age group. When analyzing immunoblotting results, *, **, ***, and **** indicates p < 0.05, 0.01, 0.001, and 0.0001, respectively, when compared to non-tg control using factorial ANOVA; while # and # # # # indicates p < 0.05 and 0.0001, respectively, when comparing APP or 3RTau mice with the APP-3RTau line using repeated-measures two-way ANOVA.
The two lines of mice of both ages carrying the 3RTau transgene displayed higher levels of total tau, compared to the non-tg mice, when an antibody used to detect each isoform of tau was used (Fig. 6a, d, f, i and Fig. 7a, f, i). The only exception to this was the young insoluble fraction, where no significant changes in total tau levels were found between the transgenic mice and the non-tg controls (Fig. 7a, d). The APP mice of each age and fraction showed significantly lower levels of total tau when compared to the APP-3RTau levels (Fig. 6a, d, f, i and Fig. 7a, d, f, i). An antibody specific for Aβ detected both tetramer and monomer levels in the only the insoluble fraction of both ages for the APP and APP-3RTau mice, with no change between the 3RTau and APP-3RTau levels (Fig. 7a, e, f, j).
Immunoblot analysis of levels of kinases involved in tau phosphorylation in double transgenic APP-3RTau mice
To further analyze the pathogenesis in pathways for tau and amyloid toxicity, we targeted two of the most prominent tau kinases; GSK3 and CDK5, along with their activated states, and some of their relevant activating proteins. Significant increases in the levels of total GSK3 were found in both fractions of the young 3RTau mice (Fig. 8a, b, and Fig. 9a, b). For APP-3RTau mice; higher levels of total GSK3 were found in the soluble fraction of the aged mice and the insoluble fraction of the young mice (Fig. 8f, g and Fig. 9a, b). The soluble fraction for the aged APP mice was significantly higher than non-tg levels, while the insoluble fraction of young APP mice displayed lower levels compared to APP-3RTau mice (Fig. 8f, g, and Fig. 9a, b). As for GSK3 in its activated form, p-Y216, the soluble fraction of the young 3RTau mice displayed higher amounts when compared to APP-3RTau and non-tg levels (Fig. 8a, d).
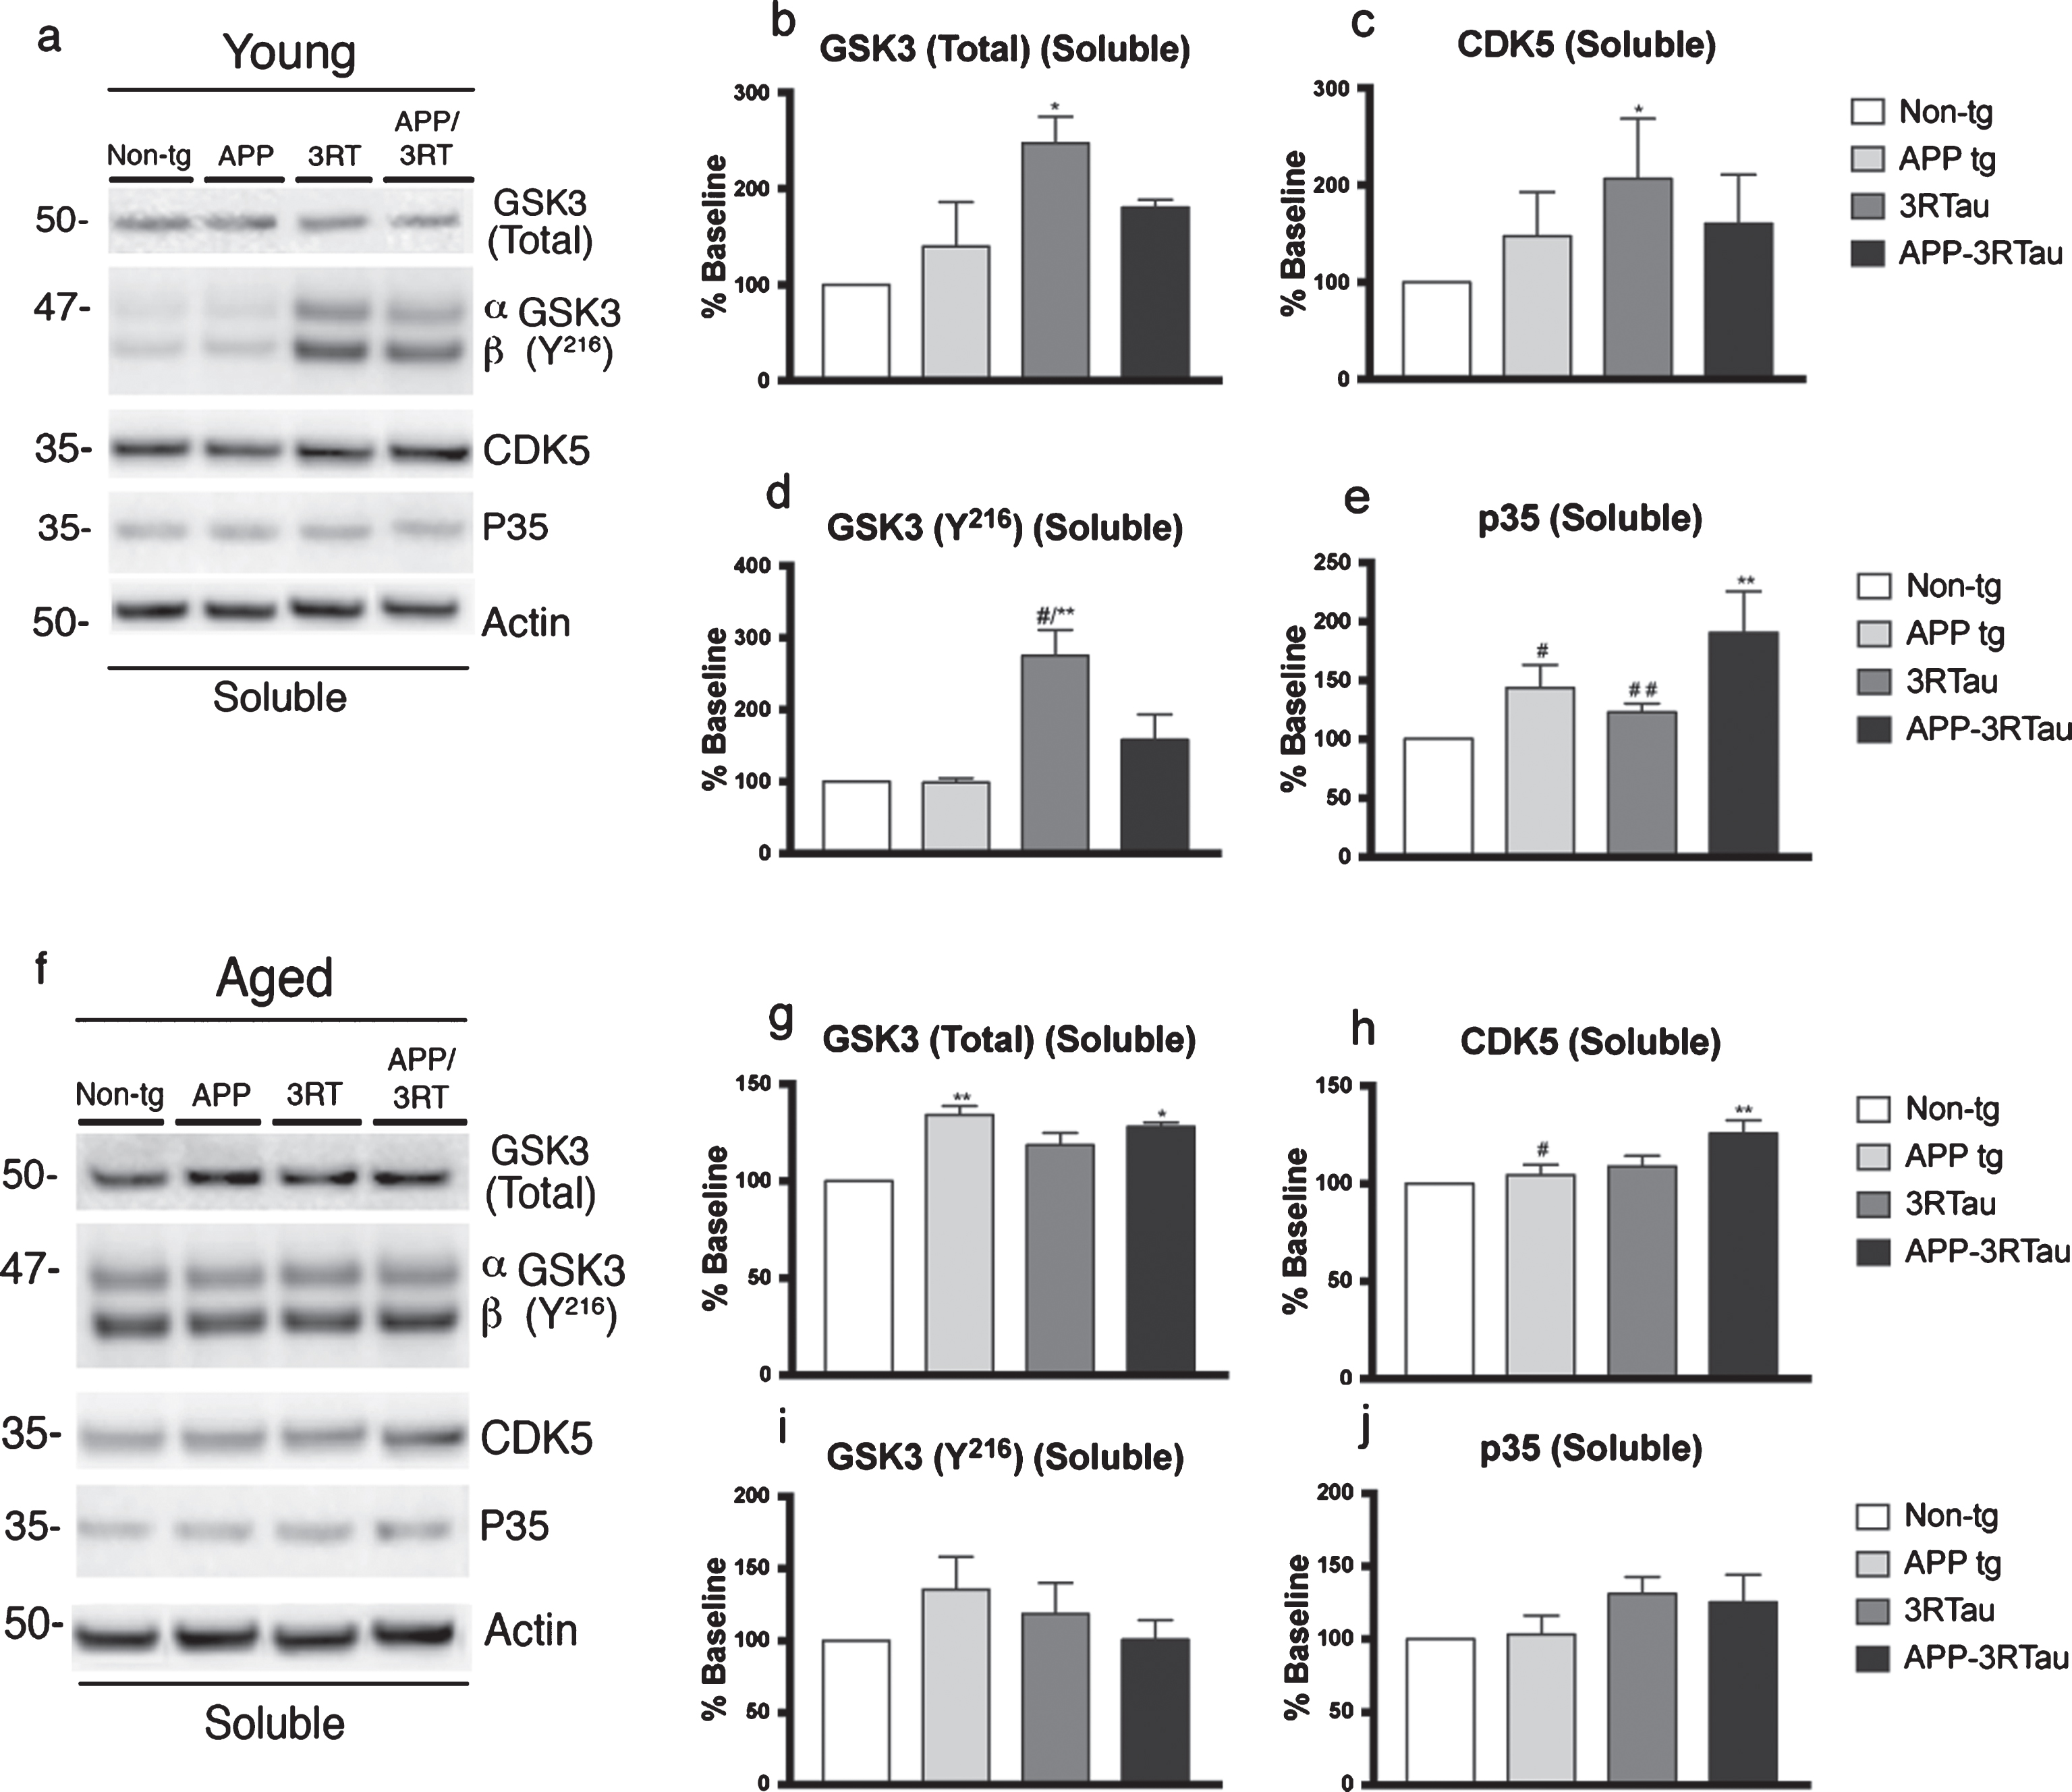
Western blot analyses of hemibrain of APP-3RTau, APP, 3RTau, and non-tg mice. a) Representative western blot (SDS) and analyses of levels of (b) GSK3, (c) CDK5, (d) GSK3β (Y-216), and (e) p35 from the soluble fraction of 3-4-month-old (Young) mice. f) Representative western blot (SDS) and analyses of levels of (g) GSK3, (h) CDK5, (i) GSK3β (Y-216), and (j) p35 from the soluble fraction of 5-9-month-old (Aged) mice. n = 3 for each age group. When analyzing immunoblotting results, * and ** indicates p < 0.05 and 0.01, respectively, when compared to non-tg control using factorial ANOVA; while # and # # indicates p < 0.05 and 0.01, respectively, when comparing APP or 3RTau mice with the APP-3RTau line using repeated-measures factorial ANOVA.
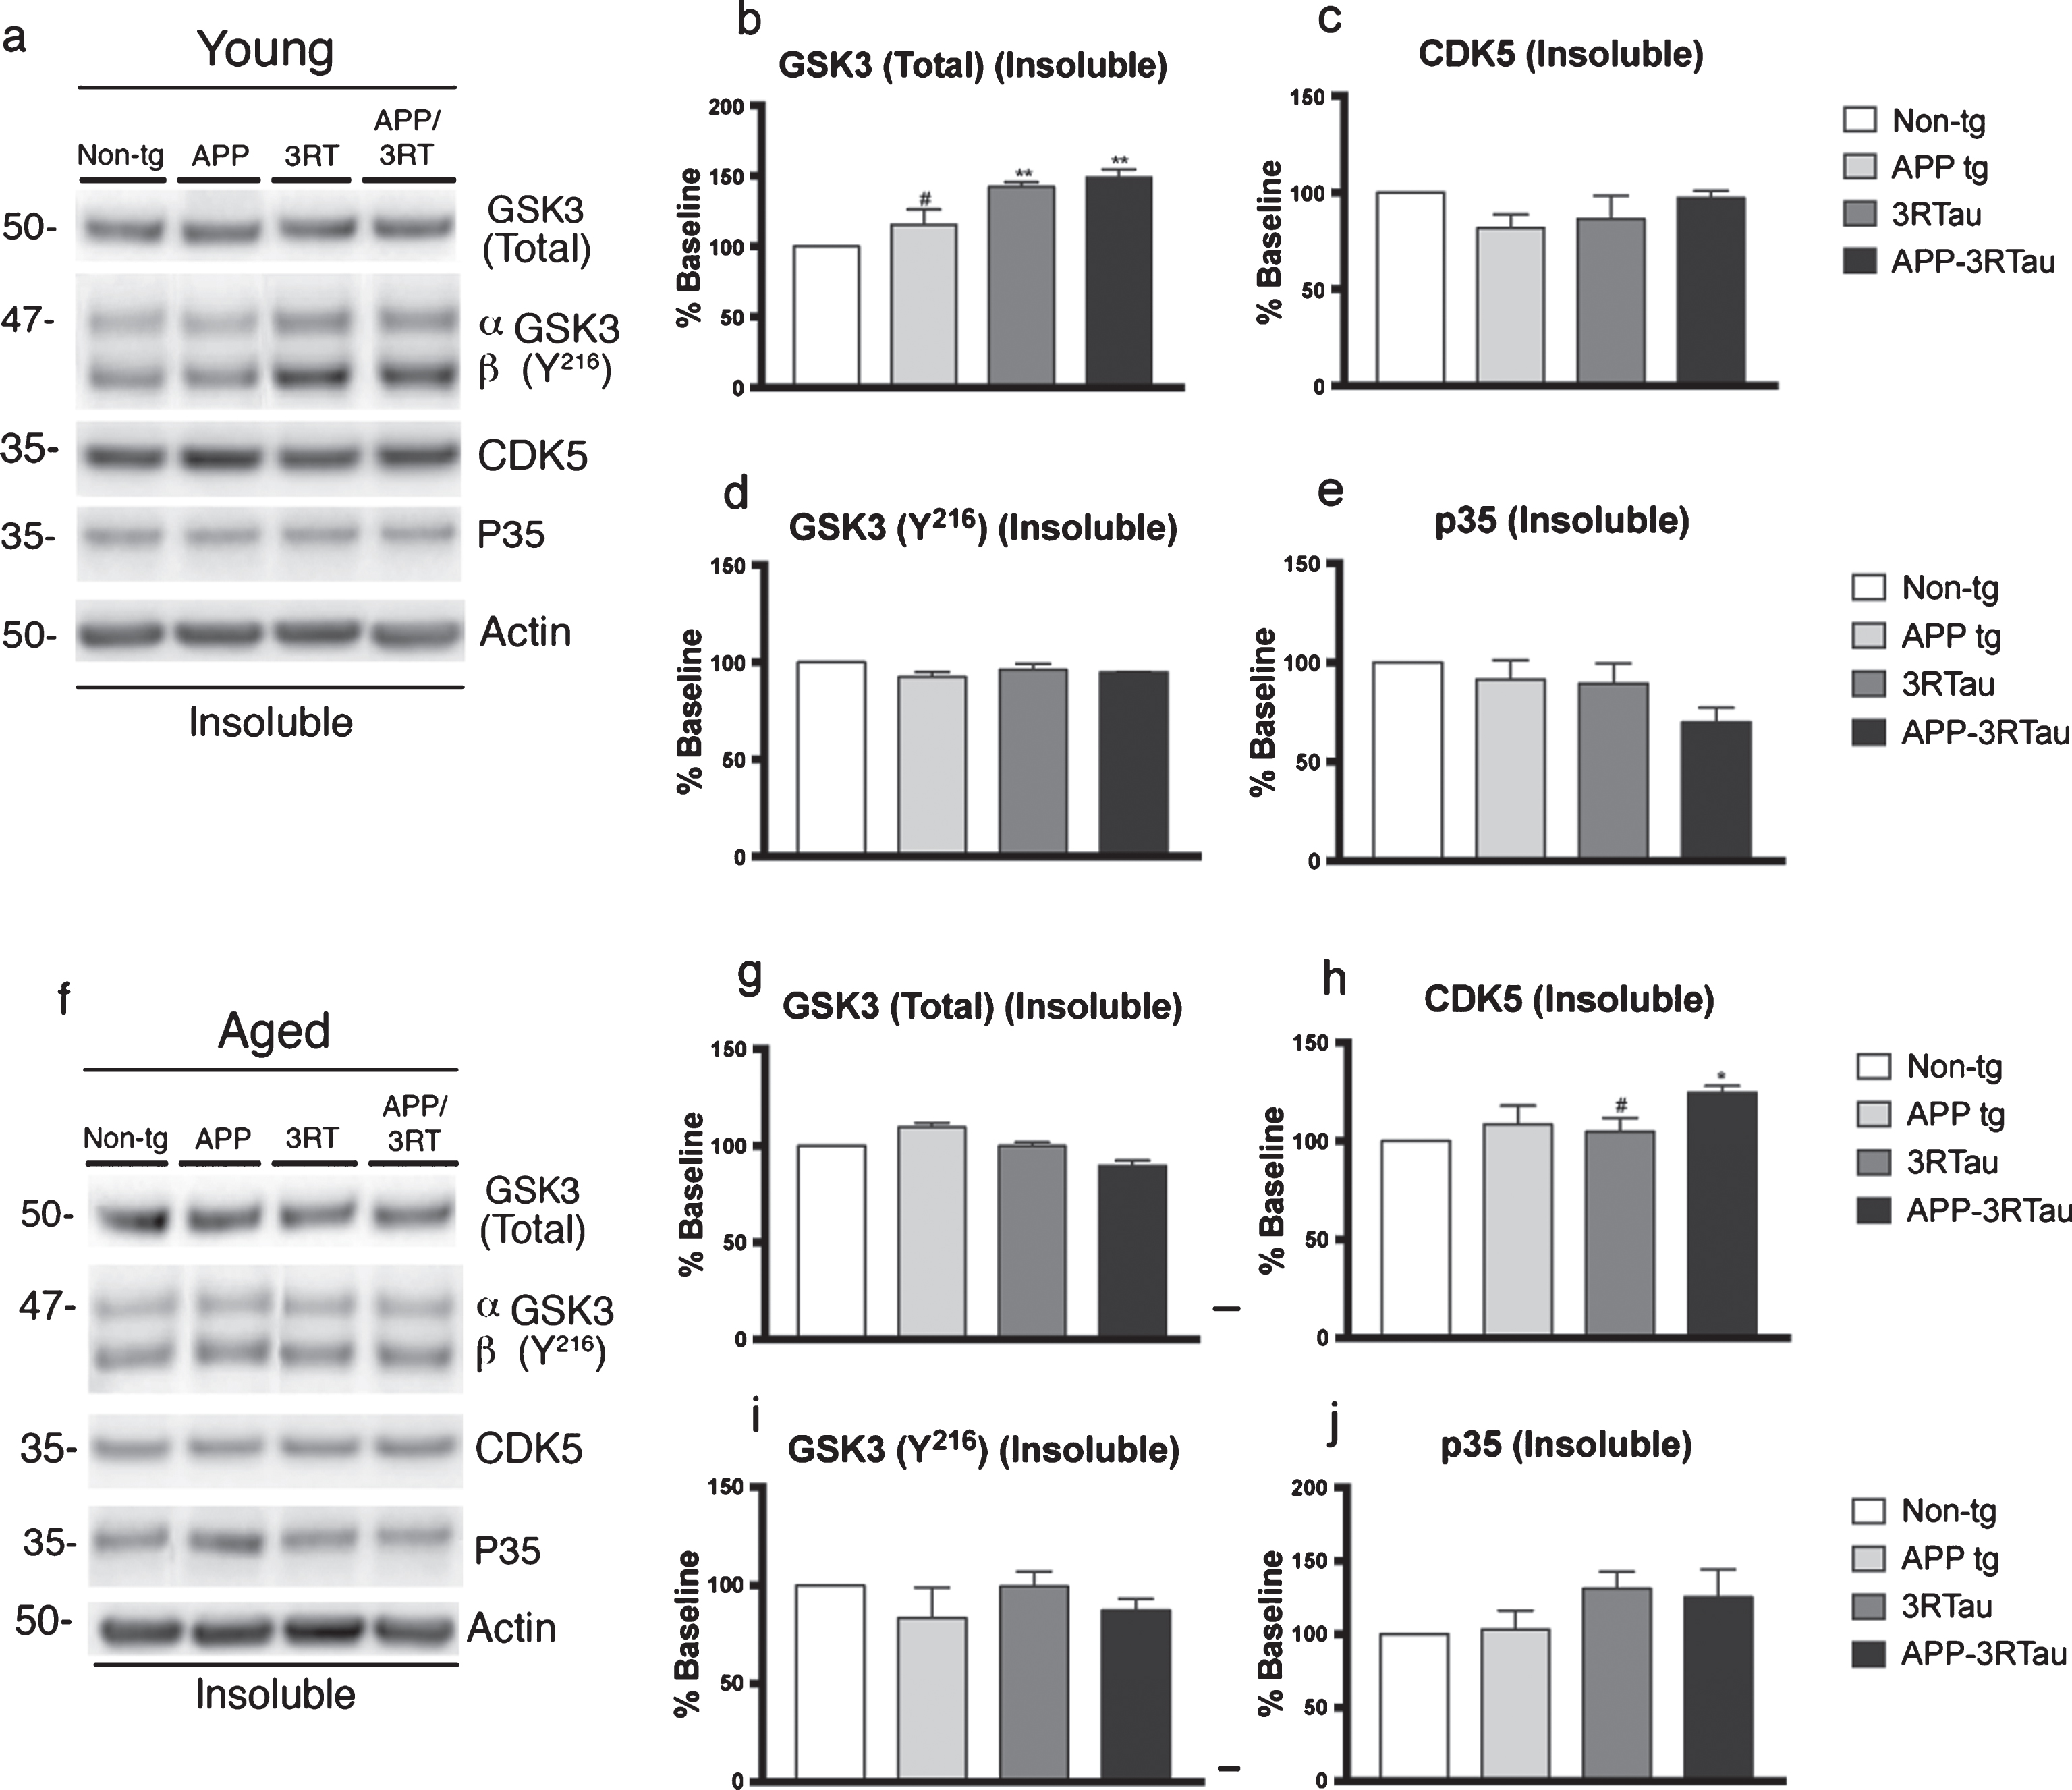
Western blot analyses of hemibrain of APP-3RTau, APP, 3RTau, and non-tg mice. a) Representative western blot (SDS) and analyses of levels of (b) GSK3, (c) CDK5, (d) GSK3β (Y-216), and (e) p35 from the insoluble fraction of 3-4-month-old (Young) mice. f) Representative western blot (SDS) and analyses of levels of (g) GSK3, (h) CDK5, (i) GSK3β (Y-216), and (j) p35 from the insoluble fraction of 5-9-month-old (Aged) mice. n = 3 for each age group. When analyzing immunoblotting results, * and ** indicates p < 0.05 and 0.01, respectively, when compared to non-tg control using one-way ANOVA with post hoc Dunnett’s; while # indicates p < 0.05 when comparing APP or 3RTau mice with the APP-3RTau line using factorial ANOVA.
Higher CDK5 levels were found in both fractions of aged APP-3RTau mice, as well as the soluble fraction of young 3RTau mice, when compared to non-tg levels (Fig. 8a, c, h and Fig. 9a, h). The soluble fraction of aged APP mice and the insoluble fraction of aged 3RTau mice had levels significantly lower than the APP-3RTau line (Fig. 8a, h and Fig. 9a, h). In the soluble fraction from young animals, the neuron-specific activator protein of CDK5, p35, was found to be overexpressed in APP-3RTau mice, while APP and 3RTau mice had significantly lower levels than the bigenic group (Fig. 8a, e).
Worsening neurodegenerative pathology in double transgenic APP-3RTau mice
To investigate the neurodegenerative effects of combining overexpression of APP along with 3R tau we performed IHC on sections with an antibody performed the neuronal marker protein NeuN. In the young cohort, compared to the non-tg mice, the APP and APP-3RTau mice showed a decrease in neuronal density in the neocortex (Fig. 10a, b), dentate gyrus (Fig. 10a, c), and region CA1 of the hippocampus (Fig. 10a, d). 3RTau mice displayed a lower level of immunoreactivity in the neocortex, while APP mice had significantly higher levels than the APP-3RTau mice in this area (Fig. 10a, b). When compared to APP-3RTau mice, 3RTau mice showed significantly higher levels of neuronal density in the dentate gyrus (Fig. 10a, c), while both 3RTau and APP mice displayed higher levels in the CA1 region (Fig. 10a, d). Based on the areas observed, APP-3RTau mice were the only group that consistently displayed relative decreases in neuronal density.

Pattern of NEUN distribution in the brains of the three lines of mice compared with non-tg control. a) Immunostaining with an antibody against NEUN was used on vibratome sections of 3-4-month-old (Young) mice, followed by analysis by digital bright field microscopy. Panels on the top row are low-magnification (5x magnification) photomicrographs of the neocortex and hippocampus. The lower three rows of panels are higher magnification (40x magnification) of the corresponding regions. b) Image analysis of number of neuronal cells in the neocortex, (c) dentate gyrus, and (d) CA1 hippocampus region displaying NEUN distribution. e) Immunostaining with an antibody against NEUN was used on vibratome sections of 5-9-month-old (Aged) mice, followed by analysis by digital bright field microscopy. Panels on the top row are low-magnification (5x magnification) photomicrographs of the neocortex and hippocampus. The lower three rows of panels are higher magnification 40x magnification) of the corresponding regions. f) Image analysis of number of neuronal cells in the neocortex, (g) dentate gyrus, and (h) CA1 hippocampus region displaying NEUN distribution. When analyzing immunohistochemical results, *, **, ***, and **** indicates p < 0.05, 0.01, 0.001, and 0.0001, respectively, when compared to non-tg control using factorial ANOVA; while #, # #, # # #, and # # # # indicates p < 0.05, 0.01, 0.001, and 0.0001, respectively, when comparing APP or 3RTau mice with the APP-3RTau line using repeated-measures two-way ANOVA. Low magnification panel scale bar = 100 μm; high power panel scale bar = 10 μm.
With the exception of the neocortex of APP mice, all areas observed for the three aged transgenic groups showed decreases in neuronal density when compared to non-tg mice (Fig. 10e-h). When compared to APP-3RTau mice, APP mice showed higher levels in the neocortex and region CA1 (Fig. 10e, f, h), while 3RTau mice had higher levels in the dentate gyrus and region CA1 (Fig. 10e, g, h). In summary, both ages of transgenic mice showed at least some level of relative neuronal loss in several regions, the most apparent and frequent decreases were found in APP-3RTau mice.
IHC analysis for astrogliosis with an antibody against GFAP showed that the young group of APP and APP-3RTau mice showed increased levels of GFAP in the neocortex (Fig. 11a, b), dentate gyrus (Fig. 11a, c), and CA1 of the hippocampus (Fig. 11a, d) compared to the non-tg mice. The young 3RTau mice only showed relatively significant astrogliosis in the neocortex (Fig. 11a, b). Compared to the young APP-3RTau mice, the 3RTau mice had significantly lower levels of astrogliosis in all areas observed, while the APP mice displayed lower levels in the neocortex and dentate gyrus (Fig. 11e-h).
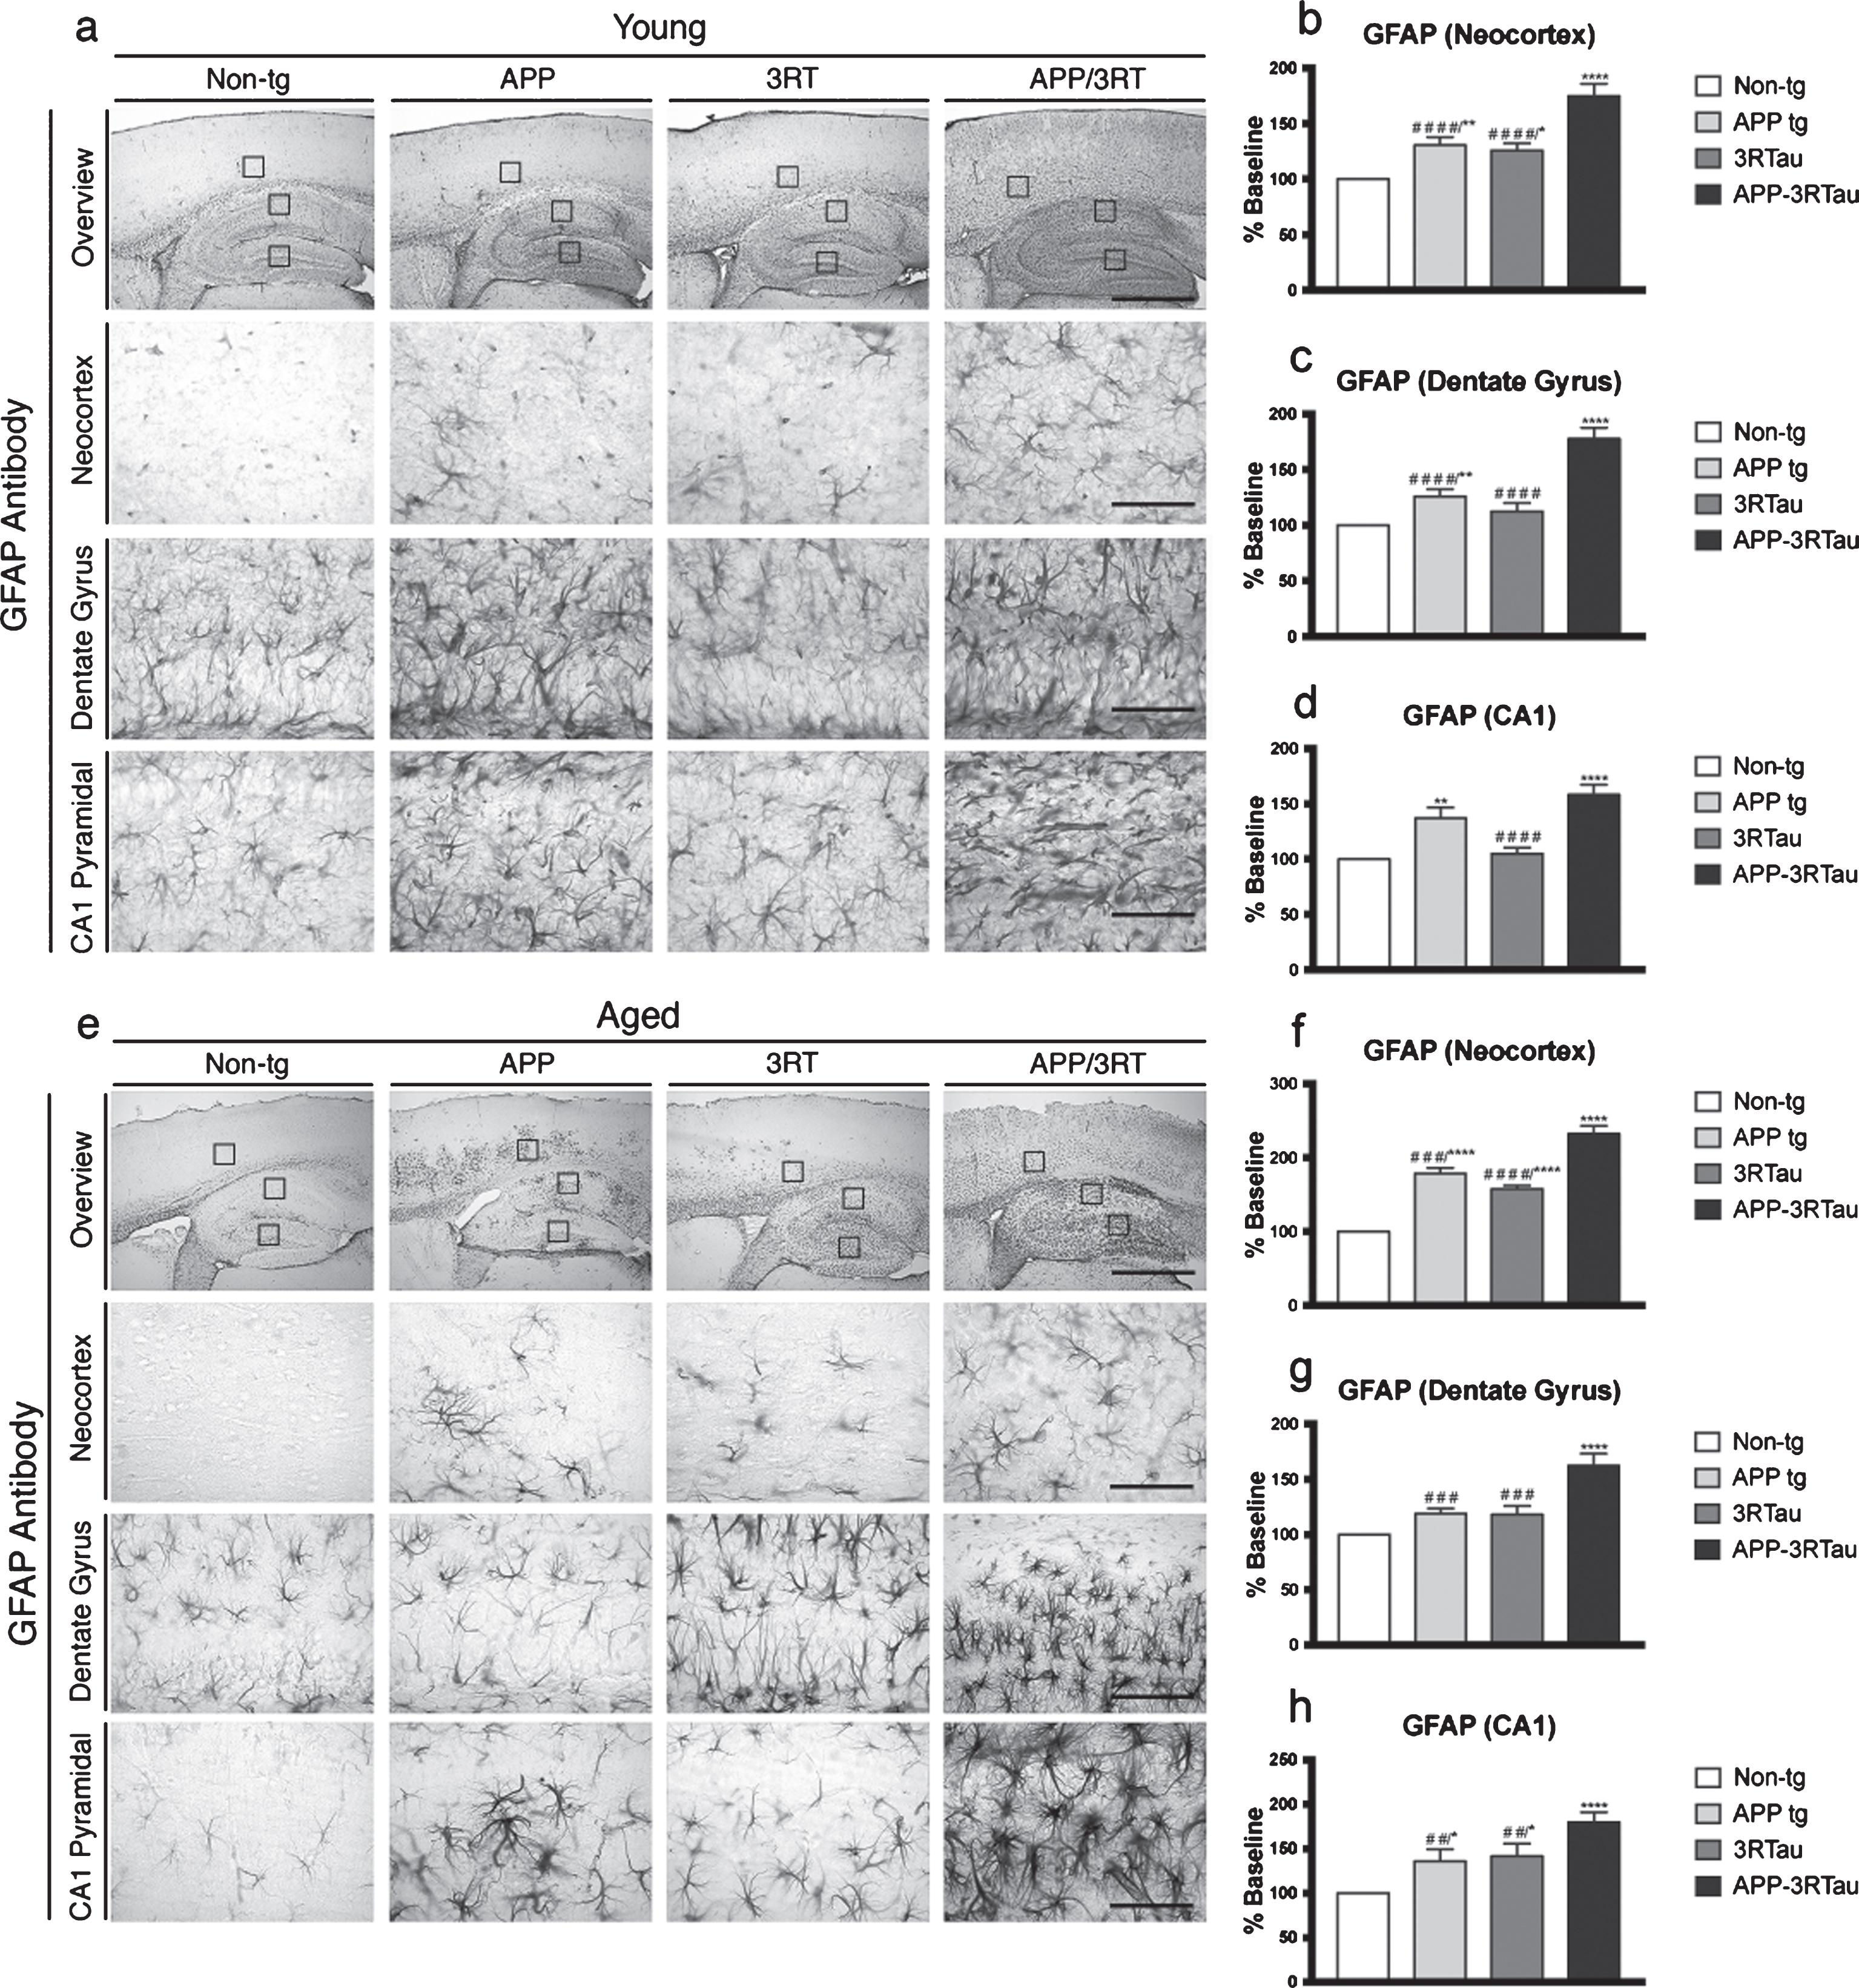
Pattern of GFAP distribution in the brains of the three lines of mice compared with non-tg control. a) Immunostaining with an antibody against GFAP was used on vibratome sections of 3-4-month-old (Young) mice, followed by analysis by digital bright field microscopy. Panels on the top row are low-magnification (5x magnification) photomicrographs of the neocortex and hippocampus. The lower three rows of panels are higher magnification (40x magnification) of the corresponding regions. b) Image analysis of number of neuronal cells in the neocortex, (c) dentate gyrus, and (d) CA1 hippocampus region displaying GFAP distribution. e) Immunostaining with an antibody against GFAP was used on vibratome sections of the 5-9-month-old (Aged) mice, followed by analysis by digital bright field microscopy. Panels on the top row are low-magnification (5x magnification) photomicrographs of the neocortex and hippocampus. The lower three rows of panels are higher magnification (40x magnification) of the corresponding regions. f) Image analysis of number of neuronal cells in the neocortex, (g) dentate gyrus, and (h) CA1 hippocampus region displaying GFAP distribution. When analyzing immunohistochemical results, *, **, and **** indicate p < 0.05, 0.01, and 0.0001, respectively, when compared to non-tg control using factorial ANOVA; while # #, # # #, and # # # # indicates p < 0.01, 0.001, and 0.0001, respectively, when comparing APP or 3RTau mice with APP-3RTau line using repeated-measures two-way ANOVA. Low magnification panel scale bar = 100 μm; high power panel scale bar = 10 μm.
For the aged cohort, APP-3RTau mice showed higher levels of astrogliosis compared to the non-tg mice in all areas observed (Fig. 11e-h). This was also the case for the APP and 3RTau mice in the neocortex and region CA1 (Fig. 11e, f, h). Compared to the aged APP-3RTau mice, 3RTau and APP mice had significantly lower levels of astrogliosis in all areas observed (Fig. 11e-h). To summarize, these results support the conception that combining APP and 3R tau overexpression increases the vulnerability of pyramidal and granular neurons consistently when compared to non-transgenic mice, and often when compared to mice with only one of the trasngenes.
DISCUSSION
In this present study, we characterized the effects of short-term and long-term expression of mutant 3RTau gene with and without the presence of the hAPP gene in transgenic mice meant to model several neurodegenerative diseases, including PiD and AD. IHC data displayed that the mice carrying the mutant 3RTau gene showed extensive accumulation of 3R tau in the neocortex, dentate gyrus, and area CA1 of the hippocampus, with increased levels observed in the bigenic mice. This pattern was also found when detecting for phosphorylated tau with both IHC and immunoblots. This trend again corresponded with additional observation of the presence of tau via the MC1 antibody, which detects a pathological conformation of tau that has been shown to precede NFT formation in AD [21]. Elevated levels of glial scarring in IHC slides complemented these results in the transgenic mice, again with the highest levels found in the bigenic mice. As expected, given the aforementioned IHC patterns, neuronal density decreased in most areas, with the lowest densities found in the bigenic mice. Our immunoblot data only detected insoluble Aβ in the two lines of mice carrying the hAPP transgene; any within the soluble fraction was either present at levels below the threshold of observation or simply absent. This is consistent with other APP mouse models targeting Aβ plaques with SDS-containing buffers that detected Aβ predominantly in the insoluble fractions [22]. Given that abnormally high levels of NFTs are also present, increased levels of insoluble Aβ is consistent with AD pathology, and evidence indicates a correlation with the amount of plaques present and the onset of the disease and/or possibly the magnitude of symptoms [23].
This paper aims to augment the initial results that observed the behavioral and biochemical properties of the novel mutant 3RTau (L266V and G272V mutations) transgenic mice [17]. Similar results were found for the young 3RTau mice in regard to memory, learning, activity, and motor alterations. Pathological development was analogous as well for both ages studied, with clear accumulation of pTau, 3R tau and GFAP aggregates. However, behavioral and neuropathological changes were more pronounced in the bigenic line, which is a novel observation.
The interest in observing overexpression of 3R tau and hAPP comes from well-established evidence of additive neurodegenerative effects of senile plaques and tangles in the development of AD. The amyloid-cascade hypothesis claims that Aβ aggregation is central to AD pathology and increases the rate of neurodegeneration, while downstream tau aggregates elicit the actual pathogenic effects [24, 25]. As mentioned, our results appear consistent with this model given the higher levels of toxic phosphorylated tau and glial scarring, as well as the decreased neuronal density in the bigenic mice, compared with the 3RTau mice, and an even stronger trend compared with the non-tg mice. Interestingly, the number of NFTs, but not amyloid plaques, correlate positively with severity of dementia in AD [26]. This then leads to the belief that amyloid plaques cause additional neurological harm only when an abundance of NFTs are also present. It is worth noting, however, that the presence of Aβ plaques and their role is somewhat obscure, as several studies have found a potential neuroprotective effect of the aggregates as an antioxidant, an excitotoxic inhibitor [27], as well as an antibiotic [28]. Our behavioral data seems to adhere to this theory as the APP mice rarely displayed behavioral deficits compared to the non-tg control, while the 3RTau and bigenic mice did.
There are 40 phosphorylation sites that have been identified on the tau protein isolated from AD brains, several of which including Ser262, Thr231, and Ser235 are found to be associated with inhibition of tau to bind to microtubules; while phosphorylation at other sites, such as Ser396, promotes self-aggregation [29]. There is also evidence that the rate of tau phosphorylation from some of its common kinases, such as CDK5 and GSK3β, increases after a certain level of initial phosphorylation occurs [10]. Previous studies have shown that over-activation of the proline-directed serine/threonine kinases GSK3 and CDK5 are significant components to the development of tauopathies [30]. Furthermore, evidence correlates GSK3 with both sporadic and familial forms of AD, not only because of its presence as a tau kinase, but also for its apparent upregulation of Aβ production from APP [31]. These preliminary results led to our focus on total levels of CDK5 and GSK3. Further insight was sought by detecting levels of p35, the most effective full-length neuron specific activator of CDK5 [32], as well as the state of GSK3β that has been shown to be its activated form, p-Y216 [33].
While our immunoblot results do not completely coincide with what established literature would suggest, there are several trends that do seem to conform. Total levels of GSK3 were often found to be higher in all three of the transgenic mouse lines. In addition to this, higher levels of the activated form of GSK3β (p-Y216) were found in the soluble fraction of the two lines of young mice carrying the mutant 3RTau gene. This observation coupled with the significantly higher levels of p35 detected in the soluble fraction of the young bigenic mice parallels antecedent evidence mentioned above. This implies a potential early onset of tau and/or Aβ pathogenesis, which might explain at least a component of the toxic and neurodegenerative IHC and immunoblot results.
Taken together, our results suggest that expressing high levels of 3R tau as well as hAPP leads to neuropathology and behavior alterations that resemble certain tauopathies, such as PiD and AD. We conclude that this novel bigenic model may be useful to elucidate neurodegenerative disease mechanisms, as well as a platform for prosecuting new disease targets and therapeutic molecules.
Footnotes
ACKNOWLEDGMENTS
The authors thank the members of the Rissman lab for technical assistance with this project and the assembly of the manuscript. We also thank Dr. Peter Davies for generously providing antibodies PHF-1, MC1, and CP13. This work was supported by NIH Grants AG051848, BX003040, AG051839, AG005131, AG018440, and AG000216 to RAR.
