
Abstract
Background:
Semantic dementia (SD) is characterized by a selective decline in semantic processing. Although the neuropsychological pattern of this disease has been identified, its topological global alterations and symptom-relevant modules in the whole-brain anatomical network have not been fully elucidated.
Objective:
This study aims to explore the topological alteration of anatomical network in SD and reveal the modules associated with semantic deficits in this disease.
Methods:
We first constructed the whole-brain white-matter networks of 20 healthy controls and 19 patients with SD. Then, the network metrics of graph theory were compared between these two groups. Finally, we separated the network of SD patients into different modules and correlated the structural integrity of each module with the severity of the semantic deficits across patients.
Results:
The network of the SD patients presented a significantly reduced global efficiency, indicating that the long-distance connections were damaged. The network was divided into the following four distinctive modules: the left temporal/occipital/parietal, frontal, right temporal/occipital, and frontal/parietal modules. The first two modules were associated with the semantic deficits of SD.
Conclusion:
These findings illustrate the skeleton of the neuroanatomical network of SD patients and highlight the key role of the left temporal/occipital/parietal module and the left frontal module in semantic processing.
Keywords
INTRODUCTION
Semantic memory is a pivotal cognitive component of the human brain and refers to general world knowledge about objects, people, words, and facts [1]. This memory system is selectively impaired in semantic dementia (SD), which is a progressive neurodegenerative disease. Patients with SD often show a gradual decline in semantic function regardless of modalities of inputs and outputs [2–5], with a relative sparing of other cognitive domains [6, 7]. Thus, this disease provides an ideal model to investigate the neural mechanism of semantic processing. Prior studies have observed that individuals with SD suffer from atrophy in multiple cerebral cortices [8, 9], functional, and structural pathways [10, 11]. However, most of the findings regarding networks have been derived from seed-based analyses and only obtained networks connected to the given seeds of SD [11–13]. For instance, Guo and colleagues [11] found that functional connectivity was decreased between the anterior temporal lobe (ATL) and other modality-specific areas in patients with SD. Similarly, structural changes were also found on the white-matter tracts connecting the ATL to other regions, such as the inferior longitudinal fasciculus, uncinate fasciculus, and inferior fronto-occipital fasciculus [6, 15].
While the literature has revealed a widely distributed network that is specific to semantic processing in normal subjects [16–19], previous seed-based studies in SD might only reveal a part of the network of SD. Thus, changes of the global network in SD are unknown. Recently, Agosta and colleagues [20] filled such a gap by investigating the graph theoretical measures (e.g., network degree, global efficiency, local efficiency, and assortativity) of the global network in SD using resting-state functional magnetic resonance imaging (MRI) data. The authors found that compared to healthy controls, SD patients had lower values in network degree, and global and local efficiency, and higher value in assortativity. However, it is unclear whether this functional global network in SD has a corresponding anatomical basis.
More importantly, the human brain network is intrinsically composed of distinctive modules [21], and each module subserves a specific function [22]. Farb and colleagues [23] found that the functional abnormality in SD was mainly distributed in three following modules: salience, executive, and default mode ones. Since the relationship between modular pathology and semantic symptom has not been investigated, it is unknown which modules are associated with the semantic disruption in SD.
To characterize the topological global attributes of whole-brain white-matter networks in SD and identify which impaired modules cause the semantic disorder in SD, the current study collected diffusion-weighted images (DWI) and semantic performance data from 19 SD patients and 20 healthy controls. We first constructed the whole-brain structural networks of the two subject groups. Then, we calculated the global changes in the networks by comparing the graph-theoretical measures between the subject groups. Finally, we separated the SD network into different modules and acquired the semantic-relevant modules by correlating the integrity value of each module with the semantic performance of the SD patients (see Fig. 1). We assumed that the structural network in SD patients would have topological alteration relative to that of the healthy controls. Moreover, the modules, including regions in the left temporal lobe, could contribute to the semantic deterioration in SD.
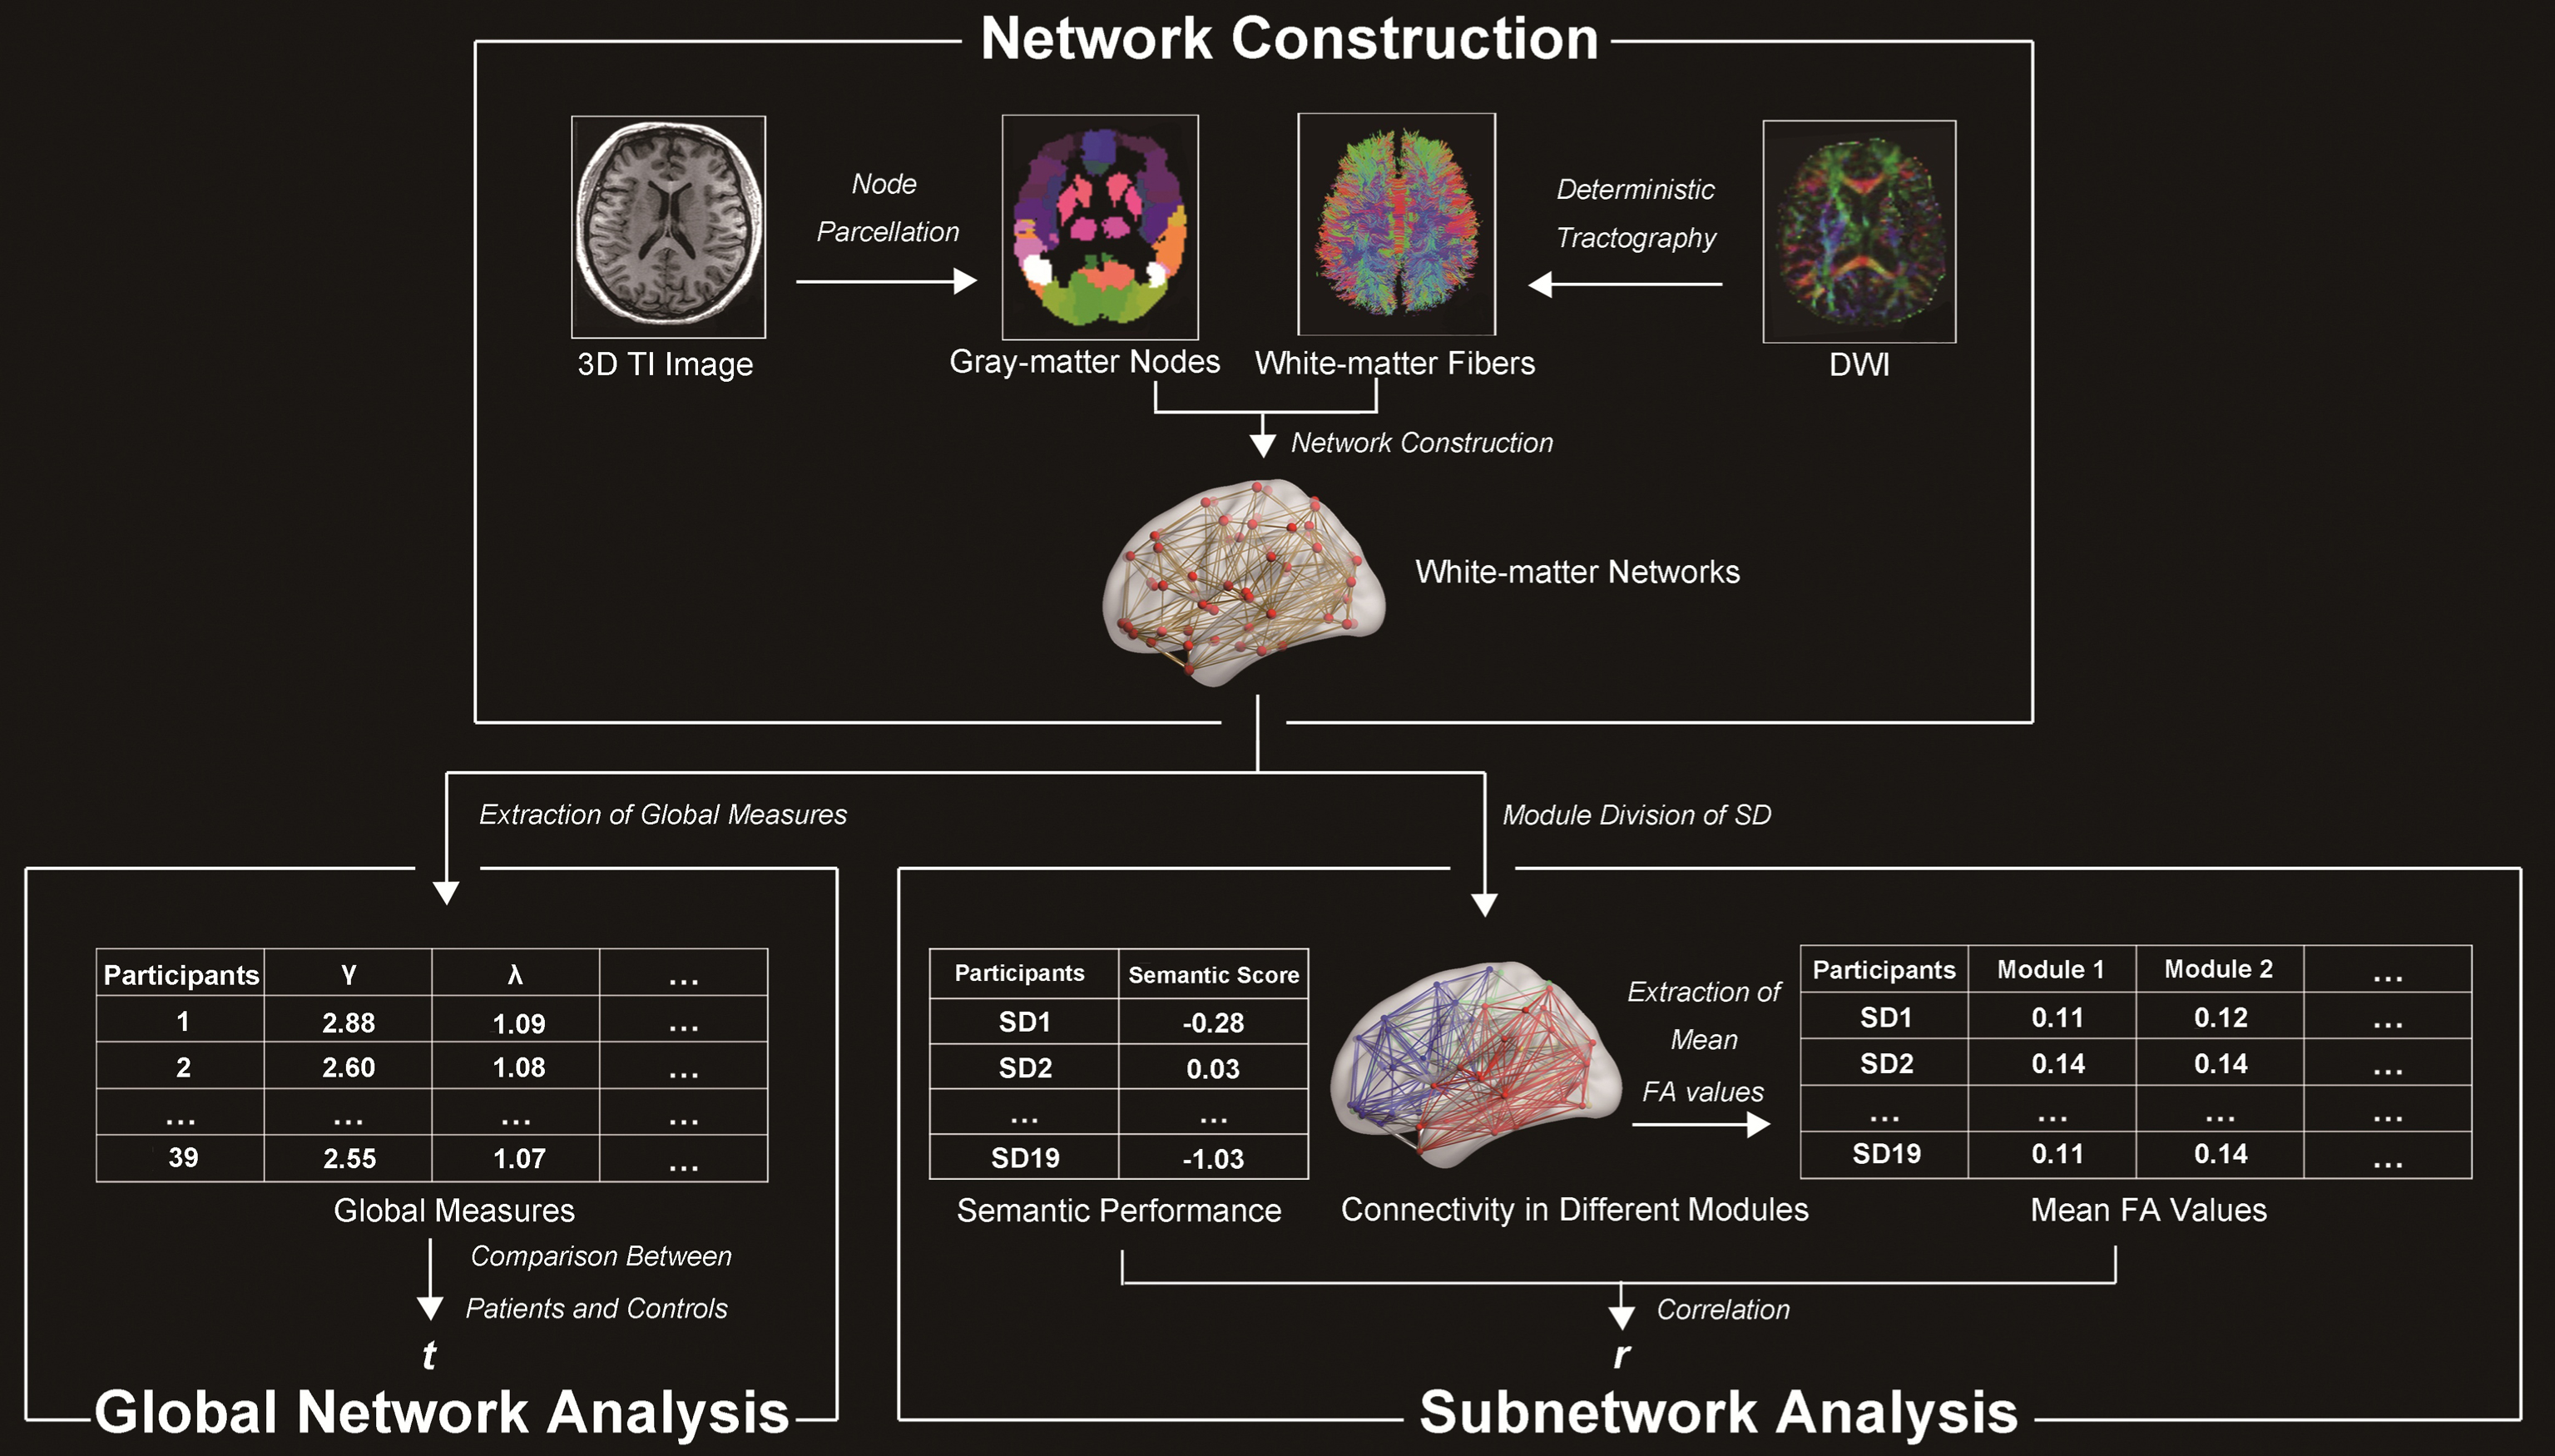
Flowchart of the analyses performed in this study. NC, normal controls; SD, semantic dementia; DWI, diffusion-weighted images.
MATERIALS AND METHODS
Participants
We recruited 19 adults with SD (12 males; mean age: 61.26±8.63 y; mean education level: 11.53±3.34 y; disease duration: 3.03±1.46 y) and 20 healthy controls (8 males; mean age: 60.50±3.93 y; mean education level: 10.45±2.89 y) from Huashan Hospital in Shanghai. All participants were right-handed [24] native Chinese-speakers. The subject sample was the same as that in our recent study [25]. The participants underwent a set of comprehensive neuropsychological assessments. All patients satisfied the diagnostic criteria of SD [26], and presented selective dysfunction in semantic processing and atrophy in the ATL (see Table 1). This study was approved by the Institutional Review Board of the National Laboratory of Cognitive Neuroscience and Learning, Beijing Normal University.
Demographic and clinical information of participants
MMSE, Mini-Mental State Examination; STT, shape trail test; SD, semantic dementia. **p < 0.01, ***p < 0.001.
Collection and preprocessing of neuropsychological data
The methods used to collect and preprocess the neuropsychological data in the present study have been previously elaborated by Ding et al. [25]. For simplicity, these methods are not described in detail here.
Each subject was evaluated on the following three aspects of cognitive abilities. (1) Semantic processing ability. Semantic processing ability was assessed by the following six tasks: oral picture naming (n = 140; subjects were instructed to name the objects shown in pictures that appeared on a screen), oral sound naming (n = 36; subjects were instructed to name the objects that produced the sounds they heard), picture associative matching (n = 70; subjects were instructed to identify which of the two pictures of objects shown in the bottom was semantically closer to the top picture of the object that appeared on the screen), word associative matching (n = 70; this task is identical to the picture associative matching task except that the pictures were replaced with the corresponding written words), word-picture verification (n = 70; subjects were instructed to determine whether the object and the word on the screen were identical), and naming to definition (n = 70; subjects were instructed to name the objects whose definitions were visually and aurally presented). The tasks shared semantic components but varied in the modalities of the inputs and outputs. (2) Non-semantic processing ability. Non-semantic processing ability was evaluated by the following three tasks: sound perception (n = 44; subjects were instructed to determine whether the episode of sound has the same rhythm and pitch), visual perception (n = 30; subjects were instructed to determine whether two circles were the same), and proximity judgment (n = 3; subjects were instructed to determine which of two numbers was quantitatively closer to a third number that appeared on a screen). These tasks required minimal semantic involvement. (3) General cognitive ability was measured using the Chinese version of the Mini-Mental State Examination (MMSE) [27].
To obtain the cognitive measures, we first calculated the accuracy of each subject on each task. Each patient’s accuracy on each task was further corrected into a standardized t-score based on the distribution of scores of the healthy control group to rule out the influence of demographic variables. This method was developed by Crawford and Garthwaite [28] and has been widely adopted [25, 30]. Specifically, a regression model was first established for each task in the normal control group, in which the accuracy of the task was treated as the dependent variable and the demographic factors (i.e., age, gender, and education level) were treated as predictors. Then, the predicted accuracy of a patient was acquired by adding his or her demographic factors into the model. The discrepancy value was further extracted by the observed accuracy minus the predicted accuracy. Finally, we calculated the standardized t score of patients, (i.e., the quotient of the discrepancy value divided by the corrected standard error of the estimate).
To obtain a semantic index that could reliably reflect the degree of the semantic deficits in the SD subjects, we conducted a principle component analysis (PCA) using the above-mentioned 6 semantic tasks and 3 non-semantic tasks from the 19 patients. We used subcommands for varimax rotation, a plot of eigenvalues (>1), and a principal components extraction. The factor with the highest loading weight on all six semantic tasks was considered as the semantic factor, and the scores corresponding to this factor were considered to reflect the semantic performance of the SD subjects.
Collection and preprocessing of neuroimaging data
Collection
Each subject was scanned to collect two types of data using a Siemens 3T scanner at Huashan Hospital in Shanghai. (1) 3D T1-weighted images: These images were acquired in the sagittal plane using the following parameters: repetition time = 2300 ms, echo time = 2.98 ms, flip angle = 9°, matrix size = 240×256, field of view = 240×256 mm, slice number = 192 slices, slice thickness = 1 mm, and voxel size = 1×1×1 mm. (2) Diffusion-weighted images: These images were acquired in the transverse plane using the following parameters: repetition time = 8500 ms, echo time = 87 ms, flip angle = 90°, matrix size = 128×128, field of view = 230×230 mm, slice number = 42 slices, slice thickness = 3 mm, voxel size = 1.8×1.8×3 mm, and direction number = 20 directions. The sequence was scanned twice to improve the image quality.
Preprocessing
The T1 images in the native space were first resampled into the voxel size of 1.5×1.5×1.5 mm and were segmented into different types of brain tissue, followed by spatial normalization to the Montreal Neurological Institute (MNI) space using SPM8 (http://www.fil.ion.ucl.ac.uk/spm/) on the gray-matter images. Then, gray-matter volume (GMV) images were generated via affine and non-linear transformation and were smoothed using an 8-mm full-width at half-maximum Gaussian kernel. The DWI data were preprocessed using a pipeline toolbox for analyzing brain diffusion images (PANDA) [31]. First, we performed brain extraction on the b0 images. Second, we corrected for the eddy-current distortion and simple head-motion by registering DWI to the b0 images with an affine transformation. Third, the tensor model was built in the native space. We calculated the following three diffusivities: one diffusivity was in the axial direction (λ1) and the other two diffusivities were in the radial directions (λ2 and λ3). Using these diffusivities, we acquired four voxel-wise diffusion tensor metrics [32, 33], which reflect different profiles of the white matter integrity as follows [6]: fractional anisotropy (FA)
Construction of the networks in the SD and healthy subjects
We constructed whole-brain white-matter networks in the two subject groups using the following steps (see Fig. 1).
Defining the gray-matter nodes
For each subject, the gray-matter mask of the whole brain was first parcellated into 90 regions according to the automated anatomical labelling (AAL) atlas in the MNI space [34]. Then, the regions were transformed into the native space using PANDA (i.e., the images were first coregistered to the T1 images. Then, the T1 image was normalized to the ICBM-152 template in the MNI space. Finally, the atlas was transformed into the native space using the above-mentioned transformation information; see similar methods in [35]). Thus, we obtained 90 gray-matter regions/nodes of each subject in the native space.
Tracking white-matter connections between gray-matter nodes
To identify the white-matter connections/edges among the 90 AAL regions/nodes in each subject, we first tracked the fibers in each subject’s native space using a deterministic fiber-tracking program via the FACT tracking algorithm [36]. Fiber tracing between voxels was performed and terminated when the angle between two consecutive orientations was greater than 45° or the FA value was smaller than 0.15. If a fiber seeding from a voxel in one node succeeded tracking to another node (i.e., terminating in any voxel in the other node), the two nodes would be considered connected by this tracking path. The mean FA value of all fibers connecting these two nodes was considered as the strength value of the connection between the nodes. In this case, the maximal possible number of connections between the 90 nodes in a network was 4,005.
Investigation of the alterations in the global properties in the SD network
To determine whether SD disrupts the healthy structural network, we compared the global network attributes of whole-brain networks between the SD and healthy groups. Small-world attributes have been widely used to depict the topological properties of networks [37, 38]. There are two common small-world measures, i.e., γ and λ, which represent the local and global efficiencies in a given network, respectively. These measures are calculated using the following formula: γ= Creal / Crand and λ= Lreal / Lrand, where Creal and Lreal are the observed clustering coefficient and characteristic path of brain networks, and Crand and Lrand are the corresponding measurements of 10,000 random networks preserving the same number of nodes and edges and degree of distribution as a real network [39]. The cluster coefficient quantifies the connection density between the neighbors of a node (
Using the above-mentioned methods, we calculated the two small-world measures (γ and λ) and three global measures (network degree, assortativity and betweenness) for each SD and healthy subject. These processes were completed using a graph theoretical network analysis toolbox for imaging connectomics (GRETNA) [44]. Then, two-sample t-tests were adopted to compare the measures between the subject groups.
Identification of modules in the structural network in SD
To determine whether the anatomical networks in the SD patients and healthy controls were organized into different modules and whether the modules had group difference, we conducted a modularity analysis on the mean network matrix of the two subject groups using the spectral optimization algorithm in GRETNA [44]. To avoid false-positive connections, the threshold was defined as FA > 0.15 for the mean networks of the SD patients and controls (see similar methods in Agosta et al. [20]) The number of modules in the network was determined by acquiring the maximal modularity Q, which represents a comparison of the within-module and inter-module connections [45]. To determine whether the Q value was significantly higher than that in the random networks, a Z score was calculated by dividing the Q value in the real network by the Q values generated from 10,000 random networks that preserve the same number of nodes and connections, and degree of distribution [39].
The distribution of the node number in different modules was assessed by a series of chi-square tests comparing the SD and control cohorts to determine whether there is significant difference between the SD and control groups. To investigate the damage of all modules, we first extracted the masks of GMV and diffusion metrics in each module. The GMV and diffusion masks were composed by the regions of the module in the AAL atlas and all white matter tracts in the module, respectively. Second, the modular GMV values were extracted by averaging GMV of all voxels in the masks. The 4 mean diffusion metrics of each module were computed by averaging the diffusion metrics of all voxels in the mask of the module and dividing by the number of possible connections of the module in all subjects. Third, we compared the GMV and diffusion metrics between the groups.
Identification of modules associated with semantic deficits in SD
To find which modules of SD observed in the above analyses were related with the semantic disruptions in SD, we calculated the correlation between the four diffusion metrics of each module and the semantic PCA scores across the 19 patients. To further determine whether the semantic-relevant effects of the modules observed in the above analyses were driven by other confounding variables, we carried out partial correlation analyses between the observed module’s FA values and the semantic PCA scores by additionally partialling out the influence of the following potential confounding variables: (1) total GMV (GMV of all voxels in the whole-brain gray-matter mask), (2) modular GMV (GMV of all voxels in the mask of the corresponding module), (3) general cognitive state (the corrected t-score of the MMSE test), and (4) the atrophy lateralization (a dichotomic variable: left- or right-hemispheric predominate atrophy was coded as 1 or 0, respectively, see a similar method in Ding et al. [25]).
RESULTS
Neuropsychological and atrophy profiles of participants
Table 1 shows the demographic information, neuropsychological performance, and cerebral atrophy of the SD patients relative to those of the healthy subjects. There were no differences between these two groups in terms of the demographic variables (p values > 0.15). According to the raw accuracies, the SD patients exhibited an impaired semantic ability (t-values < –8.02, p values < 0.001), general cognitive ability (t = –6.98, p < 0.001), and other cognitive abilities (word reading: t = –4.97, p < 0.001; sound perception: t = –3.45, p < 0.002; Rey-O recall: t = –3.08, p < 0.004), but the abilities of oral repetition (t = –0.65, p = 0.52), visual perception (t = 1.93, p = 0.06), sentence comprehension (t = –1.11, p = 0.28), executive control (t = 1.46, p = 0.16), and arithmetic (t = –1.49, p = 0.15) were spared. These results were also observed using the standardized t scores of the SD group. Moreover, the SD patients showed severe atrophy in the bilateral ATL and total GMV (t values > –4.55, p values < 0.001; Table 1), extending into other temporal and frontal areas (Fig. 2A; FDR corrected p < 0.05). In total, 13 patients exhibited the left-hemispheric predominant atrophy.

Atrophy pattern in the SD patients and white-matter networks in the normal control and SD groups. Panel A shows the cerebral atrophy in SD (FDR corrected p < 0.05). Panels B and C denote the modular and connectivity pattern in SD and NC. Panel D shows the labels of the regions, and their corresponding names are provided in Table 3. NC, normal controls; SD, semantic dementia; Temporal_L, left temporal/occipital/parietal module; Frontal_L, left frontal module; Frontal_R, right frontal/parietal module; Temporal_R, right temporal/occipital module.
The PCA analysis extracted three distinct components that accounted for 78% of the overall variance (i.e., component 1 = 47%, component 2 = 16%, and component 3 = 15%). The loading weights of all tasks on each component are listed in Table 2. Component 1 was treated as a semantic component since it had high loading weights on all semantic tasks (>0.61). Meanwhile, components 2 and 3 were treated as perceptual and arithmetic components because their heaviest loading weights were on the two perceptual tasks (>0.65) and proximity task (0.96), respectively.
Loading weights of each task on each component in principle component analysis
Alterations in the global properties in the SD network
We found that the small-world attribute, i.e., the λ value, in the SD patients was significantly higher than that in the healthy subjects (SD: 1.08±0.01; controls: 1.08±0.01; t = 2.11, p < 0.03). However, the values of γ were comparable between the two groups (SD: 2.84±0.28; controls: 2.70±0.19; t = 1.84, p = 0.07). These findings demonstrate that the SD patients had a reduced global processing efficiency, but their local processing efficiency in the network was unaffected. We did not find any difference between the two cohorts in the other 3 global network measures (degree: t = –1.3, p = 0.20; betweenness: t = 1.52, p = 0.14; assortativity: t = 0.43, p = 0.67).
Modules associated with semantic deficits in SD
When we used an FA value > 0.15 as the threshold, the mean network densities in the SD patients and controls were 0.14 and 0.15, respectively. For each subject group, our modularity analysis divided the 90 nodes into the following four modules (SD: Q = 0.47, Z = 27.40; controls: Q = 0.44, Z = 24.64; see Figs. 2 & 3): the left temporal/occipital/parietal module (SD: 17 nodes; controls: 22 nodes; χ2 = 0.64, p = 0.42), the left frontal module (SD: 28 nodes; controls: 27 nodes; χ2 = 0.02, p = 0.89), the right temporal/occipital module (SD: 22 nodes; controls: 23 nodes; χ2 = 0.02, p = 0.88), and the right frontal/parietal module (SD: 23 nodes; controls: 18 nodes; χ2 = 0.61, p = 0.44). The label of each node is presented in Table 3.
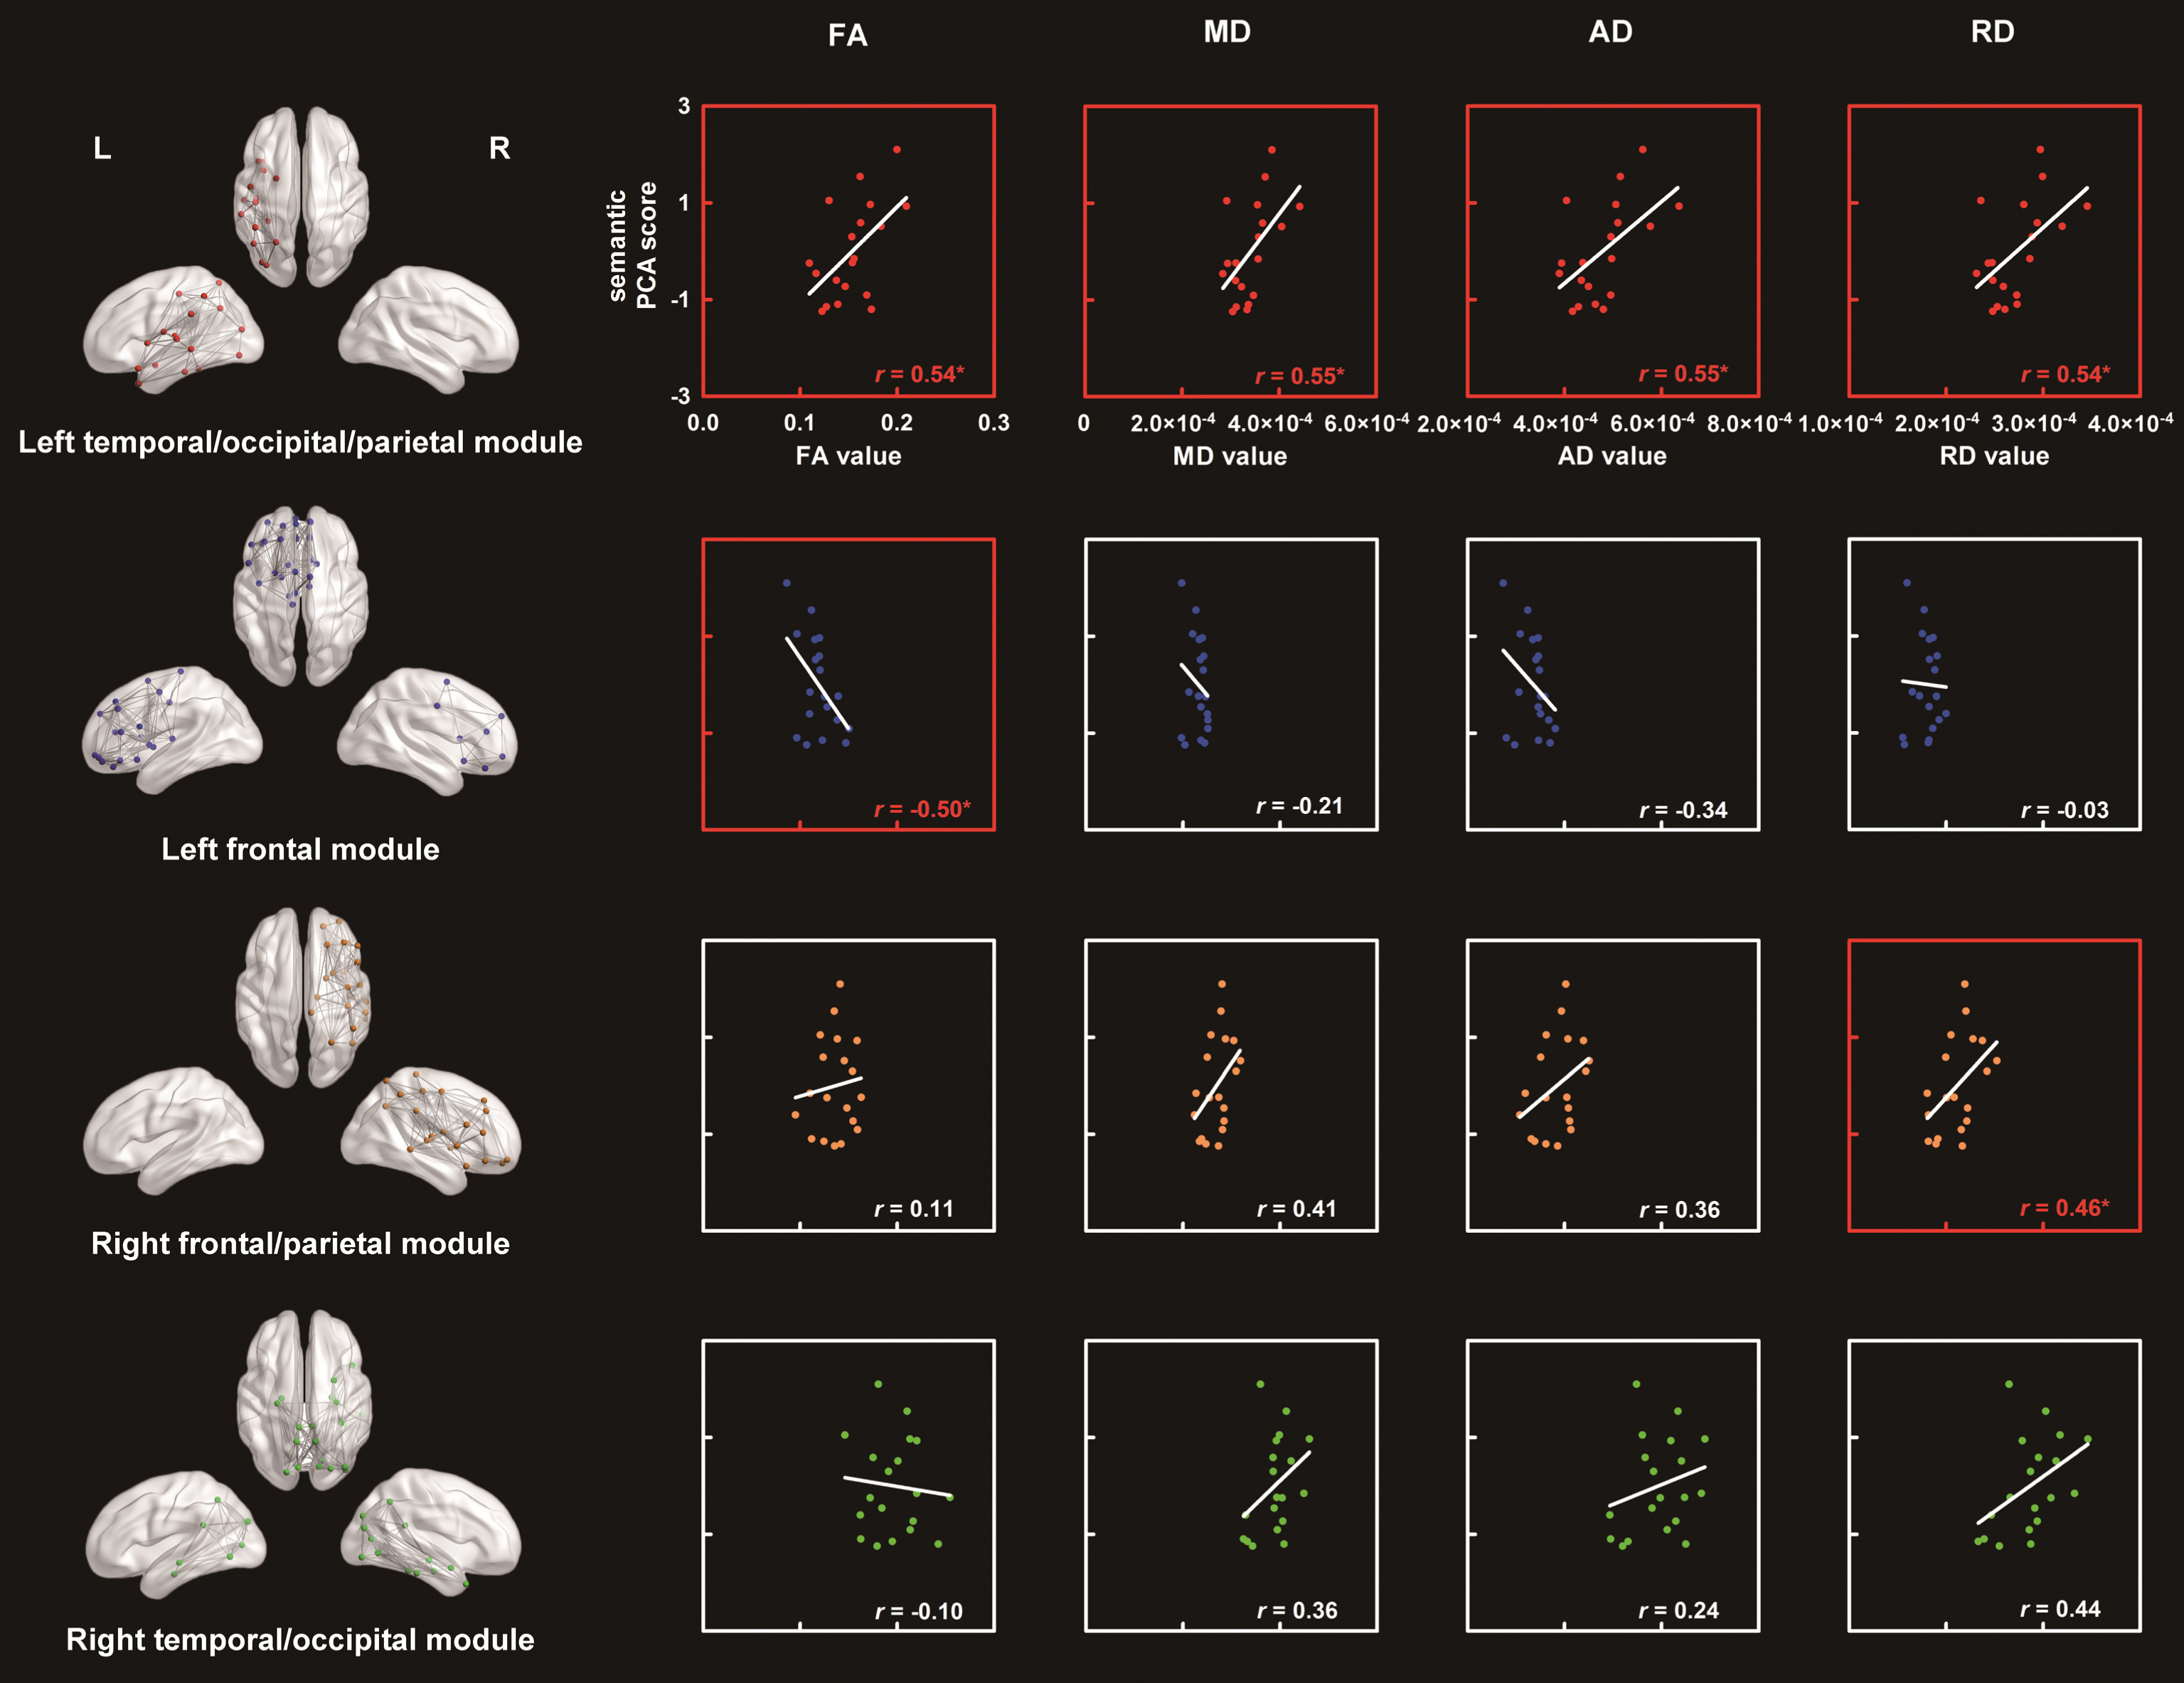
Four modules in the SD white-matter network and the correlations between the diffusion metrics of each module and the semantic performance in the SD patients. The labels and names of the nodes in each module are provided in Fig. 2D and Table 3, respectively. *p < 0.05. FA, fractional anisotropy; MD, mean diffusivity; AD, axial diffusivity; RD, radial diffusivity; PCA, principle component analysis.
The distribution of the 90 AAL regions in the four modules in the white-matter network in SD
Temporal_L, left temporal/occipital/parietal module; Frontal_L, left frontal module; Temporal_R, right temporal/occipital module; Frontal_R, right frontal/parietal module; Ant, anterior; Inf, inferior; L, left; Med, medial; Mid, middle; Oper, opercularis; Orb, orbital; Post, posterior; R, right; Sup, superior; Supp, supplementary; Tri, triangularis.
Seventy-four of the 90 nodes were divided into identical modules between the two groups. Relative to random level, the number of overlap nodes between the groups (74/90) was significantly higher than that at the random level (25%) (χ2 = 157, p < 0.001), indicating that the SD patients had a module pattern in the node distribution that was highly similar to that in the controls. However, the gray-matter volumes of all modules were lower in the SD patients than those in controls (t-values < – 2.74, p-values <0.009). In contrast, SD disease led to an increase in the three white-matter integrity measures (i.e., MD, AD, and RD) in the left temporal/occipital/parietal module (t values > 2.17, p values < 0.04) and the RD values in the right temporal/occipital module (t = 2.12, p = 0.04). No other group differences reached a significant level (t-values <1.86 or > –0.76, p values > 0.07).
Figure 3 displays the correlations between the diffusion metrics in each module and the semantic PCA scores in the SD individuals. Significantly positive correlations were observed in the left temporal/occipital/parietal module in all metrics (r values > 0.54, p values < 0.02) and in the right frontal/parietal module in the RD values (r = 0.46, p = 0.05). However, a negative correlation was observed in the left frontal module in the FA value (r = –0.50, p < 0.03). Other correlations were not significant (r values < 0.44 or > –0.34, p values < 0.06).
Importantly, the correlation between damage to the left frontal module and the semantic impairments remained significant even after controlling for the total GMV, modular GMV, general cognitive state, and atrophy lateralization (partial r-values < –0.52, p-values < 0.03). Similarly, the effects in the left temporal/occipital/parietal module remained significant or marginally significant after controlling for all of the above-mentioned confounding factors (r values > 0.41, p values < 0.09) except for the modular GMV (r values < 0.22, p values > 0.38). Note that the GMV values in this module were significantly correlated with the semantic impairments in the SD patients (r = 0.73, p = 0.004). This finding suggests that the gray matter in this module might be involved in semantic processing. The effects of the right frontal/parietal module could not be accounted for by all confounding factors (r values > 0.44,p values < 0.07) except for the total volume (r = 0.37, p = 0.13). Moreover, the GMV values of the module were associated with the raw scores of the shape trail test (r = –0.58, p = 0.02), indicating that this module might be engaged in general executive control.
DISCUSSION
SD is a disorder characterized by selective semantic deficits due to brain atrophy; thus, SD has become an ideal lesion model to explore the neural basis of semantic processing. This study aimed to investigate the topological global attributes and semantic-deficit-relevant modules in the neuroanatomical network of SD patients. We observed that the network had an increased characteristic path length and was split into four distinct modules (left temporal/occipital/parietal, frontal, right frontal/parietal, and temporal/occipital modules). The first two modules were related to the semantic decline of this disease. The third module was involved in general cognitive control.
The global topological changes in the white-matter network of SD
We observed that the anatomical network in the SD subjects relative to that in the healthy controls had an increased λ value but no significant differences in γ or the other global network measures (degree, betweenness, and assortativity). This finding indicates that SD patients show a declined global efficiency with spared local efficiency. The two efficiencies reflect the different properties of a network. The global efficiency refers to the ability to transform information between any two nodes in the network and can be measured by the characteristic path length (λ value). The global efficiency mainly relies on the edges connecting far-distance nodes. In contrast, the local efficiency represents the ability to transform information between neighbor nodes, which can be measured by the cluster coefficient. The local efficiency mainly depends on the strength of local connections [38, 41]. Thus, our results indicate that distant white-matter pathways in the SD network are disrupted but the local white-matter tracts remain intact. This brain network pattern satisfies the deterioration rules in degenerative diseases [42]. Notably, Agosta et al. [15] also found that SD altered other global network measures (e.g., degree and assortativity) in the functional network. However, a similar pattern was not observed in our study. This difference might be due to the following differences between the two studies. One difference is the type of neural network type (functional versus structural network). The changes in SD might occur earlier in a functional network than in a structural network [46] or the brain atrophy might be more severe in a gray-matter network than in a white-mater network [47]. Therefore, the functional gray-matter network reported by Agosta et al. [20] presented more alterations than the structural white-matter network presented in our study. Other possible reasons include differences in the number of patients (13 versus 19) or brain lesion types (patients with predominant atrophy only in the left hemisphere versus those with predominant atrophy in the left and right hemispheres).
The semantic deficit-relevant modules in the SD network
We found that the anatomical network in SD could be divided into four independent modules. The modular patterns were quite similar in the SD and control groups, although there was reduced gray-matter atrophy in all the modules and significant white-matter changes in the left and right temporal/occipital modules of the SD patients. Moreover, the abnormalities in three modules (i.e., the left temporal/occipital/parietal module, the left frontal module, the right frontal/parietal module) were correlated with the semantic impairments in the SD patients. We speculate that the left temporal/occipital/parietal and frontal modules might be dedicated to the following critical components of semantic cognition: semantic representation and control, respectively [48–50]. However, the right frontal/parietal module might be crucial for general executive control.
Comparisons between the SD and control groups
The modular patterns in the SD patients and controls were highly similar, suggesting that the brain atrophy in the SD patients did not affect the whole structural connectivity pattern. However, all modules showed significant changes in the gray-matter volumes, indicating that the nodes were damaged. In contrast, the white-matter changes only occurred in the left and right temporal/occipital modules, suggesting relatively circumscribed damage in the white matter.
The left temporal/occipital/parietal module
This module consists of multiple gray-matter regions and white-matter tracts in the left temporal, occipital and parietal lobes (Fig. 3). We found a significantly positive correlation between its mean FA, AD, RD, and MD values and the semantic deficit severity in the SD group, indicating that the damage in this module could lead to the deterioration of semantic processing in the patients.
Semantic cognition is underpinned by two following main components: semantic representation and control. Semantic representation integrates information from various sensorimotor modalities and forms semantic knowledge. This process is thought to be reliant on the ATL (a node within the module) [3]. Previous studies have found that the ATL has considerable structural and functional connections with other modality-specific and semantic-related areas [51, 52]. A dysfunction of this region results in disorders involving semantic tasks [53, 54] and shows strong effects on familiarity, item consistency, and task correlations in SD patients [55]. Using a computational model, Rogers and colleagues [4] confirmed the vital role of the ATL in semantic representation and successfully predicted the symptom pattern in SD. Moreover, Whitney and colleagues [56] found that the ATL was activated in tasks involving the retrieval of word meaning after controlling for executive demands. Some studies also suggest that conceptual object properties are represented in the ATL [57, 58]. The module also includes other semantic-relevant regions or tracts. For instance, the fusiform gyrus is related to the semantic deficits in SD [8, 25]. The inferior fronto-occipital fasciculus connecting the frontal and occipital lobes is also relevant to semantic processing in both the patient and control cohorts [29, 60]. Altogether, we speculate that the left ventral module plays a significant role in semantic representation, and its dysfunction results in a semantic processing inability.
Notably, the gray-matter volume in the module can also account for the variance in the semantic deterioration in SD, indicating that the white- and gray- matter in this module may both play an important role in semantic processing.
The left frontal module
Most of the nodes in the module were located in the left frontal lobe, and the other nodes were located in the right medial frontal lobe. Unexpectedly, what we observed was a robust negative correlation between the mean FA values in this module and the semantic scores of the SD subjects. This result likely occurred because, as a semantic control module, the left dorsal module plays a compensatory role in semantic representational deficits of SD. A compensatory mechanism is characterized by a greater response or a higher connectivity of potential cortical regions in a disease state relative to that in a healthy condition [61].
Semantic control is a part of semantic processing that engages in the monitoring, selection, and inhibition of semantic knowledge regardless of the modality of the input [48, 50]. Jefferies [48] identified the brain regions specific to semantic control, including the left inferior frontal gyrus, angular gyrus, and posterior middle temporal lobes. The left inferior frontal gyrus was included in the module. This region was activated in semantic tasks with strong selection demands [62]. A temporary dysfunction in this region only disrupted semantic tasks with high-control demands [63]. Patients with damage to this area were sensitive to the task difficulty but not to the familiarity or item consistency [55]. Other regions in this module have also been reported to execute a control function in semantic tasks (which may not be specific to semantic control). For instance, the dorsolateral prefrontal cortex is involved in highly difficult semantic tasks [64]. Binder et al. [65] speculated that the medial ventral and dorsal frontal areas were involved in emotional semantic processing and specific control, respectively. These two regions are also a part of the default mode network [66], which has been thought to engage in semantic processing [67]. In addition, the bilateral anterior cingulate cortices are also postulated as regions involved in semantic control [68, 69]. Overall, we propose that this module compensates for the deficits in semantic representation by increasing the control level. This hypothesis is consistent with the findings that there is hyperconnectivity in the prefrontal network of SD subjects [23] and an increased prefrontal activity for executive control tasks has been found in AD patients [70].
The right frontal/parietal module
This module includes most of the right frontal and parietal regions. Its RD values were positively correlated with the severity of the semantic impairments in SD. However, this correlation became insignificant when the total gray-matter volume was excluded. In addition, its RD values were also correlated with the scores of shape trail test. This finding suggests that this module contributes to general cognitive processing.
Limitations
This study has some caveats as follows: (1) We only inspected the general semantic processing ability in SD subjects, but the finer semantic processing abilities (e.g., different categories or modalities [71, 72]) were not investigated. (2) We recruited an unequal number of SD patients with left and right dominant atrophy. This uneven sample may have led us to miss the effect of right temporal modules in semantic processing, because the semantic system is thought to depend on both hemispheres [50]. (3) The subject number was relatively low for the PCA analysis. (4) Some of our cognitive assessments were developed in house. (5) The influence of the fiber crossing on the white-matter integrity values (e.g., FA value) was not considered. (6) Our brain gray-matter template is not a good representation of functional regions. (7) Because the atrophy of patients did not affect all regions in the modules, the effect of the modules might be associative with only part of the modules.
Conclusion
After constructing the whole-brain neuroanatomical network of SD, we observed that the network had a decreased global efficiency. The network was separated into the following distinct modules: left temporal/occipital/parietal, frontal, right frontal/parietal and temporal/occipital modules. The first two modules were associated with the semantic deficits in SD. The third module might be crucial for general executive control. These findings can deepen our understanding of the structure of the SD neural network, which may have important clinical implications for the treatment of this disease.
Footnotes
ACKNOWLEDGMENTS
We are grateful to all research participants for their patience. This work was supported by the 973 Program (2014CB846100), the National Natural Science Foundation of China (81171019, 31271115), the Major Project of National Social Science Foundation (13&ZD188), and the Fundamental Research Funds for the Central Universities (2017XTCX04).