
Abstract
Several studies showed high serum copper levels in Alzheimer’s disease (AD). The present study applied a newly developed method to detect serum copper free from proteins (free-Cu). Forty-four patients affected by dementia due to AD, thirty-six patients affected by mild cognitive impairment (MCI) due to AD, and twenty-eight healthy controls underwent clinical, cognitive, and MRI assessment. The new method showed higher free-Cu concentrations in MCI and dementia due to AD compared to controls (p < 0.0001). No correlation between copper levels, cognitive or MRI measures were found.
Keywords
INTRODUCTION
Alzheimer’s disease (AD) is the most common form of dementia, accounting for about 60 to 70% of cases [1, 2]. It is generally claimed that AD results from the interaction between genetic susceptibility, biochemical alterations, and environmental factors [1, 3]. During the last decade, several studies showed an increase of the fraction of copper not bound to ceruloplasmin (non-Cp-Cu) in AD patients [4–9]. It is still debated whether higher serum copper levels represent a risk factor for AD or might mirror the disease progression from mild cognitive impairment (MCI) to severe AD dementia stages [10, 11]. Copper bound to ceruloplasmin represents the largest amount of the circulating metal pool. Copper ions, however, can also bind albumin and other proteins, and only a small fraction (0.5–5%) of serum copper is free and not linked to proteins. This fraction, defined as ultrafiltrable copper (free-Cu), [12] can easily cross the blood-brain barrier and, thus, might potentially contribute to AD pathogenesis [13].
In the present cross-sectional study, we measured free-Cu and total copper levels (tot-Cu) using atomic absorption spectrometry in AD patients at different stages (MCI and dementia) and in age-matched controls. Furthermore, we tested the possible correlation between tot-Cu and free-Cu levels and disease severity by using cognitive and brain atrophy measures.
MATERIALS AND METHODS
Participants
Ninety-five consecutive patients evaluated at the Alzheimer’s Disease Unit of the University Hospital “Spedali Civili di Brescia” entered the study.
Forty-four patients met criteria for dementia due to Alzheimer’s Disease (ADD) [14] according to National Institute on Aging – Alzheimer’s Association (NIA-AA, 2011) diagnostic core clinical criteria. Thirty-six patients met NIA-AA criteria for mild cognitive impairment due to Alzheimer’s disease (ADMCI) [15].
Exclusion criteria were: 1) the presence of non-Alzheimer form of dementia or cognitive impairment, 2) significant medical problems (i.e., hepatic or renal failure, chronic respiratory insufficiency) potentially responsible for encephalopathy, 3) bipolar disorder, schizophrenia, history of drug or alcohol abuse, 4) a concomitant or previous neurological disorder, and 5) age <55 years old. Thus, fifteen patients with a diagnosis of dementia with Lewy bodies (n = 3), vascular dementia (n = 9), and Parkinson’s disease dementia (n = 3) were excluded from the study.
All patients underwent the Mini-Mental State Examination (MMSE) [16]; the functional independence was assessed by interviewing their caregivers using Instrumental Activities of Daily Living (IADL) [17] and Basic Activities of Daily Living (BADL) [18].
Twenty-eight healthy age-matched controls (HC) were recruited from patients’ caregivers. Control subjects’ exclusion criteria were: 1) the presence of any form of dementia or cognitive impairment, 2) the presence of subjective memory impairment, 3) an acute concomitant somatic disease reducing cognitive abilities, 4) a concomitant or previous neurological disorder, 5) the reduction of functional independence, and 6) age <55 years old.
Lifetime diagnosis of coronary heart disease, arterial hypertension, diabetes mellitus type 2, dyslipidemia, and carotid artery disease were determined by interview.
The study was approved by the local ethic committee and written informed consent was obtained from both patients and their responsible caregivers or a legal representative.
Copper measurement
Seven milliliters of blood were collected from each subject; samples were centrifuged at 3,000 revolutions per minute for 10 min and serum was prepared for ultrafiltration by using Amicon® Ultra-4®, 100.000 NMWL (Millipore, Molsheim, France).
These conditions were obtained through a validation of the ultrafiltration method by performing several assessments with Amicon® Ultra-4®, using different cut-offs (30,000, 50,000, and 100.000 NMWL) and spin conditions. The albumin levels were measured on the ultrafiltrate with Bromocresol Green Albumin Assay (Bromocresol Green Albumin Assay Kit, Sigma Aldrich, St. Louis, Missouri, USA) in order to verify the free copper state.
No traces of albumin were present in the ultrafiltrate with Amicon® Ultra-4®, 100,000 NMWL, confirming that the copper measured was free.
Total and free copper measurements were performed by an atomic absorption spectrometry (AAS Spectra 400 Varian, Medical Systems, Inc. Palo Alto, CA) equipped with a longitudinal Zeeman-effect background correction system.
In order to measure the total copper serum levels, the solutions were diluted 1:40 with bi-distilled water for inorganic trace analysis. External calibration was used in serum between 500 μg/L and 2000 μg/L.
Instrumental limit of detection of the Cu total and free, calculated as three standard deviations of the background signal obtained on 10 white samples, were 50 μg/L and 1 μg/L, respectively. The coefficients of variation (CVs) of measurements of Cu solutions were 5.1% (Cu tot) and 3% (Cu free). The accuracy of the method was determined on the mean values obtained by certified reference materials (Environmental and Occupational, G-EQUAS for serum and supernatant, NIST 1643e-1643d trace elements in water for ultrafiltrate).
Brain magnetic resonance imaging
1.5 Tesla brain magnetic resonance imaging (MRI) was performed in ADMCI and ADD patients (in our or external centers) in order to exclude concomitant diseases and evaluate medial temporal lobe atrophy (MTLA) by visual rating. MTLA was rated according to the MTA Visual Rating Scale [19] on coronal T1-weighted images through the hippocampus at the level of the anterior pons and assessed the following features: 0 = no atrophy; 1 = only widening of choroid fissure; 2 = widening of choroid fissure and temporal horn of lateral ventricle; 3 = moderate loss of hippocampal volume (decrease in height); 4 = severe volume loss of hippocampus. Abnormal MTLA was defined as MTA-score≥3 in subjects≥75 years old, and MTA-score≥2 if <75 years old.
Statistical analysis
Continuous variables comparison between ADD, ADMCI, and HC, and between ADD and ADMCI patients were performed by using Kruskal-Wallis and Mann-Whitney tests, respectively. Dichotomous variables were compared by using the χ2 test. Statistics significance level was set at p < 0.05. Post-hoc differences were evaluated by Mann-Whitney test corrected for multiple comparisons by using the Bonferroni method (significance set by p < 0.02). Correlations between demographic and clinical variables and copper levels were assessed by using a general linear model and Spearman’s rho test.
Data analysis was performed using IBM SPSS software (IBM Corp. Released 2013. IBM SPSS Statistics for Windows, Version 22.0. Armonk, NY: IBM Corp).
RESULTS
Demographic and clinical characteristics of subjects according to the different groups are shown in Table 1. ADD, ADMCI, and HC did not differ in term of mean age, sex, educational level, or prevalence of vascular risk factors. ADD patients, compared with ADMCI and HC, showed lower MMSE scores (p < 0.0001) and more severe activity daily living impairment as measured by IADL/BADL (p < 0.0001). The rate of progression of the disease (progression index was measured as the ratio of MMSE score points lost and months of disease duration) was higher in ADD than in ADMCI (p < 0.0001).
Demographic, clinical and biochemical characteristics of sample according to groups
Values are mean±SD or percentage (n). aKruskal-Wallis test. bChi-square test. cMann-Whitney test. Significant differences between groups (p < 0.05) are bolded. *p < 0.02 compared to HC (Mann-Whitney test corrected for multiple comparisons by using the Bonferroni method). ADD, patients affected by dementia due to Alzheimer’s disease; ADMCI, patients affected by mild cognitive impairment due to Alzheimer’s disease; HC, healthy controls; MMSE, Mini-Mental State Examination Score; IADL, Instrumental Activities of Daily Living; BADL, Basic Activities of Daily Living. Progression index was measured as the ratio of MMSE score points lost and months of disease duration.
Copper serum levels in patients and controls
Free and total serum copper levels (Table 1) were significantly different between groups (p < 0.0001 and p < 0.02, respectively). Free-Cu concentrations (Fig. 1A) in ADD patients (36.3 μg/l±21.7) and in ADMCI patients (30.2 μg/l±15.2) were significantly higher than in healthy controls (19.1 μg/l±7.3; p < 0.0001 versus ADD, p = 0.001 versus ADMCI).

Free (A) and total (B) copper serum concentrations of sample according to groups. Box plots show means, interquartile ranges, minima and maxima. Copper serum concentrations are expressed in μg/l. Analysis of variance was performed by using Kruskal-Wallis test, followed by Mann-Whitney test corrected for multiple comparisons by using the Bonferroni method. ADD, patients affected by dementia due to Alzheimer’s disease; ADMCI, patients affected by mild cognitive impairment due to Alzheimer’s disease; HC, healthy controls.
Females showed higher total copper levels (1147.7 μg/l±200.4 in females versus 1060.2 μg/l±219.0 in males; p = 0.016) but there was not a statistically significant difference in free copper concentrations according to sex (30.1 μg/l±18.4 in females versus 29.5 μg/l±17.8 in males; p = 0.97).
Differences among groups were significant after controlling for age and sex (p = 0.002). Tot-Cu levels (Fig. 1B) were slightly higher in AD patients than in controls, but no statistically significant difference was detected after controlling for sex (p = 0.08). Total and free copper were significantly correlated to each other (p < 0.0001) (Fig. 2).
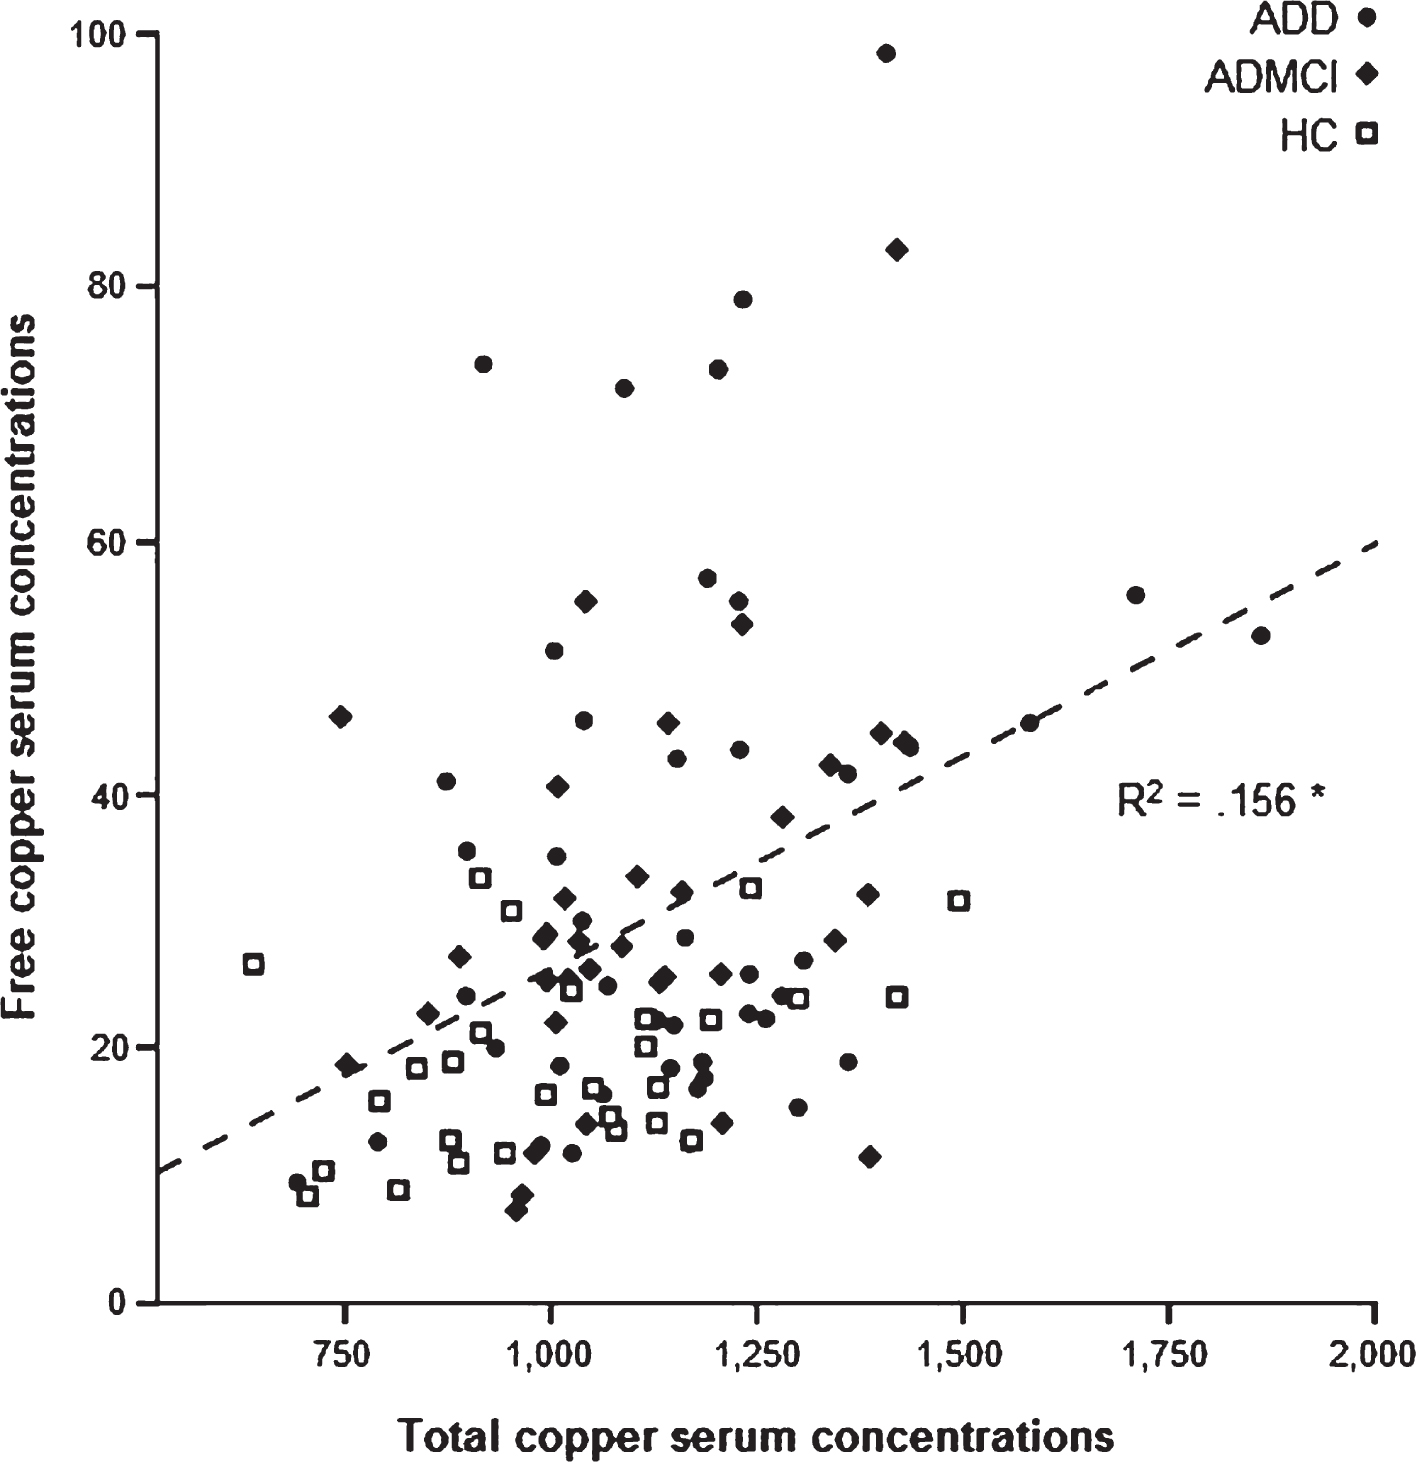
Correlation between free and total copper serum concentrations of sample. Copper serum concentrations are expressed in μg/l. *Spearman correlation coefficient = 0.396; p < 0.0001 (two-tailed). ADD, patients affected by dementia due to Alzheimer’s disease; ADMCI, patients affected by mild cognitive impairment due to Alzheimer’s disease; HC, healthy controls.
In ADD and ADMCI patients, no correlation between MMSE score levels or disease duration and total or free copper levels were found. The progression index did not correlate with copper concentrations.
Copper levels and MRI finding in AD patients
Abnormal medial temporal lobe atrophy was detected in 27 ADD patients (61.4%) and in 18 ADMCI patients (50.0%), with mean visual rating score of 2.2±1.1 points and 1.7±1.0 points, respectively. MTLA rating positively correlated with disease duration (p < 0.0001) and was negatively related to MMSE scores (p = 0.002).
Copper concentrations were not different between patients with normal MTLA and patients with medial temporal atrophy. No correlation between MTLA visual rating measures and copper levels was found after controlling for age, disease duration and MMSE scores.
DISCUSSION
Several studies reported increased levels of copper not linked to ceruloplasmin in AD patients [4, 22].
The present study, by showing both higher total and free copper levels in AD patients, confirmed these data. In particular, the differences from controls were statistically significant only for free copper levels after adjusting for sex. Free copper levels are usually calculated subtracting the portion linked to ceruplasmin from total copper. Nevertheless, this calculation included copper bound to albumin and other circulating proteins. This study measured a “free fraction” of copper after exclusion of all Cu-bound proteins by using a new ultrafiltration method. This “true free” quote of circulating copper represents only 0.5–5% of total copper. Given its low molecular weight, however, this portion of copper might play a role in AD pathogenesis. Indeed, it has been suggested that copper ions appear to modulate Aβ generation [23, 24], aggregation and stabilization of the fibrillary form [25–29]. By promoting reactive oxygen species or by neuroinflammation processes it can also induce aggregation and phosphorylation of tau [30, 31].
In contrast with previous reports [32–34], no correlation was found between copper levels and either MMSE score or medial temporal atrophy. This might depend on the different detection method used. In fact, even if not significant, free-CU was higher in demented patients compared with ADMCI patients, thus partially supporting the claim that copper levels mirror the duration and the progression of the brain disease.
Furthermore, we observed that AD patients as well as ADMCI patients had high variable free copper levels, ranging from normal range up to 4-5 times the levels of healthy controls. This is in line with the assumption that only a subgroup of AD patients presents with higher serum free copper levels [35]. Copper thus might represent a risk factor for AD, still not necessary for its development [4, 7].
The increased copper levels consistently found in females [20, 21] (confirmed by our findings) might indicate estrogens as possible important modulator.
Longitudinal studies including hormone assessment, biofluid and imaging markers are needed in order to clarify the effect of copper on disease progression and tau/amyloid pathologies [36, 37].