
Abstract
ADAM10 is the α-secretase that cleaves amyloid-β protein precursor in the non-amyloidogenic pathway in Alzheimer’s disease (AD) and is known to be regulated by different microRNAs (miRNAs), which are post-transcriptional regulators related to several biological and pathological processes, including AD. Here we proposed to explore and validate miRNAs that have direct or indirect relations to the AD pathophysiology and ADAM10 gene. Approximately 700 miRNAs were analyzed and 21 differentially expressed miRNAs were validated in a sample of 21 AD subjects and 17 cognitively healthy matched controls. SH-SY5Y cells were transfected with miR-144-5p, miR-221, and miR-374 mimics and inhibitors, and ADAM10 protein levels were evaluated. miR-144-5p, miR-221, and miR-374 were downregulated in AD. The overexpression of miR-221 in SH-SY5Y cells resulted in ADAM10 reduction and its inhibition in ADAM10 increased. These findings show that miR-221 can be a new potential therapeutic target for increasing ADAM10 levels in AD. In addition, these results can contribute to the better understanding of ADAM10 post-transcriptional regulation.
INTRODUCTION
The amyloid cascade hypothesis presumes that Alzheimer’s disease (AD) is caused by the age-dependent and progressive accumulation and deposition of extracellular amyloid-β (Aβ) peptides in the brain [1]. In healthy subjects, the predominant route of amyloid-β protein precursor (AβPP) processing consists of successive cleavages by the α-secretase ADAM10 (A Disintegrin and Metalloprotease 10) and γ-secretase. In the non-amyloidogenic pathway, AβPP is cleaved by ADAM10 in the middle of the Aβ region, thus releasing sAPPα [2, 3], a structure with neurotrophic and neuroprotective functions, and retaining the C83 residue in the membrane. The following cleavage of C83 by γ-secretase releases the p3— which is supposed to be beneficial, is not found in amyloid plaques, and starts at position Aβ17 (Aβ17 - 40 and Aβ17 - 42)— thereby inhibiting amyloidogenic Aβ production [4].
microRNAs (miRNAs) are small non-coding RNA fragments (about 23 nucleotides) that regulate gene expression by binding to complementary regions of specific transcripts in order to repress translation or destabilize their respective mRNAs [5]. Various studies address the deregulation of miRNAs in a variety of human diseases, as well as in neurodegenerative processes [6, 7], and new approaches have been suggested in order to target these miRNAs in vivo as a novel therapeutic strategy against AD [8].
In previous studies, researchers, including ourselves, have described a marked reduction in platelet ADAM10 levels in AD subjects compared to cognitive healthy controls [9–12] and increased levels of this protein in platelets along cognitively healthy aging [13]. These alterations were also observed for AβPP, BACE1, and ADAM10 in platelets of AD patients already in the very early stages of the disease[14]. Additionally, no significant differences were observed for ADAM10 gene expression in total blood or platelets of AD or mild cognitive impairment (MCI) patients compared to control subjects, even with the advance of the disease [15]. The data show that reduced levels of mRNA for ADAM10 are not the cause of the decrease in the protein level of this protein in platelets of people with AD. Therefore, we hypothesized that a different mechanism, other than gene expression regulation, could be involved in such alteration. This mechanism could be related to the specific regulation of ADAM10 levels by miRNAs. In order to investigate this hypothesis, in the current study we aimed to explore and validate miRNAs that are directly or indirectly related to the pathophysiology of AD and ADAM10 regulation. We evaluated the differential expression of about 700 miRNAs by RT-qPCR in total blood obtained from AD and control subjects. After validation, we investigated the potential role of the differentially expressed miRNAs to regulate ADAM10 expression by transfecting neuroblastoma SH-SY5Y cells with their respective inhibitors or mimics. Results of this work can contribute to the better understanding of ADAM10 post-transcriptional regulation.
MATERIALS AND METHODS
Characteristics of the subjects
The cohort sample for screening was formed by n = 4 AD and n = 4 control subjects, and for validation the cohort sample was formed by n = 21 AD and n = 17 controls. This work was approved by the Brazilian ethics committee (CAAE: 02760312.0.0000.5504/ N°: 112.543). Patients were recruited in reference (Public Center of Specialties) and counter-reference (Family Health Centers) health services in São Carlos City, São Paulo, Brazil. All subjects recruited were diagnosed with probable AD according to the National Institute of NeurologicalDisorders and Stroke-Alzheimer’s Disease and Related Disorders Association (NINCDS-ADRDA) criteria. All participants underwent exclusion criteria for head trauma, metabolic dysfunctions, hematological diseases, alcohol abuse, drug abuse, delirium, mood disorders and treatment with medications affecting platelet functions, i.e., anticoagulants, antiplatelet drugs, serotoninergic agonists-antagonists, and corticosteroids. All subjects included had a standardized clinical workup based on neurological examinations, laboratory blood, urine analysis, a neuroimaging study (Head Computed Tomography and/or Magnetic Resonance Imaging), and a neuropsychological assessment, including a Mini-Mental State Examination (MMSE) and Clinical Dementia Rating (CDR). In this study, we used a Brazilian version of MMSE [16], since it introduces cutoffs according to scholarity, which is an important difference from Brazilian subjects, when compared to other populations. Before enrolment, subjects or their legal caregivers filled out an informed consent, after the nature and possible consequences of the study were explained.
Isolation of RNA from total blood
The personnel responsible for blood preparation, as well as subsequent analysis, were blind for diagnosis and statistics. For the isolation of total RNA, 2.5 ml of blood was collected in total RNA extraction tubes (PAXgene Blood RNA – Becton & Dickinson, Franklin Lakes, NJ), according to the product’s manual. After collection, tubes were inverted 10 times and kept at 4°C during storage and transportation with a maximum time of 30–40 min until the first centrifugation step. PAXgene tubes were kept for 2 h at room temperature in an upright position according to the manufacturer’s instructions and were subsequently frozen at –80°C until use. Total RNA isolation from blood samples was performed using the PAXgene Blood RNA isolation kit (Qiagen, Valencia, CA) according to the manufacture’s manual. From the extracted total RNA, samples (1 μl) were quantified with a Nanodrop (Thermo Fisher Scientific, Waltham, MA) to obtain absorbance values and their ratios (A260/A280 and A260/A230).
Reverse transcription and RT-qPCR blood screening
cDNAs were prepared from 450 ng of total RNA by using the Taqman® MicroRNA Reverse Transcription Kit (Applied Biosystems, Waltham, MA) and specific stem-loop primers for miRNAs (MegaplexTM - Applied Biosystems, Waltham, MA). Gene expression levels of different miRNAs were determined by reverse transcription quantitative real time PCR (RT-qPCR) analyses by 7900HT Fast Real-Time PCR System equipment (Applied Biosystems, Waltham, MA) using the TaqMan® Human MicroRNA Array Cards - Pool A v2.1 and B v3.0 (Life Technologies, Foster City, CA). Pool A and Pool B, containing 377 and 290 miRNAs, respectively, are a pair of plates for RT-qPCR that provide primers and probes for assessing the expression levels of 667 different miRNAs. Each array contains four control assays - three carefully selected candidate endogenous control assays and one negative control assay (RNU44-001094, RNU48-001006, U6 snRNA-001973, ath-miR159a-000338), respectively. In this first screening, 16 plates were prepared (Pool A and Pool B for each patient, n = 4 subjects for AD and n = 4 for control group). This analysis enabled us to select differentially expressed miRNAs between the two experimental groups. The results of the RT-qPCR-array were analyzed using the DataAssist v3.01 software (Thermo Fisher Scientific, Waltham, MA) and the calculations were carried out using the average Cts of the three endogenous controls. The most stable endogenous control, determined by DataAssist v3.01 software, was has-miR-U6. Data were analyzed using the following parameters: Ct 35 maximum; inclusion of maximum Cts; exclusion of outliers among replicates; p value adjustment using the Benjamini-Hochberg test (False Discovery Rate - FDR); standardization method from the endogenous U6 control; and using the control group as a calibrator.
miRNAs Databases
The miRNAs with higher fold change from the MegaplexTM Kits were intersected with MirWalk 2.0 (http://zmf.umm.uni-heidelberg.de/apps/zmf/mirwalk2/). This is a database that not only documents miRNA binding sites within the complete sequence of a gene, but also combines this information with a comparison of binding sites resulting from 12 existing miRNA-target prediction programs (DIANA-microTv4.0, DIANA-microT-CDS, miRanda-rel2010, mirBridge, miRDB4.0, miRmap, miRNAMap, doRiNA i.e., PicTar2, PITA, RNA22v2, RNAhybrid2.1, and Targetscan6.2).
For the multiple analyses of target genes and miRNA pathways, the software DIANA microv4.0 from DIANA LAB site was used (http://diana.imis.athena-innovation.gr/DianaTools/index.php). Thealignment of ADAM10 gene/miRNAs was performed in microRNA organization website (http://www.microrna.org/microrna/home.do) and in miRmap site (http://mirmap.ezlab.org/app/), the alignment ΔG binding and ΔG total.
Validation of miRNAs screened by RT-qPCR
Cohort sample for validation was formed by n = 21 AD subjects and n = 17 healthy controls. cDNAs were prepared from 10 ng of total RNA using TaqMan® MicroRNA Reverse Transcription Kit and Taqman® Universal PCR Master Mix No AmpErase® UNG (Applied Biosystems, Waltham, MA). The miRNAs gene expression levels were determined through analysis by RT-qPCR in StepOne Plus (Applied Biosystems, Waltham, MA) using Taqman® MicroRNA Assays (Life Technologies, Foster City, CA) for miRNAs targets and endogenous control (has-miR-U6). Reactions were performed in 96 well plates (MicroAmp Optical 96-well Fast and MicroAmp Optical Adhesive Film, Applied Biosystems, Waltham, MA) in duplicate. Non-template controls were included for each primer reaction. The RT-qPCR conditions were as follows: 7.0 μl autoclaved DEPC water, 10.0 μl MasterMix [2x], 1.0 μl Primer Assay Mix [20x], and 2.0 μl cDNA. The RT-qPCR reactions used were standardized with a final volume of 20 μl. Cycling conditions were: Hold 50°C, 2 min; Hold 95°C, 10 min; Cycling (40 repeats) –Step 1:95°C, 15 s and Step 2: Tm 60°C, 1 min. MiRNAs were analyzed considering thresholds 0.2 for all analyses. The internal calibrator used as a basis to standardize the results of expression was the control group ΔCts average. Calibration was determined by ΔΔCt=ΔCt (sample) - ΔCt (calibrator). The gene expression was assessed by relative quantification, using the formula 2-ΔΔCt [17].
Cell culture and transient transfection
Human neuroblastoma SH-SY5Y cells were cultured in DMEM (Life Technologies, Foster City, CA) supplemented with 10% fetal bovine serum (Life Technologies, Foster City, CA) and 100U/ml of penicillin at 37°C and 5% CO2. SH-SY5Y cells were transiently transfected using Lipofectamine® RNAiMAX (Life Tech) according to the manufacturer’s instructions. MirVana™ miRNA mimics, inhibitors, and the corresponding negative controlswere obtained from ThermoFisher. MirVana™ miRNA Mimic Negative Control (cod.4464058) is a random sequence miRNA mimic molecule that has been extensively tested in human cell lines and tissues and validated not to produce identifiable effects on known miRNA function. ADAM10 expression from negative control-transfected samples was used as a baseline for evaluation of the effect of miRNA mimic on ADAM10 expression.
RT-qPCR for ADAM10 in SH-SY5Y cells
After transfection with the specific miRNAs mimics or inhibitors, total RNA was extracted from SH-SY5Y cells with TRIzol (Sigma, St. Louis, MO), using the Direct-zol™ RNA MiniPrep (Zymo Research, Irvine, CA). RNA was quantitated by RT-qPCR using iScriptTM One Step for Probes (Bio-Rad, Hercules, CA) and iTaq Universal SYBR Green One-Step Kit for qPCR (Bio-Rad, Hercules, CA), following the manufacturer’s instructions. The RT-qPCR protocol was set up with 40 cycles of amplifications, each consisting of a denaturation step at 95°C for 15 s and an annealing/extension step at 60°C for 60 s. Human ADAM10 mRNA levels were evaluated by using specific primers (Forward: CTCTCACATTACTTTTGCTCACG, Reverse: TTGTCCCCAGATGTTGCTC) and normalized on RPLP0 mRNA levels (Forward: CCACGCTGCTGAACATGC, Reverse: TCGAACACCTGCTGGATGAC). The oligonucleotides used for RT-qPCR were obtained from Eurofins MWG Operon (Ebersberg, Germany).
Protein extraction and western blot analysis
Cells were lysed in an ice-cold lysis buffer containing protease inhibitors and phosphatase inhibitors (0.32 M sucrose, 1 mM HEPES, 0.1 mM PMSF, 1 mM MgCl2), and resuspended using a glass-Teflon homogenizer (VWR). Protein samples were separated by 7% SDS-PAGE and electroblotted onto nitrocellulose membranes (Bio-Rad, Hercules, CA). The membranes were blocked with I-Block™ (Thermo Fisher Scientific, Waltham, MA) for 1 h at room temperature and incubated overnight at 4°C with anti-ADAM10 antibody (1:1000, Proscience, Woburn, MA) and anti-actin antibody (1:10000, Sigma, St. Louis, MO). Then, membranes were incubated for 1 h at room temperature with horseradish peroxidase-conjugated secondary antibodies. Western blot immunoreactivity was detected using Bio-Rad Clarity™ (Bio-Rad, Hercules, CA).
Data analysis and statistical evaluation
Statistical tests for comparison (Mann-Whitney U-test and Kruskal-Wallis - Dunn’s Multiple Comparison Test) were performed. Sensitivity and specificity were calculated using the receiver operating characteristic (ROC) curves for miRNAs diagnostic analyses. To compare the miRNAs ROC curves, a method that evaluates the areas under the curves (AUCs) was adopted. The cutoff with the highest Younden index (sensitivity plus specificity -1) was chosen [18]. Data were analyzed and the figures or tables were made using Graphpad Prism 5.01 (GraphPad Software Inc, La Jolla, CA) and Medcalc 14.8.1 (MedCalc Software, Ostend, Belgium) softwares. Results with a probability of error below 5% were considered significant. Regarding outlier samples, the IQR (interquartile range) method was applied and no statistically significant difference was observed for data analysis.
Acquisition and quantification of western blotting was performed by means of computer-assisted imaging (ChemiDoc system and Image lab 4.0 software; Bio-Rad, Hercules, CA). ADAM10 optical density (OD) [sum of the OD of the band at 60 kDa (mature form) and the band at 80 kDa (immature form)] was normalized on actin OD. The data from all quantifications were analyzed using Graph Pad Prism software, and the levels and values were expressed as mean±standard error of the mean (SEM). Statistical evaluations were performed using the Student t test.
RESULTS
Identification of differentially expressed miRNAs in AD and healthy controls
To identify miRNAs that are directly or indirectly related to the pathophysiology of AD and ADAM10 regulation, we analyzed about 700 miRNAs by RT-qPCR in total blood obtained from AD and control subjects (n = 4 each). The cohort sample for validation was formed by n = 21 AD subjects and n = 17 healthy controls. The demographic and clinical data of these subjects are presented in Table 1. Subjects with AD and their matched cognitively healthy controls were mostly female, 60 years or older. The most frequent disease observed among all subjects was hypertension. Age and gender did not differ significantly between groups (Table 1).
Subjects’ demographic and clinical variables according to CDR
AD, Alzheimer’s disease; CDR, Clinical Dementia Rating; MMSE, Mini-Mental State Examination; SD, Standard Deviation; Mann-Whitney U-test and Test ANOVA One Way (Kruskal-Wallis test). *p < 0.001. Control ¬= AD; Control ¬= CDR1; Control ¬= CDR2; Control ¬= CDR3; p < 0.05 CDR1 ¬= CDR2; CDR1 ¬= CDR3; CDR2 ¬= CDR3. GraphPad Prism 5.01.
Regarding CDR levels, 52% of the elderly had CDR = 1; 29% were classified as CDR = 2; and 19%, CDR = 3. As expected, MMSE scores were significantly different between patients with AD and controls (p≤0.001), and also throughout the progression of the disease (p < 0.05). Considering the MMSE score, the average (±SD) was 27±7 (control) and 14±8 (AD) (Table 1, Fig. 1).
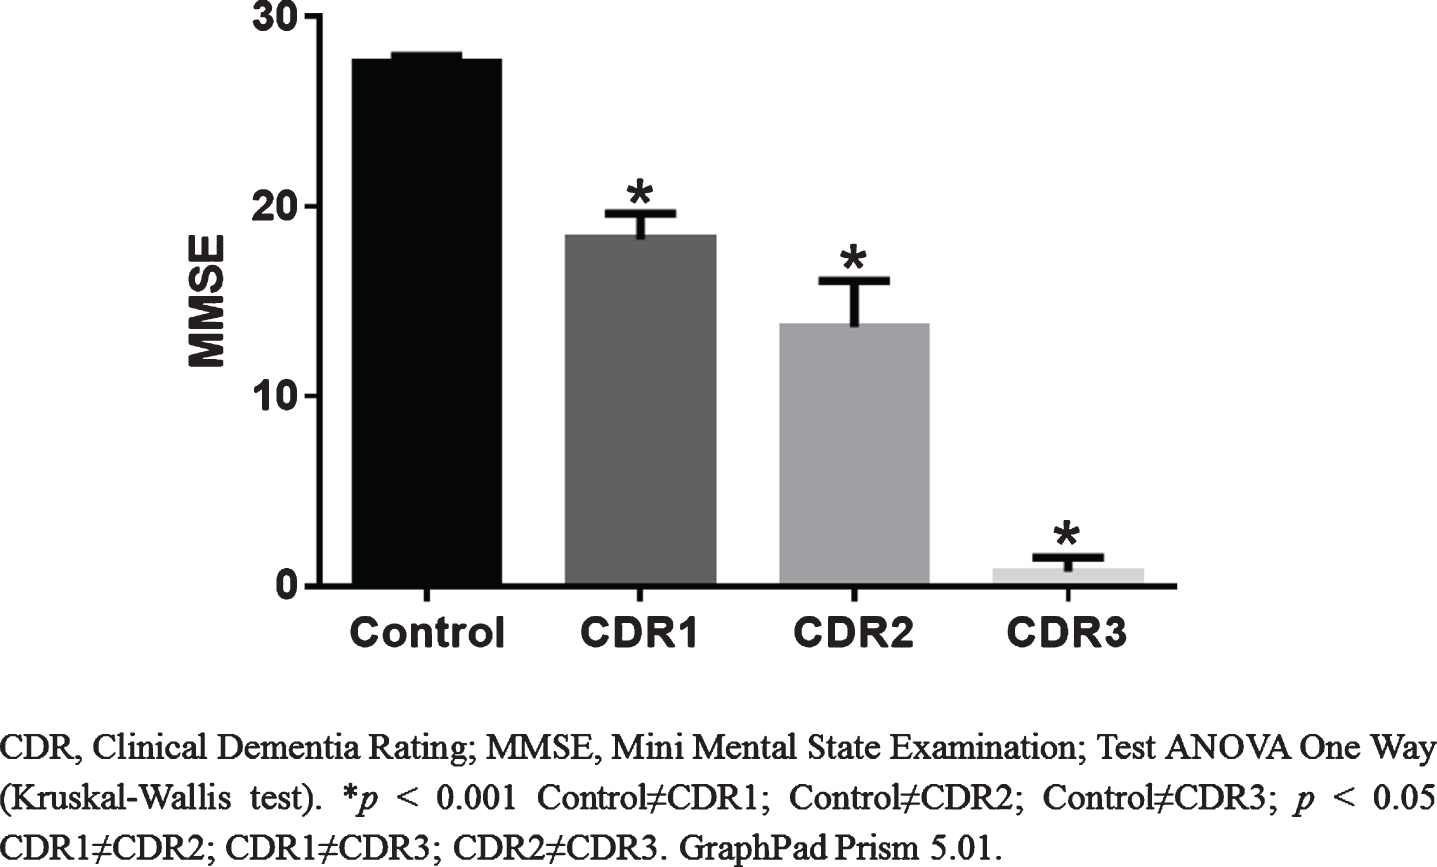
MMSE scores according to CDR.
Validation of differentially expressed miRNAs in AD and healthy controls
Figure 2 shows the heat map reflecting miRNA expression in the AD and control groups, which were subsequently selected for validation in a larger scale sample (AD and controls). The intersection of the results obtained from the MegaplexTM Kits with MirWalk 2.0 database was performed.

Heat Map of miRNAs with greater differentiation between AD and control groups. Data Assist v.3.01.
Among the approximately 700 miRNAs analyzed, 19 miRNAs that had the highest fold changes (3.49–1.70) in the AD group compared to the control, and those which had direct or indirect relations with the AD pathophysiology or with the ADAM10 protein and AD were selected for validation in a larger sample (Fig. 2). In addition, miR-103 and miR-107 were evaluated, which were described in the literature as having important roles in ADAM10 protein expression [19].
The analysis of the pathways regulated by these miRNAs, according to the DIANA LAB site (http://diana.imis.athena-innovation.gr/DianaTools/index.php?r=microT_CDS/index) in DIANA micro v4.0 (Beta version) multiple microRNA analysis, demonstrated that miR-144-5p, miR-221 and miR-374 together are responsible for the regulation of 1.619 genes in 355 different pathways. Moreover, the analysis showed the intersection for 22 genes and four pathways (Supplementary Table 1). Descriptive data for each miRNA expression between the AD and control groups is shown in Supplementary Table 2.
Figure 3 shows the expression of validated miRNAs (miR-144-5p, miR-374, miR-221, miR-18a, miR-27b, miR-185, miR-107, miR-103; miR-19b,miR-320B, miR-363, miR-15b-3p, miR-127, miR-194, miR-128a, miR-30a-5p, mmu-miR-451, miR-589, miR-181a-2-3p; miR-886-5p, miR-361-3p). Among the 21 miRNAs analyzed, only miR-144-5p, miR-221, and miR-374 presented statistically significant differences (p < 0.05) between groups, with a mean expression of 1.67±1.74, 1.87±1.85, 1.37±1.20; and 0.69±0.87, 0.78±1.05, 0.66±0.63 in control and AD groups, respectively (Fig. 3 and Supplementary Table 2). The alignment of ADAM10 gene/miRNAs 144, 221, and 374, according to the microRNA organization website demonstrates that all three miRNAs target ADAM10 (Supplementary Figure 1).
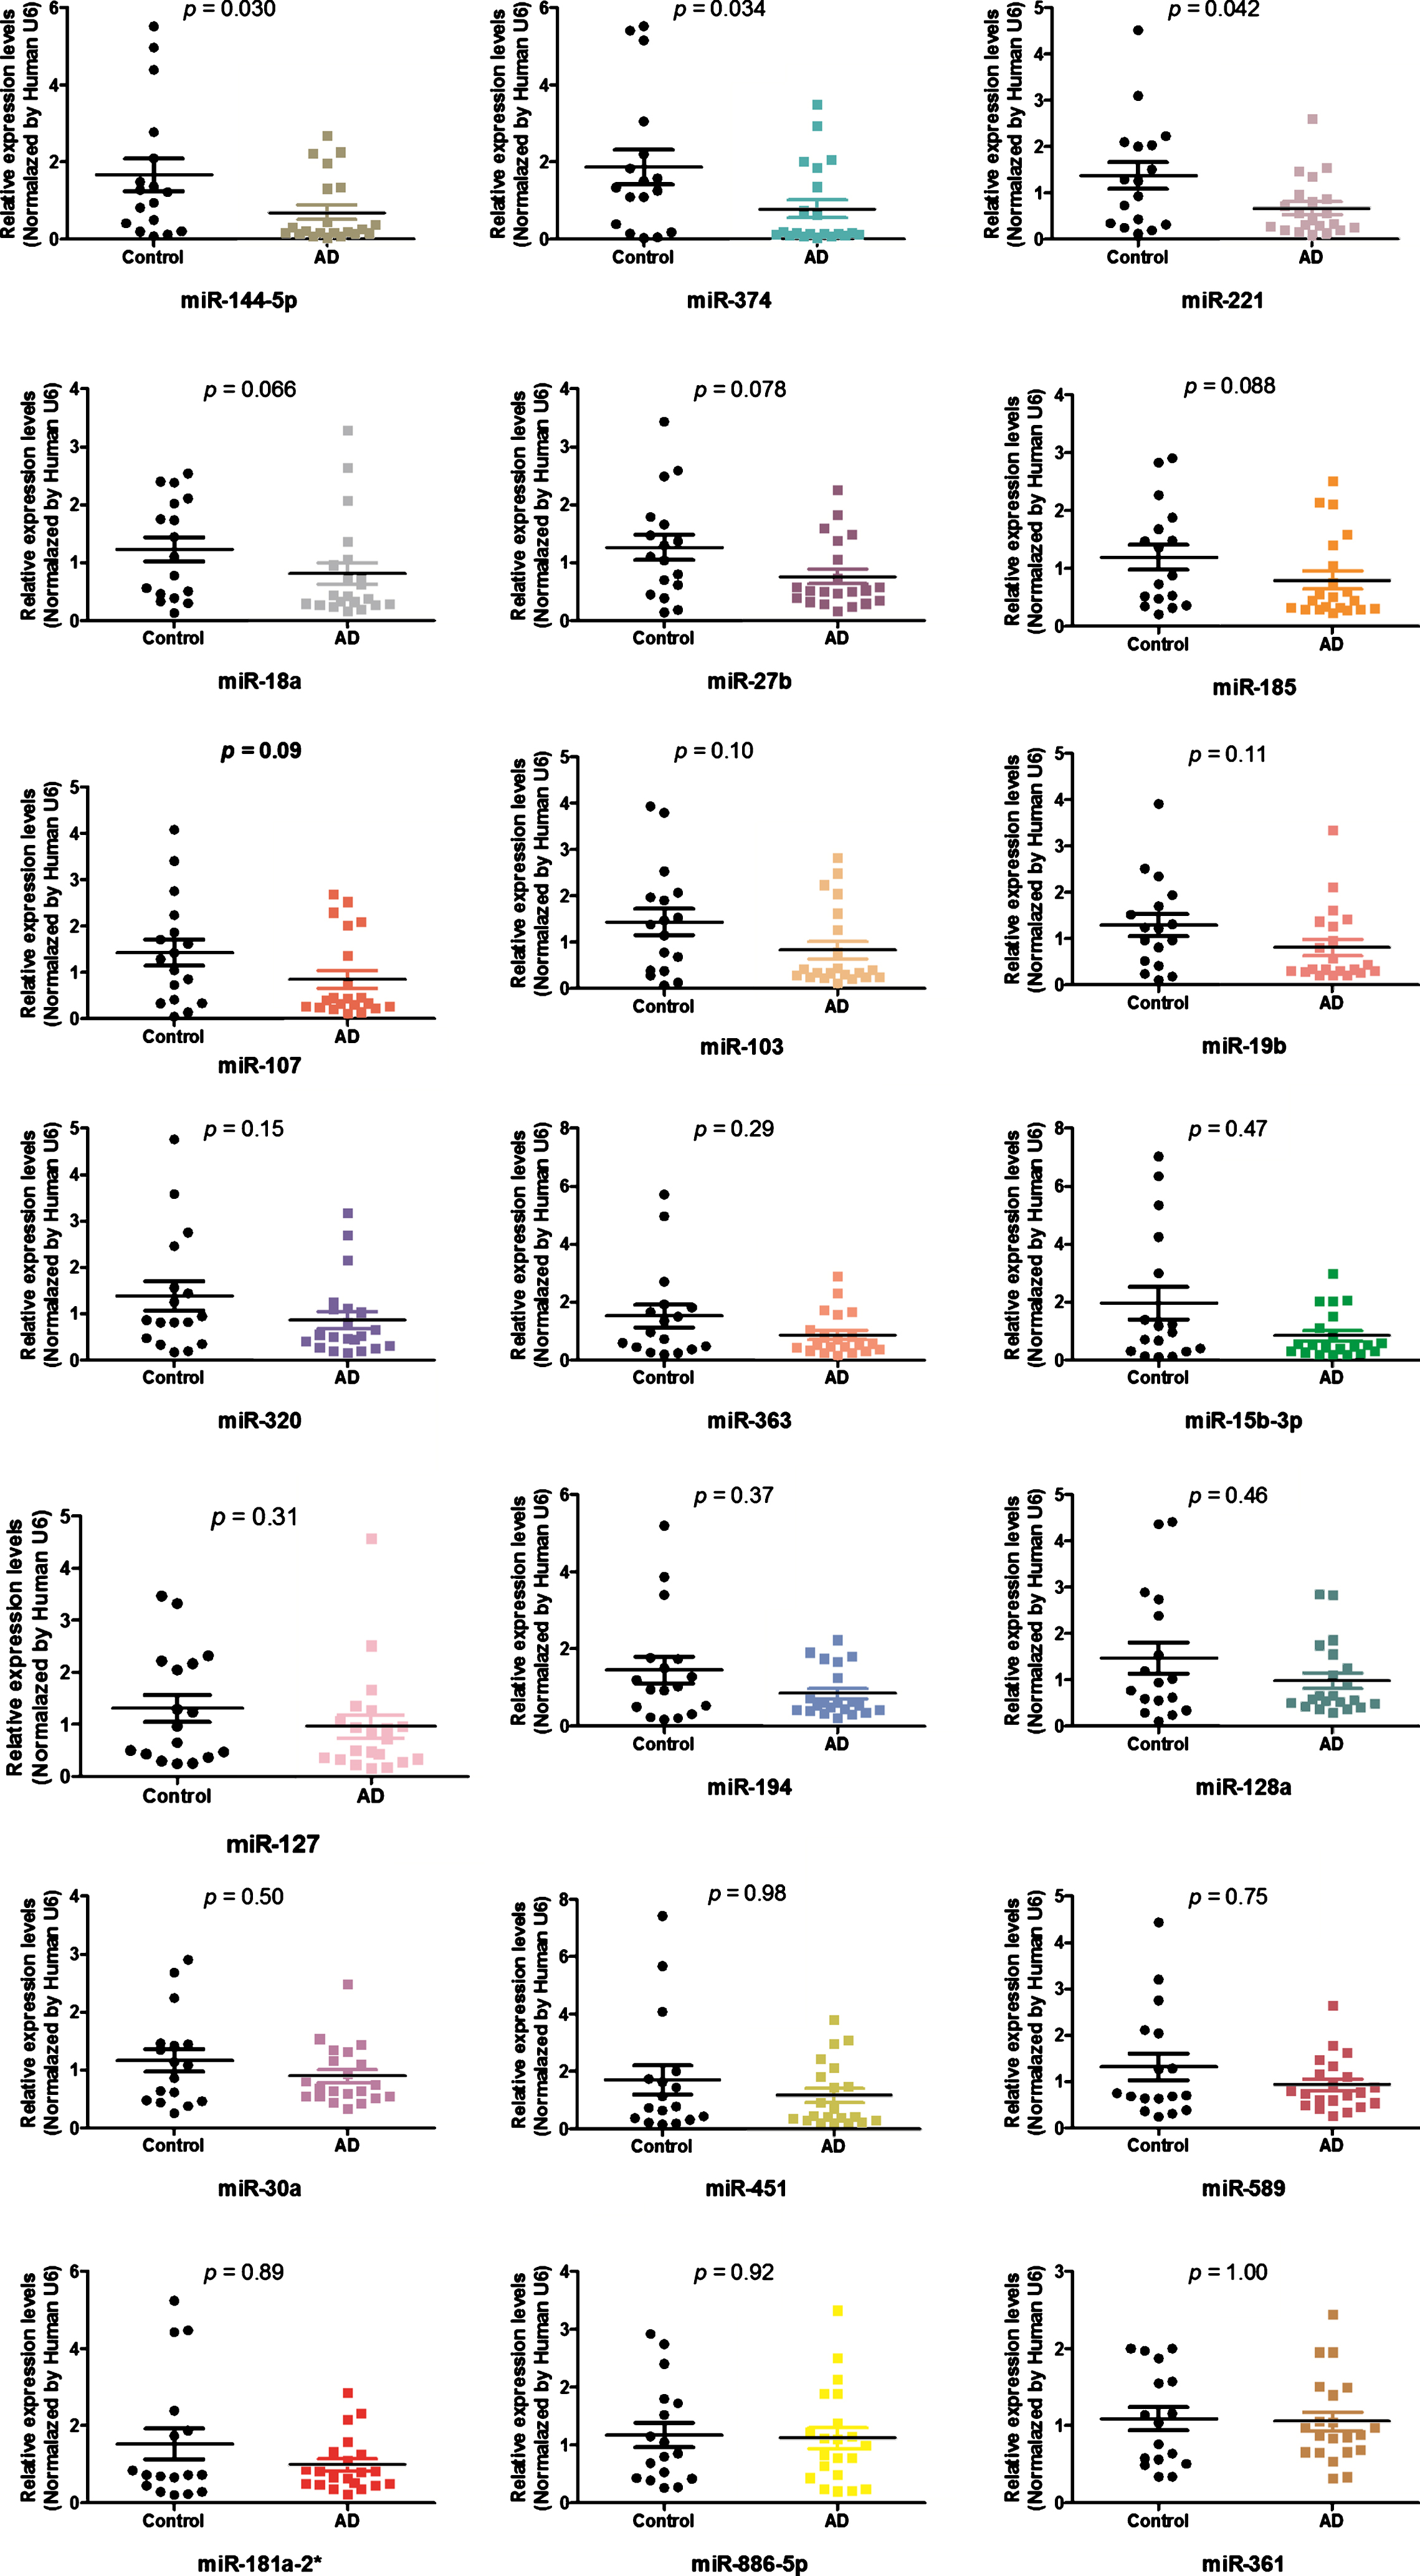
Differentially expressed miRNAs between control and DA groups. GraphPad Prism 5.01.
Supplementary Table 3 and Supplementary Figure 2 present AUC values and ROC curves, respectively, considering the Youden index with sensitivity and specificity for all validated miRNAs. Regarding the AUC values, miR-144-5p, miR-221 and miR-374 presented moderate values of sensitivity and specificity with a significant p-value. The best AUC value between miRNAs individually analyzed was obtained for miR-144-5p (0.70, 95% CI 0.5390 to 0.8755) at a cutoff≤0.36, which presented a sensitivity of 66.7 and specificity of 76.5 (p = 0.017) for AD detection.
Data showed that the association between the selected miRNAs presented AUC variation from 0.68 to 0.72, sensitivity from 61.9 to 80.95 and specificity from 58.8 to 88.24. However, the best values were observed for miR-144-5p+miR-374 associations (0.71, 95% CI 0.535–0.888, p = 0.01) at a cutoff≤0.43, with 61.9 of sensitivity and 88.2 of specificity and miR-144-5p+miR-374+miR-221 (0.72, 95% CI 0.543–0.892, p = 0.01) at a cutoff≤1.18 with 61.9 of sensitivity and 82.35 of specificity (Supplementary Table 4 and Fig. 4).
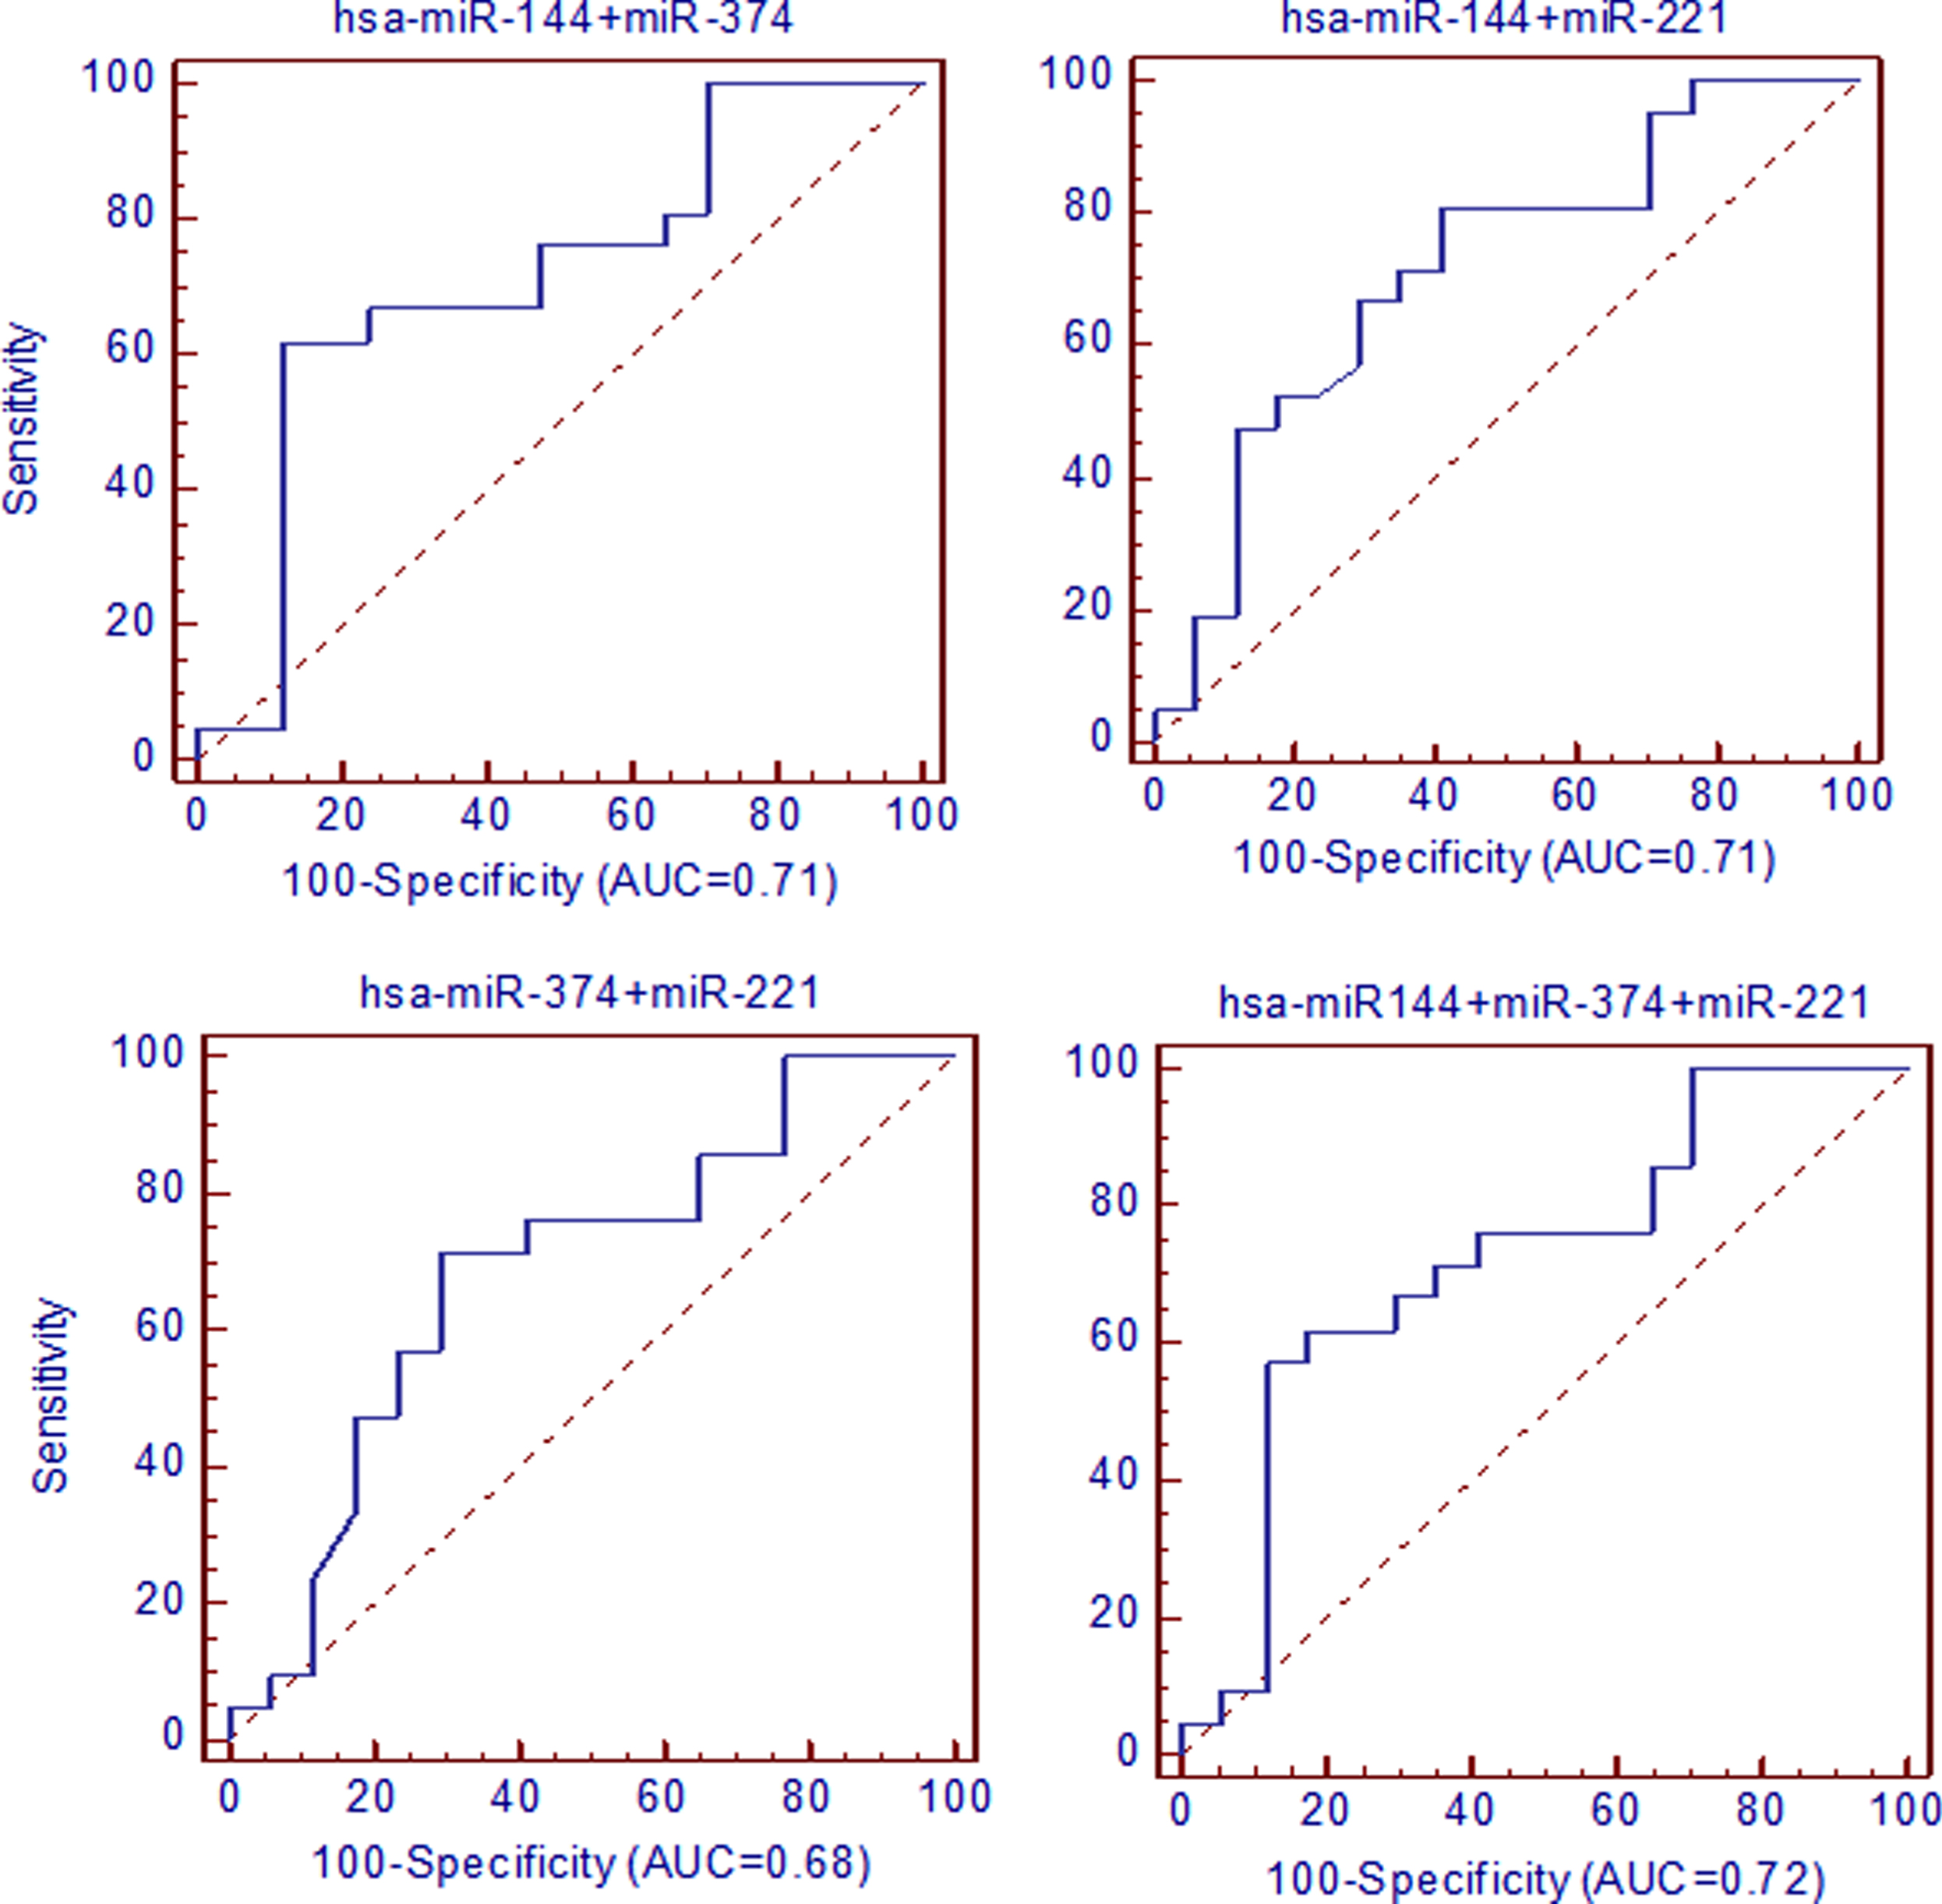
AUC analysis in ROC curves performed considering selected miRNAs association. The sensitivity is plotted as a function of specificity. Medcalc 14.8.1.
In this study, a cohort point was selected by Youden index J, so that the best relations considering the AUC values were chosen for further analysis. To better understand the data, interactive dot diagrams were prepared for miRNAs analysis associations (Supplementary Figure 3). As a result, the association of miRNAs improved the AUC, as well as the sensitivity and specificity, in correctly classifying AD diagnosis with greater statistical significance (p≤0.0001) for miR-144-5p and miR-374.
Among the several active pathways controlled by such miRNAs (Supplementary Figure 4), “Neurodegenerative disorders” and “Alzheimer’s disease” stands out. In the “Neurodegenerative disorders” pathway, these miRNAs regulate different target genes, which act on different dementia types. However, in the “Alzheimer’s disease” pathway, miR-144-5p and miR-374 directly regulate relevant AD genes (AβPP and BACE1, respectively). Supplementary Figure 5 presents miR-221 target seed genes and pathways in “Alzheimer’s disease” according to DIANA LAB.
Cell transfection with miRNAs mimics and inhibitors
To investigate a potential role of these miRNAs in the regulation of ADAM10 expression, we performed in vitro experiments, transfectingneuroblastoma SH-SY5Y cells with the miRNAs inhibitors or mimics. Both ADAM10, immature form (80 kDa) and ADAM10 mature form (60 kDa) were detected, using actin as internal control. As shown in Fig. 5A, ADAM10 mature protein levels decreased significantly upon transient overexpression of miR-221 in SH-SY5Y cells. On the other hand, ADAM10 protein levels were significantly not altered after overexpression of miR-144-5p and miR-374, indicating the specificity of miR-221 in the regulation of the ADAM10 expression levels (Fig. 5A, B). In addition, treatment of SH-SY5Y cells with the miR-221 inhibitor increased ADAM10 levels in these cells (both forms), confirming the role of miR-221 in the regulation of ADAM10 (Fig. 5C, D). Finally, no changes in the ADAM10 mRNA levels in SH-SY5Y cells were detected upon miR-221 transient transfection (Fig. 5E). These data suggest that the repression of ADAM10 protein induced by miR-221 does not occur via ADAM10 mRNA degradation, but may be achieved by translational repression [20].

Identification of miR-221 as a negative regulator of ADAM10. A) Transfections with miRNAs mimics. Representative image of western blotting analysis of the endogenous ADAM10 protein in SH-SY5Y cells transfected with the negative control or miR-144-5p, miR-221, miR-374 mimics. Actin served as an internal control. Both the ADAM10 immature form at 80 kDa and the ADAM10 mature form with an apparent molecular weight of 60 kDa were detected. B) Quantitative analysis of experiments in (A). Optical densities (OD) of ADAM10 bands from five independent experiments were quantified and normalized to the corresponding actin band. The values were plotted as fold-change with respect to the miRNA negative control (miR-144-5p 124.70±34.43; miR-221 66.51±10.84; miR-374 95.48±20.97; *miR-221 versus negative control p = 0.037). C) Transfections with miR-221 inhibitors. The levels of the endogenous ADAM10 are significantly increased after SH-SY5Y cells transfection with an inhibitor of miR-221 when compared to control cells. Representative images show the immature and mature form of ADAM10 (samples were run on the same gel, images were acquired at different exposure times). D) Quantification of experiments in (C). The values were plotted as fold-change with respect to the negative control (miR-221 inhibitor 386.9±101.3; *miR-221 inhibitor versus control p = 0.047). Values are means±SEM of three independent experiments. E) Quantitative RT-PCR results showing no changes in ADAM10 mRNA levels in SH-SY5Y cells transfected with miR-221 when compared to cells transfected with the corresponding negative control. ADAM10 mRNA levels were normalized on RPLP0 mRNA levels.
DISCUSSION
Changes in miRNAs networks can result in brain neurodegenerative diseases [21]. In the current literature, only three publications highlight miRNAs’ deregulation in peripheral blood mononuclear cells in AD patients. Villa et al. [22] verified that gene expression of heterogeneous nuclear ribonucleoprotein A1 and miR-590-3p are deregulated in AD patients. Schipper et al. [23] analyzed 462 miRNAs in 16 AD patients and 16 healthy controls, showing that miR-34a and miR-181b were overexpressed in AD. Both miRNAs have a high association with reduced AD gene expression and regulate transcription/translation factors, synaptic activity and cellular homeostasis. Leidinger et al. [6] validated a panel of 12 miRNAs in whole blood of AD patients with 95% specificity and 92% sensitivity. Moreover, these 12 miRNAs were also extremely accurate in terms of distinguishing AD from other neurological diseases.
Cheng and co-workers [24] screened and validated a set of differential exosomal miRNA biomarkers in the serum of healthy and AD patients and identified an AD specific 16-miRNA signature, which was validated using qRT-PCR to predict AD with a sensitivity and specificity of 87% and 77%, respectively. None of the above cited miRNAs matched to the differently expressed miRNAs found in our sample, possible due to the different samples, processing methods and platforms used in the studies.
Our study screened the levels of nearly 700 miRNAs and found a strong tendency to downregulation for 19 miRNAs normalized by miR-U6 endogenous control. However, the screening sample accounted with 4 AD patients and 4 cognitively healthy controls, which can be a bias of this study. In a larger scale sample, we validated the expression of these 19 miRNAs, also including miR-103 and miR-107, which were described in the literature as having important roles in ADAM10 protein expression [19]. However, in our study, we did not find any alteration in the levels of these miRNAs in the sample analyzed. In fact, the analysis revealed that only miR-144-5p, miR-221 and miR-374 levels were significantly reduced in AD compared to the control group. These miRNAs were also the only ones to present significant AUC values for AD diagnosis. According to the study of Leidinger and co-authors [6], miR-144-5p had the lowest level of expression (not validated) in AD (AUC 0.9138; p = 8.35*10 - 6). However, the literature does not address the specificity of this miRNA to AD [25], whereas other studies have also described its deregulation in other human diseases, including various types of cancers [26].
According to the DIANA LAB, the target genes of the 3 miRNAs, identified as having altered expression in our study, are related to AD and neurodegeneration, such as AβPP and BACE1 (for AD) and AβPP, BCL2, EP300, FBXW7, NR4A2 and VAPB (for neurodegenerative disorders). AβPP and BACE1 are directly involved in the formation of the Aβ peptide, while the other identified target genes do not correlate directly with AD; however, they could play important roles in various indirect mechanisms and can be considered new targets in AD research. Moreover, the downregulation of miR-144-5p and miR-374, which target AβPP and BACE1 respectively, shows these miRNAs as potential biomarker molecules to improve AD diagnosis.
Since we have previously shown a decrease in ADAM10 levels in platelets of AD patients [11, 14], unrelated to a decrease in ADAM10 mRNA levels [15], we aimed to evaluate whether miR-144-5p, miR-221, and miR-374 could regulate ADAM10 protein expression. It has been reported in the literature that miR-144 and miR-451 can repress ADAM10 expression [27]. However, in vitro experiments demonstrated that miR-221, but not miR-144-5p and miR-374, can inhibit ADAM10 expression at a translational level. Furthermore, it has been already shown that miR-221 can act indirectly on the ADAM10 protein levels through the suppression of the metalloprotease inhibitor 3 gene (TIMP3) [28]. However, the analysis of miRNAs in the cohort revealed a decrease in miR-221 levels in AD patients when compared to healthy control subjects. Therefore, the decrease in ADAM10 levels in platelets cannot be ascribed to an upregulation in miR-221. We can hypothesize that the downregulation of miR-221 in AD patients can represent a compensatory strategy aimed to increase the ADAM10 expression in a chronic disorder. It should be noted, however, that the small sample size, the influence of administered drugs on miRNAs profiles [29] and the difference of biological material (platelets and total blood) may have influenced the outcomes of this study.
Taken together, we demonstrated that miR-144-5p, miR-221, and miR-374 are downregulated in AD subjects, compared to cognitively healthy controls, with moderate diagnostic accuracy. Among the downregulated miRNAs, we described for the first time the role of miR-221 as a regulator of ADAM10 at a translational level. This study provided new insights into the mechanisms underlying AD pathogenesis, demonstrating that specific miRNAs can be explored as potential new peripheral biomarkers to help diagnose AD. Moreover, the knowledge of the role of these miRNAs and their target genes and pathways could provide new therapeutic strategiesfor AD.
Footnotes
ACKNOWLEDGMENTS
This work was supported by São Paulo Research Foundation –FAPESP (Grants #2012/08654-7 and 2013/06879-4 to MRC). This work was supported by AIRAlzh Onlus-COOP Italia (fellowship to SP). We are grateful to the team of nurses for the biological material collection and to all family members and the elderly who accepted to participate in this research.