
Abstract
The aim of this study was to evaluate the incremental benefit of biomarkers for prediction of Alzheimer’s disease dementia (ADD) in patients with mild cognitive impairment (MCI) when added stepwise in the order of their collection in clinical routine. The model started with cognitive status characterized by the ADAS-13 score. Hippocampus volume (HV), cerebrospinal fluid (CSF) phospho-tau (pTau), and the FDG t-sum score in an AD meta-region-of-interest were compared as neurodegeneration markers. CSF-Aβ1-42 was used as amyloidosis marker. The incremental prognostic benefit from these markers was assessed by stepwise Kaplan-Meier survival analysis in 402 ADNI MCI subjects. Predefined cutoffs were used to dichotomize patients as ‘negative’ or ‘positive’ for AD characteristic alteration with respect to each marker. Among the neurodegeneration markers, CSF-pTau provided the best incremental risk stratification when added to ADAS-13. FDG PET outperformed HV only in MCI subjects with relatively preserved cognition. Adding CSF-Aβ provided further risk stratification in pTau-positive subjects, independent of their cognitive status. Stepwise integration of biomarkers allows stepwise refinement of risk estimates for MCI-to-ADD progression. Incremental benefit strongly depends on the patient’s status according to the preceding diagnostic steps. The stepwise Kaplan-Meier curves might be useful to optimize diagnostic workflow in individual patients.
Keywords
INTRODUCTION
Revised criteria for the diagnosis of Alzheimer’s disease (AD) recommend biomarkers derived from structural magnetic resonance imaging (MRI), cerebrospinal fluid (CSF), and positron emission tomography (PET) to complement clinical, e.g., symptom-based, criteria with objective evidence of the underlying pathology [1–3]. Numerous studies investigated the performance of these biomarkers for prediction of Alzheimer’s disease dementia (ADD) in subjects with mild cognitive impairment (MCI). Many of them investigated one of these biomarkers separately [4–8] or focused on finding the best multivariable model. Most of the latter studies considered only a preselected combination of biomarkers and/or did not include neuropsychological test performance in their multivariable model [9–14]. Furthermore, previous studies often focused on finding the best multivariable model with respect to prediction accuracy, assuming that all variables are available in all patients. This is the case in prospective MCI trials such as the Alzheimer’s Disease Neuroimaging Initiative (ADNI). In clinical routine, it reflects reality only at some academic sites with strong scientific focus on biomarkers for AD diagnosis, but it does not reflect reality in the majority of memory clinics. Most memory clinics have implemented a step-by-step approach of the diagnostic workup in patients with suspicion of AD, that is, patients are referred to additional diagnostic procedures depending on the results of the preceding procedures. The step-by-step diagnostic workup stops when the etiological diagnosis is sufficiently certain. In particular, expensive procedures such as PET are considered only at the very end of the diagnostic workup when all other procedures have been inconclusive so that the etiological diagnosis is still largely uncertain. Knowledge of the incremental benefit of performing an additional diagnostic procedure depending on the results of the diagnostic procedures performed so far might support clinicians in optimizing this diagnostic step-by-step workflow in individual patients. The primary aim of the present study, therefore, was to evaluate the incremental benefit of image-based and CSF biomarkers according to the typical order in which they are collected in routine clinical patient care. The model started with cognitive performance, because objective characterization of cognitive performance in general is the first diagnostic step in patients with impaired cognition and suspicion of AD. The modified Alzheimer’s Disease Assessment Score with 13 items (ADAS-13) [15] and the Functional Activities Questionnaire (FAQ) [16] were evaluated as cognition scores with which to start.
Structural MRI is also part of the basic diagnostics in patients with suspicion of AD in order to exclude other causes of cognitive impairment such as cerebrovascular disease or brain tumor. Thus, MRI-based hippocampus volume can be easily made available in the majority of patients in clinical routine without large additional costs. This was the rationale to include MRI-based hippocampus volume as a neurodegeneration marker next after cognitive performance.
The brain amyloidosis marker Aβ1-42 in CSF was added after MRI-based hippocampus volume. Lumbar puncture for extraction and analysis of CSF is usually performed after MRI, as MRI might show signs of increased intracranial pressure which is a (relative) contraindication to perform lumbar puncture. Finally, CSF tau and PET with the glucose analog F-18-fluorodeoxyglucose (FDG) were compared with MRI-based hippocampus volume as neurodegeneration marker.
The secondary aim of the study was to evaluate the benefit of adding total volume of white matter hyperintensities (WMH) derived from FLAIR MRI as marker of cerebral small vessel disease to ADAS-13 and hippocampus volume for prediction of ADD in MCI. The rationale was that this model represents some ‘medium-cost’ scenario in which MRI is available but neither CSF nor PET.
Kaplan-Meier survival analysis was used for stepwise assessment of the incremental benefit of each marker in 402 MCI subjects from the ADNI [17]. In contrast to ROC analysis, survival analysis does not require to fix the time point (after diagnostic workup) to which the patient’s status is to be extrapolated and, therefore, allows one to assess the whole time course of the disease within a single model. The latter simplifies the derivation of practically relevant conclusions. For the Kaplan-Meier analyses, MCI subjects were dichotomized as ‘negative’ or ‘positive’ for AD characteristic alteration with respect to each marker. Previously published cutoffs determined in independent patient samples were used for this purpose in order to avoid circularity bias and overly optimistic performance estimates.
METHODS
Data used in this study were obtained from the ADNI database (http://adni.loni.usc.edu). The ADNI was launched in 2003 as a public-private partnership, led by Principal Investigator Michael W. Weiner, MD. The primary goal of ADNI has been to test whether serial MRI, PET, other biological markers, and clinical and neuropsychological assessment can be combined to measure the progression of MCI and early AD.
Subjects
The study included all ADNI subjects with 1) baseline diagnosis of MCI, 2) baseline ADAS-13, 3) baseline MRI at 3T (high-resolution T1-weighted and T2-weighted FLAIR image), 4) baseline FDG PET, and 5) at least one follow-up visit. Progression to non-AD dementia was an exclusion criterion. There were no further exclusion criteria, in particular, no subject was excluded based on limited image quality in MRI or PET. These eligibility criteria were fulfilled by 416 subjects (May 2016), all from ADNIGO or ADNI2. From these, 79 subjects had declined to ADD during their follow-up, the remaining 337 subjects had remained stable.
Neuropsychological data
The modified Alzheimer’s Disease Assessment Score with 13 items (ADAS-13) [15] and the Functional Activities Questionnaire (FAQ) [16] were used to characterize cognitive function at baseline. The FAQ is an easy to obtain index of social function based on the performance (4-score) in 10 everyday activities [16]. A previous study reported the FAQ to be the best single feature for ADD prediction in ADNI MCI subjects [18]. Neither ADAS-13 nor FAQ was adjusted for age, gender, or education (in order to facilitate integration in daily routine and to avoid the requirement of an appropriate normal cohort for standardization). Dichotomization of the MCI subjects with respect to ADAS-13 or FAQ was based on cutoffs derived from the results of Korolev and colleagues [19] for prediction of ADD in an independent ADNI1 MCI cohort over 36 months (both cutoffs were computed as unweighted mean of the mean in progressive and the mean in stable subjects given in Fig. 5 in [19]): MCI subjects were classified as “positive” for AD-characteristic alteration with respect to ADAS-13 if ADAS-13 > 18 points and “negative” if ADAS-13≤18 points. MCI subjects were classified as “positive” for AD characteristic alteration with respect to FAQ if FAQ > 3 points and “negative” if FAQ≤3 points.
Structural MRI data
All images were downloaded as “unpreprocessed” (no gradwarp, B1 non-uniformity or N3 correction, see http://adni.loni.usc.edu/methods/mri-analysis/mri-pre-processing). Mcverter was used for DICOM-to-Nifti-conversion (https://lcni.uoregon.edu/downloads/mriconvert/mriconvert-and-mcverter). The first of the two baseline T1 scans was consistently used to mimic clinical routine in which often only a single scan is acquired. MRI had been acquired with 11 different scanner models.
For hippocampal volumetry, T1 MRI data was automatically segmented and stereotactically normalized to the anatomical space of the Montreal Neurological Institute (MNI) using SPM8’s unified segmentation algorithm with default settings [20]. Hippocampal volume (HV) was determined by multiplying the stereotactically normalized and modulated gray matter (GM) component image with a predefined binary mask for both hippocampi as described in [8]. Total intracranial volume (TIV) was estimated as the sum of GM, white matter (WM), and CSF volume. Dichotomization of MCI subjects into positive and negative for hippocampus atrophy was based on the cutoff of 8.12 ml for age and TIV corrected HV reported by Suppa and colleagues for prediction of MCI-to-ADD progression over 36 months in an independent ADNI1 sample [8]. In order to account for potential field strength dependence of the SPM-based HV (and TIV) (1.5T in the study by Suppa and colleagues versus 3T in the present study), SPM-based HV (and TIV) was obtained for an independent sample of ADNI1 subjects that had been scanned on two scanners, one with 1.5T field strength and the other with 3T (51 normal controls, 74 MCI and 28 AD patients) [21]. The mean of the ratio HV(1.5T)/HV(3T) over all of these ADNI1 subjects was used to scale the 3T HV estimates of the MCI subjects of the present study to 1.5T (analogously for TIV). Then, HV was corrected for TIV and age using the bilinear regression coefficients reported in [8].
For automatic segmentation of white matter hyperintensities (WMH), the “lesion growth algorithm” of the lesion segmentation toolbox (LST) under the freely available Statistical Parametric Mapping (SPM) software package was employed (version SPM8, Wellcome Trust Centre for Neuroimaging, Institute of Neurology, UCL, London, UK) [22, 23]. Processing and parameter settings (kappa = 0.30, binarization threshold = 0.50) were exactly as described previously [24]. Dichotomization of MCI subjects into positive and negative for WMH burden used 13.5 ml as cutoff. This cutoff had been determined in a sample of hospitalized geriatric patients in whom the severity of WMH load was categorized by an experienced neuroradiologist as either “normal for age” or “more than normal for age” based on visual inspection of FLAIR MRI [24]. The neuroradiologist was blinded for all clinical information including cognitive performance of the patients. ROC analysis of the total WMH volume for differentiation between “normal for age” and “more than normal for age” revealed a high area under the ROC curve of 0.944. The Youden criterion resulted in a total volume of 13.5 ml as optimal cutoff [24]. Thus, a cutoff of 13.5 ml provides the best accuracy for detection of WMH load that, according to visual inspection of FLAIR MRI by an experienced neuroradiologist, is more than normal for age.
Cerebrospinal fluid data
Baseline CSF data was obtained from the master table provided at the ADNI homepage by the University of Pennsylvania (“UPENNBIOMK_MASTER.csv”). For studies using ADNIGO / ADNI2 subjects to evaluate baseline CSF data for predictive performance, the manual to the master table recommends that data is combined across the four tables (“UPENNBIOMK5-8”) and that the first occurring baseline CSF data is used for each subject. We followed this recommendation and used re-sampled CSF data that was anchored to CSF data from ADNI1. CSF markers were available in n = 386, 367, and 385 for CSF concentration of Aβ1-42 (CSF-Aβ), total-tau (CSF-tTau), and phospho-tau p-tau181p (CSF-pTau), respectively.
Dichotomization into positive or negative for AD-characteristic CSF alteration was based on the ADNI1 CSF data reported by Lehallier and coworkers [25] in MCI stables and MCI-to-ADD progressors according to 36 months of follow-up: 158 pg/ml for CSF-Aβ, 106 pg/ml for CSF-tTau, and 36 pg/ml for CSF-pTau, respectively (cutoffs were computed as unweighted mean of the mean in progressive and the mean in stable subjects given in eTable 4 in [25]).
FDG PET data
In 400 of the 416 subjects, FDG PET had been acquired according to a dynamic protocol so that 6 frames of 5 min duration from 30 to 60 min post injection were available for analysis. The remaining 16 FDG PET had been acquired as 30 min static emission scan starting 30 min post injection. Reconstructed dynamic (or static, if dynamic not available) PET data was downloaded in its original image format (“as archived”, DICOM, Interfile, or ECAT) in order to guarantee that no preprocessing had been performed. Then, the original images were converted to Nifti, from DICOM and ECAT using SPM8, from Interfile using ImageConverter (version 1.1.5, download: http://www.turkupetcentre.net/programs/tpc_csharp.html). FDG PET imaging had been performed with 17 different scanner models.
Statistical single subject analysis of the PET images was performed using a custom-made pipeline for fully automated processing implemented in MATLAB and using routines of SPM8. The parameter setting optimized for prediction of MCI-to-ADD progression as described by Lange and co-workers was used [7]. The FDG t-sum score was computed as FDG PET feature for MCI-to-ADD prediction by summing the t-values from voxel-based testing over all voxels within a binary AD meta-region-of-interest (ROI) described previously [7].
The t-sum score cutoff of 26,609 was used for dichotomization into positive or negative with respect to the AD characteristic pattern in FDG PET. This cutoff has been derived previously from a sample of 108 ADNI1 MCI subjects for prediction of MCI-to-ADD progression within 36 months [7].
Survival analysis
Kaplan-Meier analysis with respect to “dementia-free” survival was performed stepwise and splitting all existing strata based on low and high risk according to the new marker at each step. Progression to ADD was the “event” and the time from baseline to the follow-up visit at which the subject was diagnosed with ADD for the first time was the “survival time”. Maximum follow-up of the included ADNI MCI subjects was 60 months. Subjects that did not progress during their individual follow-up time were categorized as censored and were included in the survival analysis.
In the primary analyses, Kaplan-Meier analysis started with the neuropsychological (NP) test score as only factor (2 strata). In the second step, HV was added resulting in 4 strata. Step 2 was repeated using either one of the CSF tau markers or the FDG t-sum score as neurodegeneration marker instead of HV. CSF concentration of Aβ was added in the third step resulting in a total of 8 strata. CSF-pTau was used as neurodegeneration marker in the third step, because it provided better risk stratification compared to HV and the FDG t-sum score at the second step.
More precisely, the following combinations were considered as factors in the stepwise Kaplan-Meier analysis (“–”/“+” indicates negative/positive for AD-characteristic alteration): neuropsychology (NP) only, either ADAS-13 or FAQ: NP– versus NP+; add HV: NP–/HV– versus NP–/HV+ versus NP+/HV– versus NP+/HV+; or CSF-Tau, either tTau or pTau: NP–/Tau– versus NP–/Tau+ versus NP+/Tau– versus NP+/Tau+; or FDG t-sum score: NP–/FDG– versus NP–/FDG+ versus NP+/FDG– versus NP+/FDG+; add CSF-Aβ1-42: NP–/pTau–/Aβ– versus NP–/pTau-/Aβ+ versus NP–/pTau+/Aβ– versus NP–/pTau+/Aβ+ versus NP+/pTau–/Aβ– versus NP+/pTau–/Aβ+ versus NP+/pTau+/Aβ– versus NP+/pTau+/Aβ+.
In addition, multivariable Cox regression analysis with continuous predictor variables was used to compare the three neurodegeneration markers (HV, CSF-pTau, FDG t-sum score) with respect to their added value (to NP and CSF-Aβ) without dichotomizing of markers, i.e., the following models were compared: NP/HV/Aβ, NP/pTau/Aβ, and NP/FDG/Aβ.
The secondary analysis (‘medium cost’ scenario) evaluated the impact of adding total WMH volume to NP and HV by Kaplan-Meier and Cox regression testing.
Kaplan-Meier and Cox regression analyses for the determination of hazard ratios (HR) were performed with IBM SPSS Statistics (version 22, IBM Corp., Armonk, NY, USA).
RESULTS
Fully automatic hippocampus volumetry and fully automatic computation of the FDG t-sum score worked properly in all cases. Fully automatic segmentation of WMH worked properly in 402 of the 416 ADNI MCI subjects according to visual inspection of the binary WMH map overlaid as contour to the corresponding FLAIR image (all slices). In the remaining 14 subjects (3 MCI-to-ADD progressors) either tissue segmentation failed (n = 6) or identification of WMH lesions resulted in strong underestimation (n = 1) or strong overestimation of WMH lesion load (n = 7). These subjects were excluded from the further analyses. Detailed description of the 402 subjects included in the Kaplan-Meier survival analyses is given in Table 1 and Fig. 1, separately for the 76 MCI subjects who declined to ADD during their follow-up (MCI-to-ADD progressors) and for the 326 stable MCI subjects who remained MCI (n = 272) or improved to cognitively normal (n = 54) during their follow-up. ADNI participant roster IDs (RID) of the included subjects are given in the Supplementary Material. MRI and PET slices of two representative subjects are shown in Fig. 2.
Baseline characteristics of the MCI subjects included in the survival analyses. Numbers are given as mean±standard deviation. The sample size is given in parenthesis if different from the sample size specified in the first row. ADAS-13, modified Alzheimer’s Disease Assessment Score with 13 items; CSF, cerebrospinal fluid; CSF-Aβ, rescaled CSF concentration of Aβ1-42; CSF-pTau, rescaled CSF concentration of p-tau181; CSF-tTau, rescaled CSF concentration of t-tau; FAQ, Functional Activities Questionnaire; FDG t-sum, t-sum score within AD meta-ROI; HV, hippocampal volume adjusted for total intracranial volume and age; MCI, mild cognitive impairment; MMSE, Mini-Mental State Examination; WMH, total volume of white matter hyperintensities
*Absolute value of Cohen’s d for comparison of groups with different sample size. §Comparison of numerical characteristics (all except gender) between groups was performed by t-test of independent samples. The p-value was chosen according to the result of Levene’s test for homogeneity of variance. The chi-square test was used to compare the distribution of gender between the groups.

Total duration of follow-up (in stable MCI subjects, left) or duration until progression to AD dementia (in MCI-to-ADD progressors, right).
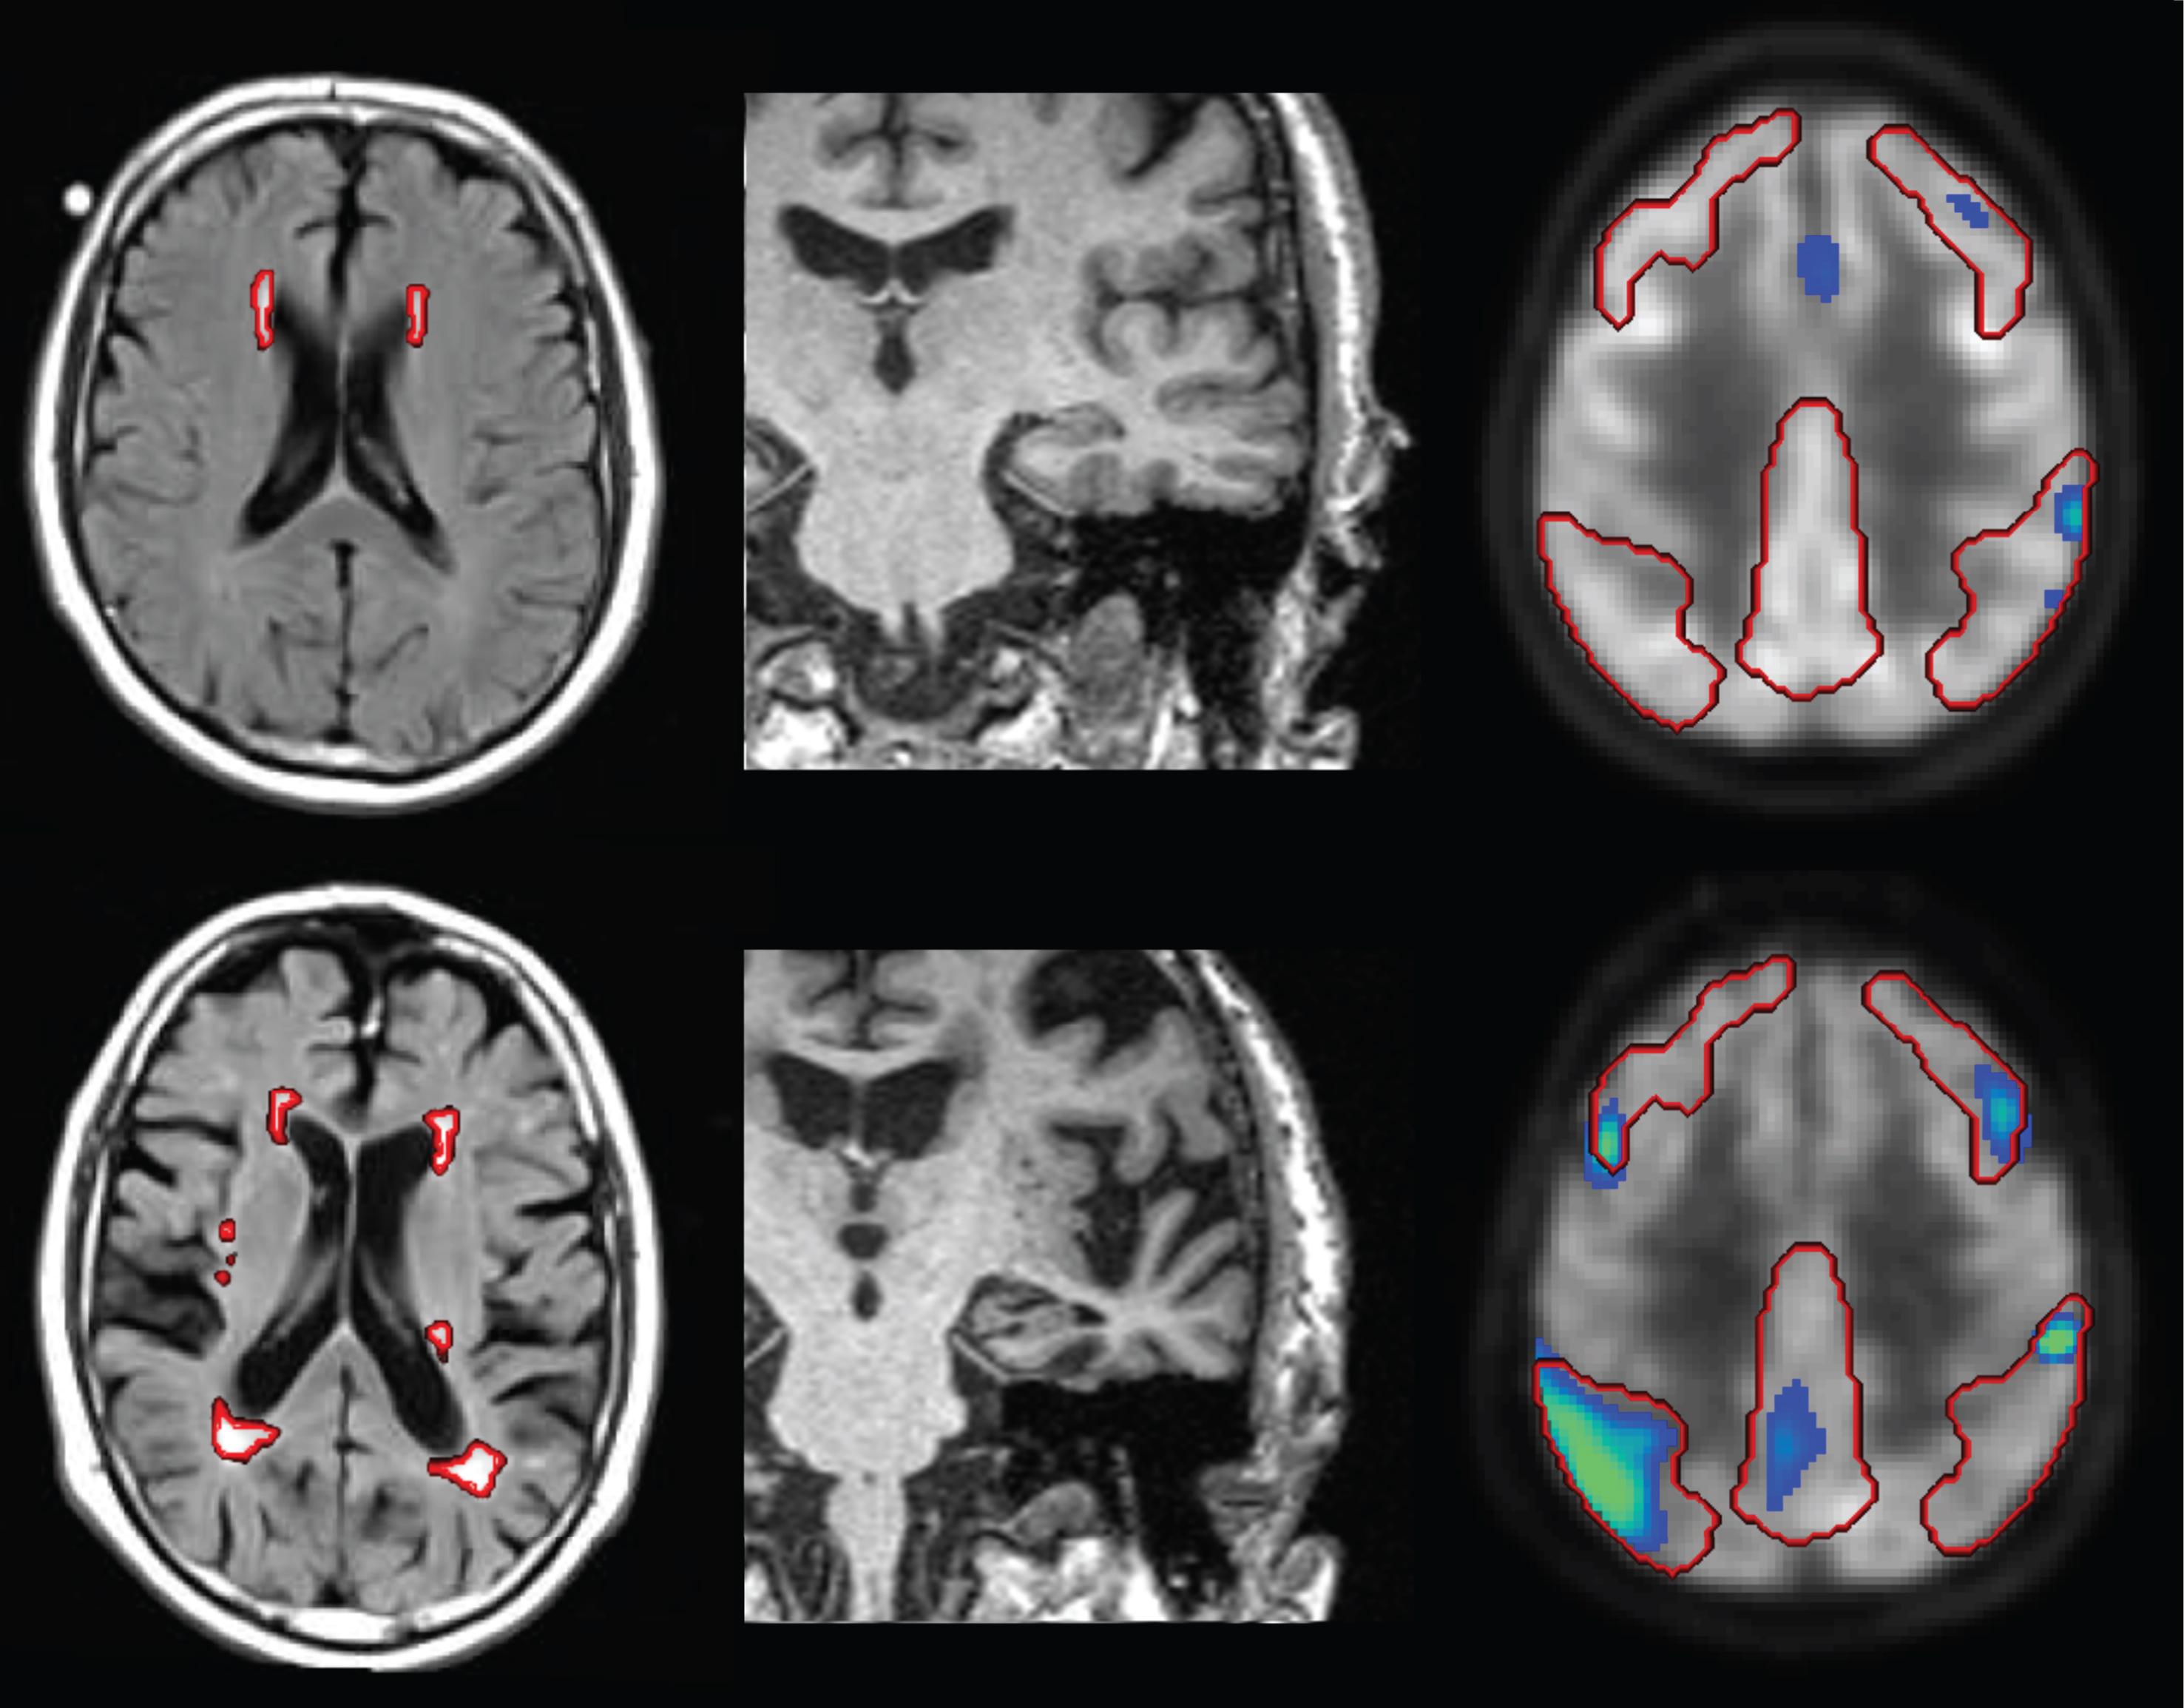
Image-based markers in two representative MCI subjects (top row versus bottom row): FLAIR MRI with segmented WMH shown as red contours (left column), MPRAGE MRI (middle column) and statistical parametric map (hypometabolism) of FDG PET with AD meta-ROI overlaid as red contour (right column, the statistical map shows t-values≥2.5 for display only, the t-sum included all values within the AD meta-ROI). The MCI subject in the top row was low risk with respect to all three imaging markers (FDG t-sum score = 13321 < 26609, age- and TIV-adjusted HV = 9.11 > 8.12 ml, WMH = 3.5 ml < 13.5 ml), with respect to cognitive performance (ADAS-13 = 15 < 18) as well as with respect to CSF Aβ and phospho-tau (Aβ= 206 > 158 pg/ml, pTau = 20 < 36 pg/ml). This MCI subject was stable during the whole follow-up of 48 months. In contrast, the MCI subject in the bottom row was high risk with respect to all three imaging markers (FDG t-sum score = 44257 > 26609, age- and TIV-adjusted HV = 7.58 < 8.12 ml, WMH = 20.2 ml > 13.5 ml), with respect to cognitive performance (ADAS-13 = 28 > 18) as well as with respect to CSF Aβ and phospho-tau (Aβ= 83 < 158 pg/ml, pTau = 37 > 36 pg/ml). This subject had progressed to ADD at the 12 months’ follow-up visit.
MCI-to-ADD progressors were on average 1.8 years older than MCI stable subjects (p = 0.042), but there was no difference with respect to gender (p = 0.609), years of education (p = 0.767), and duration of follow-up (p = 0.123). The neuropsychological test scores (MMSE, ADAS-13, FAQ) showed a highly significant (p < 0.0005) difference between MCI-to-ADD progressors and MCI stable subjects, as did all imaging-based and CSF markers (HV, FDG t-sum, CSF-tTau, -pTau, -Aβ) except the total WMH volume for which the effect was less significant statistically (p = 0.016). Considering Cohen’s effect size of the difference between MCI-to-ADD progressors and MCI stable subjects, ADAS-13 showed the largest effect amongst the neuropsychological scores and CSF-pTau showed a larger effect than CSF-tTau. In the Kaplan-Meier analysis, therefore, ADAS-13 was used as neuropsychological test score and CSF-pTau as CSF neurodegeneration measure.
Survival analysis
Kaplan-Meier survival curves at each step are shown in Fig. 3, the corresponding hazard ratios are given in Table 2.

Kaplan-Meier survival curves. In the first step, risk stratification was based on neuropsychological test performance as characterized by ADAS-13 only (A). In the second step, a neurodegeneration marker was added, either hippocampus volume (B), phospho-tau (pTau) concentration in CSF (C), or the severity of the AD characteristic reduction in FDG PET as characterized by the FDG t-sum score (D). Concentration of Aβ1-42 in CSF was added in the third step (E). The survival curves for the ‘medium cost’ scenario with MRI (HV and WMH load) but neither CSF nor PET is shown in panel (F) of the figure. Survival time is given in months. “–”/“+” indicates negative/positive for AD characteristic alteration according to the corresponding cutoff.
Cox regression analyses corresponding to the Kaplan-Meier curves in Fig. 3. “–“/”+” indicates negative/positive for AD characteristic alteration according to the corresponding cutoff. The number of subjects is given in round brackets for each stratum. FDG, t-sum score within AD meta-ROI; HR, hazard ratio; HV, hippocampal volume adjusted for total intracranial volume and age; NP, neuropsychological testing based on modified Alzheimer’s Disease Assessment Score with 13 items; pTau, rescaled cerebrospinal fluid (CSF) concentration of p-tau181; Aβ, rescaled CSF concentration of Aβ1-42
**p≤0.0005. *0.0005 < p≤0.05. §0.05 < p≤0.1.
In the first (neuropsychology only) step, estimated mean “dementia-free” survival was considerably longer in the low risk group (ADAS-13≤18) compared to the high risk group (56 versus 39 months, HR = 6.84, p < 0.0005; Table 2, Fig. 3A).
Adding hippocampus volume in the second step had a significant effect in both, the low and the high risk group according to ADAS-13: dementia-free survival was significantly longer if the subject was also low risk with respect to HV (58 months versus 54 months, HR = 2.37, p = 0.021, in case of low risk according to ADAS-13; 45 months versus 29 months, HR = 2.10, p = 0.015, in case of high risk according to ADAS-13; Table 2, Fig. 3B).
Replacing HV by CSF-pTau in the second step resulted in improved risk stratification (higher HR) independent of ADAS-13 status (dementia-free survival 59 months versus 52 months, HR = 9.43, p < 0.0005, in case of low risk according to ADAS-13; 43 months versus 33 months, HR = 3.47, p = 0.005, in case of high risk according to ADAS-13; Table 2, Fig. 3 C). Using the FDG t-sum score as neurodegeneration marker in the second step improved risk stratification compared to HV in subjects who were low risk according to ADAS-13 (58 months versus 48 months, HR = 5.23, p < 0.0005; Table 2, Fig. 3D). In contrast, the FDG t-sum score did not improve risk stratification compared to HV in subjects with high risk according to ADAS-13 (43 months versus 30 months, HR = 1.80, p = 0.047). The HRs derived from the FDG t-sum score were lower than the HRs derived from CSF-pTau, independent of ADAS-13 status. Adding CSF-Aβ in the third step had a significant effect in the high risk groups according to CSF-pTau, more pronounced in MCI subjects with relatively preserved cognition (56 months versus 49 months, HR = 2.99, p = 0.047 compared to subjects with stronger cognitive impairment (36 months versus 29 months, HR = 2.22, p = 0.073; Table 2, Fig. 3E). The HR of CSF-Aβ positivity did not reach the level of statistical significance in the subjects with low risk according to CSF-pTau, independent of ADAS-13 status (Table 2, Fig. 3E).
Comparison of the three neurodegeneration markers with respect to the prognostic value they add to ADAS-13 and CSF-Aβ using multivariable Cox regression without dichotomization (all markers as continuous variables) are given in Table 3. The added value was highest for CSF-pTau as indicated by the smallest -2 log-likelihood in the omnibus test.
Multivariable Cox regression survival analyses with continuous predictor variables for comparison of the different neurodegeneration markers (MRI-based hippocampus volume, CSF-pTau, FDG PET) with respect to their added value (to neuropsychological performance and CSF-Aß). The analyses were restricted to subjects with complete biomarkers (n = 373) to guarantee comparability of the results between the three tested models. NP, neuropsychological testing based on modified Alzheimer’s Disease Assessment Score with 13 items; HV, hippocampal volume adjusted for total intracranial volume and age; Aβ, rescaled cerebrospinal fluid (CSF) concentration of Aβ1-42; pTau, rescaled CSF concentration of p-tau181; FDG, t-sum score within AD meta-ROI; HR, hazard ratio
**p≤0.0005. *0.0005 < p≤0.05.
The results for the ‘medium cost’ model are given in Table 4. Adding dichotomized total WMH volume to dichotomized ADAS-13 and HV provided additional risk stratification only in MCI subjects with both, cognition and HV, relatively preserved (dementia-free survival 58 months versus 53 months, HR = 5.03, p = 0.006; Fig. 3F).
Cox regression for prediction of dementia-free survival by adding dichotomized MRI-based total volume of white matter hyperintensities to dichotomized cognitive status (ADAS-13) and dichotomized MRI-based hippocampus volume. This model represents a ‘medium-cost’ scenario without CSF parameters and PET. “–”/“+” indicates negative/positive for AD characteristic alteration according to the corresponding cutoff. The number of subjects is given in round brackets for each stratum. HR, hazard ratio; HV, hippocampal volume adjusted for total intracranial volume and age; NP, neuropsychological testing based on modified Alzheimer’s Disease Assessment Score with 13 items; WMH, total volume of white matter hyperintensities
*0.0005 < p≤0.05.
DISCUSSION
The aim of this study was to evaluate the incremental benefit of image-based and CSF biomarkers according to the order of their collection in routine clinical patient care for prediction of ADD in subjects with mild cognitive impairment. Determination of image-based biomarkers for prediction of MCI-to-ADD progression can involve different levels of complexity. In the present study, the complexity was limited to a level compatible with daily routine patient care. In particular, only fully automatic methods were used to compute biomarkers from MRI and FDG PET.
The major findings of the study are the following. First, fully automatic processing of structural MRI (MPRAGE, FLAIR) and FDG PET for computation of hippocampal gray matter volume and FDG t-sum score as neurodegeneration markers as well as total volume of WMH as marker of cerebral small vessel disease worked properly in 402 of 416 cases (97%), although no subject was excluded based on technical constraints such as poor MRI or PET image quality. This demonstrates the robustness of the automatic methods which is important for use in busy clinical routine. Total computation time on a standard PC was on average 25 min per subject, comprising 5 min for computation of hippocampal gray matter volume, 5 min for computation of the FDG t-sum score, and 15 min for computation of total WMH volume. Total computation time of 25 min is compatible with everyday clinical routine.
Second, among all features (including the biomarkers) ADAS-13 showed the highest effect size for differentiation of MCI stable subjects and MCI-to-ADD progressors (Table 1). This is in line with previous studies that often found cognitive markers to be more robust predictors of MCI-to-ADD progression than biomarkers [26]. Moreover, it supports selecting ADAS-13 as the starting point of the stepwise Kaplan-Meier analyses. Using the predefined cutoff of 18 points on ADAS-13 to dichotomize MCI subjects according to cognitive status, Kaplan-Meier analysis demonstrated the risk to develop dementia to strongly differ between the resulting subgroups (HR = 6.84, p < 0.0005; Fig. 3A, Table 2).
Third, adding HV as neurodegeneration marker provided additional risk stratification (Fig. 3B, Table 2). This effect was independent of ADAS-13 status.
Fourth, using CSF concentration of phospho-tau181p (pTau) as neurodegeneration marker in step 2 considerably improved risk stratification compared to HV for both, subjects with low risk and subjects with high risk according to ADAS-13 (Fig. 3C, Table 2). For example, among MCI subjects with low risk according to ADAS-13, the HR of pTau positivity was 9.43 (p < 0.0005), that is, about four times higher as the HR of 2.37 (p = 0.021) of HV positivity.
It might be noted that both CSF tau measures, pTau and tTau, were equally considered as neurodegeneration markers here. That one of the two was selected for the multivariable survival analyses that performed best in univariate ROC analysis. This approach is in agreement with the AD diagnostic schema of the International Working Group [27] and of the National Institute on Aging –Alzheimer’s Association [2, 3], which both recommend pTau and tTau in CSF as neurodegeneration marker on an equal footing. Jack and co-workers recently proposed the A/T/N classification scheme for AD biomarkers [28]. “A” refers to Aβ biomarkers, “T” refers to biomarkers of AD-specific tau pathology (neurofibrillary tangles), and “N” refers to biomarkers of neuronal injury / neurodegeneration / neuronal dysfunction [28]. A particularly promising aspect of this new classification scheme is the separation of T- and N-markers that has the potential to differentiate neurodegeneration that is attributable to AD from non-AD neurodegeneration [28]. However, reliable differentiation between T- and N-pathology is required in order to fully exploit this potential. There is some indication that CSF-pTau is somewhat more specific for T-pathology, whereas CSF-tTau somewhat more reflects N-pathology [28]. However, there is a tight correlation between both CSF tau measures. Mattsson and colleagues, in a recent study on the relationship between CSF-tTau, CSF-pTau and tau PET with 18F-AV-1451 across the whole spectrum of AD (including preclinical AD, prodromal AD, and AD dementia), found CSF-pTau and CSF-tTau to be highly correlated (R = 0.92), but both were only moderately associated with local or global retention of 18F-AV-1451 [29]. This suggests that the combination of pTau and tTau in CSF might not be sufficient to reliably differentiate between T and N pathology for A/T/N classification. The use of tau PET as T-marker appears more promising for this purpose.
Fifth, the FDG t-sum score provided improved risk stratification in the second step compared to HV particularly in MCI subjects with relatively preserved cognitive performance (ADAS-13≤18) (Fig. 3B and D, Table 2). This might be explained by the fact that 1) FDG PET becomes positive for AD characteristic alterations somewhat earlier than hippocampus volume [30], and that 2) FDG PET might be considered as objectified neuropsychological testing that becomes positive earlier than true neuropsychological testing (perhaps due to better test-retest stability [31, 32]). However, the FDG t-sum score was inferior to CSF-pTau for additional risk stratification in the second step, independent of cognitive status. For example, in MCI subjects with low risk according to ADAS-13, the HR of CSF-pTau positivity was almost twice the HR of FDG PET positivity (Table 2). This is in line with the fact that CSF markers become positive for AD characteristic alteration prior to FDG PET (and HV) [30] and that CSF-pTau is the most frequently impaired biomarker in ADNI subjects [33]. In this context, it is important to mention that about 65% of the MCI subjects included in this study were early MCI. It is expected that the relative predictive power of the imaging-based neurodegeneration markers compared to the CSF biomarkers improves in more advanced (late) MCI stages [30, 34]. Furthermore, FDG PET not only allows detection (or exclusion) of the AD typical pattern, but it is also useful for the diagnosis and differentiation of other diseases such as frontotemporal lobar degeneration or autoimmune encephalitis, an emerging indication of FDG PET [35]. Good specificity of FDG PET for the differentiation of a wider range of diseases compared to HV and CSF markers might be an argument for the use of FDG PET in the diagnostic workup of patients with clinically uncertain cognitive impairment and several possible etiological causes, which is not very rare in clinical routine. In addition, FDG PET might be used in patients with contraindications for / technical difficulties with lumbar puncture. In the ADNI MCI sample included in this study CSF-pTau was missing in 7% of the subjects. In clinical settings, this fraction is probably larger (10–20%).
Sixth, CSF concentration of Aβ1-42 provided additional risk stratification in MCI subjects with increased CSF-pTau. CSF-Aβ1-42 positivity did not reach the level of statistical significance in CSF-pTau negative subjects, independent of cognitive performance. The incremental predictive power of CSF-Aβ in CSF-pTau positive MCI subjects most likely is related to improved specificity for detection of AD by the combination of pTau and Aβ compared to pTau alone. It is in line with results of Prestia and co-workers who found the combination of biomarkers for amyloidosis and neurodegeneration to provide particularly good predictive power in MCI [36]. It is an important advantage of CSF analysis that it provides markers of amyloidosis (CSF-Aβ) and neuronal injury (CSF-tTau and CSF-pTau) from a single probe. However, CSF analysis for AD characteristic proteins is rather sensitive to variability in drawing, handling, transport and analysis of the sample, all of which require careful standardization [37]. This is a disadvantage compared to the more stable HV and FDG PET markers. According to the Canadian Consensus Guidelines on the use of amyloid imaging in Canada, CSF analysis is still not ready for use in clinical routine and, therefore, currently should be restricted to university hospitals and academic institutions [38].
Seventh, adding the total volume of WMH in FLAIR MRI as marker of cerebral small vessel disease to cognition (ADAS-13) and neurodegeneration status (HV) provided additional risk stratification in MCI subjects with low risk according to both, ADAS-13 and HV. The rationale for testing the additional benefit of the WMH lesion load in a ‘medium-cost’ scenario without CSF and PET was that structural MRI including T2-weighted sequences is part of the standard diagnostic procedure in subjects with cognitive impairment and suspicion of neurodegenerative, cerebrovascular or mixed disease. Quantification of WMH load, therefore, results in only little additional costs. The utility of WMH load as early predictor of ADD has been demonstrated previously [39]. This, however, does not proof causality, since even low WMH burden is often associated with detectable neurodegeneration that might drive the cognitive decline rather than WMH load [40, 41]. A study on the heterogeneity of WMH using postmortem quantitative MRI and neuropathology by Gouw and colleagues found significant differences between WMH of AD patients and WMH of non-demented age-matched controls [42]. In particular, WMH in AD patients had more severe microglial activation, in line with the important role of microglial activation in the AD pathological process [42]. This suggests that not only cerebrovascular disease but also AD is a major contributor to WMH.
WMH load did not provide further risk stratification if ADAS-13 and / or HV was positive for AD typical change (Fig. 3F). To some extent this might be explained by the strong imbalance of sample size that was generally considerably smaller in the strata with large WMH load compared to strata with small WMH load. The rather low fraction of subjects with large WMH load is a characteristic of ADNI samples, as ADNI excluded subjects with modified Hachinski ischemic score (mHIS) > 4. However, mHIS is particularly sensitive for the detection of acute events such as stroke as the cause of cognitive impairment. It is less sensitive to seamless and incremental decline of cognitive performance that might be caused by chronic cerebral small vessel disease underlying WMH in the brain. In line with this, a small (13.4%) but non-negligible fraction of the ADNI MCI subjects included in this study showed WMH load above the 13.5 ml cutpoint (Fig. 4). However, the frequency distribution of WMH load above the cutpoint was very similar in the ADNI MCI subjects compared to two clinical patient samples with cognitive impairment (Fig. 4). In particular, maximum WMH burden was not very much smaller in the ADNI MCI sample than in the two clinical samples, although one of the clinical samples comprised patients with clinical diagnosis of vascular dementia.

Frequency distribution of the total volume of white matter hyperintensities (WMH) up to the cutpoint of 13.5 ml (left) and above the cutpoint (right) for the ADNI MCI patients included in the present study (A). For comparison, the WMH distribution is shown for two clinical patient samples described in [24], patients with a clinical diagnosis of vascular dementia from the NACC database (B), and acutely hospitalized geriatric patients with newly manifested cognitive impairment (C).
The cutpoint of 13.5 ml appears very small at first sight, considering a typical total white matter volume of 400–500 ml. However, it provides the best accuracy for detection of WMH burden that is more than normal for age according to visual inspection of FLAIR MRI [24]. This is illustrated by the two representative MCI patients shown in Fig. 2. The second patient presents with 20.2 ml total WMH (bottom left in Fig. 2), which clearly attracts attention, in contrast to the 3.5 ml WMH load of the first patient (top left). Furthermore, DeCarli and co-workers in a study of 51 healthy subjects aged from 19 to 91 years found WMH burden of more than 0.5% of the total intracranial volume to be associated with increased atrophy and reduced cognitive performance [40]. Assuming a typical intracranial volume of 1500 ml, the cutpoint of 0.5% corresponds to 7.5 ml. More recently, Habes and co-workers reported on the relationship between WMH load and brain atrophy in the general population [41]. Total WMH load larger than 2 ml started to appear after the fifth decade of life. “High” WMH load was associated with reduced cognitive performance (immediate recall score of the verbal learning and memory test) and significantly contributed to brain atrophy beyond normal ageing in the general population [41]. The cutpoint for high WMH load was defined by the 80th percentile of WMH volume as a function of age in this study. At 80 years of age the cutpoint was about 5 ml (Fig. 2 in [41]). WMH load between 5 and 20 ml at this age was associated with age atrophy of subjects of about 90 years of age, i.e., one decade older. The studies by DeCarli et al. [40] and by Habes et al. [41] clearly demonstrate the potential clinical relevance of WMH load in the 5–20 ml range. An excellent recent review of the relationship between WMH and cognitive performance is given in [43].
It might be noted that even the normal control subjects of the ADNI, an extremely healthy group, include a considerable fraction of subjects with substantial brain atrophy and WMH [44, 45]. Nettiksimmons and co-workers, using unsupervised hierarchical clustering based on CSF, serum and MRI markers (but no cognitive test scores) identified three clusters among ADNI controls [45]. The first cluster (33% of all subjects) comprised typical healthy subjects with high brain volume and high CSF Aβ1-42 . The subjects in the second cluster (10%) showed CSF and MRI profiles similar to ADNI MCI and ADNI AD groups suggesting that these subjects were at early AD stages. The third cluster was characterized by higher brain atrophy (exceeding the level of atrophy in the second cluster in some brain regions), increased WMH load, but lack of AD typical CSF profile. Total volume of WMH was 0.9% of TIV larger in the third cluster than in both the first and the second cluster [45]. Assuming a typical TIV of 1500 ml, this difference corresponds to 13.5 ml. This confirms that a cutpoint of 13.5 ml on total WMH volume is useful to categorize subjects based on WMH load. In a second study of the same ADNI control subjects, Nettiksimmons and co-workers found that subjects in the third cluster had a worse cognitive trajectory on the Rey’s Auditory Verbal Learning Test 30-min delay test and the FAQ than subjects in cluster 1, although there was no difference at baseline [44].
Finally, the combination of cognition, neurodegeneration and amyloidosis status provided very strong overall risk stratification. For example, the hazard ratio of subjects with the high risk combination ADAS-13+/pTau+/Aβ+ compared to subjects with the low risk combination ADAS-13–/pTau–/Aβ–was as large as 58.2 (p < 0.0005). To put this into perspective, many studies suggest a capping of prognostic accuracy in MCI patients considerably below 100%, independent of the criteria and/or biomarkers and/or combination of biomarkers used [13, 46].
The following limitations of the present study should be mentioned. First, CSF data was incomplete (Table 1). In particular, CSF-pTau was available in only 373 of the 402 included MCI subjects (93%) which might have caused some bias to the disadvantage of CSF-pTau compared to the other (complete) neurodegeneration markers HV and FDG PET. Second, the SPM-based HV estimate used in the present study does not follow the European harmonization of hippocampal segmentation protocol [47] and, therefore, might be considered a kind of hippocampal integrity measure rather than an estimate of actual hippocampus volume (similar to the index of hippocampal integrity proposed by Ardekani and colleagues [48, 49]). However, the SPM-based pipeline used in this study is very fast computationally and the resulting hippocampus integrity measure provides similar power for prediction of progression to ADD in MCI subjects as computationally more expensive methods [8]. Furthermore, there was a statistically significant age difference between cognitively stable MCI subjects and MCI-to-ADD progressors at baseline. However, only the HV was adjusted for age which might have introduced some bias (probably to the disadvantage of HV) compared to all other features including ADAS-13. The rationale for age-adjusting HV was the use of the cutoff of 8.12 ml given in [8], as this cutoff refers to age-adjusted HV. Finally, WMH load represents only one out of several MRI features associated with cerebrovascular disease. Small infarcts, lacunes, microbleeds and widening of perivascular space were not taken into account here [50].
Conclusion
Stepwise integration of biomarkers of neurodegeneration and brain amyloidosis results in stepwise refinement of risk estimates for MCI-to-ADD progression. The incremental benefit from making the next step (that is, adding the next marker) strongly depends on the results of the preceding diagnostic steps. Thus, the stepwise Kaplan-Meier model can support clinicians in optimizing the diagnostic workflow for each individual patient. Kaplan-Meier analysis might also be useful to communicate findings to patients and their relatives, because it provides the full time course of the dementia risk during the following years.
Footnotes
ACKNOWLEDGMENTS
Data collection and sharing for this project was funded by the Alzheimer’s Disease Neuroimaging Initiative (ADNI) (National Institutes of Health Grant U01 AG024904) and DOD ADNI (Department of Defense award number W81XWH-12-2-0012). ADNI is funded by the National Institute on Aging, the National Institute of Biomedical Imaging and Bioengineering, and through generous contributions from the following: AbbVie, Alzheimer’s Association; Alzheimer’s Drug Discovery Foundation; Araclon Biotech; BioClinica, Inc.; Biogen; Bristol-Myers Squibb Company; CereSpir, Inc.; Eisai Inc.; Elan Pharmaceuticals, Inc.; Eli Lilly and Company; EuroImmun; F. Hoffmann-La Roche Ltd and its affiliated company Genentech, Inc.; Fujirebio; GE Healthcare; IXICO Ltd.; Janssen Alzheimer Immunotherapy Research & Development, LLC.; Johnson & Johnson Pharmaceutical Research & Development LLC.; Lumosity; Lundbeck; Merck & Co., Inc.; Meso Scale Diagnostics, LLC.; NeuroRx Research; Neurotrack Technologies; Novartis Pharmaceuticals Corporation; Pfizer Inc.; Piramal Imaging; Servier; Takeda Pharmaceutical Company; and Transition Therapeutics. The Canadian Institutes of Health Research is providing funds to support ADNI clinical sites in Canada. Private sector contributions are facilitated by the Foundation for the National Institutes of Health (![]() ). The grantee organization is the Northern California Institute for Research and Education, and the study is coordinated by the Alzheimer’s Disease Cooperative Study at the University of California, San Diego. ADNI data are disseminated by the Laboratory for Neuro Imaging at the University of Southern California.
). The grantee organization is the Northern California Institute for Research and Education, and the study is coordinated by the Alzheimer’s Disease Cooperative Study at the University of California, San Diego. ADNI data are disseminated by the Laboratory for Neuro Imaging at the University of Southern California.