
Abstract
Background:
The Down syndrome (DS) population is genetically predisposed to amyloid-β protein precursor overproduction and Alzheimer’s disease (AD).
Objective:
The temporal ordering and spatial association between amyloid-β, glucose metabolism, and gray matter (GM) volume in the DS population can provide insight into those associations in the more common sporadic AD.
Methods:
Twenty-four adults (13 male, 11 female; 39±7 years) with DS underwent [11C]PiB, [18F]FDG, and volumetric MRI scans. Voxel-wise associations between PiB SUVR, FDG SUVR, and GM volume were investigated, with and without individual adjustments for variables of interest.
Results:
Positive associations of PiB and age were widespread throughout the neocortex and striatum. Negative associations of FDG and age (frontal, parietal, and temporal cortex) and of GM volume and age (frontal and insular cortex) were observed. PiB and FDG were negatively associated in parietal cortex, after adjustment for GM volume.
Conclusions:
In adults with DS, early amyloid-β accumulation in the striatum is divergent from sporadic AD; however, despite the early striatal amyloid-β, glucose hypometabolism was confined to the typical AD-associated regions, which occurs similarly in autosomal dominant AD. Importantly, the glucose hypometabolism was not explained solely by increased partial volume effect due to GM volume reductions.
Keywords
INTRODUCTION
Alzheimer’s disease (AD) is the most common age-related dementia affecting an estimated 5.5 million people in the United States and its prevalence is estimated to double nearly every 20 years [1]. The AD pathophysiological process extends over two to three decades and many of the AD biomarkers undergo changes with normative aging or other neurodegenerative diseases, albeit with different topographical patterns and time courses. The AD pathophysiological process is thought to temporally progress through abnormal amyloid-β protein precursor (AβPP) metabolism, hyperphosphorylation of tau protein, synaptic dysfunction, and neuron death in which each process has a specific spatial pattern and rate of change [2–5].
Thal staging of amyloid-β (Aβ) accumulation includes five phases; plaques begin to accumulate in the neocortex, then spread to the allocortex, basal ganglia, brainstem, and finally the cerebellum [6]. Phases one through three have been observed in non-demented cases, and phases three through five have been observed in AD cases [6], reflecting the ambiguity between postmortem Aβ assessment and clinical AD diagnoses, which may be resolved with in vivo imaging. Braak staging of neurofibrillary tangle (NFT) accumulation begins in limbic and paralimbic structures and spreads to prefrontal and parietal and temporal cortices [7]. Neocortical NFTs are associated with advanced AD cases [7]. Glucose metabolism is consistently reduced in AD, particularly in the parietal cortex, temporal cortex, and posterior cingulate [8–10]. AD-associated glucose hypometabolism begins before clinical symptoms of dementia and its extent relates to AD progression [8–10]. Gray matter (GM) volume reductions begin in amyloid positive healthy controls, affecting parts of the default network (e.g., hippocampus, parietal cortex, and posterior cingulate) [11]. Generalized brain morphometric changes (e.g., cortical atrophy, ventricular enlargement) spread to most cortical and subcortical structures in AD [11, 12]. In sporadic AD, the time course has been suggested to be amyloid positivity 17–19 years prior to disease onset, hippocampal atrophy 4 years prior, and memory impairment 3 years prior [13].
The majority of AD cases are sporadic AD in which a reduced phagocyte-mediated Aβ clearance plays a major pathogenic role. However, there are other forms of AD and their presentations reflect differences in etiology. For instance, autosomal dominant AD (ADAD) accounts for less than 1% of all AD cases and stems from mutations in the AβPP, PSEN1, or PSEN2 genes that result in an overproduction of AβPP and early accumulation of Aβ plaques [14]. This overproduction of AβPP leads to a striatum-dominant pattern of Aβ accumulation [15], which is Thal phase 3 in sporadic AD. Differences in NFT deposition are still being actively investigated with newly developed tau positron emission tomography (PET) radiotracers. Biomarkers of neurodegeneration, namely, hypometabolism and cortical atrophy, in ADAD are found in similar regions as in sporadic AD [16]. The proposed time course in ADAD is amyloid positivity 15–20 years prior to disease onset, glucose hypometabolism 10 years prior, cortical thinning 5 years prior, and global cognitive impairment 5 years prior [16, 17]. Therefore, the proposed time courses for sporadic AD and ADAD are similar.
AD in Down syndrome (DS) is similarly thought to be caused by the overproduction of AβPP due to the trisomy of chromosome 21 (1.5x production of AβPP) [18–20]. Consequentially, early accumulation of Aβ plaques, which are composed of the same core protein as in sporadic AD, begins as early as their teens and becomes nearly ubiquitous in their 40 s at autopsy [21]. While most adults with DS are without clinical symptomology at age 40, they remain at significantly greater risk of AD in subsequent decades of life and up to 75% have AD by age 65 [22]. Moreover, there is an increasing number of adults with DS living to older ages (average life expectancy: 9–12 years in 1929–1949 to 55–60 years in 1991–2002 [23, 24]) due to advancements in medical procedures for DS related cardiac abnormalities, better standard of care, and higher availability of resources to families and caretakers [25]. Since all individuals with DS will develop Aβ plaques, there is a strong ethical burden to address this growing problem in this at-risk population. However, not all adults with DS will develop AD, providing a unique opportunity to explore the association between Aβ plaques, neurodegeneration, and dementia.
Previous imaging studies in DS have shown 25% of a non-demented DS cohort are Pittsburgh compound B positive (PiB(+)) from 30–53 years, with a striatum-dominant pattern [26, 27] compared to 20–40% PiB(+) in non-demented general population from 60–90 years [4]. Moreover, the longitudinal rate of Aβ accumulation in DS was similar to that in the general population when stratified by amyloid positivity [28]. Preliminary data of tau PET imaging in DS suggests similar binding in the medial temporal cortex [29]. Glucose hypometabolism has been observed in DS in AD-associated regions (e.g., parietal cortex, temporal cortex, and posterior cingulate [30, 31]) and becomes more pronounced after the onset of dementia [32]. One study found hypermetabolism in the temporal cortex as a possible compensatory mechanism in older, non-demented DS adults [30]. GM volume reductions in DS are superimposed on an already affected neural substrate. A comparison of DS adults with age-matched controls show GM volume reductions in hippocampus and temporal cortex, which are independent of age and simply reflect atypical brain morphology [33]. Age-related GM volume reductions in DS are predominantly observed in anterior cortex (e.g., frontal cortex, insular cortex, and anterior cingulate [33]). Therefore, the early, AD-associated GM volume reductions occur in regions that do not change with age in DS, and the regions with age-associated GM volume reductions do not atrophy until late AD.
Understanding the early biomarkers of AD would facilitate research for earlier and more effective treatments of AD in the relatively large population of individuals with DS and contribute to the understanding of the AD pathophysiological process in general. Newly proposed criteria for AD diagnosis incorporates biomarkers such as Aβ burden from PET imaging, synaptic and neuron function from fluorodeoxyglucose (FDG) PET, and neuron density from volumetric magnetic resonance imaging (MRI) [34–36] because amyloid positivity and the extent of glucose hypometabolism or GM atrophy are associated with a higher rate of conversion from mild cognitive impairment to AD [37–39]. The aim of this study is to present a natural history study of AD in the DS population using a multimodal approach including amyloid PET, FDG PET, andvolumetric MRI.
METHODS
Subjects
Twenty-four (13 male, 11 female; 39±7 years) out of 79 adults with DS from a larger multi-site, longitudinal cohort underwent at least one amyloid PET, FDG PET, and volumetric T1 MRI scan. The remaining 55 adults did not have all three modalities at the time of this analysis, and were excluded. Thus, the analysis of the FDG PET data for the 24 subjects is performed based upon a single (i.e., cross-sectional) FDG scan. Participants were recruited from research registries and mailings and fliers posted at programs serving adults with DS (e.g., disability programs and DS clinics) within 3–5 hours of the performance sites (University of Wisconsin-Madison and University of Pittsburgh Medical Center). Inclusion criteria included chronological age of at least 30 years and receptive language of at least 3 years. Exclusion criteria included having a prior diagnosis of dementia at study entry (Down Syndrome Dementia Scale (DSDS [40]) cognitive cutoff score (CCS)<3), conditions that might contraindicate MRI (e.g., claustrophobia, metal in the body), and having a medical or psychiatric condition that impaired cognitive functioning. FDG scans were acquired later in the study, which is why only a subset of participants have data from all three modalities, and were not all performed at a participant’s first visit. Therefore, three participants scored a CCS higher than 3 on the DSDS at the time of FDG imaging, and were determined to have AD by a consensus conference based on caregiver questionnaires and changes on measures of adaptive functioning.
PET imaging
Participants underwent a [11C]PiB scan (up to 15 mCi at >2 mCi/nmol, 20–30 s intravenous bolus) and a subsequent [18F]FDG scan (125±103 days after; up to 5 mCi, 20–30 s intravenous bolus) in Siemens ECAT HR+ scanners at both sites. Blood glucose levels did not exceed 175 mg/dL prior to the FDG PET scan (4-h fasting period). A 6–10 min 68Ge/68Ga transmission scan was acquired for attenuation correction of annihilation radiation. PET data were reconstructed with a filtered back-projection algorithm (Direct Inverse Fourier Transform; DIFT) and corrected for detector deadtime, scanner normalization, photon scatter, and radioactive decay.
Preprocessing was performed in AIR version 3.0 [41], in which dynamic PET data were corrected for interframe motion and averaged over 50–70 and 40–60 min post-injection for PiB and FDG, respectively [42]. Parametric standard uptake value ratio (SUVR) images were calculated for PiB and FDG using cerebellar GM as the reference region [43–45]. Parametric images were spatially normalized using a DS specific PiB PET template, created in a two pass method to minimize normalization error that would have resulted from using a T1 MRI to T1 MRI template spatial normalization due to motion artifacts in the T1 MRIs that were not present in the PiB images. This DS specific method has been described previously [27]. The spatial normalization of the PiB SUVR images to the DS specific PiB PET template was applied to the coregistered FDG SUVR images, and no subjects were excluded due to poor spatial normalization.
MRI imaging
Participants underwent T1 MRI scans on a GE SIGNA 750 (UW-Madison) or a Siemens Magnetom Trio (UPMC). The SIGNA 750 acquired data using a high resolution volumetric spoiled gradient sequence (TI/TE/TR = 450/3.2/8.2 ms, flip angle = 12°, slice thickness = 1 mm no gap, matrix size = 256×256×156). The Magnetom Trio acquired data using a magnetization prepared rapid acquisition gradient echo sequence (MPRAGE; TI/TE/TR = 900/2.98/2300 ms, flip angle = 9°, slice thickness = 1.2 mm, matrix size = 160×240×256). MRIs were skull-stripped and AC-PC aligned (AIR version 3.0 [41]), and the spatial normalization of the PiB SUVR images to the DS specific PiB PET template was applied to the coregistered MRI images. Parametric GM, white matter, and cerebrospinal fluid volume images were estimated using a mixed-model tissue-type segmentation (Matlab2015, SPM12 [46]) and DS specific tissue type prior probability maps were created in a two pass method to account for the unique DS brain morphology (e.g., smaller overall brain with smaller frontal cortex, temporal cortex, and cerebellum [47, 48]). The DS specific prior probability maps have been previously described [28], and population specific brain templates are often created in two passes for atypical populations [49–51]. Intracranial total volume (ITV) was calculated from GM, white matter, and cerebrospinal fluid volumes.
PiB positivity
Region of interest (ROI) specific PiB positivity thresholds were determined by sparse k-means clustering with resampling due to the bimodal distribution of the data, using a previously described process [52] applied to non-atrophy corrected data from the complete DS cohort [27, 54]. A subject was classified as PiB(+) if at least one ROI exceeded its threshold (anterior cingulate: 1.59, frontal cortex: 1.48, parietal cortex: 1.51, precuneus: 1.64, striatum: 1.45, temporal cortex: 1.38). ROIs were defined in standardized space from the Wake Forest University pick atlas toolbox (aal human atlas; SPM12; MATLAB2015). The binary masks were dilated (4 mm Gaussian smoothing and thresholding at 0.3) to account for intersubject variability in brain morphology and were closely inspected to ensure proper coverage for each region on each subject, as previously described [27, 28].
Cognitive function
Participants completed a comprehensive neuropsychological evaluation assessing a range of specific cognitive abilities (e.g., verbal learning and memory, visual memory, attention/processing speed, executive/working memory, visuoconstruction, and language). Analysis of specific cognitive abilities with amyloid burden have been previously published [53, 54], and current analysis was limited to the Peabody Picture Vocabulary Test 4th Edition (PPVT [55]), a measure of receptive language that correlates strongly with IQ scores [56], but not with chronological age. PPVT score, expressed as a mental age, was used as a measure of overall cognitive performance in the DS population [27, 54].
Statistical analysis
Participant demographics (e.g., sex, APOE4 allele) and mean PiB SUVR, GM volume, or FDG SUVR were tested for significant differences with Chi-squared tests (α= 0.05; IBM SPSS Statistics 24.0) or independent sample t-tests (Bonferroni correction for multiple comparisons; α= 0.05/7 ROIs = 0.007), respectively, by PiB positivity or dementia status. All GM volume analyses were performed with and without ITV adjustment.
Parametric PiB and FDG SUVR or GM volume images were smoothed with an 8 mm isotropic Gaussian smoothing kernel prior to voxel-wise analysis. First, variables of interest, including age, sex, overall cognitive function, and APOE4 allele, were investigated for associations with PiB SUVR, FDG SUVR, or GM volume images, separately (SPM12; uncorrected height threshold <0.001, extent threshold = 0). Then, PiB SUVR, FDG SUVR, and GM volume images were entered into the Biological Parametric Mapping (BPM; MATLAB2011a, SPM5) toolbox to investigate voxel-wise associations between the three biomarkers. Significant variables of interest that were identified in SPM were then entered into the BPM model to adjust for their effects. Again, voxel-wise results were considered at exploratory thresholds (uncorrected height threshold <0.001, extent threshold = 0).
Voxel-wise linear regressions (SPM, BPM) were split into a series of nested models which were divided as all participants (n = 24), non-demented participants (combined PiB(+) and PiB(–); n = 21), and non-demented PiB(–) participants (n = 16). These sensitivity analyses, stratified by PiB positivity and dementia status, demonstrate which subgroup is influencing an association without over-complicating the model (e.g., group interactions) in this limited sample size. ROI-wise analyses were also performed to lower the noise associated with smaller sample size. An additional hippocampal ROI was defined in the Wake Forest University pick atlas. The linear regression unstandardized regression coefficient (B±standard error) represents the magnitude of the association in absolute units (i.e., one unit change in the independent variable was associated with a B change in the dependent variable, on average). The Pearson correlation R2 ranges from 0 to 1 and represents the percentage of variance explained (i.e., the independent variable explained 100 * R2 of thevariance observed in the dependent variable).
RESULTS
Participant demographic information is presented by PiB positivity and dementia status (Table 1). By subgroups, there was a significant difference in PPVT score between the PiB(–) and demented subgroups (Table 1). There was also a significant difference in age between the PiB(–) and PiB(+) subgroups, as well as the PiB(–) and demented subgroups (Table 1). Across all subjects, there were no significant differences by sex or APOE4 in PiB SUVR, FDG SUVR, or GM volume, as well as no significant associations with PPVT score. However, the trends acrosssubgroups of increasing PiB SUVR, decreasing FDG SUVR, and decreasing GM volume were expected (Table 1). There were significant associations with age and PiB, FDG, and GM, separately. The clusters of significant association are shown in Figs. 1–3 and are presented separately for each nested model.
Participant demographics, [11C]PiB standard uptake value ratio (SUVR), [18F]FDG SUVR, and gray matter (GM) volume in seven investigated regions of interest and intracranial total volume (ITV) by PiB positivity and dementia status
All values presented as mean±standard deviation. †p < 0.05, *p < 0.007, where one symbol is significance between PiB(–) and PiB(+), two symbols is between PiB(–) and Demented, and three symbols is between PiB(+) and Demented. Parentheses indicate significance after ITV adjustment (e.g., for GM volume differences).
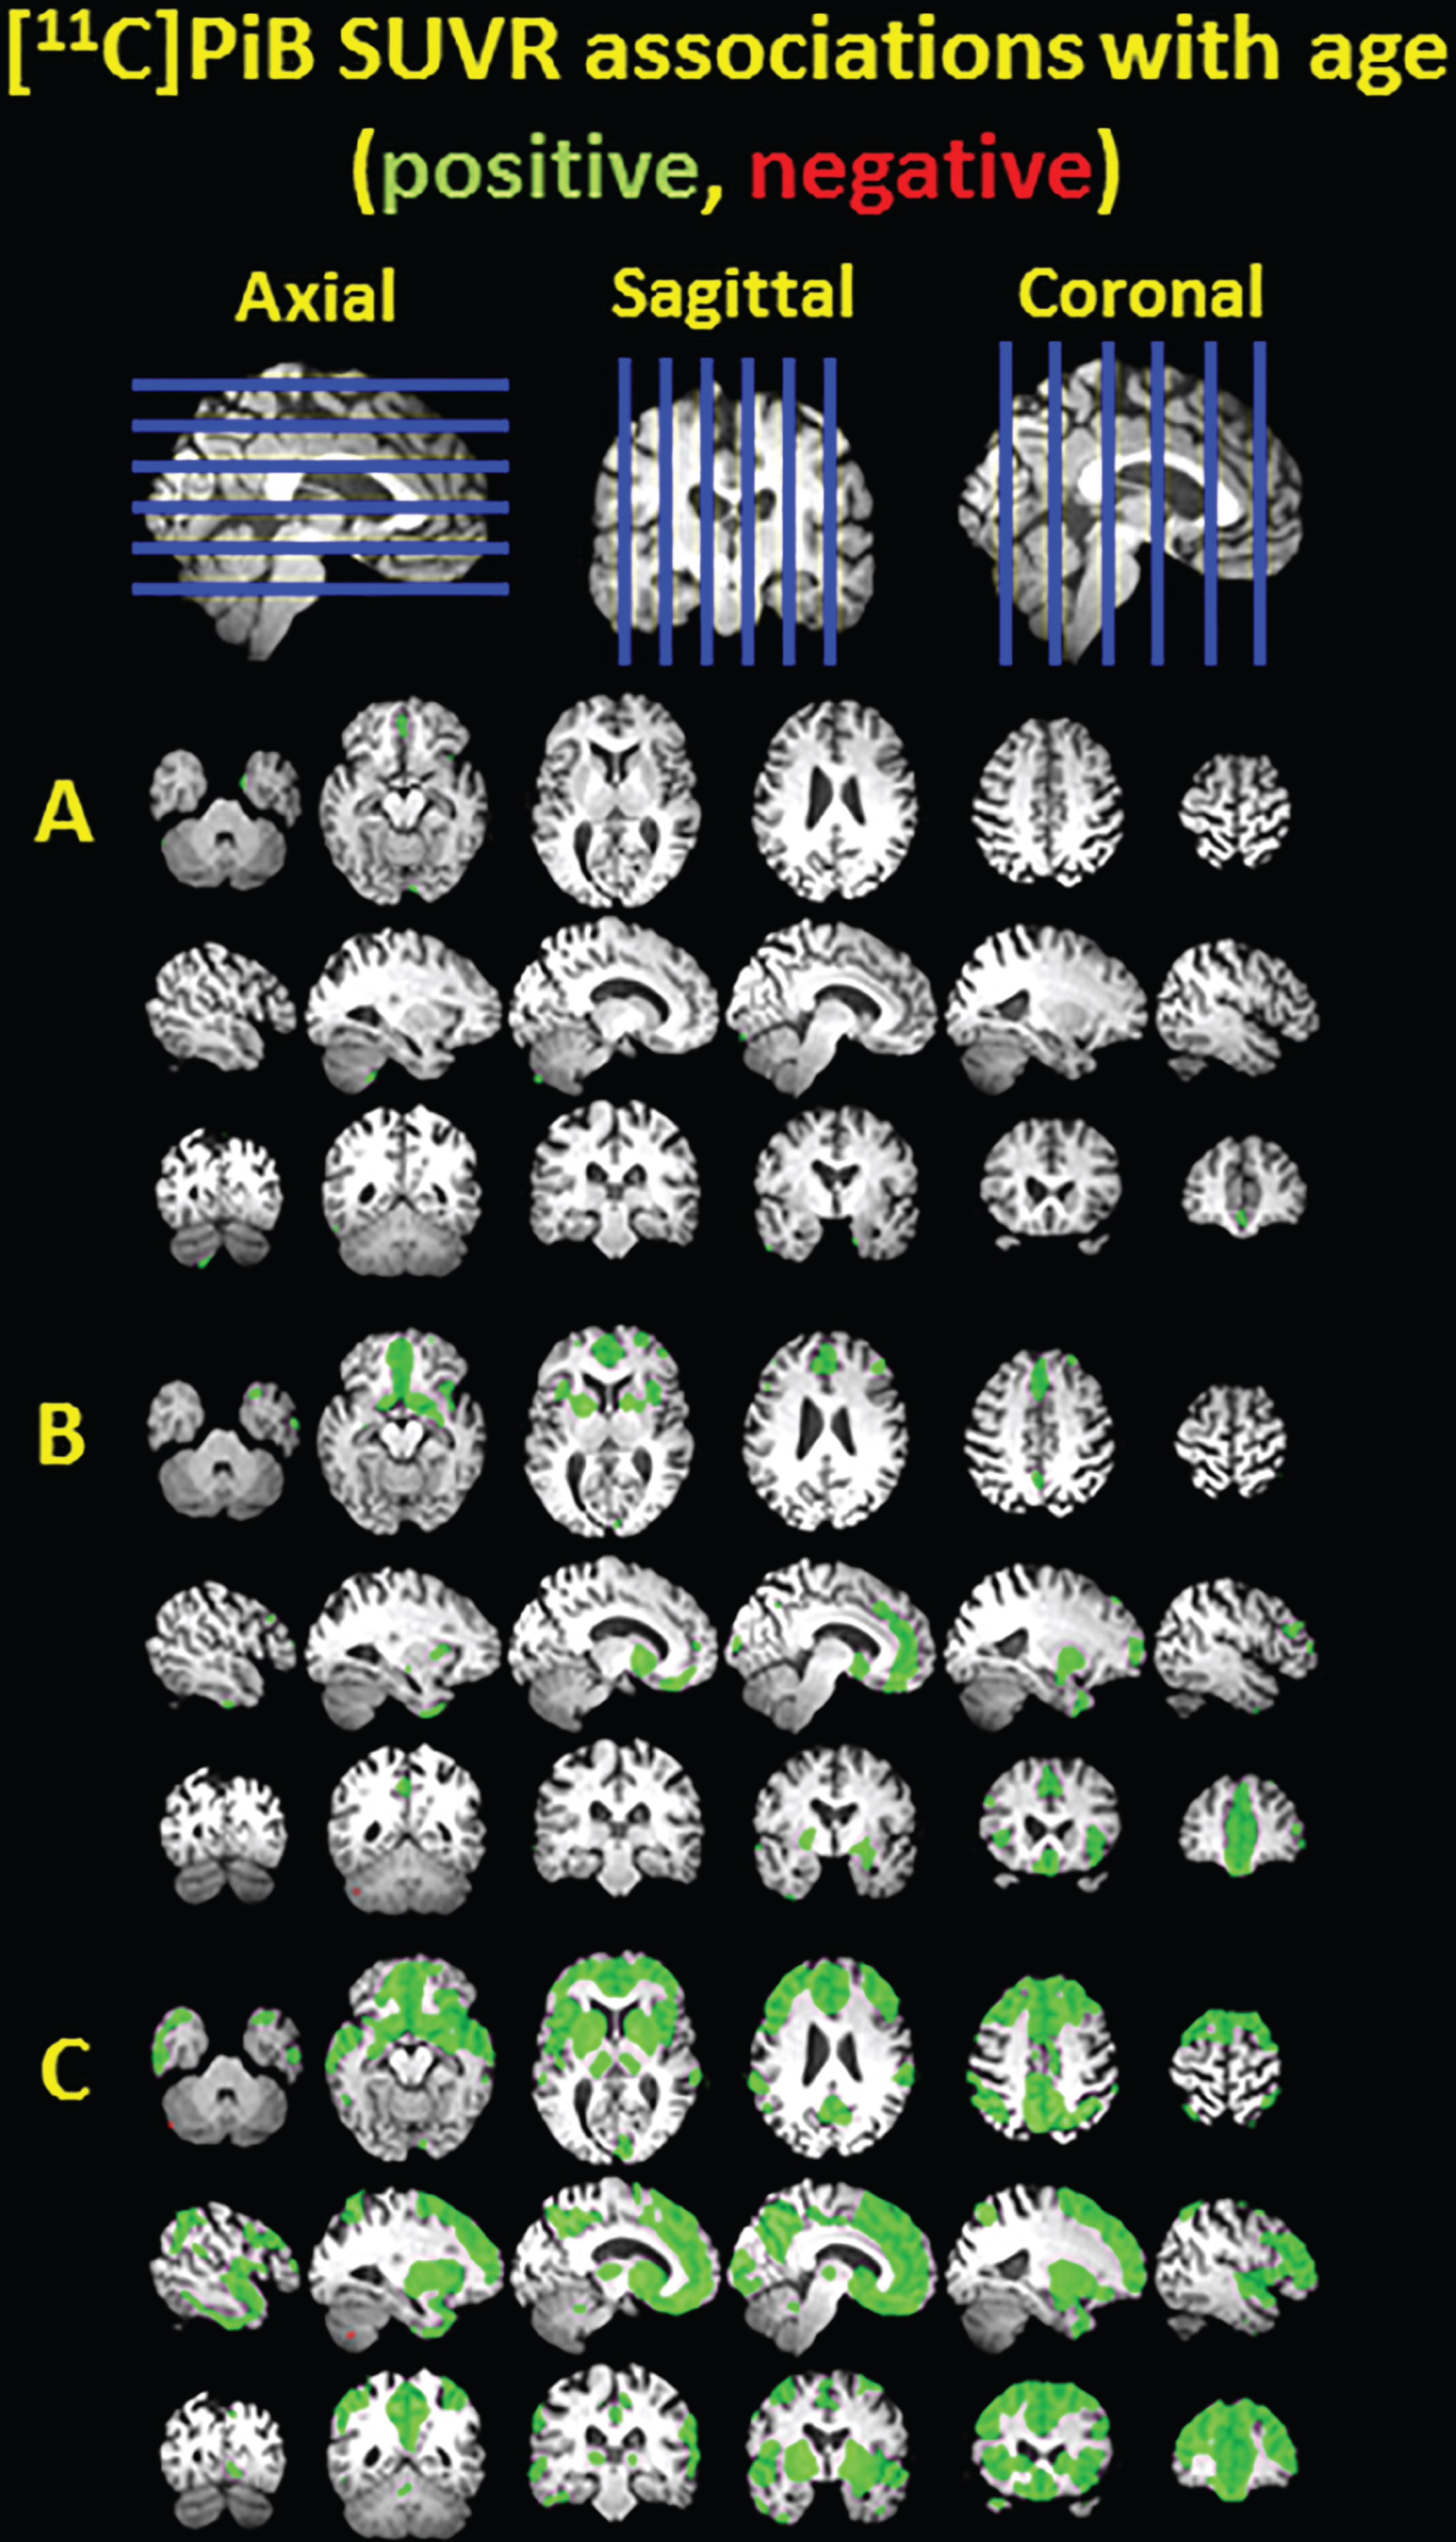
Clusters of significant association between [11C]PiB SUVR and age shown in green for positive associations and red for negative associations, overlayed on a T1 MRI for anatomical reference. The voxelwise analysis was performed in nondemented PiB(–) subjects (A), nondemented PiB(–) and PiB(+) subjects (B), and all subjects including three demented subjects (C).
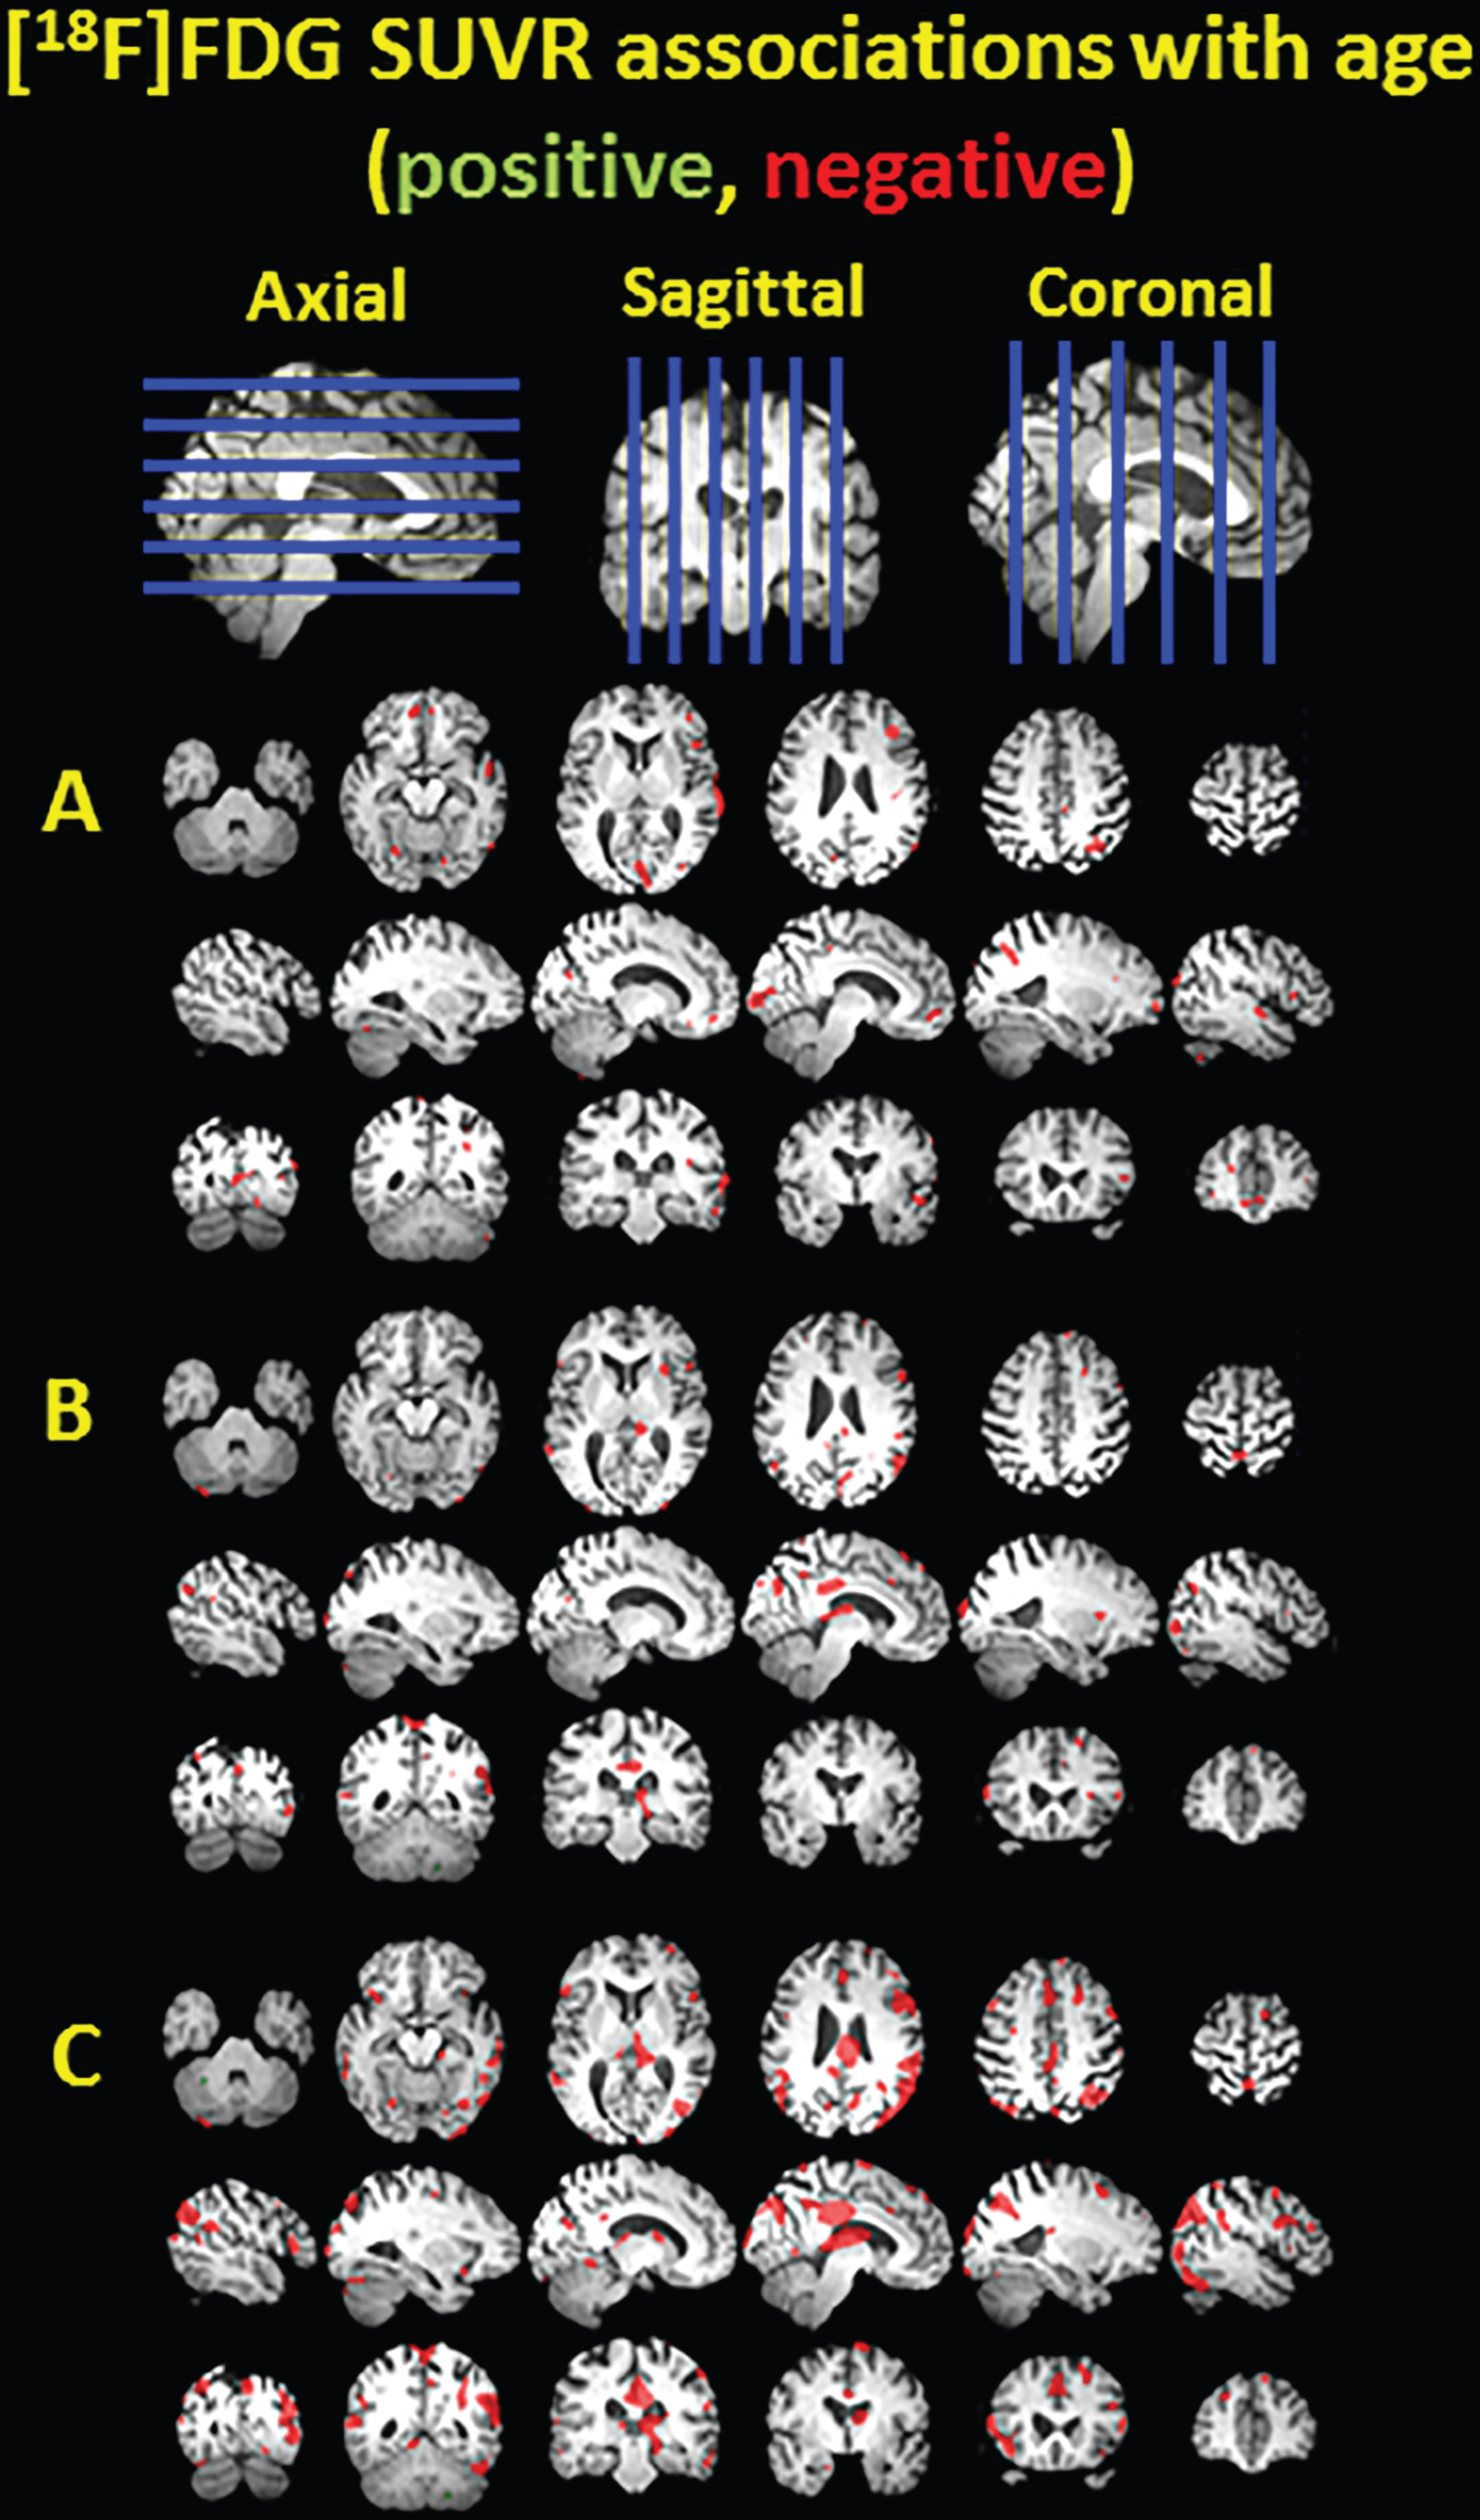
Clusters of significant association between [18F]FDG SUVR and age shown in green for positive associations and red for negative associations, overlayed on a T1 MRI for anatomical reference. The voxelwise analysis was performed in nondemented PiB(–) subjects (A), nondemented PiB(–) and PiB(+) subjects (B), and all subjects including three demented subjects (C).

Clusters of significant association between gray matter volume and age shown in green for positive associations and red for negative associations, overlayed on a T1 MRI for anatomical reference. The voxelwise analysis was performed in nondemented PiB(–) subjects (A), nondemented PiB(–) and PiB(+) subjects (B), and all subjects including three demented subjects (C).
Figure 1 demonstrates the positive association between age and PiB SUVR. As expected, there are no large significant clusters in the PiB(–) subgroup (Fig. 1A), but in the non-demented PiB(–) and PiB(+) subgroup there are positive associations located in the frontal cortex, anterior cingulate, striatum, and smaller clusters in the precuneus and temporal cortex (Fig. 1B). When demented subjects are also included, there are widespread, diffuse clusters of positive association throughout the neocortex and striatum (Fig. 1C).
Figure 2 demonstrates small scattered clusters of negative association between age and FDG SUVR in the PiB(–) subgroup and the PiB(–) and PiB(+) subgroups (Fig. 2A and 2B, respectively), but larger clusters of negative association located in temporal cortex, thalamus, posterior cingulate, precuneus, parietal cortex, and frontal cortex are observed when the demented subjects are included (Fig. 2C).
Figure 3 demonstrates the negative association between age and GM volume. In the PiB(–) subgroup, there is one small cluster in the right cerebellum (Fig. 3A). In the non-demented PiB(–) and PiB(+) subgroup, there are negative associations in the frontal cortex and insular cortex, as well as some scattered positive associations (Fig. 3B). With the demented subjects included, the negative associations extend further throughout the frontal cortex and insular cortex (Fig. 3C). There are also some clusters of positive association, which may represent regions of relatively preserved GM volume, or regions of misclassified tissue.
PiB, FDG, and GM volume images were entered into a single voxel-wise model using the BPM toolbox with and without age adjustment (Fig. 4). There were no significant associations of PiB SUVR or FDG SUVR with GM volume. As expected, there were no associations between PiB SUVR and FDG SUVR in the PiB(–) subgroup (Fig. 4A, D). But as the PiB(+) subgroup was added, associations with PiB and FDG SUVR became apparent and there were small clusters of negative association in the precuneus that survive age adjustment (Fig. 4B, E). When the demented subjects were included, small clusters of negative associations were observed in the precuneus, parietal cortex, and temporal cortex of which only the clusters in the precuneus survived age adjustment(Fig. 4C, F).
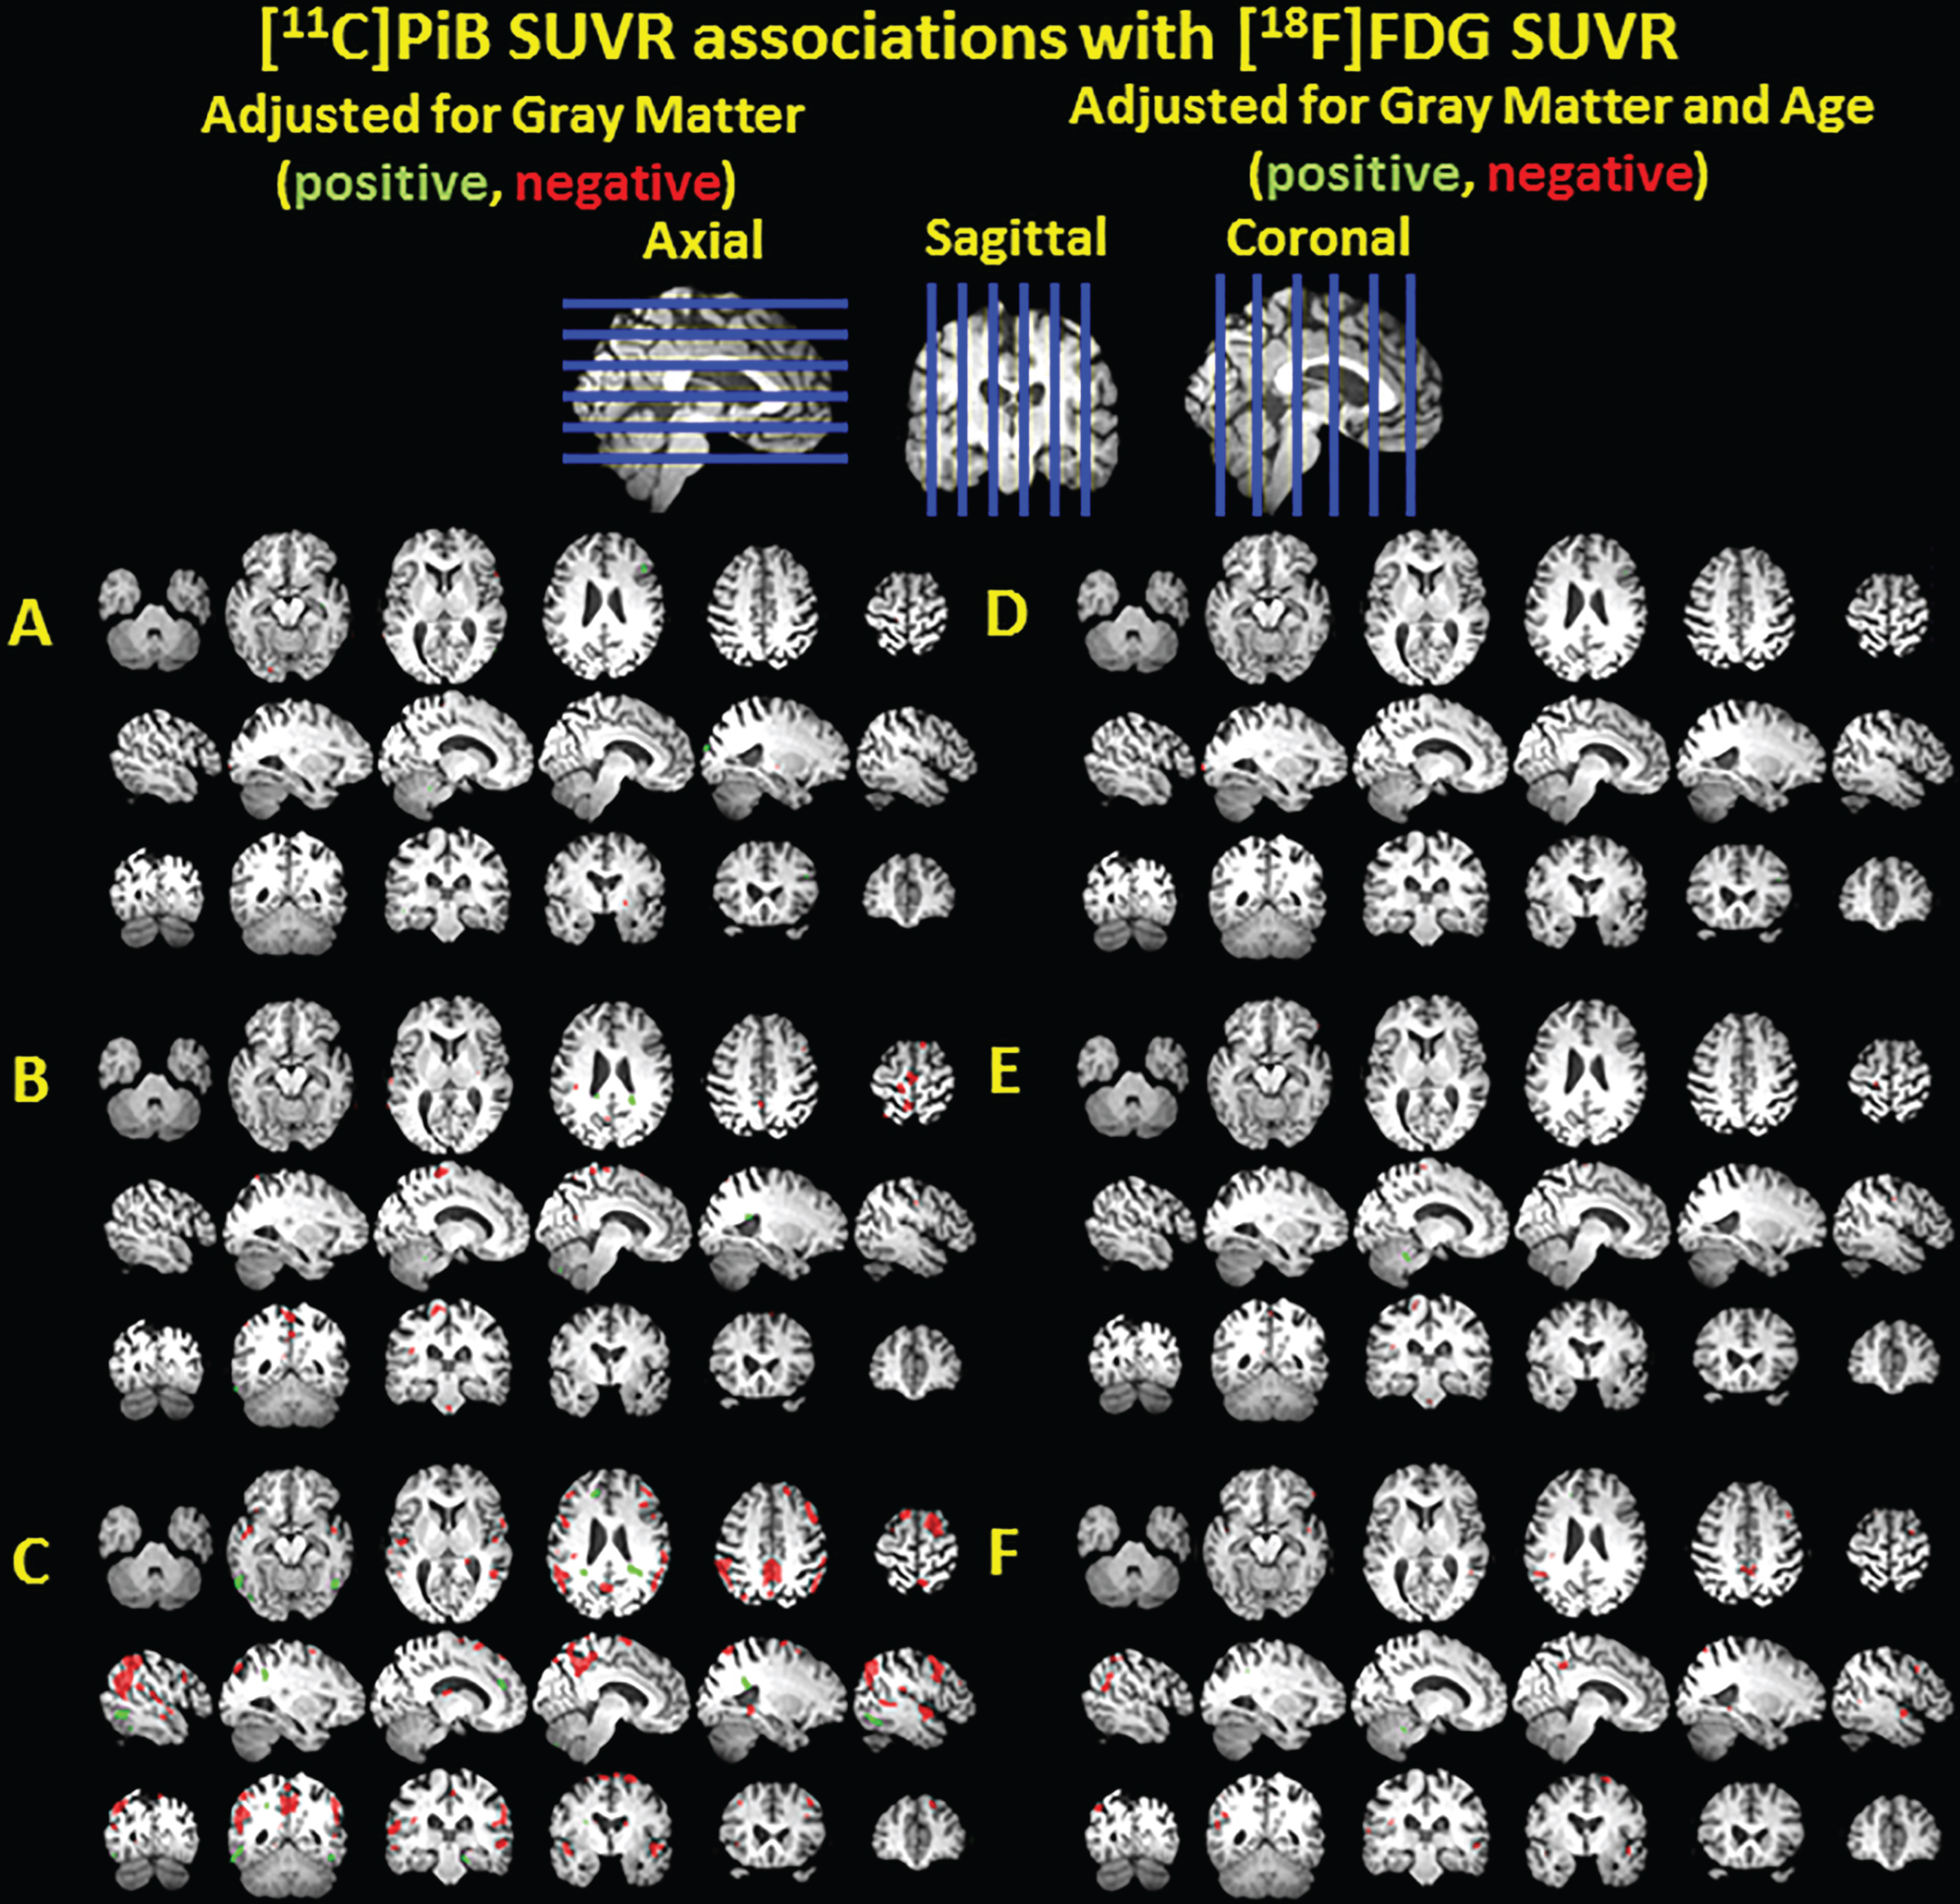
Clusters of significant association between [11C]PiB SUVR and [18F]FDG SUVR adjusted for gray matter volume shown in green for positive associations and red for negative associations, overlayed on a T1 MRI for anatomical reference. The voxelwise analysis was performed in nondemented PiB(–) subjects (A), nondemented PiB(–) and PiB(+) subjects (B), and all subjects including three demented subjects (C). The analyses were repeated with age adjustment in the same nested models (D-F).
At a lower noise level, the ROI level results indicate a negative association between PiB SUVR and GM volume (e.g., anterior cingulate, precuneus), a positive association between GM volume and FDG SUVR (e.g., parietal cortex, precuneus, temporal cortex), and a negative association between PiB and FDG SUVR (e.g., parietal cortex, precuneus, and temporal cortex; Table 2). The positive association between GM volume and FDG SUVR suggests a partial volume effect in these regions known to atrophy in AD. Importantly, the associations between PiB and FDG SUVR survive GM volume adjustment in the parietal and temporal cortices, but only when all subjects are included (Table 2), suggesting that it was driven by the demented DS adults.
Linear regression unstandardized regression coefficients (B±standard error) and Pearson R2 for various linear regression models (e.g., dependent variable with independent variable (ITV adjustment) [Age adjustment]) in each region of interest for the three nested models
*p < 0.007 without adjustment. Parentheses indicate significance after ITV adjustment. Brackets indicate significance after age adjustment.
DISCUSSION
This study demonstrated several important findings about the AD pathophysiological process in this vulnerable population. Decreases in glucose metabolism and GM volume were evident in DS individuals with an elevated Aβ burden compared to those without an elevated Aβ burden, and patterns extended spatially after the onset of dementia. Most importantly, our findings indicate deviation in the early AD pathophysiology in DS as compared to sporadic AD (e.g., striatum dominant Aβ accumulation in DS [26–28, 57]), yet these divergent early pathways result in the same pattern of change in downstream biomarkers of neurodegeneration. The lack of glucose hypometabolism in the striatum despite a striatum-dominant patternof Aβ accumulation has also been observed inADAD [16].
Across subgroups, there were expected changes in PiB SUVR, FDG SUVR, and GM volume that would be expected with AD progression, but small sample sizes precluded significance. GM volume reductions were observed in the anterior cortex (e.g., frontal and insular cortices), which has been implicated in the normal aging process in the DS population [33]. There were negative associations between PiB and FDG SUVR, adjusting for GM volume, inAD-associated regions. Importantly, adjusting for GM volume suggests that the decreases in FDG SUVR were not simply a consequence of GM atrophy (i.e., increased partial volume effect).
The Down syndrome biomarker initiative (DSBI) pilot study investigated amyloid PET, FDG PET, and volumetric MRI in 12 non-demented, mostly PiB(+) adults with DS (30–60 years) [58]. Similar to our results, the ROI-wise results from the DSBI pilot study revealed greater hippocampal atrophy with greater florbetapir SUVR in a composite GM ROI and observed a negative trend between florbetapir and FDG SUVR. Florbetapir SUVR was significantly elevated in the composite GM ROI, but not in the caudate (1.46±0.07) in 3 older subjects (48–55 years). Therefore, there may be differences between florbetapir and PiB binding in subcortical regions. They also found an association in selected measures of cognitive function with FDG SUVR, but not with florbetapir SUVR.
Our results do not reflect an association between the overall level of cognitive function and PiB or FDG SUVR, perhaps due to our predominantly young, PiB(–) sample and our use of a single measure (i.e., PPVT). Our group has previously investigated the associations between specific cognitive abilities and Aβ burden [53, 54]. In 63 non-demented adults with DS (30–53 years), there were associations with PiB SUVR and verbal memory, visual memory, visuospatial construction, attention, and executive functioning after adjustment for mental age, but only with visual memory after adjustment for mental and chronological age [53]. Furthermore, a longitudinal follow up of 53 of those adults with DS after approximately 3 years demonstrated a significant association of global PiB increase and subtle declines in verbal memory, visual memory, visuospatial construction, and fine motor processing speed adjusting for chronological age [54].
Another study of florbetapir PET, FDG PET, and volumetric MRI in the DS population demonstrated voxel-wise group differences between demented (n = 5) and non-demented (n = 12) adults with DS [32]. They found significant voxel-wise differences between diagnostic groups in florbetapir SUVR (non-demented < demented; frontal cortex, temporal cortex, parietal cortex, anterior cingulate, posterior cingulate, precuneus, striatum), FDG SUVR (non-demented > demented; posterior cingulate, lateral parietal cortex, temporal cortex, frontal cortex), and GM volume (non-demented > demented;posterior cingulate, parietal cortex, temporal cortex, and frontal cortex) [32].
Given our small sample (n = 3) of demented adults with DS, we did not have power to identify differences between demented and non-demented adults with DS. Instead, we used a series of nested models to demonstrate the influence of non-demented PiB(+) and demented individuals on the associations between Aβ, metabolism, and GM volume. Similar regions underwent changes in PiB SUVR, FDG SUVR, and GM volume as reported in Sabbagh et al. [32] and those changes are driven by older, PiB(+) or demented participants. A number of other studies have investigated these three biomarkers in the DS population to varying extents [26, 59–63]. As an extension of the current literature, we incorporated information from all three biomarkers into a single multi-modal voxel-wise model, and verified the regional specificity of AD-related neurodegeneration in DS.
Study limitations include the strong correlation of Aβ with age, the lack of longitudinal analysis, and the uncertainty in the extent to which these results are generalizable to the overall AD pathophysiological process (effects of developmental delays vs neurodegeneration). The strong age association makes it difficult to disentangle the effects of normal aging from that of Aβ accumulation in the DS population using a cross-sectional design. Participants are enrolled in a longitudinal study (Neurodegeneration in Aging Down syndrome, NiAD), including amyloid PET, tau PET, FDG PET, volumetric MRI, and comprehensive neuropsychological evaluation. Additional participants and longitudinal follow-up will increase the statistical power and the accuracy of biomarker changes during AD, respectively. Moreover, the AD pathophysiological process is superimposed on the developmental delays that are characteristic of DS. In order to minimize the effect of morphological differences from the general population, we used DS specific spatial normalization and tissue type segmentation templates as well as only performed analysis in individuals with DS.
Conclusion
In this young DS cohort, there were AD-associated neurodegeneration in amyloid positive individuals. Importantly, biomarkers of neurodegeneration were not observed in the striatum, despite the striatum-dominant pattern of Aβ accumulation in DS, suggesting a generalizability of the findings in the same way that findings in ADAD can be generalized to sporadic AD.
Footnotes
ACKNOWLEDGMENTS
We would like to thank the psychologists, project managers (Travis Doran, Renee Makuch, Cathleen Wolfe, David Maloney, and Sarah Clayton), scientists (Jeffrey James), and technologists (Barbara Mueller) at the University of Wisconsin-Madison and University of Pittsburgh-Medical Center and their ADRCs who make this research possible. We would also like to thank the adults with Down syndrome and their families for their time and commitment to further discovery and understanding into the causes of Alzheimer’s disease.
The research is funded by the National Institute of Aging (R01AG031110, U01AG051406) and the National Institute on Child Health and Human Development (U54 HD090256).