
Abstract
Amyloid imaging demonstrates the in vivo presence of amyloid-β (Aβ) deposits in the aging human brain but it is still unknown which structural forms and modifications of Aβ are detected. In Alzheimer’s disease, most amyloid deposits are predominantly composed of Aβ ending at amino acid residues Val40 or Ala42. It has been reported that Aβ40 is largely restricted to neuritic plaques while Aβ42 may be deposited in amyloid plaques of all types, and is often the sole component of diffuse plaques. The distinction is important as it is mainly the neuritic plaques that correlate with cognitive impairment while diffuse plaques may be the initial type of Aβ deposited. Whether PET amyloid ligands such as florbetapir-18F (Amyvid) are partially or wholly selective for brain deposits of Aβ40 or Aβ42 is currently unknown. We compared antemortem florbetapir PET cortical/cerebellar signal intensity (SUVr) of 55 subjects with postmortem biochemical (ELISA) measurements employing specific antibodies against Aβ40 and Aβ42. Spearman’s univariable correlations were significant for both Aβ40 and Aβ42, but were much stronger for Aβ42. Multiple linear regression showed significance only for Aβ42. These results suggest that florbetapir binds only weakly, if at all, to Aβ40. This may be in part due to the higher likelihood for Aβ42 to be present in a β-pleated sheet tertiary structure, or to differences between Aβ40 and Aβ42 in β-pleated sheet tertiary or quaternary structure.
INTRODUCTION
Amyloid imaging has proven to be a useful tool for demonstrating the in vivo presence of amyloid-β (Aβ) brain deposits [1–6] but it is still unknown which of the many structural forms of Aβ are detected. The Aβ peptides are derived from a much larger molecule, the amyloid-β protein precursor, by the concerted endoproteolytic action of the β- and γ-secretases that generate Aβ peptides with N-termini starting at residues 1, 11 (β-cleavage sites), and 17 (α-cleavage site), with C-termini ending at residues 37-43 (γ-cleavage sites), 45, 46 (ζ-site), and 48 and 49 (ɛ-sites) [7, 8]. Additionally, there are a number of post-translational modifications that decrease the solubility of Aβ peptides and increase their resistance to proteolytic degradation [9–12]. Furthermore, Aβ monomers readily aggregate to form dimers, trimers, and oligomers [10, 13–20] that are thought to be intermediate products on the way to forming the nearly-macroscopic, β-pleated sheet masses that are found in brain parenchyma and vascular wall amyloid deposits.
Most amyloid deposits in the Alzheimer’s disease (AD) brain are composed predominantly of Aβ peptides with C-termini at residues 40 and 42 [20, 21]. The relative abundance and morphologies of plaques varies depending on which form is predominant, and also varies between individuals. However, in general, it has been reported that Aβ40 is mainly restricted to neuritic plaque cores (together with Aβ42) and amyloid associated with larger cortical and leptomeningeal blood vessels, while Aβ42 is deposited in neuritic plaques and amyloid plaques of all types as well as vascular amyloid of both larger vessels and capillaries. Diffuse plaques are predominantly composed of Aβ42 as well as N-terminally truncated related forms, including Aβn - 42 and Aβ17–42 [21–25]. The distinction is important as it is mainly the neuritic plaques that have a significant correlation with cognitive impairment [26], while diffuse plaques may be the initial morphological type of Aβ deposited [21, 27]. Alternatively, diffuse and cored amyloid deposits may have time courses and compositions that vary between individuals [23, 24]. Biochemically, only cortical concentrations of Aβ42 have been reported to be significantly correlated with cognition [28]. Whether PET amyloid ligands such as florbetapir (18F) are partially or wholly selective for in vivo deposits composed of either Aβ40 or Aβ42 is currently unknown. We sought to determine, using data and tissue from the FDA-licensing florbetapir clinical trial (Avid Radiopharmaceuticals A07-A16), whether florbetapir PET signal intensity has a differential correlation with Aβ40 or Aβ42.
MATERIAL AND METHODS
Human subjects
Subjects were derived from those described in a previous publication [4], where details of the recruitment, imaging, tissue processing, and analytic methodology are given. Briefly, patients near the end of their lives were recruited from hospice, long-term care, and community healthcare facilities for florbetapir-PET scanning. The inclusion and exclusion criteria were 1) a physician’s assessment that the individual was likely to die within 6 months of study, 2) the absence of any known destructive lesion in the brain (e.g., stroke or tumor), and 3) the individual’s willingness to have florbetapir-PET imaging followed by a brain necropsy at the time of death. One-hundred and fifty-two subjects were injected with florbetapir (18F), of whom three had invalid scans and 9 subjects or their families withdrew consent. Fifty-nine of the remaining 144 subjects died within two years of imaging, were autopsied and neuropathologically examined; 55 of these had frozen left frontal pole brain tissue available for analysis. Local institutional review boards or ethics committees approved the study protocol before initiation. All subjects or their legally authorized representatives gave written informed consent before study procedures were performed.
Florbetapir (18F)-PET imaging methods
The details of the imaging methods have been previously described [4]. Briefly, each subject underwent a 10-min PET scan at 50 min after receiving an intravenous bolus of 370 MBq (10 mCi) florbetapir-18F. Acquired PET scans were reconstructed either by iterative reconstruction with a post-reconstruction Gaussian filter or row action maximum likelihood algorithms to a 128×128 matrix with a zoom of 2.0–2.33. Florbetapir PET images were assessed visually as either positive or negative by five board-certified nuclear medicine physicians blind to each other’s readings and to all clinical and neuropathological data. For each reader, an intense level of tracer uptake in any single cortical region or a significant signal in any two cortical regions was sufficient to classify the entire scan as positive. The majority classification (i.e., choice of at least 3 or 5 readers) was used to classify a case as amyloid positive or amyloid negative by visual read. For quantitative analysis, images were spatially normalized to the MNI atlas space using a florbetapir PET template in SPM [29]. SUVr values were calculated as an unweighted average of six cortical regions (cortical average SUVr: based on mesial orbital frontal, anterior cingulate, precuneus, posterior cingulate, parietal, and temporal) using whole cerebellum as a reference region [30]. Additionally, a left lateral frontal target region, modified from the Automated Anatomical Labeling Atlas [31] was spatially normalized to MNI atlas space and left frontal SUVr values were calculated using the whole cerebellum as a reference region.
Histological assessment
At autopsy, brains were fixed whole in 10% neutral-buffered formalin for 2 weeks prior to dissection and then processed with methods as described in the original full study publication [4], including an immunohistochemical method for Aβ and the Bielschowsky silver method as well as standard methods utilized by the Banner Sun Health Research Institute Brain and Body Donation Program [32]. For the latter, large (3×5 cm) tissue blocks, from standard levels of the frontal (coronal level of the genu of the corpus callosum), parietal (coronal level of the splenium of the corpus callosum) and temporal lobes (coronal levels of the amygdala and body of the hippocampus), were cryoprotected in ethylene glycol and sectioned at 80 μm thickness on a sliding freezing microtome. These sections were stained using the Campbell-Switzer stain, an enhanced, amyloid-selective silver technique, together with the thioflavin-S stain and the tau-pathology-selective Gallyas silver stain [33]. Semi-quantitative estimates of amyloid plaque density, as well as neurofibrillary change density, were obtained from all three cortical regions as well as hippocampal CA1 and entorhinal areas. Scores for “total” plaque density were derived by considering all types of plaques (cored, neuritic, and diffuse) together. Total plaque as well as neuritic plaque density scores were obtained by assigning values of none, sparse, moderate, and frequent, according to the published CERAD templates [34]. Conversion of the descriptive terms to numerical values resulted in scores of 0–3 for each area. The neuritic plaque density was recorded as the greatest density achieved in any of the three neocortical regions while the total plaque density was the sum of scores in all five regions, with a maximum obtainable score of 15. Semi-quantitative scoring was performed blinded to clinical diagnosis by a single observer (TGB).
Aβ40 and Aβ42 quantification
Fresh-frozen frontal lobe gray matter (200 mg) was homogenized in 1200 μl of 90% glass distilled formic acid (GDFA) with an electric grinder (Omni TH, Kennesaw, GA) and incubated for 1 h at 4°C. The GDFA homogenates were centrifuged at 435,000×g in a TLA 120.2 rotor (Beckman Coulter Inc., Fullerton, CA) for 20 min at 4°C. The supernatants were recovered and dialyzed 3 times, for 30 min each against deionized water, then twice for 1 h each against 0.1 M ammonium bicarbonate. The samples were then flash frozen in a dry ice/ethanol bath and lyophilized. The lyophilized material was reconstituted in 1000 μl 5 M guanidine hydrochloride, 50 mM Tris-HCl, pH 8.0 containing a protease inhibitor cocktail (Roche Diagnostics, Mannheim, Germany), shaken for 3 h at 4°C, centrifuged at 435,000×g in a TLA 120.2 rotor (Beckman) for 20 min at 4°C and the supernatant recovered. Total protein determinations were made with Pierce’s Micro BCA protein assay kit. Aβ1-40 and Aβ1-42 were quantified with ELISA kits from Life Technologies Corp. (Grand Island, NY) according to the manufacturers’ instructions.
Statistical analyses
Spearman correlation was initially used to separately probe the relationship between ELISA measures of Aβ40 and Aβ42 and florbetapir-PET SUVr. Mann-Whitney U-tests were used to compare neuritic plaque densities, Braak stages, and ELISA measures of Aβ40 and Aβ42 between subjects classified as positive or negative on florbetapir-PET. Unpaired, two-tailed t-tests were used to compare subject group mean ages, postmortem intervals, total plaque scores, SUVr values, and combined group measures of Aβ1-40 and Aβ1-42. The significance level for all tests was set at 0.05.
To assess the independent association of Aβ40 and Aβ42 with SUVr, log10-transformed data were subjected to multiple linear regression. The normality of model residuals was checked to assess the validity of the regression model, i.e., frontal SUVr = [Aβ40] + [Aβ42]; this showed that the normality requirement was met after the SUVr and ELISA data were log-transformed.
RESULTS
Subject data subdivided by PET imaging status are shown in Table 1. Subject groups differed significantly in terms of left frontal pole/cerebellar SUVr, global cortical/cerebellar SUVr, total and neuritic plaque scores as well as Braak stage, with the PET-positive group having greater values, but did not differ with respect to age, gender distribution, or postmortem interval.
Demographic, PET imaging, and pathology data for subjects studied, subdivided by PET imaging status
Means and standard deviations are given for continuous data while medians are given for ordinal data. Braak stage was not available for two subjects. Tot PLQ, total plaque score; Neur PLQ, neuritic plaque score; Braak, Braak neurofibrillary stage. *p < 0.05, **p < 0.001, ***p < 0.0001.
Representative PET-positive and PET-negative images of left frontal pole are shown in Fig. 1. Nineteen subjects were classified, on the basis of readers’ impressions of the entire cerebral cortex, as PET-negative while 36 were judged to be PET-positive.

Florbetapir PET images (transaxial and coronal views) of a visually and quantitatively examined PET negative scan (A) and PET positive scan (B). The cross-hairs are aligned in the gray matter left lateral frontal region, showing lower intensity as compared to the medial white matter in A, but similar intensity as the medial white matter in B.
Mean concentrations of Aβ42, for all subjects considered together, were significantly greater than those for Aβ40 (133,524 versus 40,246 pg/mg total protein, p = 0.00005). In univariable analyses, the concentrations of both Aβ40 (Fig. 2A) and Aβ42 (Fig. 2B), as well as the sum of their concentrations (Fig. 2C), were significantly associated with frontal pole SUVr; however, the correlations between Aβ42 and SUVr were stronger and more highly significant. The concentration ratio of Aβ40/Aβ42 did not significantly correlate with frontal pole SUVr (Fig. 2D).
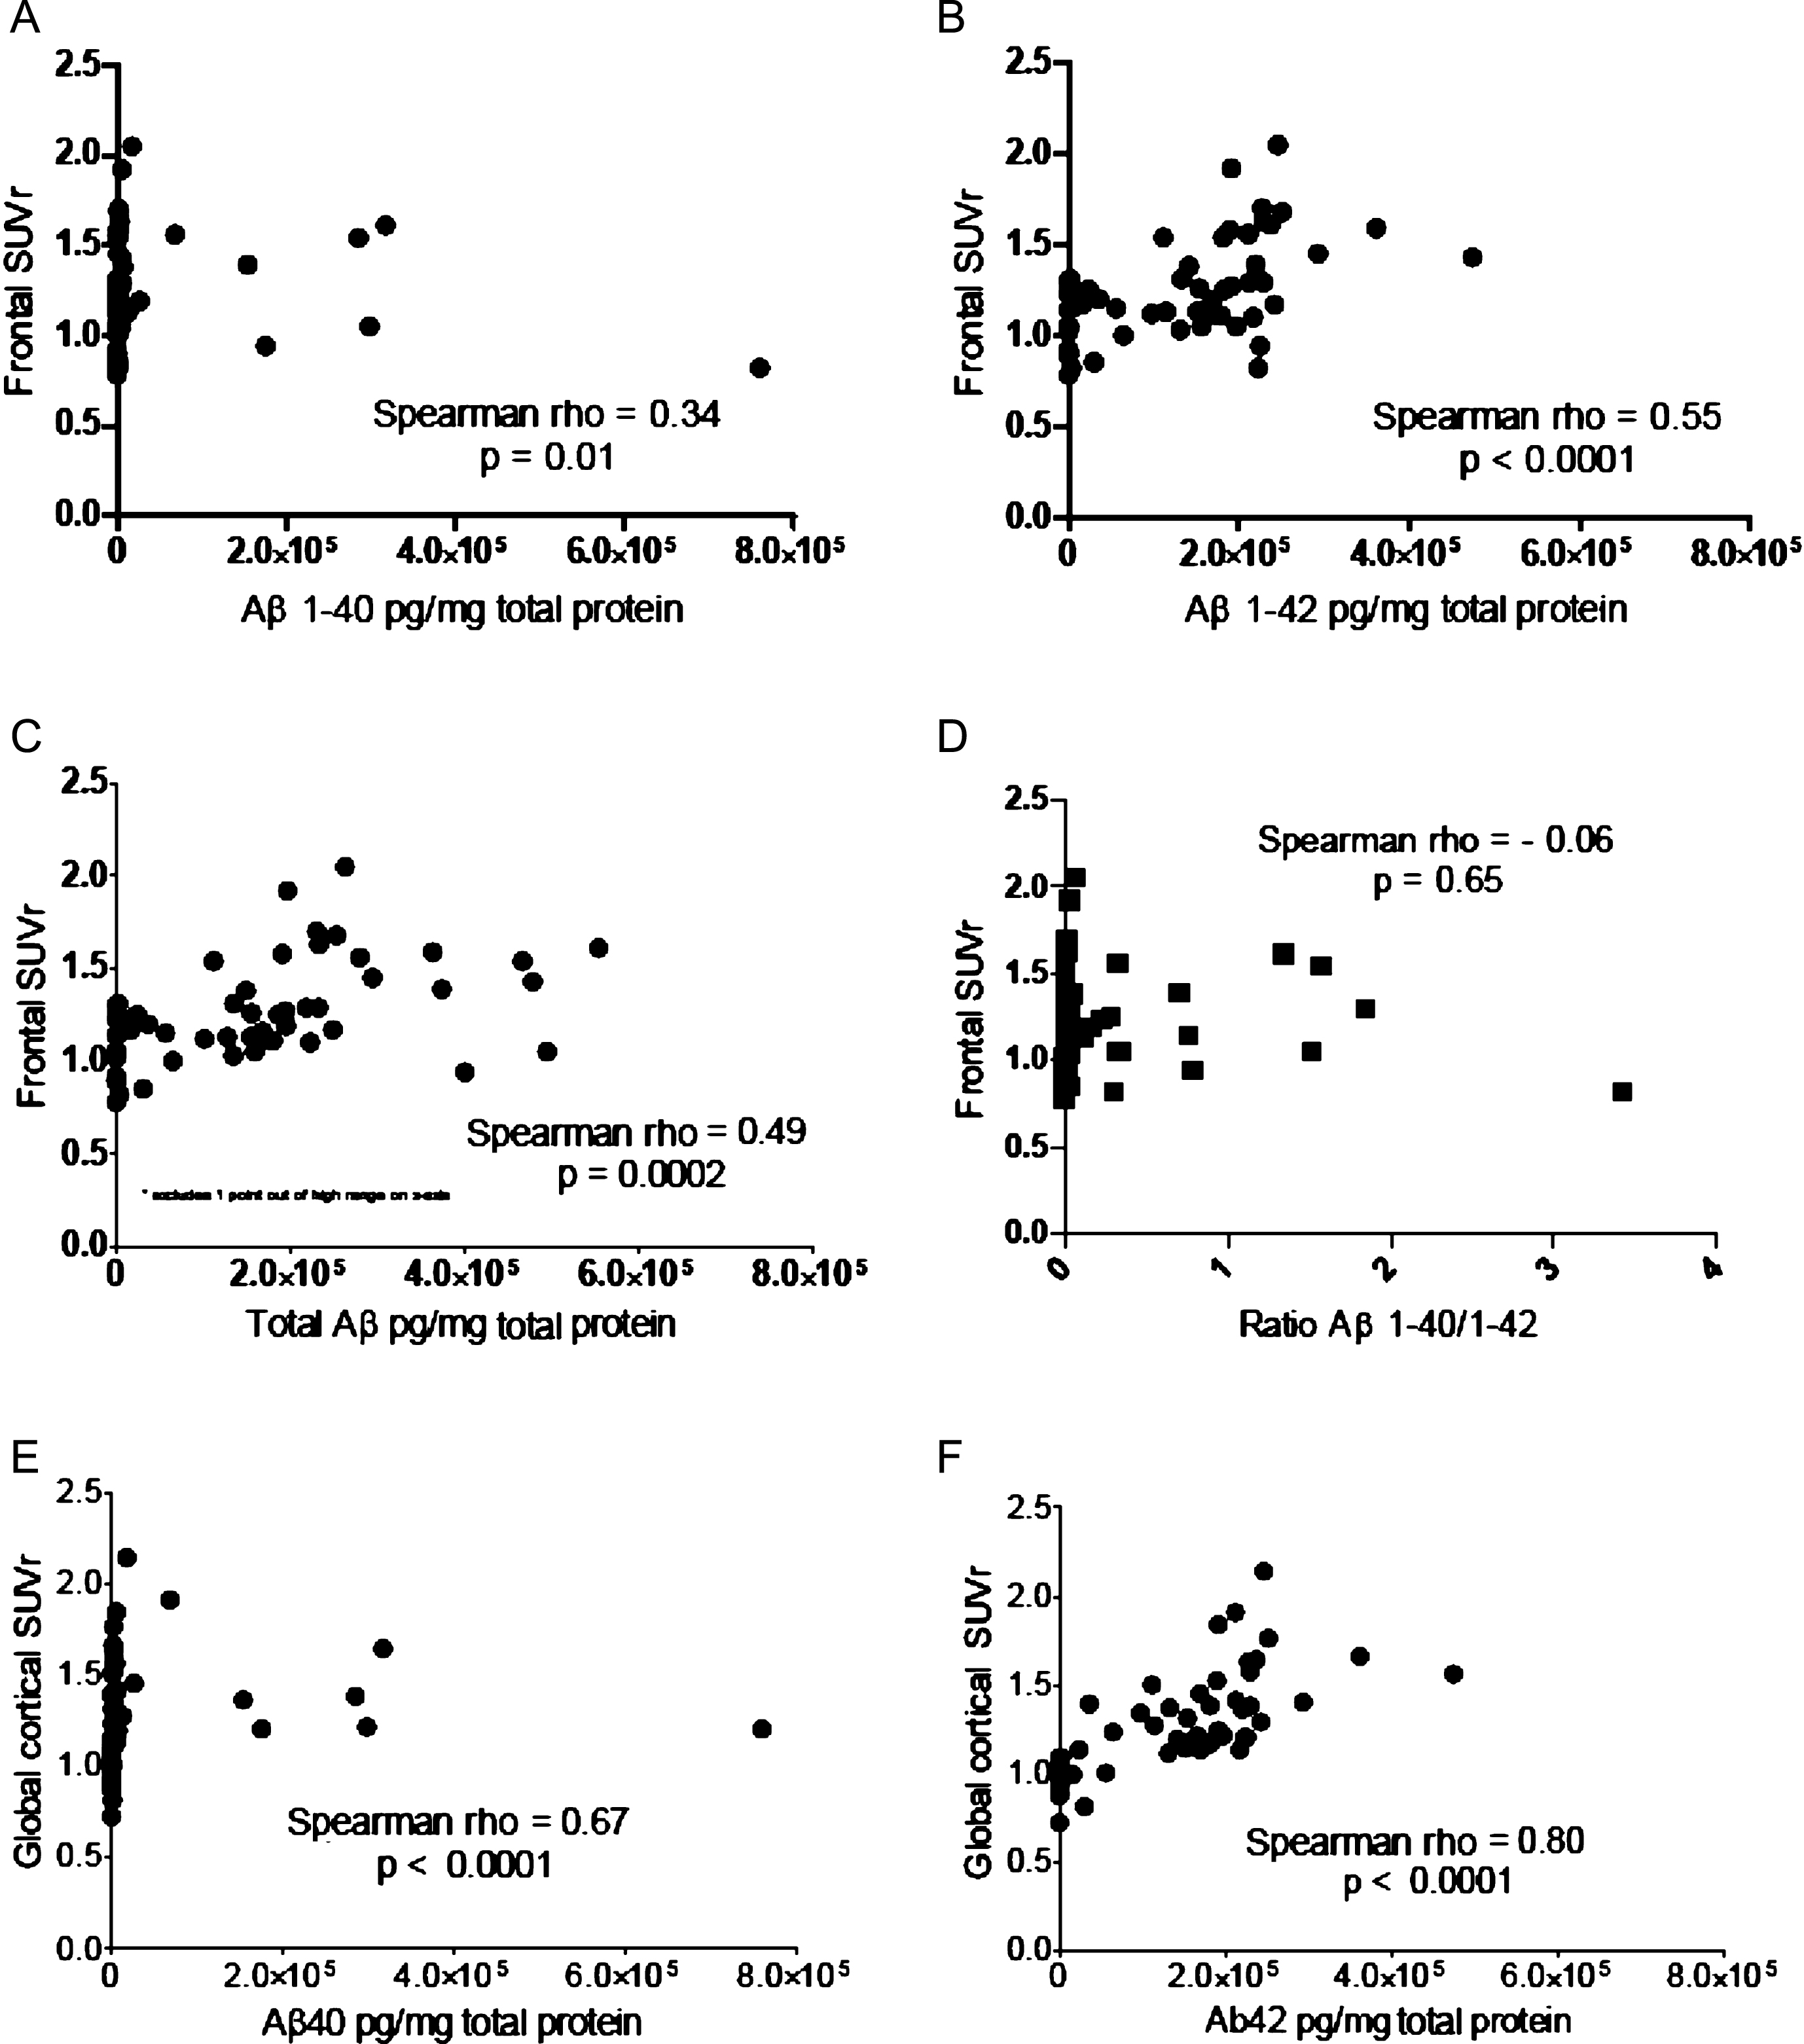
Graphic representation of the analyses done to explore the relationship between florbetapir (18F) PET signal intensity (SUVr) and biochemical measures of Aβ1-40 and Aβ1-42. A) Left frontal pole/cerebellar SUVr versus concentration of Aβ1-40. B) Left frontal pole/cerebellar SUVr versus concentration of Aβ1-42. C) Left frontal pole/cerebellar SUVr versus sum of concentrations of Aβ1-40 and Aβ1-42. D) Left frontal pole/cerebellar SUVr versus concentration ratio of Aβ1-40/Aβ1-42. E) Global cortical/cerebellar SUVr versus left frontal pole concentration of Aβ1-40. F) Global cortical/cerebellar SUVr versus left frontal pole concentration of Aβ1-42.
Correlations with global cortical SUVr (Fig. 2E, F) were stronger than those for frontal pole SUVr (Fig. 2A, B), most likely due to higher variability with the single frontal SUVr estimation, as compared to the global cortical estimation derived from the mean of 6 cortical regions [4].
After log transformation of the ELISA data, the residuals were normally distributed for the model frontal SUVr = [Aβ40] + [Aβ42]. The multiple linear regression model, designed to test the independent contribution of Aβ40 and Aβ42 with SUVr (Table 2), showed significance for Aβ42 (p = 0.033) but not for Aβ40 (p = 0.95).
Parameter estimates for the multiple linear regression model, frontal SUVr = log10 [Aβ40] + log10 [Aβ42]
DISCUSSION
The results indicate that florbetapir (18F) PET signal intensity is significantly correlated with biochemical measures of Aβ42 but not Aβ40. This suggests that florbetapir (18F) PET imaging may primarily reflect the concentrations of Aβ42. The strength and significance of the univariable correlation with Aβ40 was considerably weaker than that for Aβ42, and multivariable regression showed that only Aβ42 had a significant association with frontal SUVr. These results are consistent with the hypothesis that the Aβ40 binding affinity of florbetapir (18F) is much weaker than that for Aβ42.
The possibility therefore arises that subjects with amyloid deposits composed primarily of Aβ40 may generate a proportionately reduced florbetapir (18F) PET signal intensity as compared to subjects with amyloid deposits composed primarily of Aβ42. Our accumulated data as well as information from other studies indicate that Aβ42 in both aging and AD brain tissue is most often present at concentrations several-fold higher than those of Aβ40 [21, 35]. In only 5 subjects in this study did the concentration of Aβ40 exceed that of Aβ42, and four out of 5 of these were judged PET-positive. The single PET-negative subject with Aβ40 predominance was classified as CERAD “not AD”, due to insufficient densities of neuritic plaques and had a global SUVr of 1.08 and low values (<25 pg/mg total protein) for both Aβ40 and Aβ42, consistent with the amyloid negative PET read. However, despite the range of Aβ40 seen in these cases, SUVr did not increase across the PET-positive cases as a function of Aβ40/Aβ42 ratio or total Aβ load (Fig. 2D, C), but instead seemed to be modulated by the Aβ42 burden. It would seem, then, that subjects with predominantly Aβ40 deposition, who are uncommon in the general population, are nevertheless likely to be adequately detected by florbetapir (18F), albeit possibly as a result of adequate levels of Aβ42 in these cases. Of further pertinence to this issue are recent reports that patients treated with the immunotherapy agent, Bapineuzumab, or the γ-secretase inhibitor, semagacestat, have an increased Aβ40/Aβ42 ratio [36, 37]. Further studies are warranted to determine whether this may be a frequent finding after anti-amyloid therapies, and if so, whether it might be of a magnitude that might affect PET amyloid imaging quantification.
There are several possible reasons why florbetapir might bind less avidly to Aβ40 than Aβ42. Florbetapir and other PET amyloid ligands are derived from, or are designed to be structurally analogous to, amyloid-binding compounds established through decades of histological work. As such it is likely that some of these amyloid ligands may display a higher reactive affinity to some forms of amyloid with a higher percentage of β-pleated sheet conformation. In vitro studies have shown that the kinetics of β-pleated sheet generation is faster for Aβ42 and results in a more stable conformation, as compared to Aβ40 [38, 39]. These biophysical attributes may be due to the additional two hydrophobic amino acids at the C-terminal domain of Aβ42. It is also likely that the binding affinity of amyloid ligands will fluctuate with the presence of N-terminal truncations or a variety of posttranslational modifications that are common in AD and aging amyloid deposits [9, 40–44]. Whether the observed differences between Aβ40 and Aβ42 association with florbetapir PET SUVr result from conformational changes imposed by these or other structural alterations remains to be elucidated.