
Abstract
The feasibility of assaying plasma phosphorylated tau protein (threonine 181), denoted p-tau181, using immunomagnetic reduction (IMR) is explored. The reagent for assaying p-tau181 with IMR was synthesized, and its analytic performances were characterized. Seventy-three subjects were recruited. Each participant was examined with neuropsychological tests, magnetic resonance imaging, and IMR assay for plasma p-tau181. Using commercially available IMR kits, the plasma total tau protein (T-tau) of each subject was assayed. The dynamic range for assaying p-tau181 using IMR was 1.96×10⁻² pg/ml to 104 pg/ml. There was no significant interference from total tau protein in the assay of p-tau181. The measured concentrations of plasma p-tau181 were 2.46±1.09 pg/ml for healthy controls, 4.41±1.85 pg/ml for MCI due to AD, and 6.14±1.59 pg/ml for very mild AD. Meanwhile, the measured concentrations of plasma T-tau were 18.85±10.16 pg/ml for healthy controls, 32.98±10.18 pg/ml for MCI due to AD, and 37.54±12.29 pg/ml for very mild AD. A significant difference in plasma p-tau181 was observed between healthy controls and MCI due to AD (p < 0.001) and between MCI due to AD and very mild AD (p < 0.001). However, for the plasma T-tau concentration, a significant difference existed only between healthy controls and MCI due to AD (p < 0.001). This implies that the plasma p-tau181 level is correlated more to AD severity than plasma T-tau is. Additionally, p-tau181 was observed as approximately 14% of T-tau in human plasma.
Keywords
INTRODUCTION
Alzheimer’s disease (AD), which is characterized by symptoms such as memory disorders and cognitive decline, is the most common neurodegenerative disease [1–4]. The pathological hallmarks of AD are amyloid plaques and neurofibrillary tangles (NFTs) [5–8]. NFTs occur as a result of neuronal/axonal death. They release microtubule-associated proteins, including mainly tau protein. Studies have shown that the amount of total tau protein (denoted as T-tau) in cerebrospinal fluid (CSF) is increased when a patient suffers from AD [9–12]. Biologically, neuronal/axonal death in AD is due to the hyperphosphorylation of tau protein, which is referred as to p-tau [7, 13]. Therefore, p-tau is directly correlated to neuronal/axonal degeneration. In addition to T-tau, p-tau is a potential biochemical marker for the early detection of AD. There are several forms of p-tau, depending on the phosphorylated epitopes, and they include threonine 181, serine 199, threonine 231, serine 235, serine 396, and serine 404 [14–17]. Many ELISA methods have been used to assay these forms of p-tau in human CSF. Regardless of the form that p-tau takes, the p-tau level in CSF for healthy subjects or AD patients is several tens of pg/ml [18, 19]. It is worth noting that the CSF p-tau level in patients with AD is significantly higher than that in healthy controls. There is a clear difference in the CSF p-tau levels between AD and other types of dementia [20–23]. CSF p-tau detection could increase the sensitivity and specificity of AD diagnosis. Therefore, feasibility studies to assay p-tau in CSF to diagnose AD in clinical practice have been the subject of research for a decade.
The most important problem when assaying biomarkers in CSF for clinical practice is the lumbar puncture, which is risky and uncomfortable. An alternative assay that is more cost-efficient, saves time, and carries a low risk is urgently required for clinical tests. Drawing blood is efficient, but similar to amyloids and tau protein, the levels of p-tau are much lower in blood than in CSF [24, 25]. The current ELISA methods are not sufficiently sensitive to assay p-tau in human blood. Assaying p-tau in blood requires an extremely sensitive assay.
In 2006, immunomagnetic reduction (IMR) was developed as an ultra-sensitive immunoassay [26]. IMR uses antibody-functionalized magnetic nanoparticles to specifically label the biomarkers that are to be detected. High-temperature superconducting-quantum-interference-device magnetometers are used to detect the reduced signal from the alternative-current magnetic susceptibility of nanoparticles due to the nanoparticle-biomarker association. It has been shown that the low-detection limit for assaying amyloid-β (Aβ) or T-tau is lower than pg/ml, which is sufficiently sensitive to quantitatively detect Aβ and tau protein in human plasma [27, 28]. According to the literature [27, 28], the concentrations of Aβ and tau protein in human plasma range from 1 to 100 pg/ml. The plasma Aβ1 - 42 and tau protein levels are higher in patients with AD than they are in healthy subjects [29]. The concentration product of Aβ1 - 42 and tau protein in human plasma is 80% correlated to the clinical diagnosis of patients with mild cognitive impairment (MCI) due to AD or AD [28]. IMR is extremely sensitive and feasible for use in assaying AD-related biomarkers in plasma. This study determines the feasibility of using IMR to assay plasma p-tau, which is expected to be present in extremely low concentrations. The reagent that is used in IMR to assay p-tau is synthesized. The tau protein with a phosphorylated epitope at threonine 181, which is referred as to p-tau181, is the subject of this work. The assay of p-tau181 utilizing IMR is characterized. The IMR p-tau181 reagent is used to assay p-tau181 in human plasma from healthy subjects, patients with MCI due to AD, and patients with very mild AD. Moreover, each participant was examined with plasma T-tau using commercially available IMR kits.
MATERIAL AND METHODS
Preparation of IMR reagent for assaying p-tau181
The reagent consisted of dextran coated Fe3O4 magnetic nanoparticles (MF-DEX-0060, MagQu) that were functionalized with antibody against phosphorylated tau protein at threonine 181 (MN1050, Thermo Fisher Scientific Inc.). The antibody was covalently bonded to the dextran shell of the magnetic nanoparticles. The hydrodynamic diameters for the antibody-functionalized magnetic nanoparticles were determined using laser dynamic scattering (SZ-100-S, HORIBA). The results are shown in Fig. 1 and show a mean value of 53.4 nm and a standard deviation of 10.7 nm. The nanoparticles were dispersed in ddH2O. The magnetic concentration of the reagent was 8 mg-Fe/ml. This was detected using an alternative-current magnetosusceptometer (XacQuan, MagQu). The reagent for assaying p-tau181 is referred to as p-tau reagent. Although the p-tau reagent has been commercialized (MF-PAT-0060, MagQu), the assay characterizations have not been reported.
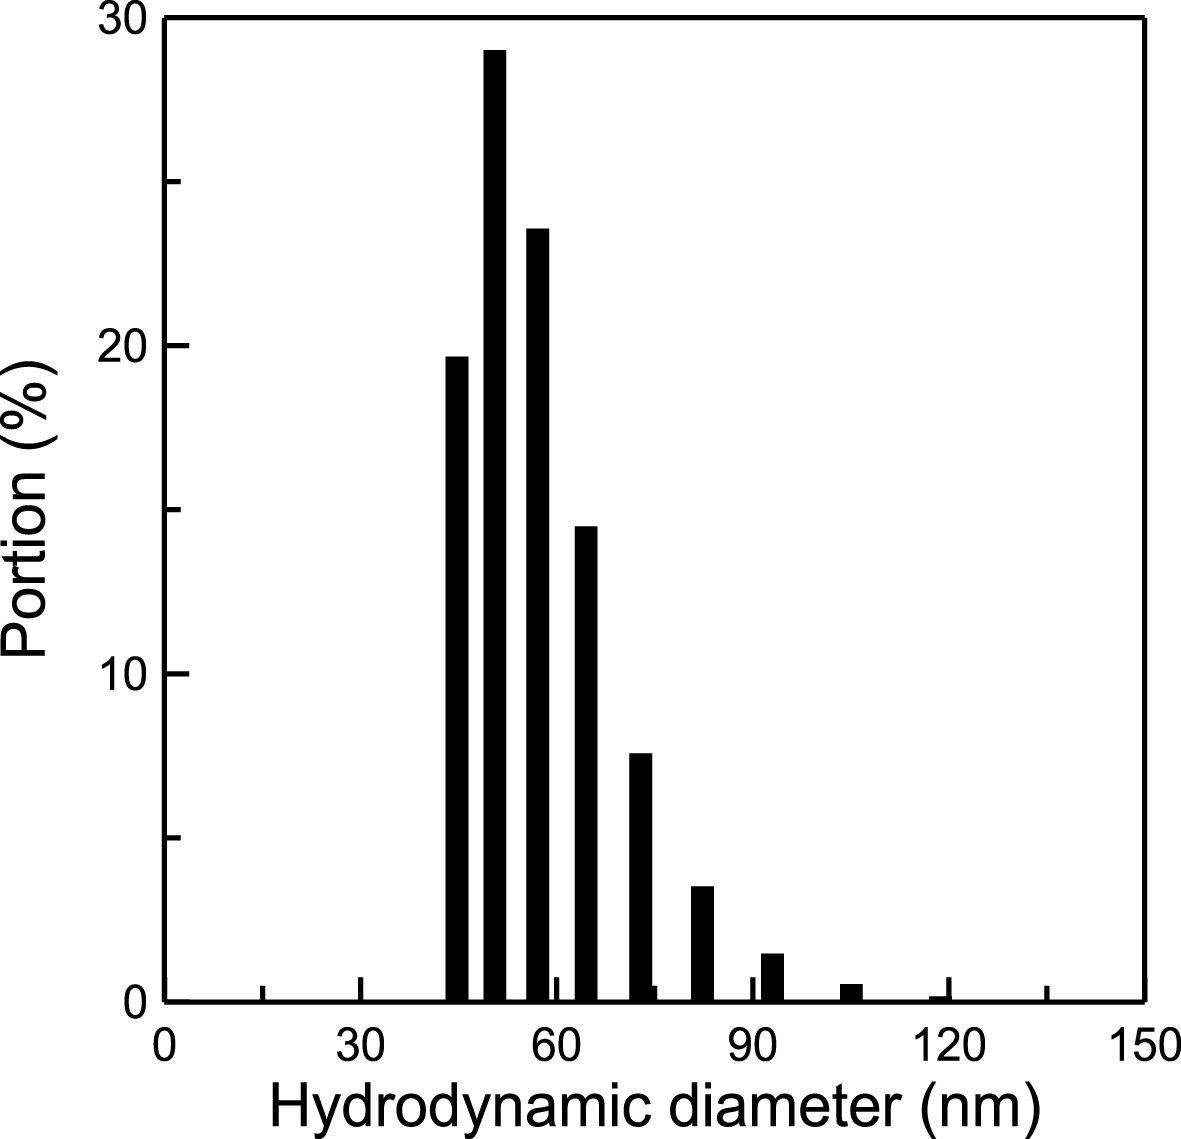
Distribution of the hydrodynamic diameter of dextran-coated Fe3O4 magnetic nanoparticles functionalized antibodies against p-tau181.
Enrollment of subjects
This study was approved by the ethics committee of the university hospital (Nos. 201103059RB, 201301036RIND, and 201406125DSC). Healthy subjects were recruited through advertisements, and most were from the families of patients. These healthy subjects were surveyed for history of diseases, such as hypertension, renal dysfunction, liver disease, cardiac disease, etc. Furthermore, all the healthy subjects were examined with creatinine, ante cibum before meals, free thyroxine4, high-sensitivity thyroid stimulating hormone, vitamin B12, folic acid, homocysteine, serologic test for syphilis, white blood cell, red blood cell, hemoglobin, mean corpuscular volume, mean corpuscular hemoglobin, mean corpuscular hemoglobin concentration, and platelet count. In addition, the healthy subjects were examined with electrocardiograph (EKG). Patients were enrolled at the clinics of the National Taiwan University Hospital and gave informed consent. All patients were also examined with the same biochemical analysis and EKG as those for the healthy subjects. No matter whether healthy controls or patients, the subjects showing normal levels of biochemical analytes and normal patterns of EKG were enrolled. T1-weight magnetic resonance imaging (MRI) was performed for each enrolled subject to exclude subjects with either of brain ischemia, brain injury, or brain tumor. The neuropsychological test battery assessed subjects’ memory, executive function, attention, visuospatial function, and psychomotor speed. The tests included the Wisconsin Card Sorting Test, Color Trail Tests I and II, two subtests of the Wechsler Memory Scale Version III (logical memory and visual reproduction), subtests of the Wechsler Adult Intelligence Scale Version III (digital span, matrix reasoning, block design and digital symbol substitution) and a semantic verbal fluency test [30]. All of the participants also completed a questionnaire for the Geriatric Depression Scale and those who scored greater than 8 were excluded. Subjects with major systemic diseases possibly affecting cognitive function, such as cardiopulmonary failure, hepatic or renal failure, poor control diabetes (HbA1C >8.5), head injury, stroke, or other neurodegenerative disease, were excluded. In this work, seventy-three subjects were recruited. The clinical criteria used to assign subjects as healthy controls, MCI due to AD, or very mild AD are listed in Table 1. According to the results of the clinical diagnosis, 23 subjects were healthy controls (age: 67.5±7.1 years), 29 subjects were MCI due to AD (age: 71.0±8.7 years), and 21 subjects were very mild AD (age: 78.8±7.9 years). The demographic information for the enrolled subjects is listed in Table 2. The clinical results for dementia ranking (CDR) and Mini-Mental State Examination (MMSE) are also shown in Table 1. The MMSE was 28.4±1.6 for healthy controls, 24.1±3.6 for MCI due to AD, and 21.7±3.7 for very mild AD. Significant decreases in MMSE from healthy controls to MCI due to AD (p < 0.001) and to very mild AD (p < 0.05) were observed. The diagnosis for each subject is made by one neuropsychologist and one or two neurologists. The neuropsychologist and neurologists joined in this study have more than ten-year experience in clinical practices.
Clinical criteria for assigning subjects to healthy controls, MCI due to AD, or very mild AD in this study
CDR, Clinical Dementia Ranking; MMSE, Mini-Mental State Examination; WEMS-III, Wechsler Memory Scale Version III.
Demographic information of subjects enrolled in this study
CDR, Clinical Dementia Ranking; MMSE, Mini-Mental State Examination. #p < 0.001 between healthy control and MCI due to AD; p < 0.05 between MCI due to AD and very mild AD.
Preparation of human plasma samples
Subjects provided a 10-ml non-fasting venous blood sample (K3 EDTA, lavender-top tube). Each sample was blindly presented to colleagues in the laboratory. The blood samples were centrifuged (1500–2500 g for 15 min) within 1 h of drawing blood, and plasma was aliquoted into cryotubes and stored at –20°C.
Measurements of IMR signals
For each IMR measurement, 80 μl of the reagent was mixed with 40 μl of the sample. The percentage reduction in the alternative-current magnetic susceptibility for the reagent due to association with the nanoparticle-p-tau181 represented the biomarker concentration, which was the IMR signal and denoted as IMR(%). In the experiment, the IMR signal was detected using an IMR analyzer (XacPro-S, MagQu). Duplicate IMR measurements were performed for each sample. The reagent for assaying plasma p-tau was synthesized in this work. The T-tau reagent was a commercial product (MF-TAU-0060, MagQu). The antibody used in the IMR tau reagent acted against the C terminus of total tau protein, so all six isoforms of tau protein can be detected.
RESULTS
p-tau181-concentration-dependent IMR signals
Several solutions spiked with various concentrations of human p-tau181 (KHO0631, Invitrogen) ranging from 0.001 pg/ml to 10000 pg/ml were subjected to IMR measurements. The detected IMR signal is shown as a function of p-tau181 concentration, i.e., IMR(%) versus φp - tau181, in Fig. 2. The error bar for each data point is derived using the duplicate measurements of IMR signals. The IMR signal increases as the concentration of φp - tau181 increases from 0.001 pg/ml and becomes almost saturated when φp - tau181 reaches a concentration of 10000 pg/ml. The φp - tau181 dependent IMR(%) exhibits typical sigmoid behavior and obeys the four-parameter logistic function:
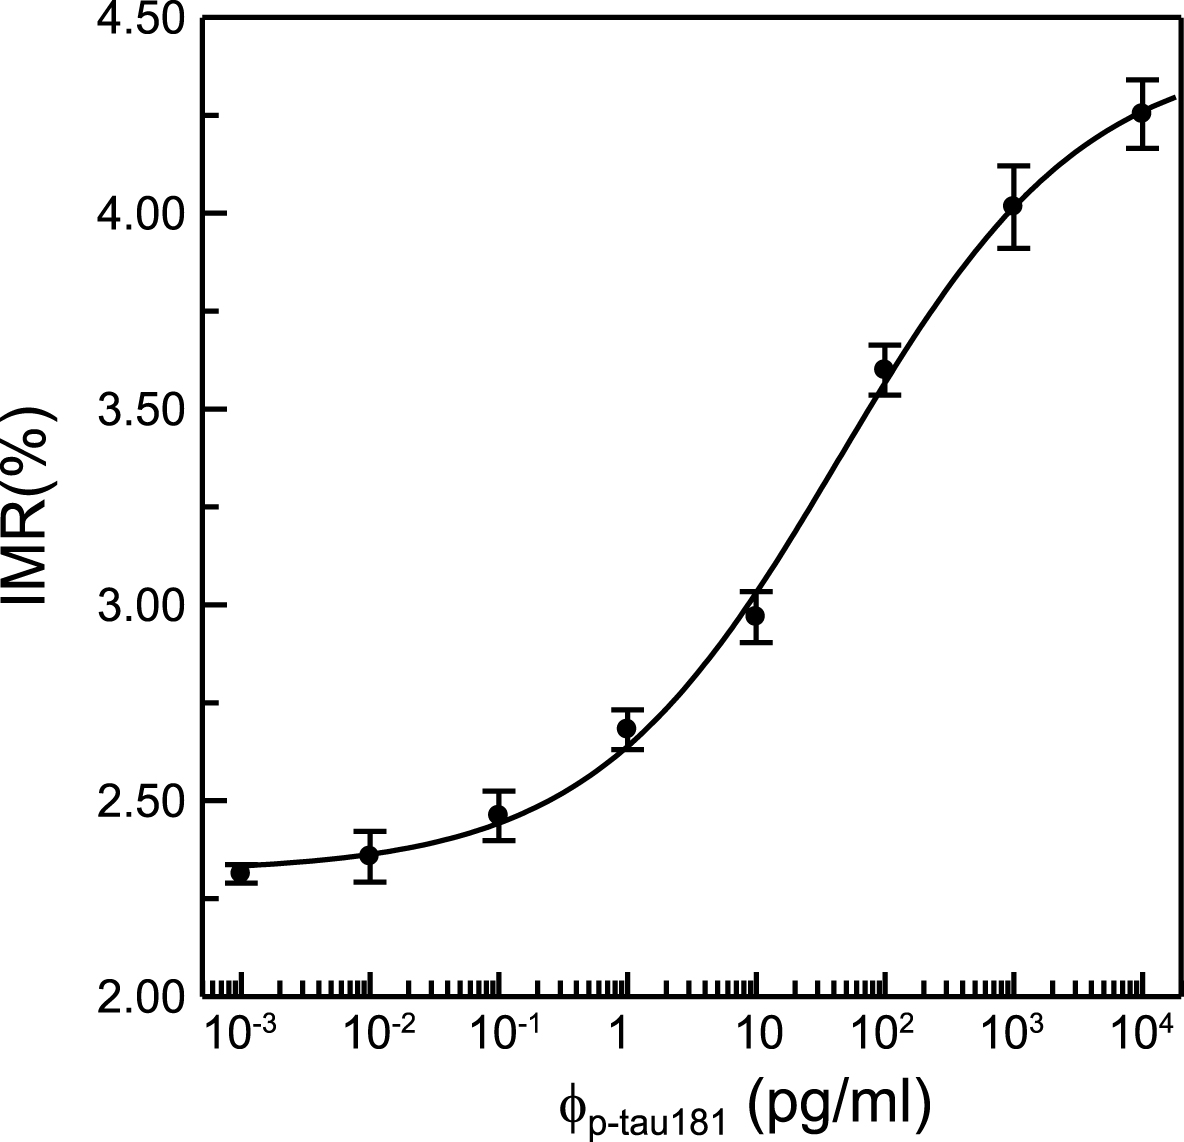
IMR signal as a function of the concentration of spiked p-tau181. The solid line is the fitting curve using Equation (1).
Low-detection limit for the assay of p-tau181
The global standards of the assay detection limit are described in CLSI EP17-A2, which provides guidance for evaluating the detection capacity of clinical laboratory measurement procedures (i.e., limit of blank and detection). According to CLSI EP17-A2, the limit of blank (LoB) should be established first, and the limit of detection (LoD) can then be found. LoB is established as follows: the measurements are ordered according to their values, and the appropriate percentile (per.) is estimated as the value of the observation with the rank value determined below; in this case, per. = 0.95:
This is a non-integer value. The distribution of 25 testing results has a non-Gaussian distribution. Linear interpolation is performed using the 24th and 25th ranked observations according to CLSI EP17-A2. The 25 measured concentrations for PBS samples that are not spiked with p-tau181 (i.e., blank samples) are ranked in Table 3. Using the 24th and 25th ranked concentrations for the linear interpolation, the 24.25th concentration indicates that the measured concentration is 0.0028 pg/ml, which is the value of LoB for using the p-tau181 reagent with IMR to assay p-tau181 in PBS.
Ranking list of the 25 measured p-tau181 concentrations for PBS samples not spiked with p-tau181 using the IMR p-tau181 reagent
The limit of detection (LoD) is calculated via
where σS is the standard deviation of the measured p-tau181 concentrations of PBS samples spiked with a given p-tau181 concentration (e.g., 0.01 pg/ml in this study). The p-tau181 concentrations of 25 p-tau181-PBS samples were measured using the p-tau181 reagent with IMR. The measured concentration for each sample is listed in Table 4. The mean measurement of the 25 measured concentrations is 0.0993 pg/ml. The σS of the 25 measured concentrations is 0.0101 pg/ml. The LoD for assaying p-tau181 is 0.0196 pg/ml using Equation (4).
List of the 25 measured p-tau181 concentrations for PBS samples spiked with 0.1 pg/ml p-tau181 using the IMR p-tau181 reagent
Dynamic range for the assay of p-tau181
The measured IMR signals for the data points in Fig. 2 are converted into measured p-tau181 concentrations (denoted φp - tau181,IMR) via Equation (1). The relationship between the measured p-tau181 concentration and the spiked p-tau181 concentration is shown in Fig. 3. It is worth noting that since the spiked p-tau181 of 0.001 pg/ml is lower than the low-detection limit, the measured p-tau181 concentration is trivial and is not plotted in Fig. 3. The relationship between φp - tau181,IMR and φp - tau181 is proportional and is shown using a solid line. The slope of the φp - tau181,IMR-φp - tau181 curve is 0.906. According to the requirements of assay linearity in 510k of the US Food and Drug Administration, an acceptable value for the slope is from 0.9 to 1.1. In this case, the slope in Fig. 3 is 0.906, which meets this requirement. Therefore, the dynamic range for assaying p-tau181 using IMR is from 1.96×10⁻² pg/ml to 104 pg/ml.
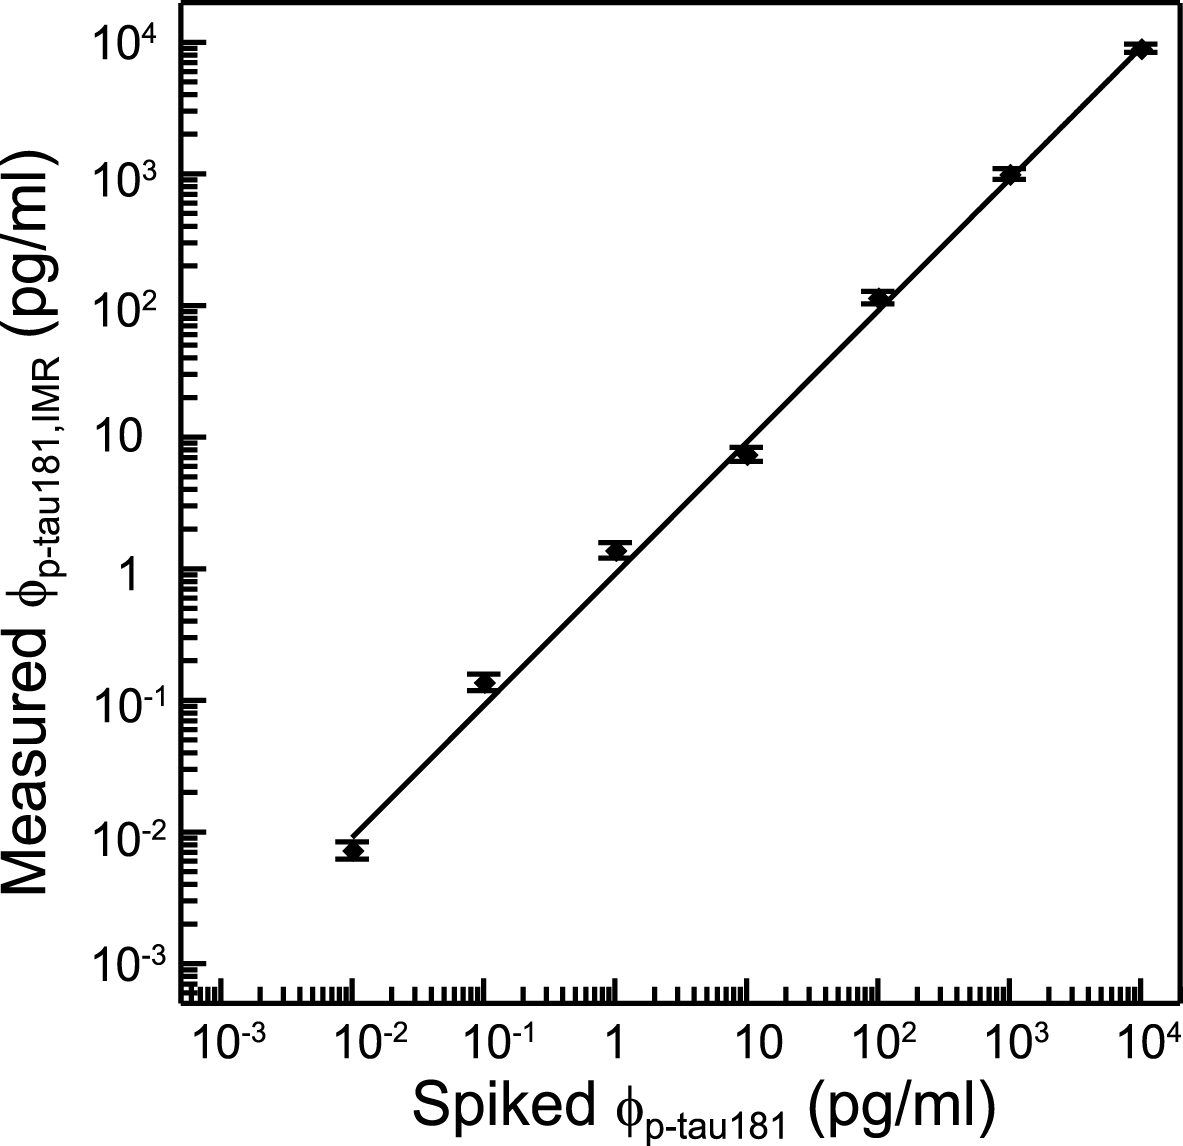
Measured concentration using IMR versus spiked concentration of p-tau181.
Interference of total tau protein in the assay of p-tau181
To account for any non-specific IMR signals due to total tau protein (T-tau) using the p-tau181 reagent, three samples were prepared, as shown in Table 5. Sample No. 1 was phosphate buffered saline (PBS) solution, which was used as a negative control. Sample No. 2 was pure p-tau181 at 10 pg/ml in PBS solution. Sample No. 3 was a mixture of 10-pg/ml p-tau181 and 100-pg/ml T-tau in PBS solution. The T-tau consisted of six isoforms of tau protein. The three samples were subjected to IMR measurement with p-tau181 reagent. The detected IMR signals and the converted p-tau181 concentrations via Equation (1) for the samples are shown in Table 5. The IMR signal for the PBS solution is lower than the low-detection limit. A non-trivial IMR signal was obtained for the PBS solution. Samples No. 2 and 3 show equivalent IMR signals and p-tau181 concentrations. Using the p-tau181 concentration of Sample No. 2 as a reference, the recovery rate for the measured p-tau181 concentration for Sample No. 3 is calculated to be 1.004, so there is no significant interference from T-tau in the assay of p-tau181. The results in Fig. 3 and Table 5 show that the IMR is highly sensitive and highly specific for the assay of p-tau181 and quantifies p-tau181 in human plasma.
Detected IMR signals and concentrations of p-tau181 for PBS, pure 10 pg/ml p-tau181 solution, and the 10 pg/ml p-tau181 solution with 100 pg/ml T-tau
+The ratio of mean values of φp - tau181,IMR’s of Sample No. 2 to Sample No. 3.
Quantification of p-tau181 in human plasma
Seventy-three subjects were recruited for the feasibility study of assaying p-tau181 in human plasma using IMR. The demographic information for the enrolled subjects is listed in Table 2. There is a significant increase in CDR score and a decrease in MMSE in subjects with more severe memory disorder/cognitive decline. The concentration of p-tau181 in plasma, φp - tau181,IMR, increases from the healthy controls, to patients with MCI due to AD and to patients with very mild AD. The dot plot for the measured concentrations of plasma p-tau181 for each subject is shown in Fig. 4. The healthy controls have a plasma p-tau181 of 2.46±1.09 pg/ml. The plasma p-tau181 level increases significantly to 4.41±1.85 pg/ml for patients with MCI due to AD (p < 0.001). The plasma p-tau181 level increases further to 6.14±1.59 pg/ml for patients with very mild AD (p < 0.001). Alternatively, the healthy controls have a plasma T-tau, φT - tau,IMR, of 18.85±10.16 pg/ml, as shown in Fig. 5. The plasma T-tau concentration for patients with MCI due to AD is 32.98±10.18 pg/ml, which is significantly higher than that of healthy controls (p < 0.001). The plasma T-tau level for patients with very mild AD is 37.54±12.29 pg/ml. There is no significant difference in plasma T-tau between MCI due to AD and very mild AD.
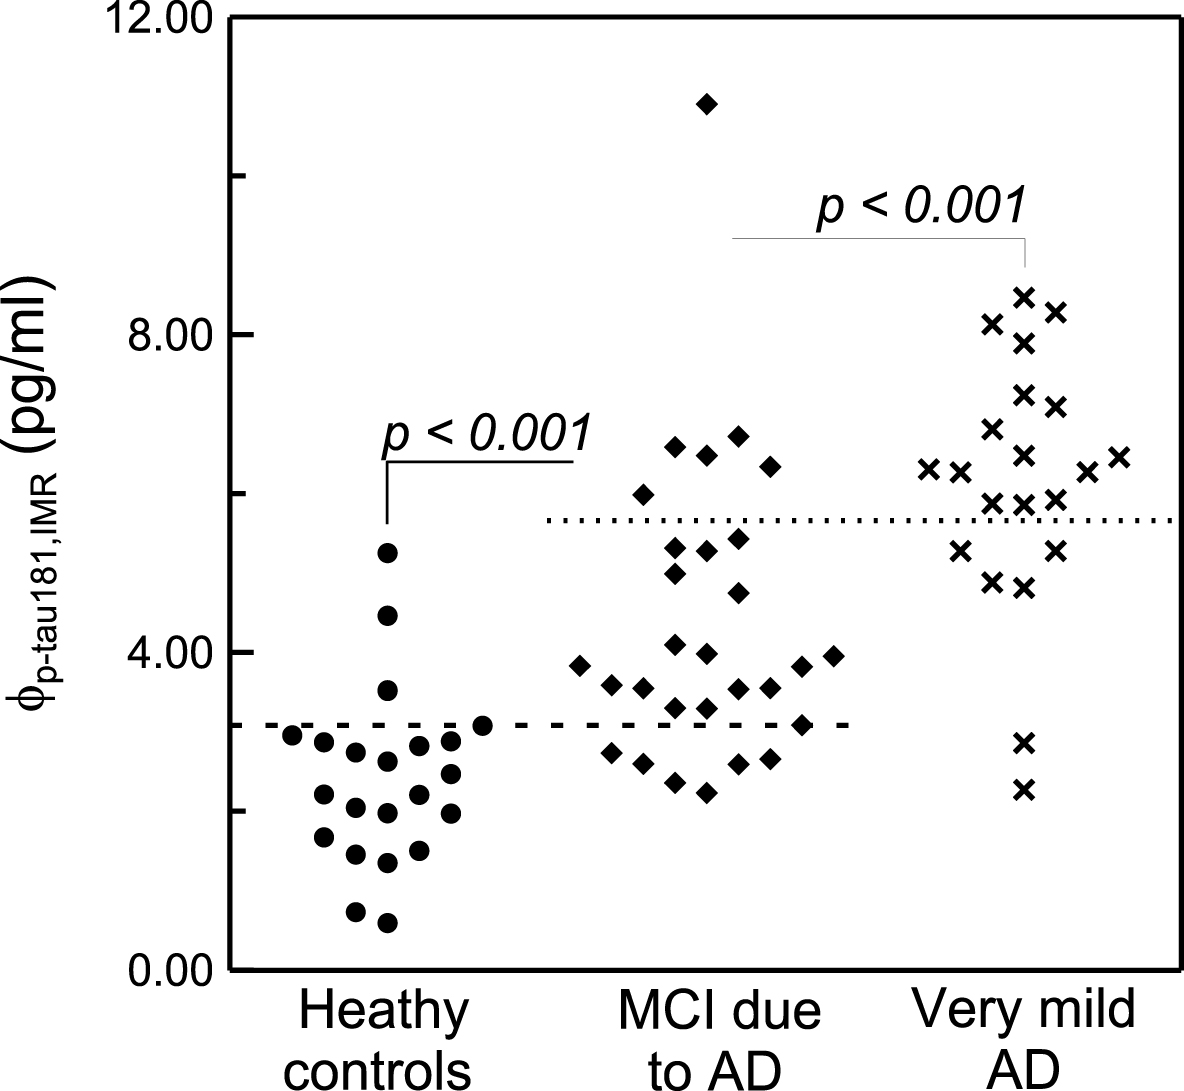
Measured concentrations of φp - tau181,IMR in plasma for subjects with normal cognition or memory/cognitive disorders.
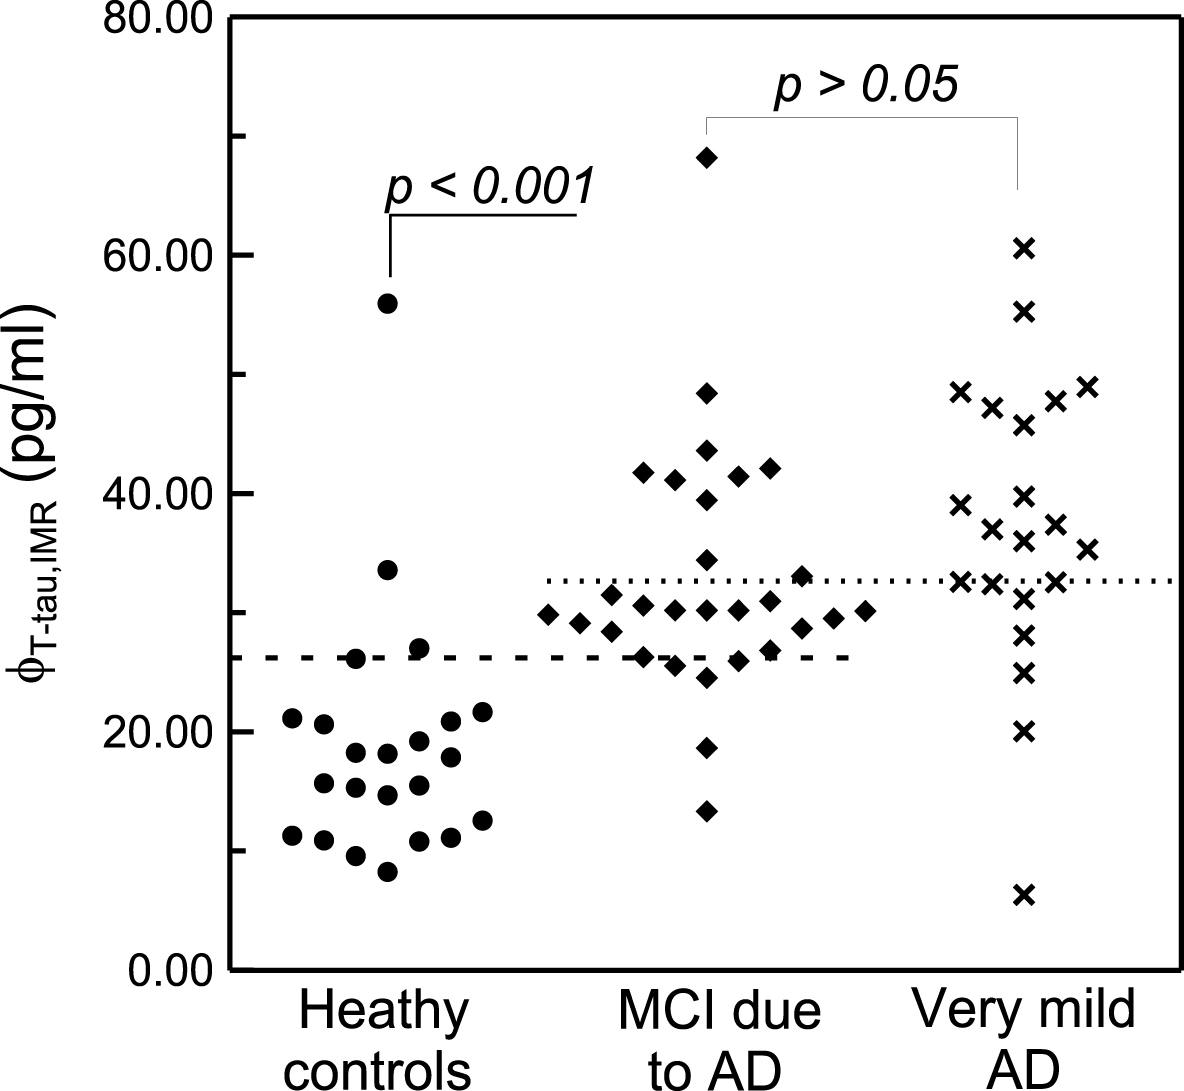
Measured concentrations of φT - tau,IMR in plasma for subjects with normal cognition or memory/cognitive disorders.
Tatebe et al. recently applied a technology called single molecule assay (SIMOA) to assay the plasma p-tau181 concentrations in healthy controls and AD patients [31]. The plasma p-tau181 levels were 0.0405±0.0756 pg/ml and 0.171±0.166 pg/ml for healthy controls and AD patients, respectively. As observed in this study, a clear elevation in the plasma p-tau181 level was also found for AD patients compared to healthy controls in Tatebe’s study. However, the p-tau181 level detected in Tatebe’s study is much lower than in this study. The difference in the detected p-tau181 levels in human plasma may be attributed to the assay methods. SIMOA utilizes magnetic nanoparticles to purify plasma p-tau181 molecules (or to concentrate p-tau181 molecules). This process usually causes a loss of p-tau181 molecules. IMR is a direct measurement of plasma p-tau181 molecules. Hence, the levels of plasma p-tau181 molecules detected with SIOMA would be lower than that of IMR. A higher level of protein detected with IMR than SIMOA was also observed for the assay of T-tau in human plasma [32].
DISCUSSION
To determine the significance of the difference in plasma p-tau181 among healthy controls, MCI due to AD and very mild AD, a t-test of the measured plasma p-tau181 concentrations, φp - tau181,IMR, was performed. There is a clear difference in the plasma p-tau181 concentration between healthy controls and patients with MCI due to AD (p < 0.001). There is also a significant difference in plasma p-tau181 between patients with MCI due to AD and patients with very mild AD (p < 0.001).
Through a careful inspection of the subjects’ ages in Table 2, healthy controls are statistically younger than patients with MCI due to AD and very mild AD (p < 0.001). Age might thus be a key factor increasing the plasma p-tau181 level in patients compared to healthy controls. To clarify this point, the detected concentration of plasma p-tau181 as a function of age from 56 to 81 years old in healthy controls is plotted in Fig. 6. Two subjects show relatively higher concentrations, but the others show concentrations of plasma p-tau181 lower than 4 pg/ml. Excluding the two higher p-tau181 concentrations, there is no significant variation in p-tau181 concentration with age (Pearson correlation coefficient r = 0.095, p > 0.05). The linearity is plotted with the dashed line in Fig. 6. Even when considering the two higher concentrations of plasma p-tau181, the Pearson correlation coefficient r between the p-tau181 concentration and age is 0.389 (p > 0.05). The linearity is plotted with the solid line in Fig. 6. Hence, for healthy subjects older than 56 years, the p-tau181 concentration in human plasma is weakly correlated to age. Although healthy controls are statistically younger than MCI due to AD and very mild AD, age is not a dominant factor in the difference in the plasma ptau-181 level between healthy controls and AD patients.
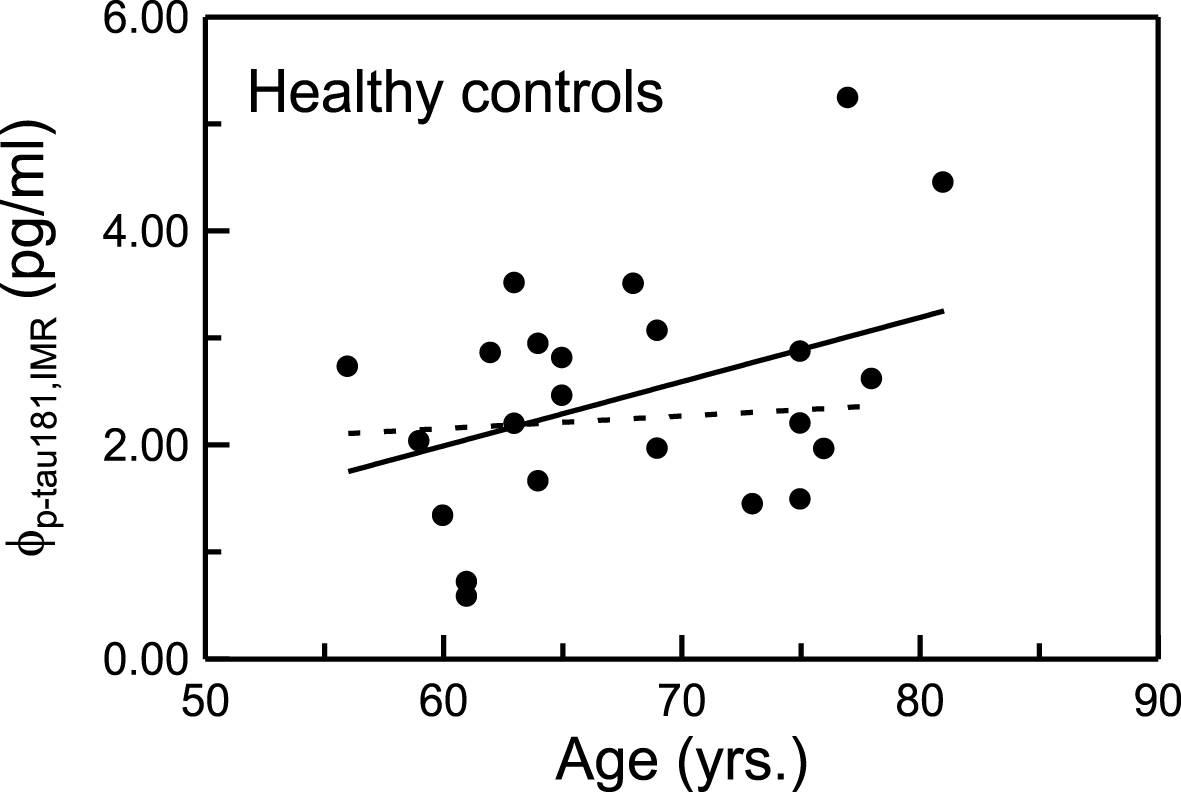
Age-dependent p-tau181 levels in human plasma in healthy controls.
Figure 7a plots the receiver operating characteristics (ROC) analysis for the data shown in Fig. 4. The cut-off value of plasma p-tau concentration to discriminate healthy controls and MCI due to AD was 3.08 pg/ml, which resulted in a clinical sensitivity and specificity of 0.793 and 0.836. The area under curve in Fig. 7a was 0.855. The cut-off value of 3.08 pg/ml is plotted with the dashed line in Fig. 4. The ROC curve for differentiating MCI due to AD from very mild AD using plasma p-tau level is shown in Fig. 7b. The cut-off value was 5.66 pg/ml, which was plotted as a dot line in Fig. 4. The clinical sensitivity, specificity, and area under curve were 0.714, 0.793, and 0.777, respectively. Therefore, the level of plasma p-tau181 can be used not only to discriminate healthy controls from MCI due to AD or very mild AD but also to categorize the disease severity in early-stage AD.
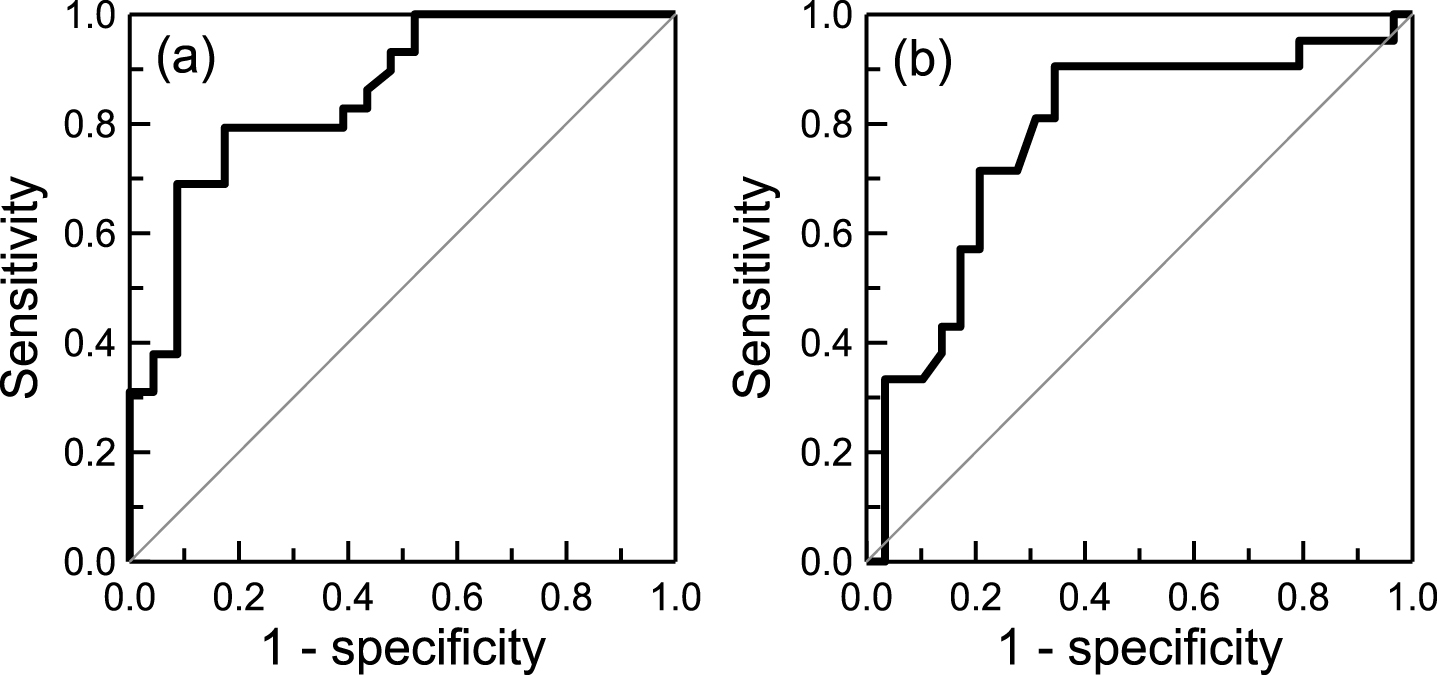
ROC curve for discriminating (a) healthy controls and MCI due to AD and (b) MCI due to AD and very mild AD using plasma p-tau181 level.
ROC curve analysis was performed for the T-tau concentrations in healthy controls and MCI due to AD, as shown in Fig. 8a. The cut-off value was 26.19 pg/ml. The clinical sensitivity and specificity were 0.828 and 0.870, respectively. The area under curve was 0.886. Compared to the case of plasma p-tau shown in Fig. 7a, the level of plasma T-tau shows a slightly clearer discrimination between healthy controls and MCI due to AD. The accuracy of differentiating healthy controls from MCI due to AD is higher than 80% using either plasma p-tau or T-tau level. In Fig. 8b, the ROC curve for discriminating MCI due to AD from very mild AD using plasma T-tau level is shown. The cut-off value was 32.65 pg/ml. The clinical sensitivity and specificity were 0.667 and 0.655. The area under the curve was 0.668. Remarkably, the area under the curve in Fig. 7b for plasma p-tau was 0.777. Thus, the plasma p-tau is correlated with disease severity in early-stage AD more than T-tau is.
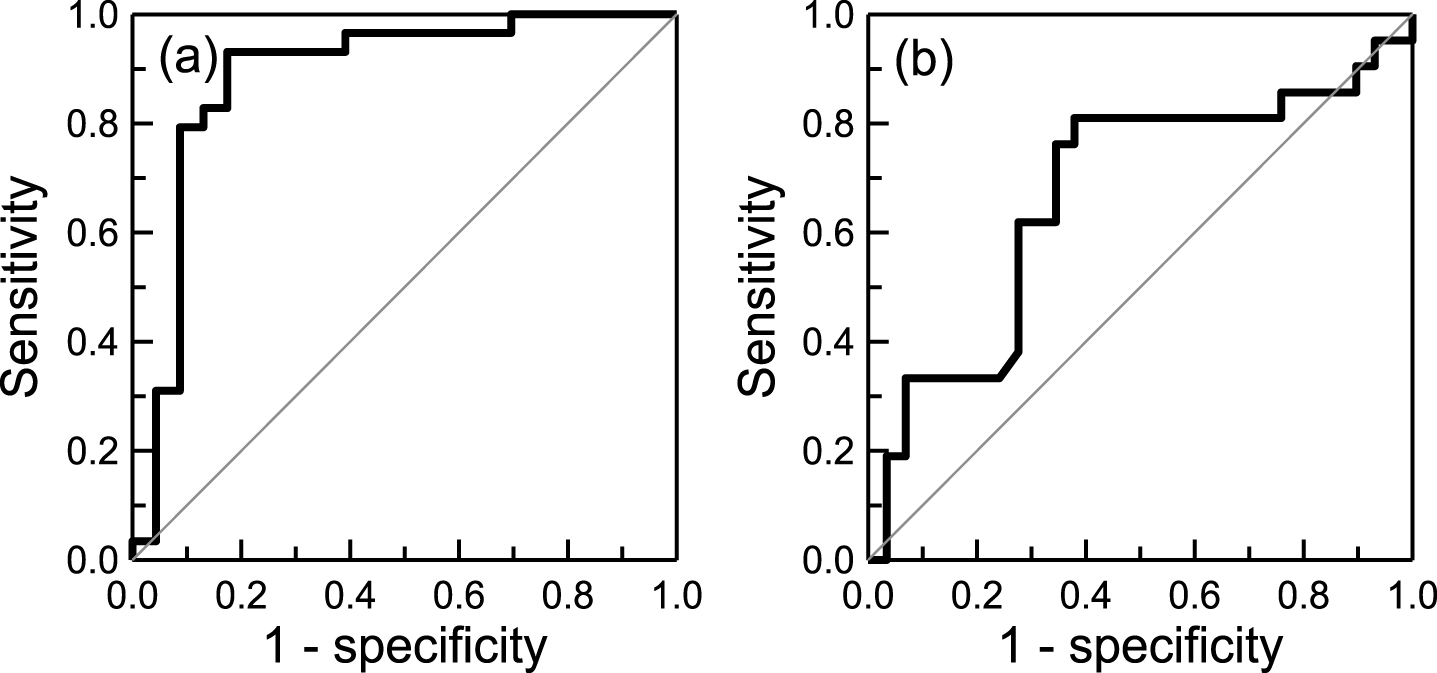
ROC curve for discriminating (a) healthy controls and MCI due to AD and (b) MCI due to AD and very mild AD using plasma T-tau level.
p-tau181 is a part of T-tau. The relationship between p-tau181 concentrations (φp - tau181,IMR) and T-tau (φtau,IMR) in plasma was investigated. The detected φp - tau181,IMR values versus the measured φtau,IMR values are plotted in Fig. 9. The coefficient of correlation is 0.741. The proportionality between φp - tau181,IMR and φT - tau,IMR is presented in Fig. 9. The slope of the proportionality in Fig. 9 is 0.14. Therefore, the phosphorylated tau protein at threonine 181 is approximately 14% of total tau protein. Careful inspection shows that the concentration ratios of p-tau181 to T-tau in plasma are 14.4% for healthy controls, 13.6% for patients with MCI due to AD, and 19.5% for very mild AD. The p-tau181-to-T-tau ratio in plasma is similar to the value reported for CSF [18, 33–36], as listed in Table 6. To the best of the authors’ knowledge, this is the first observation of the p-tau181-to-T-tau ratio in human plasma for healthy controls and patients with early-stage AD.
Reported concentration ratios of p-tau181 to total tau protein in CSF or plasma for healthy controls, MCI due to AD or AD
CSF, cerebrospinal fluid; MCI, mild cognitive impairment; AD, Alzheimer’s disease.
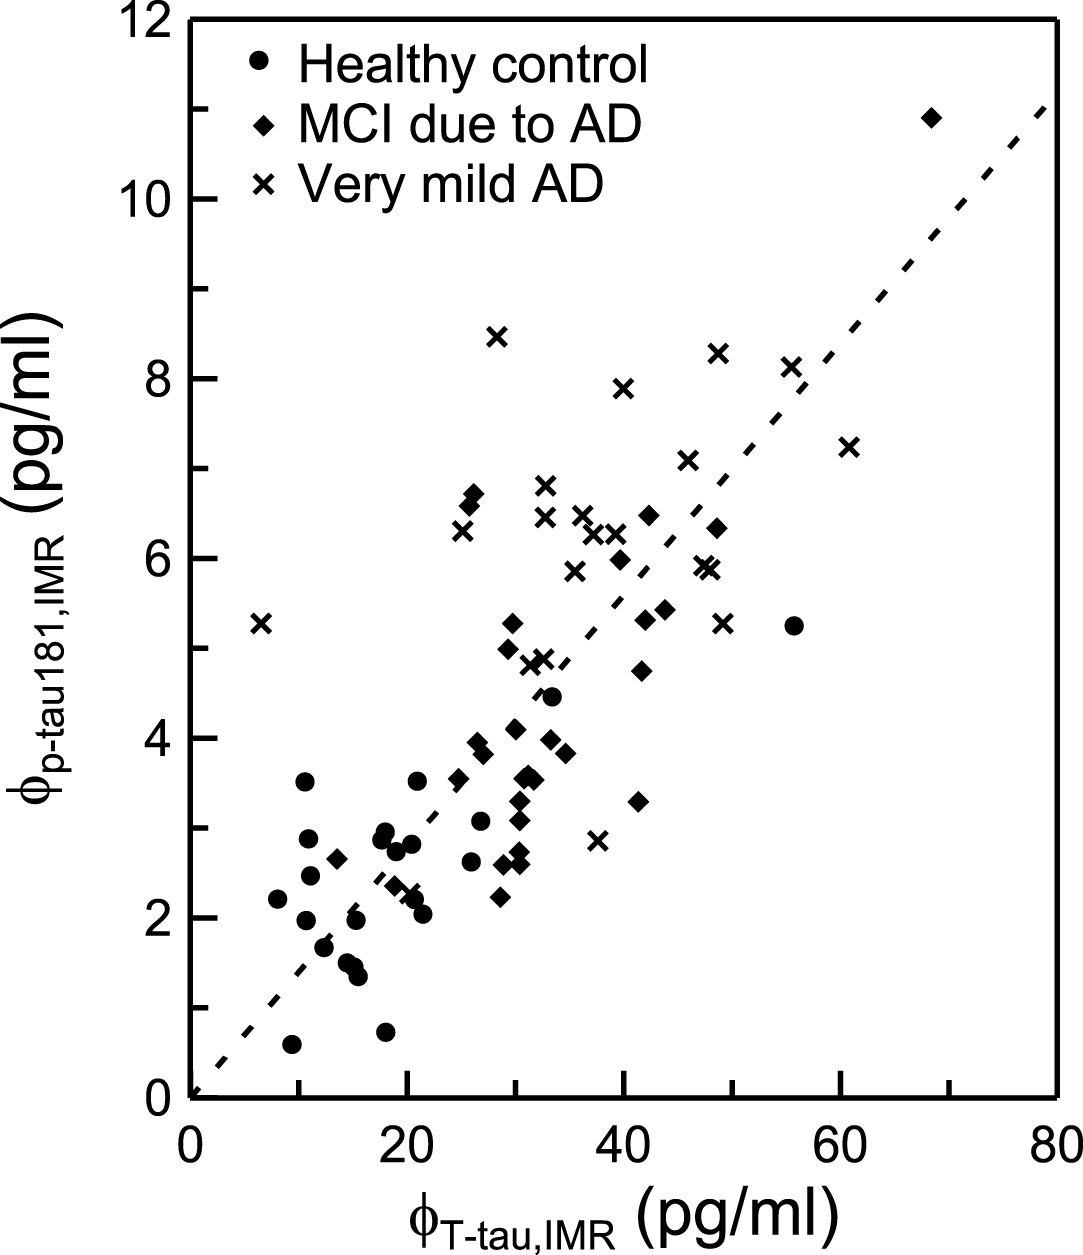
Relationship between the concentrations of plasma p-tau181 φp - tau181,IMR and plasma total tau protein φtau,IMR in human plasma. The dashed line is the guide for the proportionality.
Conclusion
A reagent was developed to assay phosphorylated tau protein at threonine 181, i.e., p-tau181, using immunomagnetic reduction. The dynamic range for the assay of p-tau181 using the reagent is from 1.96×10⁻² pg/ml to 104 pg/ml. The measured p-tau181 concentration in human plasma ranges from 1 to 10 pg/ml for healthy controls and subjects with MCI due to AD, and patients with very mild AD. The concentration of total tau protein is approximately 7 times that of p-tau181 in human plasma. The concentration of p-tau181 in plasma can be used to differentiate memory disorder/cognitive decline in early-stage AD patients.
Footnotes
ACKNOWLEDGMENTS
This work is supported by the Ministry of Economic Affairs of Taiwan under grant number 101-EC-17-A-17-I1-0074, by the New Taipei City government under grant number 103049 (SBIR) and by the Ministry of Science and Technology, Taiwan under grant number 104-2745-B-003 -002. This work is partially supported by MagQu Co., Ltd.