
Abstract
Joint analysis of amyloid and metabolic PET patterns across healthy, mild cognitive impairment (MCI), and Alzheimer’s disease (AD) subjects was performed using baseline 18F-florbetapir and 18F-FDG PET of 684 subjects from the ADNI (251 normal, 204 stable MCI, 85 AD converters, and 144 AD). Correlation between regional amyloid and metabolic uptake was measured and predictive value of PET profile regarding AD conversion in cognitively impaired subjects was assessed using survival analysis and support vector machine classification (SVM). The highest correlations were found in the temporal cortex, precuneus, and posterior cingulum. With respect to normal controls, amyloid load increase was diffuse and early in MCI subjects, whereas metabolism decrease occurred later and predominated in temporo-parietal, precuneus, and cingulate cortices. Five-year AD conversion rates in cognitively impaired subjects were 5%, 22%, 42%, and 78% in amyloid-/FDG-, amyloid-/FDG+, amyloid+/FDG-, and amyloid+/FDG+ subjects respectively (mean follow-up 37±14 months). Using SVM, the combination of ADAS-cog score, amyloid PET, and FDG PET yielded better performance in predicting AD conversion (77% accuracy; 58% positive predictive value; 88% negative predictive value) than ADAS-cog (72%; 52%; 86%), amyloid PET (72%; 52%; 87%), and FDG PET (67%; 47%; 84%). This study attests the complementary value of amyloid and FDG PET in MCI assessment and the efficiency of combined cognitive, amyloid, and metabolic scores to predict AD conversion.
Keywords
INTRODUCTION
Alzheimer’s disease (AD) is characterized by the accumulation of amyloid plaques and neurofibrillary tangles in the brain inducing a progressive neuronal dysfunction and degeneration [1, 2]. These slow neuropathological alterations initiate early in the natural history of the disease and determine a long lasting prodromal state of mild cognitive impairment (MCI) [3, 4]. The study of structural and functional AD-related brain changes has benefited from the development of neuroimaging techniques. Accurate and reproducible measures of regional gray matter atrophy are obtained using high-resolution magnetic resonance (MR) imaging [5, 6]. Positron emission tomography (PET) allows to evaluate cortical amyloid load [7, 8] and glucose metabolism as a surrogate of neurodegeneration [9, 10] using amyloid tracers (such as 18F-florbetapir) and 18F-fuorodeoxyglucose (FDG), respectively. Although the debate remains open [11], currently available evidence strongly supports the hypothesis that the primum movens in AD is related to abnormal processing of amyloid-β (Aβ) peptide and formation of Aβ plaques during the asymptomatic and prodromal stages of the disease. After a lag period, which varies from patient to patient, neurodegeneration becomes the dominant pathological processes, accompanied by synaptic dysfunction and correlative decreased glucose metabolism [12, 13].
Recent multimodal imaging research examining the relations between regional profiles of amyloid deposition and hypometabolism in healthy, MCI, and AD subjects tended to confirm this pathophysiological model [14–24]. Numerous studies, however, focused specifically either on healthy [19], MCI [14, 24], or AD subjects [17]. Most of studies comparing PET measurements of amyloid load and hypometabolism with respect to longitudinal cognitive decline have been limited by small sample sizes [15, 24]. In a large cohort of subjects from the Alzheimer’s Disease Neuroimaging Initiative (ADNI), Landau et al. examined the cross-sectional relationships between amyloid deposition, hypometabolism, and cognition, as well as the associations between global amyloid and hypometabolism PET measurements and retrospective cognitive decline [25]. Their results suggested that amyloid deposition has an early and subclinical impact on cognition that precedes metabolic changes, whereas at later stages of the disease hypometabolism becomes more pronounced and more closely linked to cognitive decline.
To date, accurate data regarding the local and regional correlation between amyloid deposition and hypometabolism patterns across subjects at various stages of the disease is lacking, as remains unclear the exact prognostic value of joint amyloid and metabolic profile. We sought to evaluate cortical amyloid load and metabolism in a large cohort of ADNI subjects, including healthy, stable MCI, AD converters, and AD subjects. This was done by assessing the correlation between amyloid and FDG PET measurements and studying the differences in terms of joint amyloid and metabolic profile across cross-sectionally modelled disease stages. The predictive value of quantitative amyloid and FDG PET with regards to AD conversion in cognitively impaired patients was further evaluated.
MATERIALS AND METHODS
Subjects
In this study, we used participant data from the ADNI, a multicenter project with approximately 50 medical centers and university sites across the United States and Canada [26]. The ADNI was launched in 2003 as a public-private partnership, led by Principal Investigator Michael W. Weiner, MD. Its primary goal was to examine how brain imaging and other biomarkers can be used to measure the progression of MCI and early AD. A detailed description of the inclusion criteria can be found on the ADNI webpage (http://adni-info.org). Subjects were between 55 and 90 years old and willing and able to undergo all test procedures including neuroimaging. The study was approved by the Institutional Review Boards of all of the participating institutions and informed written consent was obtained from all participants at each site. Cognitively normal participants were the control subjects in the ADNI study. Significant memory complaint (SMC) participants scored within the normal range for cognition but indicated concerns, and exhibited slight forgetfulness. They showed no signs of depression, MCI, or dementia. MCI participants reported a subjective memory concern either autonomously or via an informant or clinician. However, other cognitive domains showed no significant impairment, activities of daily living were essentially preserved, and there were no signs of dementia. AD subjects (either at baseline or during follow-up) met the NINCDS/ADRDA criteria for probable AD [27, 28].
Data were downloaded from the ADNI database (http://adni.loni.usc.edu) and included all subjects from the ADNI-2 with available baseline florbetapir PET, FDG PET, and T1-MRI, matching one of the four following profiles: 1) normal: subjects rated normal both at baseline and during follow-up; 2) stable MCI: subjects rated MCI both at baseline and during follow-up with a minimal follow-up duration of 12 months; 3) AD converters: subjects with baseline SMC or MCI who converted to AD during follow-up (two subjects who converted to non-AD dementia during follow-up were excluded from the analysis); 4) AD: subjects rated AD both at baseline and during follow-up. Eight subjects for whom the automatic registration of amyloid and/or FDG PET with T1-MRI failed were excluded. Our population included 684 subjects (251 normal, 204 stable MCI, 85 AD converters, and 144 AD, the complete listing of subject IDs is available at: http://scinti.edu.umontpellier.fr/files/2017/11/JAD_Subject_IDs.xlsx). Cognitively impaired subjects (groups 2 and 3) underwent an average clinical follow-up of 37±14 months. Table 1 details the characteristics of the study population including ApoE4 status, and Alzheimer’s Disease Assessment Scale – Cognitive subscale (ADAS-cog13).
Characteristics of the study population
Image acquisition and processing
Amyloid-β deposition and glucose metabolism were visualized using 18F-florbetapir and 18F-FDG PET respectively. Technical details regarding PET acquisition and pre-processing analysis have been described in more detail elsewhere [25, 29] and are available online (http://adni.loni.usc.edu/methods/pet-analysis/). Concurrent T1-MR was used as a structural template to spatially normalize the PET images and define regions of interest (ROI) for each subject using SPM12 (Wellcome Trust Centre, London, UK). Resulting PET data were sampled on a 135×155×128 grid with cubic voxels of 1.5×1.5×1.5 mm3. PET image voxels were labelled according to the maximum probability tissue atlas derived from the “MICCAI 2012 grand challenge and workshop on multi-atlas labelling” and provided by Neuromorphometrics, Inc. (http://neuromorphometrics.com) under academic subscription. Amyloid and metabolic standardized uptake values (SUV) were normalized to mean cerebellar uptake to produce SUV ratios (SUVR) [30, 31]. Mean regional SUVRs were computed in the following cortical ROIs (right and left ROIs were averaged): frontal, temporal, parietal, occipital, insular, precuneus, anterior cingulate, and posterior cingulate cortices.
Statistical analyses
Correlation between amyloid and metabolic SUVRs at the voxel level and in cortical ROIs was assessed using Pearson’s coefficient r. Univariate differences in amyloid and metabolic SUVR between the four clinical profiles were assessed using Student’s t-test. Bivariate differences in joint distribution of amyloid load and glucose metabolism were assessed using Fisher’s F-score derived from the T2 Hotelling statistic. Bonferroni correction was used to adjust p-values for multiple testing.
Receiver operating characteristic (ROC) analysis was used to determine optimal regional SUVR thresholds as those maximizing Youden’s index (i.e., sensitivity + specificity – 1). This was done by analyzing groups 1 and 4 (normal and AD subjects) and considering normal subjects with SUVR below (amyloid) or above (FDG) the threshold as true negatives, and AD subjects with SUVR above (amyloid) or below (FDG) the threshold as true positives. Five-year AD conversion rate in groups 2 and 3 was then assessed according to amyloid and FDG PET profiles using the actuarial method. Regional SUVRs were compared to the optimal thresholds given by the ROC analysis in five cortical areas in which amyloid and FDG anomalies are typically found in MCI and AD subjects [8, 32]: frontal, temporal, and parietal cortices, precuneus, and posterior cingulum. Amyloid PET was considered abnormal if an increased SUVR was observed in at least 3 of these 5 areas. FDG PET was considered abnormal if a decreased SUVR was observed in at least 3 of these 5 areas. Conversion hazard as a function of PET profile was assessed using a Cox proportional hazards ratio model accounting for age, gender, ApoE status, and baseline ADAS-cog.
Prognostic value of ADAS-cog score, quantitative amyloid PET pattern, quantitative FDG PET pattern, and their combination regarding conversion to AD in cognitively impaired subjects (groups 2 and 3) was further assessed using support vector machine (SVM) classification and leave-one-out cross validation (LOOCV). The four tested classifiers included as input parameters: 1) ADAS-cog score, 2) amyloid PET regional SUVRs, 3) FDG regional SUVRs, and 4) ADAS-cog score, amyloid, and FDG regional SUVRs. ADAS-cog score and PET SUVRs were processed as continuous variables. In LOOCV, each subject was classified based on an SVM model built using as a training set all subjects in groups 2 and 3 except that one.
Statistical analyses were performed using Matlab R2013 (The Math Works, Natick, MA).
RESULTS
Figure 1 shows the voxel-wise correlation map between amyloid load (florbetapir SUVR) and glucose metabolism (FDG SUVR). On each canonical view (axial, coronal, sagittal), the top row shows the correlation map with cortical ROIs superimposed, and the bottom row shows the correlation map overlaid on a T1-MR scan. Only negative correlations between amyloid and metabolic SUVRs are shown. Table 2 gives the correlation coefficient between regional amyloid and metabolic SUVRs for the eight cortical ROIs. A significant negative correlation was found in the temporal cortex (r = –0.21; p < 0.001), precuneus (r = –0.24; p < 0.001), and posterior cingulum (r = –0.26; p < 0.001).
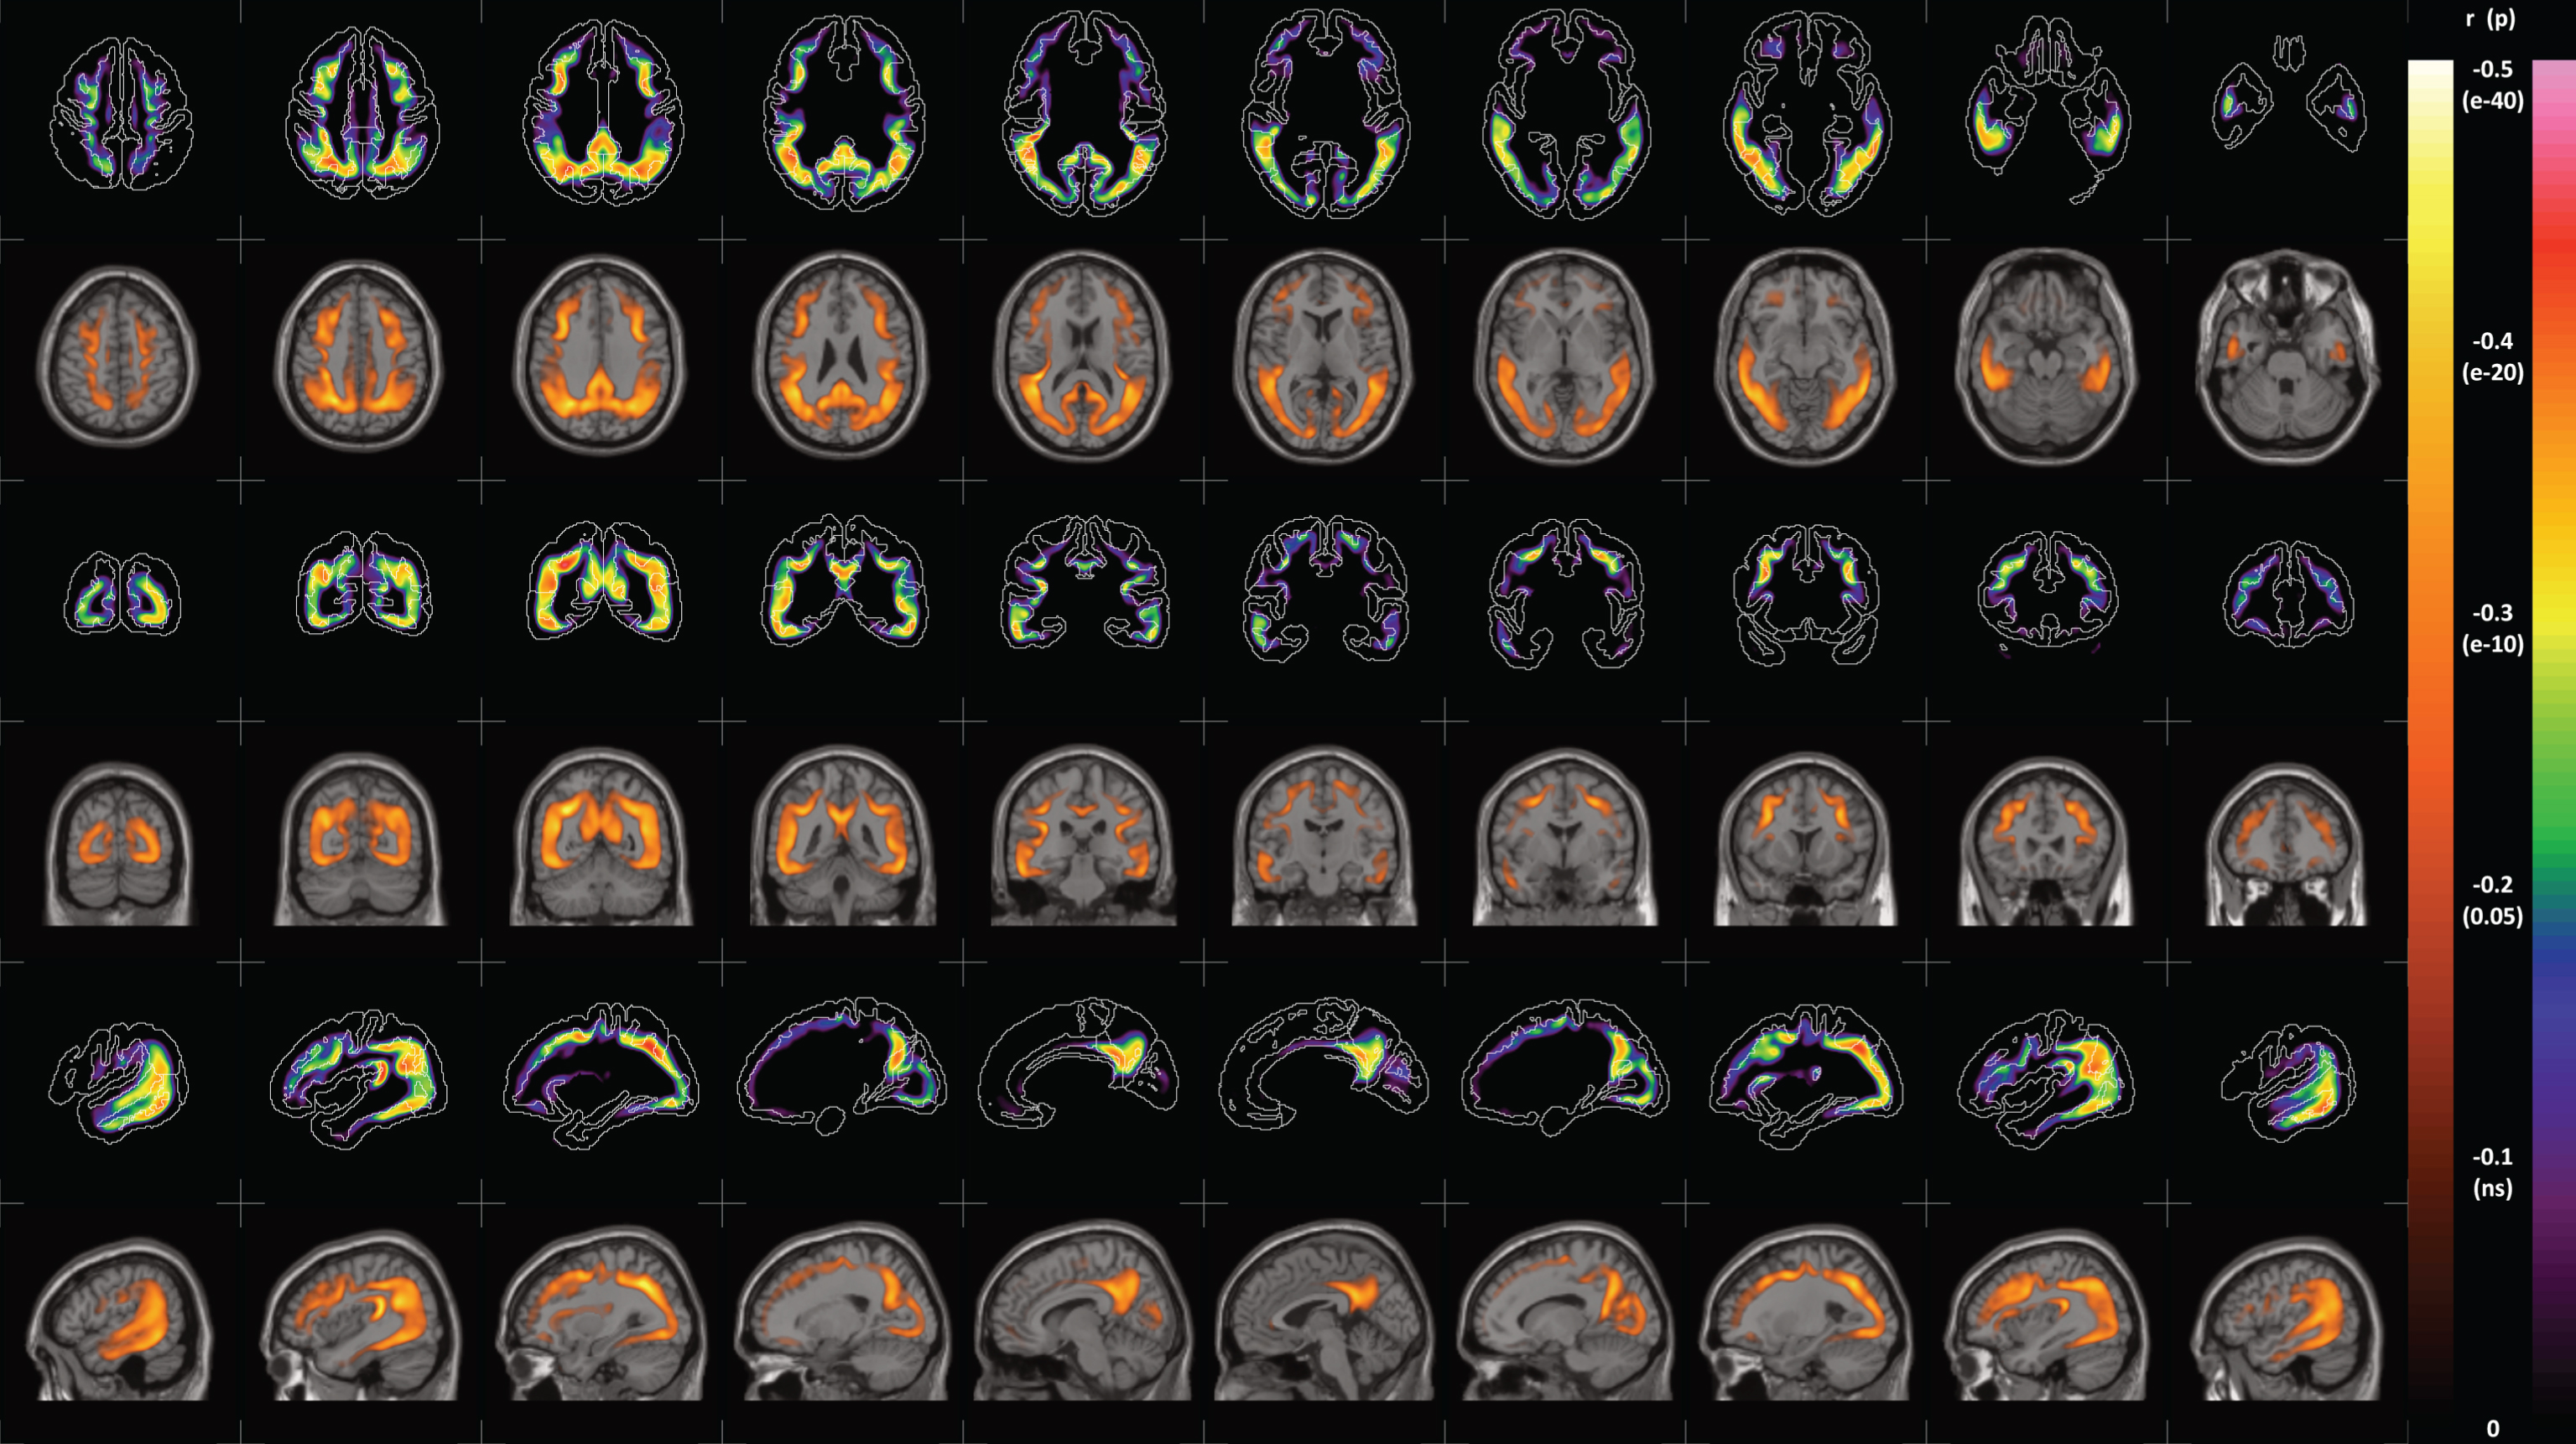
Voxel-wise correlation (Pearson’s r) between amyloid load (florbetapir SUVR) and glucose metabolism (FDG SUVR). Top rows show the correlation map with cortical ROIs superimposed. Bottom rows show the correlation map overlaid on T1-MR slices. P-values are corrected for multiple testing (Bonferroni). A color version of the figure is available in the online version of the paper.
Correlation between cortical amyloid SUVR and metabolic SUVR
Figure 2 shows the joint distributions (median and inter-quartile range) of amyloid load and glucose metabolism according to clinical profile in the eight cortical ROIs. Indicated F-scores are measures of the distance between normal and stable MCI, stable MCI and AD converters, and AD converters and AD, respectively. Table 3 details the relative variation (relative Δmean SUVR) in mean regional amyloid load and glucose metabolism between (from left to right) normal and stable MCI, stable MCI and AD converters, and AD converters and AD.
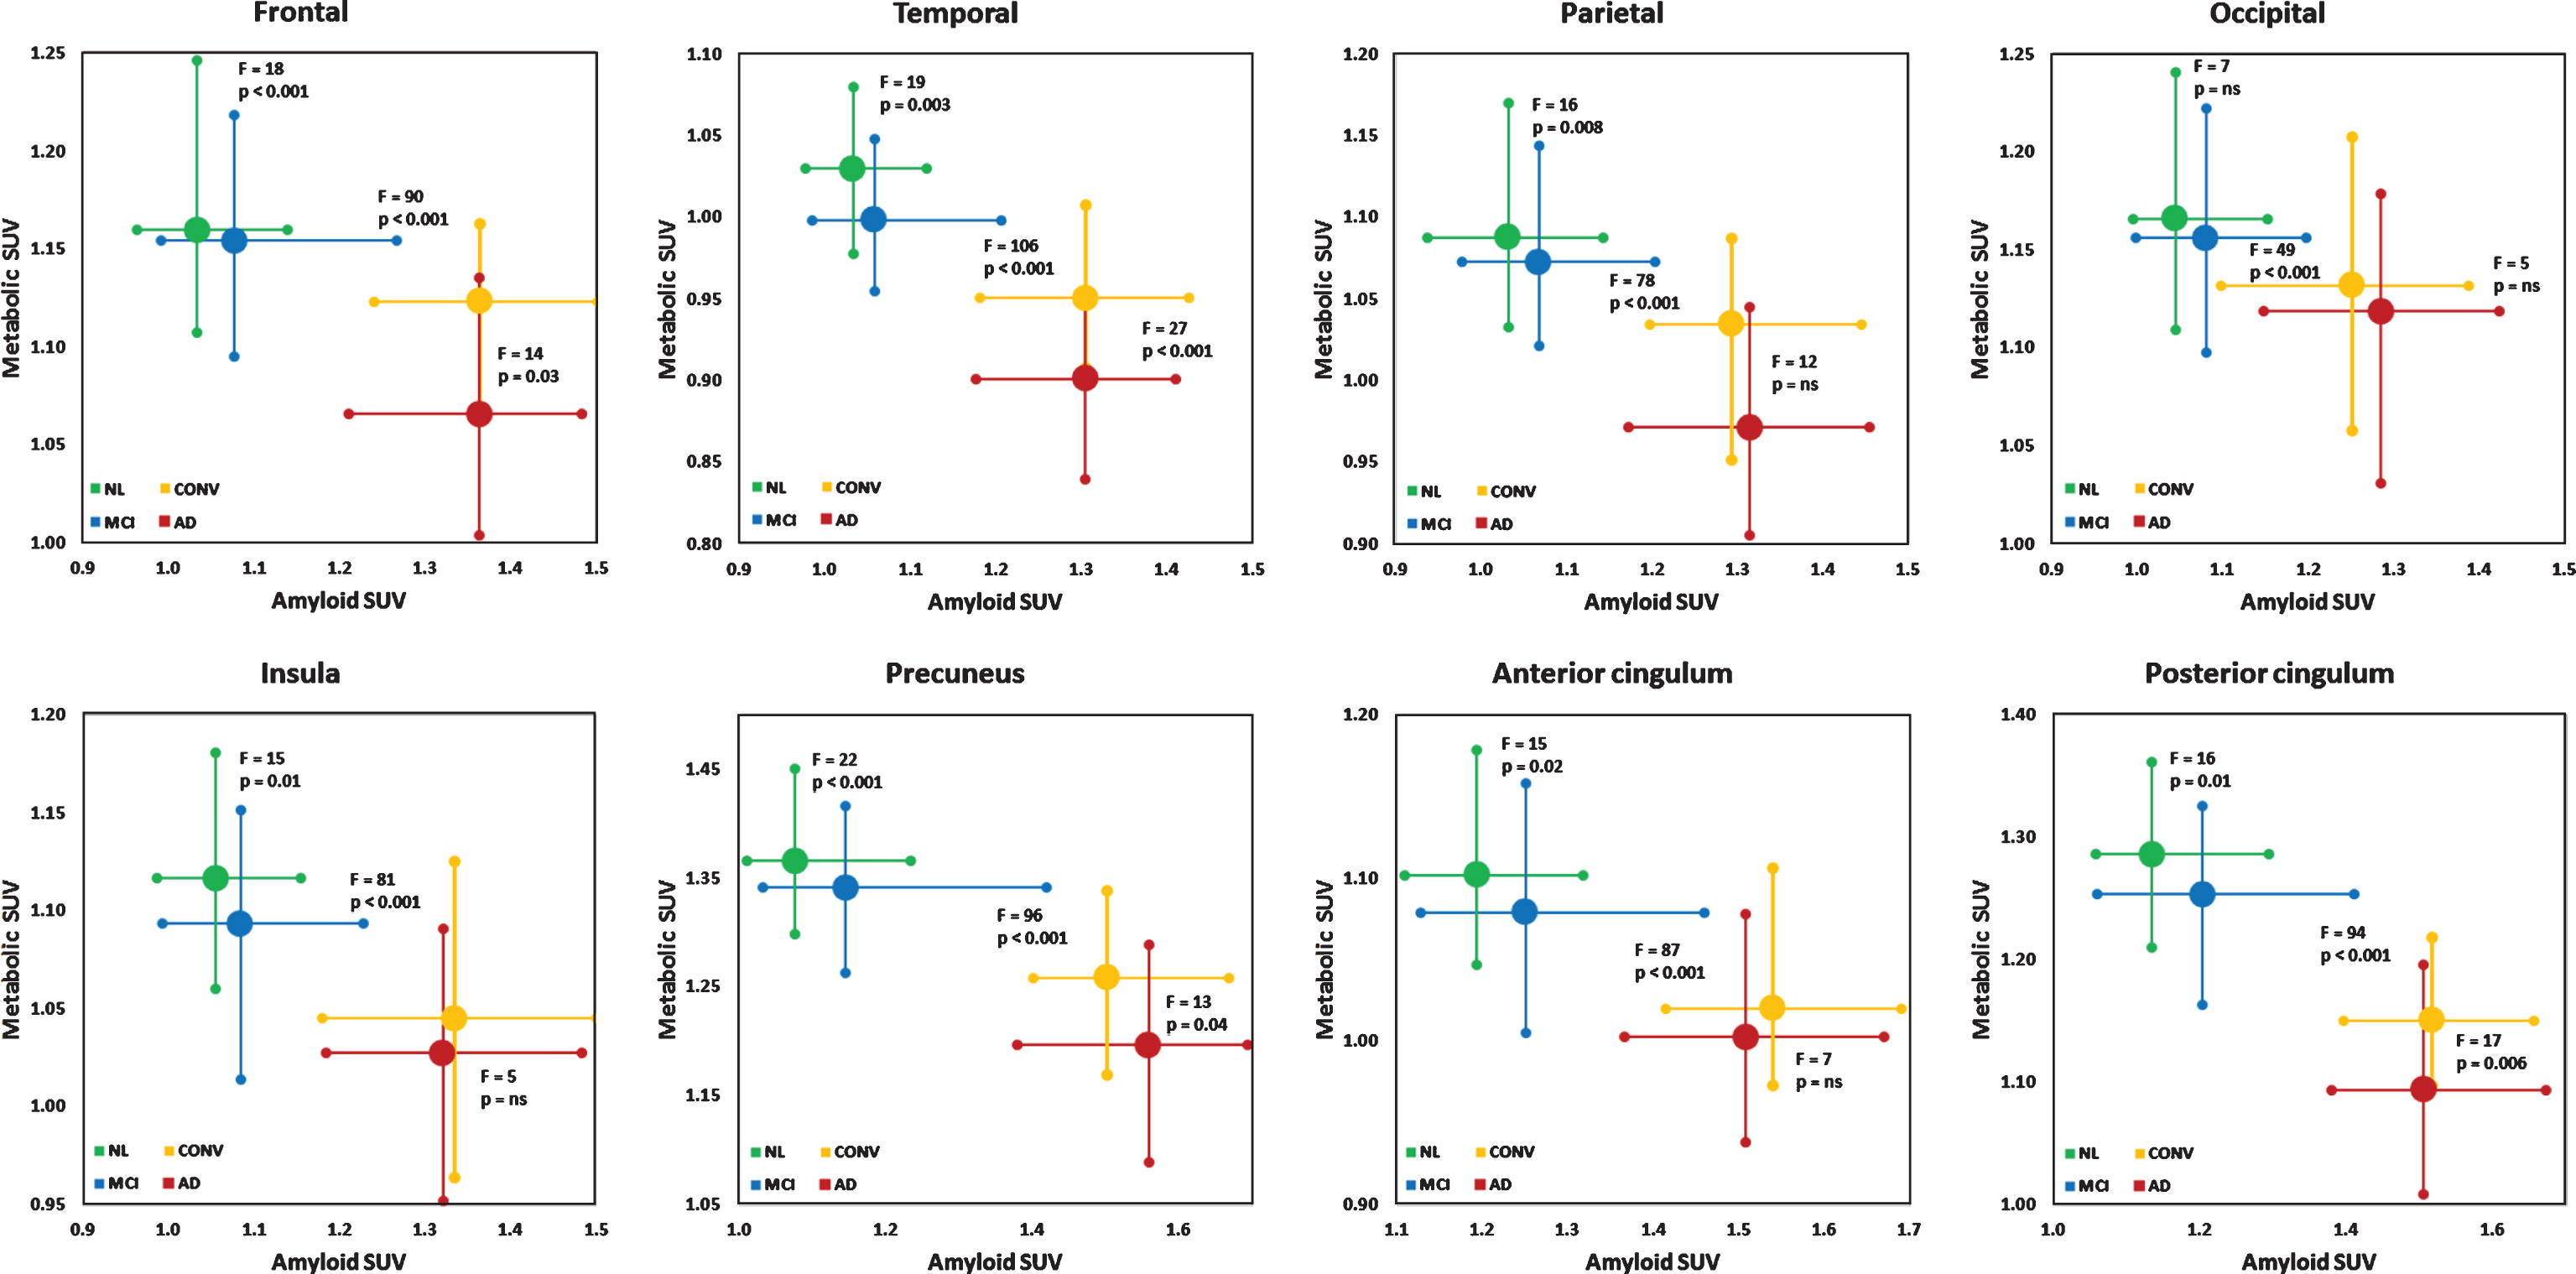
Joint distribution of amyloid load (florbetapir SUVR) and glucose metabolism (FDG SUVR) in (top left to bottom right) frontal, temporal, parietal, occipital, insular, precuneus, anterior cingulate, and posterior cingulate cortices. Large round markers indicate median values, crosses indicate inter-quartile ranges. NL, normal; MCI, stable MCI; CONV, AD converters; F, F-score derived from the T2 Hotelling statistic. p-values are corrected for multiple testing (Bonferroni). Mind that axes graduation is variable.
Variation in cortical amyloid load and metabolism (relative Δmean SUVR) between the subgroups
*p≤0.05; **p≤0.01; ***p≤0.001.
Figure 3 shows the Kaplan-Meier curves of AD conversion rate according to joint amyloid/FDG PET profile (A) and individual amyloid and FDG profiles (B). Five-year AD conversion rates were 11% versus 62% in amyloid- versus amyloid+ subjects, and 17% versus 52% in FDG- versus FDG+ subjects. In terms of joint amyloid/FDG profile, five-year AD conversion rates were 5%, 22%, 42%, and 78% in amyloid-/FDG-, amyloid-/FDG+, amyloid+/FDG-, and amyloid+/FDG+ subjects, respectively. No significant difference in terms of time to conversion was observed between these four PET profiles. After adjustment on age, gender, ApoE status, and ADAS-cog score, it appeared that baseline amyloid profile was the main determinant of subsequent cognitive decline. Indeed, the hazard ratios for AD conversion with respect to amyloid-/FDG- subjects were 3.3, 7.0, and 11.3 in amyloid-/FDG+, amyloid+/FDG-, and amyloid+/FDG+ subjects, respectively. In amyloid positive subjects, no significant difference in conversion rate was found between FDG negative and FDG positive subjects.
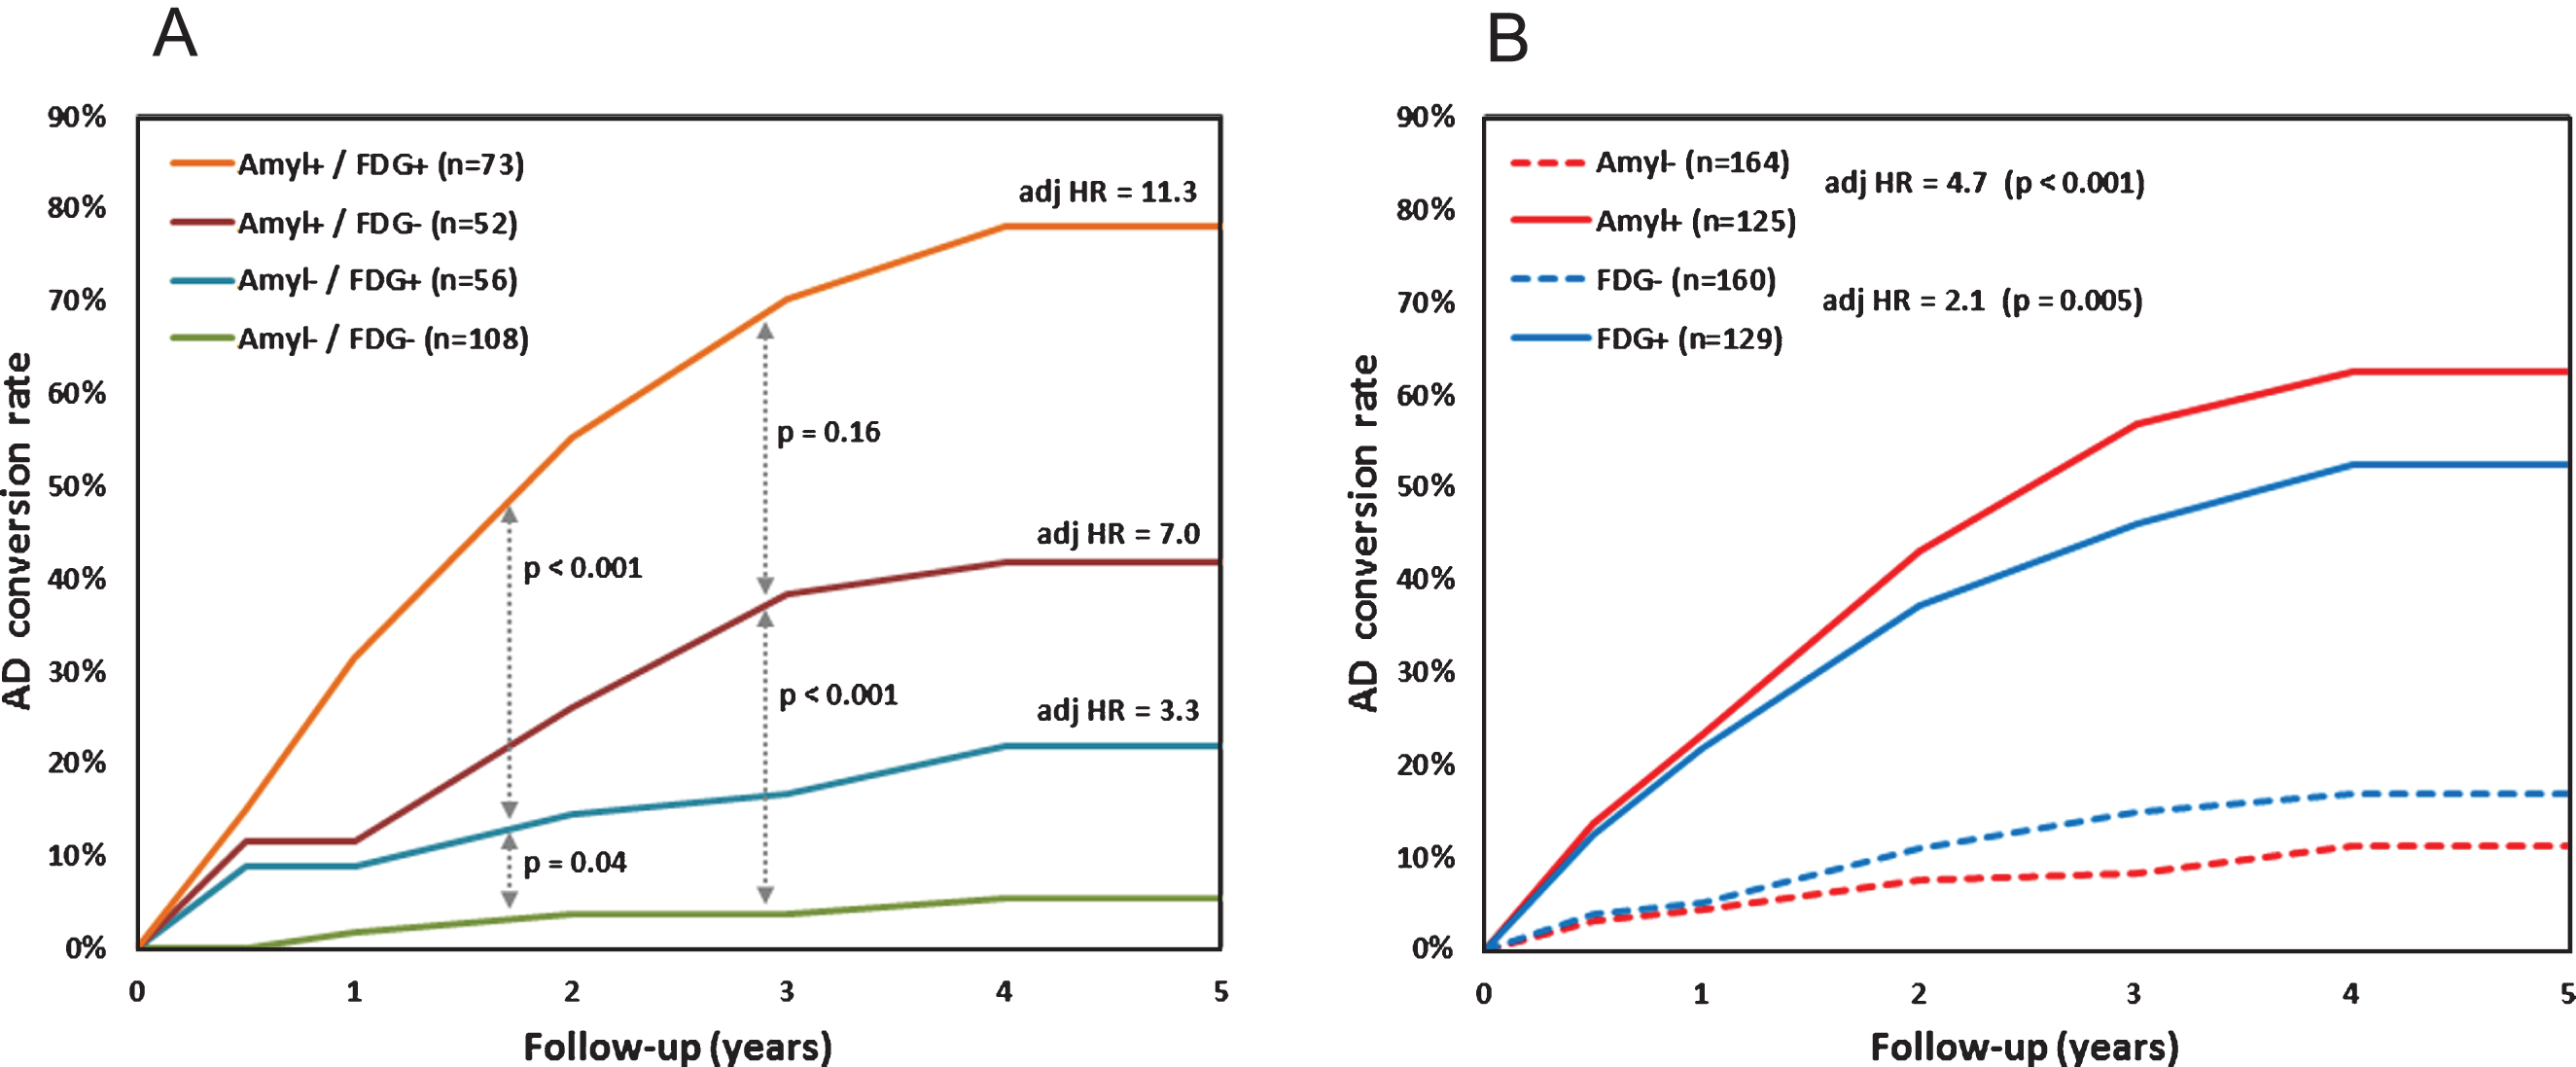
Kaplan-Meier curves for conversion to AD in cognitively impaired subjects according to joint amyloid/FDG profile (A) and individual amyloid or FDG profile (B). adj HR, adjusted hazard ratio with respect to amyloid-/FDG- (A) and amyloid- or FDG- (B). Cox model accounts for age, gender, ApoE status, and baseline ADAS-cog score.
Table 4 summarizes the prognostic performance of ADAS-cog score, quantitative amyloid PET pattern, quantitative FDG PET pattern, and their combination regarding conversion to AD in subjects with baseline cognitive impairment. The combined classification gave the best results with higher specificity, accuracy, and positive predictive value than ADAS-cog score, amyloid PET, and FDG PET individually. It yielded similar negative predictive value and sensitivity compared to ADAS-cog score and amyloid PET.
Prognostic value of ADAS-cog score, amyloid PET regional SUVRs, FDG PET regional SUVRs, and their combination regarding conversion to AD in subjects with cognitive impairment
PPV, positive predictive value; NPV, negative predictive value.
DISCUSSION
In this study based on prospective data from the ADNI-2 cohort, we systematically investigated the correlation between cortical amyloid deposition and glucose metabolism across cross-sectionally modelled disease stages. Amyloid load was assessed using florbetapir, which is one of the tracers available to this end. Although fluorinated amyloid tracers share intimately close properties in terms of binding mechanisms and pharmacokinetics, the findings reported here using florbetapir need to be verified with other fluorinated tracers. The recent literature regarding the association between amyloid load and glucose metabolism mostly focused on specific populations, yielding partial and heterogeneous information regarding the underlying pathophysiological processes. Bozoki et al. found that the effect of amyloid positivity on brain metabolism was regionally specific in healthy subjects, and that amyloid load and hypometabolism were moderately correlated in the temporal cortex in ApoE4 carriers [19]. In a small cohort of healthy and AD subjects, La Joie et al. found no significant correlation between amyloid load and hypometabolism [17]. In AD subjects, regional profiles were characterized by predominant amyloid load with high hypometabolism in posterior association areas, and maximal amyloid deposition with mild hypometabolism in frontal regions. Other studies focused specifically on MCI subjects. In the study by Wu et al. [14], early MCI subject showed increased amyloid load in frontal, precuneus, and posterior cingulate cortices compared to healthy controls. Late MCI subjects showed decreased metabolism in the precuneus and temporo-parietal cortices compared to early MCI. In a cohort of MCI patients with family history of AD, Mosconi et al. found that amyloid load was the most pronounced anomaly in most of cortical areas, except for medial temporal and posterior cingulate regions where hypometabolism was predominant [18]. In a small sample of healthy, MCI, and AD subjects, Jagust et al. found a moderate 62% agreement between amyloid and FDG profiles based on a dichotomous global assessment of cortical tracer uptake, but did not examine in detail regional fluctuations and their inter-correlation [22].
The results presented in the previous section tend to substantiate these findings. Both at the voxel and regional scales, the correlation between amyloid load and hypometabolism was prominent in temporal, precuneus and posterior cingulate cortices, and not significant in fronto-parietal and occipital areas. A moderate positive correlation between amyloid and FDG SUVRs was observed in superficial and periventricular regions, and was considered as an artefact related to partial volume effect (PVE)-related uptake decrease in subjects with cortical and subcortical atrophy. These observations tend to attest that amyloid load increase and glucose metabolism decrease evolve concomitantly in some cortical areas (temporal cortex, precuneus and posterior cingulum), at least over a given period of AD natural history [33]. As reported in Table 3, these three cortical areas are those where a highly significant change in both amyloid and FDG SUVR was found between stable MCI and AD converters, consistent with prior studies [14, 18]. At the prodromal stage, significant albeit subtle modifications in joint amyloid/FDG profile occur, particularly in the precuneus cortex (+7% in amyloid SUVR and –3% in FDG SUVR in stable MCI versus normal subjects). At the symptomatic stage, amyloid load increase was diffuse and early (about +20% from stable MCI to AD converters; no significant change between AD converters and AD), whereas metabolism decrease proceeded later and predominated in temporo-parietal, precuneus and posterior cingulate cortices (sustained significant changes in these areas from stable MCI to AD). Regional FDG hypometabolism reflects synaptic dysfunction, which may be induced by both the local toxic effects of amyloid pathology and tangle-related neurodegeneration. As already suggested in a recent study using a large cohort with cross-sectionally modelled disease stages, it seems that hypometabolism initiate within regions of highest amyloid deposition and spreads among regions most affected by amyloid pathology [34].
Some recent research has highlighted the potential diagnostic value of combined amyloid and FDG imaging. Using multimodal principal component analysis, Laforce et al. showed that joint assessment of amyloid and FDG patterns yielded higher accuracy in subject classification than unimodal assessment of amyloid or FDG profile [35]. Takahashi et al. investigated the usefulness of metabolism to amyloid SUV ratio [36]. Using cortical ROI analysis to classify healthy and AD subjects, they found that the SUV ratio allowed higher diagnostic accuracy (83%) than FDG SUV (81%), and amyloid SUV (79%) individually.
Here, we specifically focused on the prognostic value of joint amyloid and FDG PET profile in terms of AD conversion in cognitively impaired patients. Interestingly, the five-year conversion rates were approximately in the ratio 1/2/4 in amyloid-/FDG+, amyloid+/FDG-, and amyloid+/FDG+ subjects (22%, 42%, and 78% respectively), consistent with those reported by Caroli et al. [37]. Within a given FDG profile, the positivity of amyloid profile had a significant impact on the conversion adjusted hazard ratio (p < 0.001 in both FDG- and FDG+ subjects), attesting that amyloid PET is a strong independent predictor of cognitive decline, especially at early stages of the disease.
In amyloid positive subjects, the positivity of FDG profile marginally influenced the adjusted hazard ratio of AD conversion (p = 0.16). This relatively low impact of FDG profile was likely due to the adjustment on cognitive status (through ADAS-cog score), since FDG pattern anomalies are usually correlated with significant and measurable cognitive impairment. Nonetheless, our results confirm that hypometabolism indicates a more advanced stage of the disease: in subjects with documented amyloidopathy, the five-year AD conversion rate is almost two-fold higher when glucose metabolism alterations are evidenced.
On the contrary, in amyloid negative subjects, the positivity of FDG profile significantly impacted the adjusted hazard ratio (p = 0.04). Among the 164 subjects with a negative amyloid profile, 16 (10%) evolved to a demented state during follow-up, 11 (69%) of whom had an abnormal FDG profile. These atypical profiles were likely related to AD-like dementia without underlying amyloidopathy, often referred to as tangle-predominant dementia [11]. Recent studies highlighted that a substantial proportion of subjects with a primary clinical diagnosis of mild to moderate AD have minimal Aβ plaque accumulation, almost a half of whom have an extensive topographic distribution of neurofibrillary degeneration at autopsy [38]. This is consistent with our finding that FDG profile allows to rectify about two thirds of amyloid PET false negatives. Regarding the predictive value of the available markers, we showed that combining clinical cognitive assessment (which is known to be a major prognostic factor [39]) with information from quantitative amyloid PET and quantitative FDG PET yields higher accuracy in predicting AD conversion (almost 80%) than FDG PET, amyloid PET, and ADAS-cog score individually (about 70% accuracy for these three markers). While maintaining an excellent negative predictive value (∼90%), it allowed a substantial increase in positive predictive value (almost 60% versus 45–50% for individual markers). These findings support the previous evidence that combining biomarkers allows better prediction of cognitive decline in subjects at risk and improves MCI subject classification with respect to AD conversion [23, 40]. To allow for efficient discrimination between neurodegenerative diseases and optimal therapeutic planning, joint assessment of FDG and amyloid PET has to be integrated within the range of available biomarkers, including tau-specific PET tracers currently under clinical assessment [41].
Conclusion
The characterization of spatial distribution and temporal progression of amyloid deposits and neuronal hypometabolism is essential for elucidating pathological mechanisms that underlie AD. This study based on the analysis of cross-sectionally modelled disease stages tends to support the early and diffuse amyloid accumulation and later glucose metabolism alteration in AD natural history. It suggests that, at least over a given time range in the evolution from the prodromal state to the demented state, amyloidopathy and hypometabolism evolve concomitantly in specific cortical areas (temporal cortex, precuneus, and posterior cingulate). In a prognostic perspective, amyloid PET profile appears as the main predictor of subsequent cognitive decline and AD conversion in cognitively impaired subjects. In subjects with a normal amyloid profile, FDG profile allows to detect about two thirds of amyloid PET false negatives. When forecasting AD conversion using binary linear classification, the optimal predictive accuracy is obtained by combining baseline cognitive status, regional amyloid SUVR, and regional FDG SUVR.
Footnotes
ACKNOWLEDGMENTS
Data collection and sharing for this project was funded by the Alzheimer’s Disease Neuroimaging Initiative (ADNI) (National Institutes of Health Grant U01 AG024904) and DOD ADNI (Department of Defense award number W81XWH-12-2-0012). ADNI is funded by the National Institute on Aging, the National Institute of Biomedical Imaging and Bioengineering, and through generous contributions from the following: AbbVie, Alzheimer’s Association; Alzheimer’s Drug Discovery Foundation; Araclon Biotech; BioClinica, Inc.; Biogen; Bristol-Myers Squibb Company; CereSpir, Inc.; Cogstate; Eisai Inc.; Elan Pharmaceuticals, Inc.; Eli Lilly and Company; EuroImmun; F. Hoffmann-La Roche Ltd and its affiliated company Genentech, Inc.; Fujirebio; GE Healthcare; IXICO Ltd.; Janssen Alzheimer Immunotherapy Research & Development, LLC.; Johnson & Johnson Pharmaceutical Research & Development LLC.; Lumosity; Lundbeck; Merck & Co., Inc.; Meso Scale Diagnostics, LLC.; NeuroRx Research; Neurotrack Technologies; Novartis Pharmaceuticals Corporation; Pfizer Inc.; Piramal Imaging; Servier; Takeda Pharmaceutical Company; and Transition Therapeutics. The Canadian Institutes of Health Research is providing funds to support ADNI clinical sites in Canada. Private sector contributions are facilitated by the Foundation for the National Institutes of Health (![]() ). The grantee organization is the Northern California Institute for Research and Education, and the study is coordinated by the Alzheimer’s Therapeutic Research Institute at the University of Southern California. ADNI data are disseminated by the Laboratory for Neuro Imaging at the University of Southern California.
). The grantee organization is the Northern California Institute for Research and Education, and the study is coordinated by the Alzheimer’s Therapeutic Research Institute at the University of Southern California. ADNI data are disseminated by the Laboratory for Neuro Imaging at the University of Southern California.