
Abstract
Background:
Cerebral amyloid angiopathy-related inflammation (CAA-ri) is associated with a cerebrospinal fluid (CSF) biomarker profile similar to that observed in CAA. Few CAA-ri patients have been studied by fibrillar amyloid-β (Aβ) imaging (using 11C-Pittsburgh compound B and 18F-florbetapir, but not 18F-florbetaben).
Objective:
To describe CSF biomarkers, magnetic resonance imaging (MRI), and 18F-florbetaben (FBB)-positron emission tomography (PET) changes in CAA-ri patients.
Methods:
CSF levels of total tau, phosphorylated tau, Aβ1-42, and Aβ1-40, MRI (cerebral microbleeds count on susceptibility-weighted imaging and semi-quantitative analysis of fluid-attenuation inversion recovery white matter hyperintensities), and FBB-PET (using both cerebellar cortex and pons to calculate standardized uptake value ratios) were analyzed in nine consecutive CAA-ri patients.
Results:
A median number of 769 cerebral microbleeds/patient were counted on MRI. When using the pons as reference region, amyloid load on FBB-PET was very strongly correlated to CSF Aβ1-40 levels (rho = –0.83, p = 0.008) and moderately correlated to cerebral microbleed numbers in the occipital lobes (rho = 0.59, p = 0.001), while comparisons with other CSF biomarkers were not statistically significant (total tau, rho = –0.63, p = 0.076; phosphorylated tau, rho = –0.68, p = 0.05; Aβ1-42, rho = –0.59, p = 0.09). All correlations were weaker, and not statistically significant, when using the cerebellum as reference region. A non-significant correlation (rho = –0.50, p = 0.18) was observed between CSF Aβ1-40 levels and cerebral microbleed numbers.
Conclusion:
In CAA-ri, CSF Aβ1-40 levels correlated well with amyloid load assessed by FBB-PET when the pons was used as reference, and to a lesser degree with cerebral microbleeds count on MRI. This confirms earlier data on CSF Aβ1-40 as an in vivo marker for CAA and CAA-ri.
Keywords
INTRODUCTION
In amyloid-β (Aβ)-related angiitis of the central nervous system (also called cerebral amyloid angiopathy-related inflammation, CAA-ri), cerebral amyloid angiopathy (CAA) occurs in association with primary vasculitis of small- and medium-sized leptomeningeal and cortical arteries [1–6]. Based on histological findings, inflammation in CAA is sometimes divided into Aβ-related angiitis (associated with angiodestructive inflammation) and CAA-ri (associated with perivescular inflammation in the absence of angiodestructive features).
Clinicoradiological CAA-ri criteria have been proposed by Chung et al. and modified and validated recently by Auriel et al. [2, 7]. CAA-ri is associated with a cerebrospinal fluid (CSF) biomarker profile similar to that observed in CAA, including low Aβ 1–40 (Aβ40) and Aβ 1–42 (Aβ42) levels [8]. In mutation carriers with hereditary cerebral hemorrhage with amyloidosis-Dutch type, decreasing CSF Aβ40 was associated with a higher lobar cerebral microbleeds count and the presence of cortical superficial siderosis [9].
Ligands for cerebral fibrillar Aβ imaging include 11C-Pittsburgh compound B (PiB), 18F-florbetapir, 18F-flutemetamol, and 18F-florbetaben (FBB). The affinity of these ligands for amyloid plaques, tested in Alzheimer’s disease (AD) and mild cognitive impairment (MCI) patients, is excellent as has been demonstrated by studies with autopsy and histologicalanalysis [10–21].
In CAA, increased PiB and 18F-florbetapir binding has been observed in several reports analyzing groups of CAA patients [22–26]. In CAA-ri, three case reports have described Aβ PET imaging (PiB was used in the two reports describing one and two patients respectively, while 18F-florbetapir was used in one report describing two patients), showing increased binding [27–29]. In one of these reports, slightly lower cortical tracer uptake was seen in areas of inflammation, while in another report higher uptake was seen in the region with hemorrhagic CAA features. In these five CAA-ri patients with Aβ PET imaging, three had pre-existing AD or MCI, and thus AD-related PET abnormalities could not be excluded. Aβ PET imaging has never been used to study systematically a group of CAA-ri patients. All reports studying brain amyloid imaging in CAA and CAA-ri have used the cerebellum as reference region (except one study analyzing both the cerebellum and the pons as reference region, without difference observed between both types of analyses) [22]. CAA primarily affects leptomeningeal and cortical vessels of neocortical regions, with predominance in posterior brain regions. In more advanced stage CAA, the cerebellum also becomes affected together with allocortical areas, white matter, basal ganglia, and thalamus, possibly leading to underestimation of tracer uptake on Aβ PET imaging in the supratentorial brain regions. In some reports studying AD and MCI patients and asymptomatic controls (using PiB and 18F-flutemetamol), the pons (typically involved with the least degree of CAA pathology) was used as reference region [30–32]. In most of these studies, using the pons as the reference seemed to be as reliable as, or sometimes even more reliable than, using the cerebellum as reference region.
FBB has been shown to strongly bind neuritic and diffuse Aβ plaques and to CAA in vitro in the absence of important labelling of neurofibrillary tangles [33].
Our aim was to study consecutive CAA-ri patients by CSF analyses, MRI, and FBB-PET using both cerebellum and pons as reference regions and to assess correlation between these analyses.
METHODS
Study participants
We prospectively enrolled between April 2015 and June 2016 nine consecutive patients diagnosed with CAA-ri according to the validated clinicoradiological criteria [7]. This study included four CAA-ri patients already reported by our group analyzing specifically CSF biomarkers in CAA-ri [8]. None of them had pre-existing cognitive impairment reported by the patients or their family. At the time of PET, two patients had clinically and radiologically active CAA-ri (one without treatment and one with corticosteroid treatment started five days before PET), and seven patients had CAA-ri in the remission phase (two patients without past treatment, three patients with past corticosteroid treatment and no ongoing treatment, one patient with past corticosteroid and cyclophosphamide treatment without ongoing therapy, and one patient with past corticosteroid and cyclophosphamide treatment with ongoing azathioprine therapy).This study was performed with the approval of the institutional review board of the hospital. Informed consent was obtained from all patients and controls (or guardians of patients or controls) participating in the study.
CSF analyses
CSF was collected in polypropylene tubes following standardized conditions and using an atraumatic needle, preferably between 11:00 a.m. and 1:00 p.m. to minimize the influence of diurnal variations of CSF biomarkers. Each CSF sample was transferred to the laboratory within four hours after collection and was centrifuged at 1,000 g at 4°C for 10 min. CSF samples were aliquoted into polypropylene tubes and stored at –80°C. CSF Aβ42, Aβ40, total tau (t-tau), and phosphorylated tau (p-tau 181) levels were measured using the Innotest® sandwich ELISA (Fujirebio), as previously described, using the recently updatedvalidated cut-offs [34, 35].
MRI analysis
MRI scans were acquired on three 1.5T (four patients) magnets (Optima MR450 w, GE Medical Systems, Milwaukee, Wis; Avanto, Siemens, Erlangen, Germany; Ingenia, Philips, The Netherlands) and two 3T (five patients) magnets (Signa HDxt, GE Medical Systems, Milwaukee, Wis; Skyra, Siemens, Erlangen, Germany), with slightly different TR and TE parameters. 3D susceptibility-weighted images (SWI) were reformatted using minimum intensity projection images in the bicommissural plane, with a 3-mm thickness. On SWI images, a board-certified neuroradiologist (NMDC) assessed for lobar intracerebral hemorrhage (defined as >10 mm), cortical superficial siderosis (defined as curvilinear hypointensities following the cortical surface, distinct from the vessels, assessed according to a validated scale: absent, focal when restricted to three or fewer sulci, or disseminated when affecting at least four sulci), and cerebral microbleeds (CMB) [36]. Their presence and number of CMB were evaluated according to current consensus criteria [37, 38]. CMB were counted and specified for the entire brain, the infra- and supratentorial region of the brain, and for each brain lobe: frontal, parietal, occipital, and temporal lobe. To assess proportions of inflammatory-related asymmetric uni/multifocal white matter hyperintensities (WMH) extending to the immediately subcortical white matter on fluid-attenuated inversion recovery (FLAIR) images, a semi-quantitative score was calculated for each of the eight different brain lobes: 0 = WMH absence, 1 = WMH involving <50% of the lobe volume, 2 = WMH involving >50% of the lobe volume, resulting in a total WMH score ranging from 0 to 16. All MRI analyses were performed blinded to clinical, CSF, and PET data.
Amyloid imaging analyses
FBB PET-CT scan was acquired 90 min after intravenous injection of 300 MBq of FBB (NeuraceqTM) on a 3-dimensional mode ToF Discovery 710 PET-CT system with lutetium yttrium orthosilicate (LYSO) crystals (GE Healthcare) for 20 min per bed position. Forty-seven transaxial PET (256×256 mm, 0.98×0.98×3.27 mm) reconstructed slices were obtained using ToF OSEM algorithm (VPFX; GE Healthcare), with two iterations, 24 subsets, and 6.4 mm-1filter with CT attenuation, randoms, PS, and scatter corrections. Values of used DFOV and matrix were 25 cm and 256×256, respectively.
Data analyses were performed using CortexID Suite software (GE Healthcare) running on GE Advantage Workstation 4.6, enabling automated quantitative and statistical analysis of tracer uptake by registration to a standard template space and comparing intensity values. Quantification was presented using volumes of interest, voxel-based, or stereotactic surface projection maps of the brain.
To calculate amyloid load in the different brain lobes, two different brain regions were used as reference region: cerebellar cortex and pons. The standardized uptake value ratio (SUVR), i.e., the ratio of the entire brain and each brain lobe SUV/the brain reference region (cerebellar cortex or pons) SUV, was calculated, resulting in a target-to-cerebellum SUVR and target-to-pons SUVR for the entire brain and for each brain lobe.
In order to statistically analyze the distribution of FBB binding on PET, the nine CAA-ri patients were compared with seven control patients with normal FBB-PET. Control patients were diagnosed with cognitive deficit other than amyloid-related disorders (depression, n = 4; post-subarachnoid hemorrhage due to aneurysm rupture, n = 1; autoimmune encephalitis, n = 1; and hypertensive deep brain intracerebral hemorrhage, n = 1). Control patients underwent FBB-PET for a local study protocol including patients with subjective or objective cognitive deficit with a definite diagnosis other than amyloid-related disorder. Statistical Parametric Mapping (SPM) was performed with software SPM8 analysis (Wellcome Department of Imaging Neuroscience, London http://www.fil.ion.ucl.ac.uk/spm/software/spm8/) running on Matlab 8.0 on an Os×10.10.5 system. Dicom images were imported, transformed into analyze format (.hdr.img), and realigned and spatially normalized into the MNI (Montreal Neurological Institute, McGill University, Montreal, QC, Canada) standard template given by SPM software using affine and non-linear transformation. Images were reformatted to a final voxel size of 2×2×2 mm and smoothed using an isotropic Gaussian kernel of 12×12×12 mm FWHM. A global normalization for voxel count was performed using a proportional scaling. The gray-level threshold was set to 0.8. Statistical comparisons between CAA-ri patients and controls were performed on a voxel-by-voxel basis t-statistics, generating SPM (t) maps. A MNI to Talairach coordinates conversion was performed using Yale Bioimage Suite software (http://www.bioimagesuite.org).
Statistical analyses
Spearman’s rank correlation coefficient (rho) was used to estimate the correlation between CSF biomarkers (t-tau, p-tau, Aβ42, and Aβ40), MRI abnormalities (CMB and inflammation WMH score), and FBB-PET uptake, with a probability value under 0.05 means that correlation significantly differs from 0. Rho values of <0.40 were called weak, 0.40–0.59 moderate, 0.60–0.79 strong, and 0.80–1 very strong. Both global and lobe-per-lobe MRI and FBB-PET data were used. Mann Whitney-Wilcoxon test was used to compare CMB numbers between 1.5T and 3T MRI scans, and to compare age between CAA-ri patients and controls.
Multivariate analysis was not performed because of the low number of patients.
In this study, controls were only used for FBB-PET analyses in search for the FBB uptake pattern in CAA-ri patients. We did not test for sensitivity and specificity. We only studied the statistical difference for SUVR FBB-PET values between CAA-ri and control patients by using Student t test.
RESULTS
Demographic, CSF, MRI, and FBB-PET data of the nine CAA-ri patients (five men and four women; median age 74, range 62–83) are shown in Table 1. MRI of the CAA-ri patients are shown in Fig. 1. Eight patients had probable and one patient pathologically confirmed CAA-ri. In the CAA-ri patients, apolipoprotein E (ApoE) genotype was E3/E3 in two patients, E3/E4 in two patients, and E4/E4 in five patients. Auto-antibodies against Aβ40 and Aβ42 were analyzed in two patients, both positive. Median age of controls used for SPM analyses was 62 (range 56–81), not different from CAA-ri patients (p = 0.2). None of the patients had acute/chronic lobar intracerebral hemorrhage, and three out of nine patients had focal (involving only one sulcus in each of these patients) cortical superficial siderosis, and none had disseminated cortical superficialsiderosis.
Demographic, CSF, MRI, and FBB-PET data of the nine CAA-ri patients
CSF, cerebrospinal fluid; MRI, magnetic resonance imaging; FBB, 18F-florbetaben; CAA-ri, cerebral amyloid angiopathy-related inflammation; t-tau, total tau; p-tau, phosphorylated tau; Aβ42, amyloid-β 1–42; Aβ40, amyloid-β 1–40; WMH, white matter hyperintensity; CMB, cerebral microbleeds; SUVR, standardized uptake value ratio.
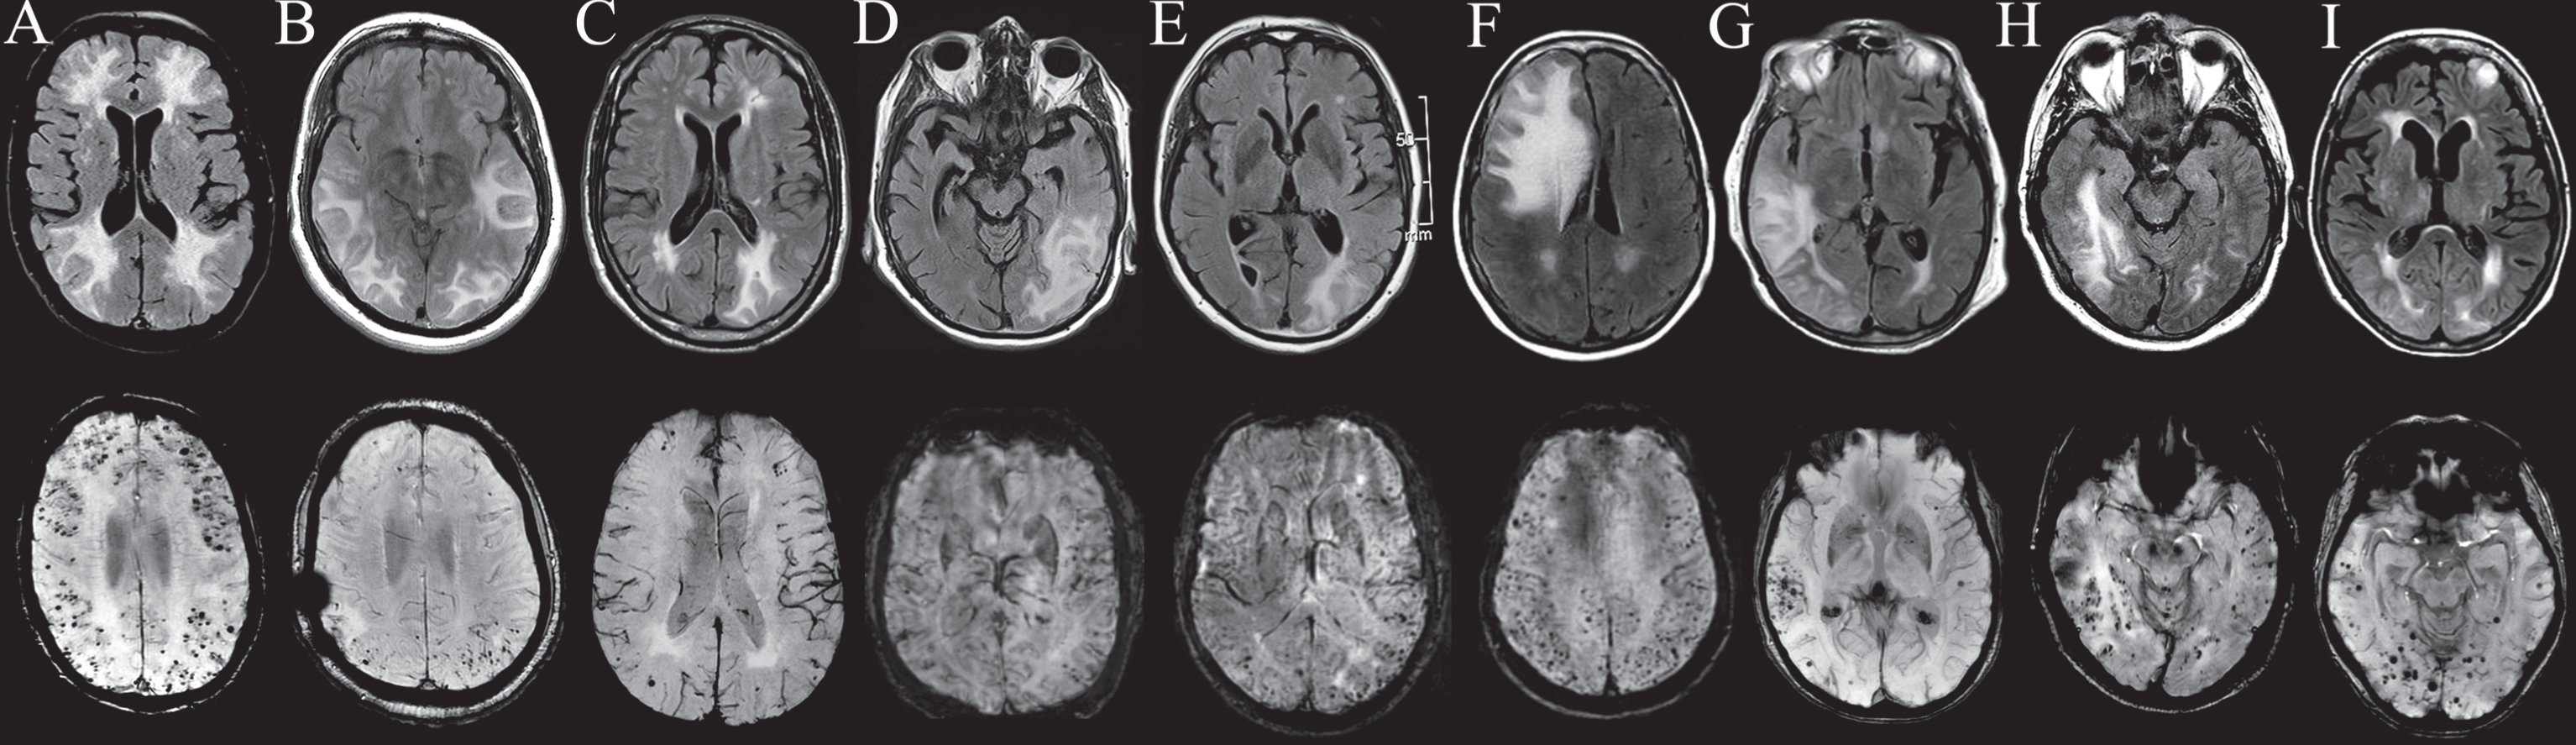
MRI of the nine CAA-ri patients (A to I corresponding to patient 1 to 9, respectively) showing hyperintensities on FLAIR (first horizontal row) and innumerable microbleeds on SWI (second horizontal row) imaging.
A median number of 769 cerebral microbleeds (range 30–3391) per patients was counted on MRI. CMB numbers were similar when comparing 1.5T and 3T MRI scans (median 715 and 775 respectively, difference p = 0.9). There was no difference in CMB numbers between different brain lobes (median 54 for frontal, 119 for parietal, 85 for temporal, and 43 for occipital lobe). Lowest p-value was observed between parietal and occipital CMB count (p = 0.11).
FBB-PET was performed a median of 43 days (range 4–317) after MRI. Tracer uptake on FBB-PET (using both cerebellum and pons as reference region) was highest in occipital lobes (median SUVR 1.56 and 0.8 respectively), followed by parietal (median SUVR 1.42 and 0.75 respectively), temporal (median SUVR 1.34 and 0.74 respectively), and frontal (median SUVR 1.31 and 0.69 respectively) lobes, without statistical significance between different brain lobes. Lowest p-value was seen between occipital and frontal lobes (p = 0.48 and p = 0.37 for the cerebellum and the pons as reference value, respectively).
Analyses including FBB-PET data using the cerebellar cortex as reference region
Correlation (between FBB-PET SUVRcerebellum, CSF biomarker levels, and CMB count) rho- and corresponding p-values are shown in Table 2.
Correlation analyses between FBB-PET SUVR, CSF biomarker levels, and MRI abnormalities
FBB-PET SUVR, 18F-florbetaben positron emission tomography standardized uptake value ratio; SUVRc, standardized uptake value ratio (cerebellum as reference region); SUVRp, standardized uptake value ratio (pons as reference region); CMB, cerebral microbleed; R, right; L, left; WMH, white matter hyperintensities; *is marked when p < 0.05.
Negative, statistically non-significant, correlation (moderate for Aβ40, weak for other biomarkers) was observed between CSF biomarker levels and global SUVR on FBB-PET. Mostly weak, statistically non-significant, correlation was seen between CMB counts on MRI and SUVR on FBB-PET. When analyzing correlation between each of the four brain lobes and considering both sides of each lobe as a whole, correlation continued to be weak and statistically non-significant for all lobes. When using cerebellum as reference value, two patients had low global SUVR values (0.95 and 1.14, respectively). In these two patients, visual analysis showed high uptake in both supratentorial brain lobes and cerebellum whereas high cerebellar uptake was absent using visual analysis in the other seven patients, probably explaining low SUVR values. When excluding both these patients from analysis, positive relatively strong, but statistically non-significant, correlation was observed between CMB counts on MRI and SUVR on FBB-PET (rho = 0.64, p = 0.14).
Analyses including FBB-PET data using the pons as reference region
Correlation (between FBB-PET SUVRpons, CSF biomarker levels, and CMB count) rho- and corresponding p-values are shown in Table 2.
Compared with target-to-cerebellum method, correlation between CSF biomarkers and SUVR FBB-PET values were stronger, with very strong and statistical significant correlation between CSF Aβ40 and SUVR FBB-PET values. Correlation between total CMB count and global SUVR FBB-PET values was weak, as was correlation between CMB counts on MRI and SUVR FBB-PET values between each brain lobe apart from occipital lobes where only moderate statistically non-significant correlation was seen. When analyzing correlation between each of the four brain lobes considering both sides of each lobe as a whole, correlation was moderate (rho = 0.59) and statistically significant (p = 0.001) for occipital lobes, and continued to be weak and statistically non-significant for the other three lobes. When excluding the two patients with high cerebellar uptake on PET, positive strong, but statistically non-significant, correlation was observed between CMB counts on MRI and SUVR on FBB-PET (rho = 0.71, p = 0.08). Relatively weak, statistically non-significant correlation was seen between posterior fossa CMB counts on MRI and cerebellar (by using the pons as reference region) SUVR on FBB-PET (rho = 0.37, p = 0.35).
Negative, statistically non-significant, correlation (moderate only for Aβ40, weak for the other biomarkers) was observed between CSF biomarker levels and total CMB number (Table 2).
Weak, statistically non-significant correlation was observed between different CSF biomarker levels and WMH score (Table 2).
When analyzing lobe per lobe, a positive, statistically significant (although weak) correlation (rho = 0.30, p = 0.011) was observed between CMB numbers and WMH score on MRI.
When comparing lobe per lobe, weak, statistically non-significant, negative correlation was observed between WMH and SUVR FBB-PETvalues (rho = 0.22, p = 0.06).
There were no statistically significant differences in MRI, CSF, or PET data between CAA-ri patients in the active phase and patients in the remission phase, as no difference was observed between treated and untreated patients.
On SPM analysis, brain areas with statistically significantly increased FBB-uptake were investigated by comparing nine CAA-ri patients against seven controls. When using a stringent level of significance of p < 0.001 corrected for multiple comparisons (SPM family wise error— FWE) adopted with an extent threshold of 20 voxels, increased FBB uptake was observed in posterior regions and frontal lobe (Fig. 2). When using more stringent level of significance (p < 0.0001, 20 voxels), increased FBB uptake was observed in Brodmann areas 9, 11, 25, 32, 37, and 45 (Fig. 2). Box-and-whisker diagrams (Fig. 3) presented as medians and interquartile ranges shows the SUVR values (using the cerebellum and the pons as reference region, respectively) in CAA-ri and control patients (p = 0.03 for SUVRcerebellum and p = 0.0096 for SUVRpons).
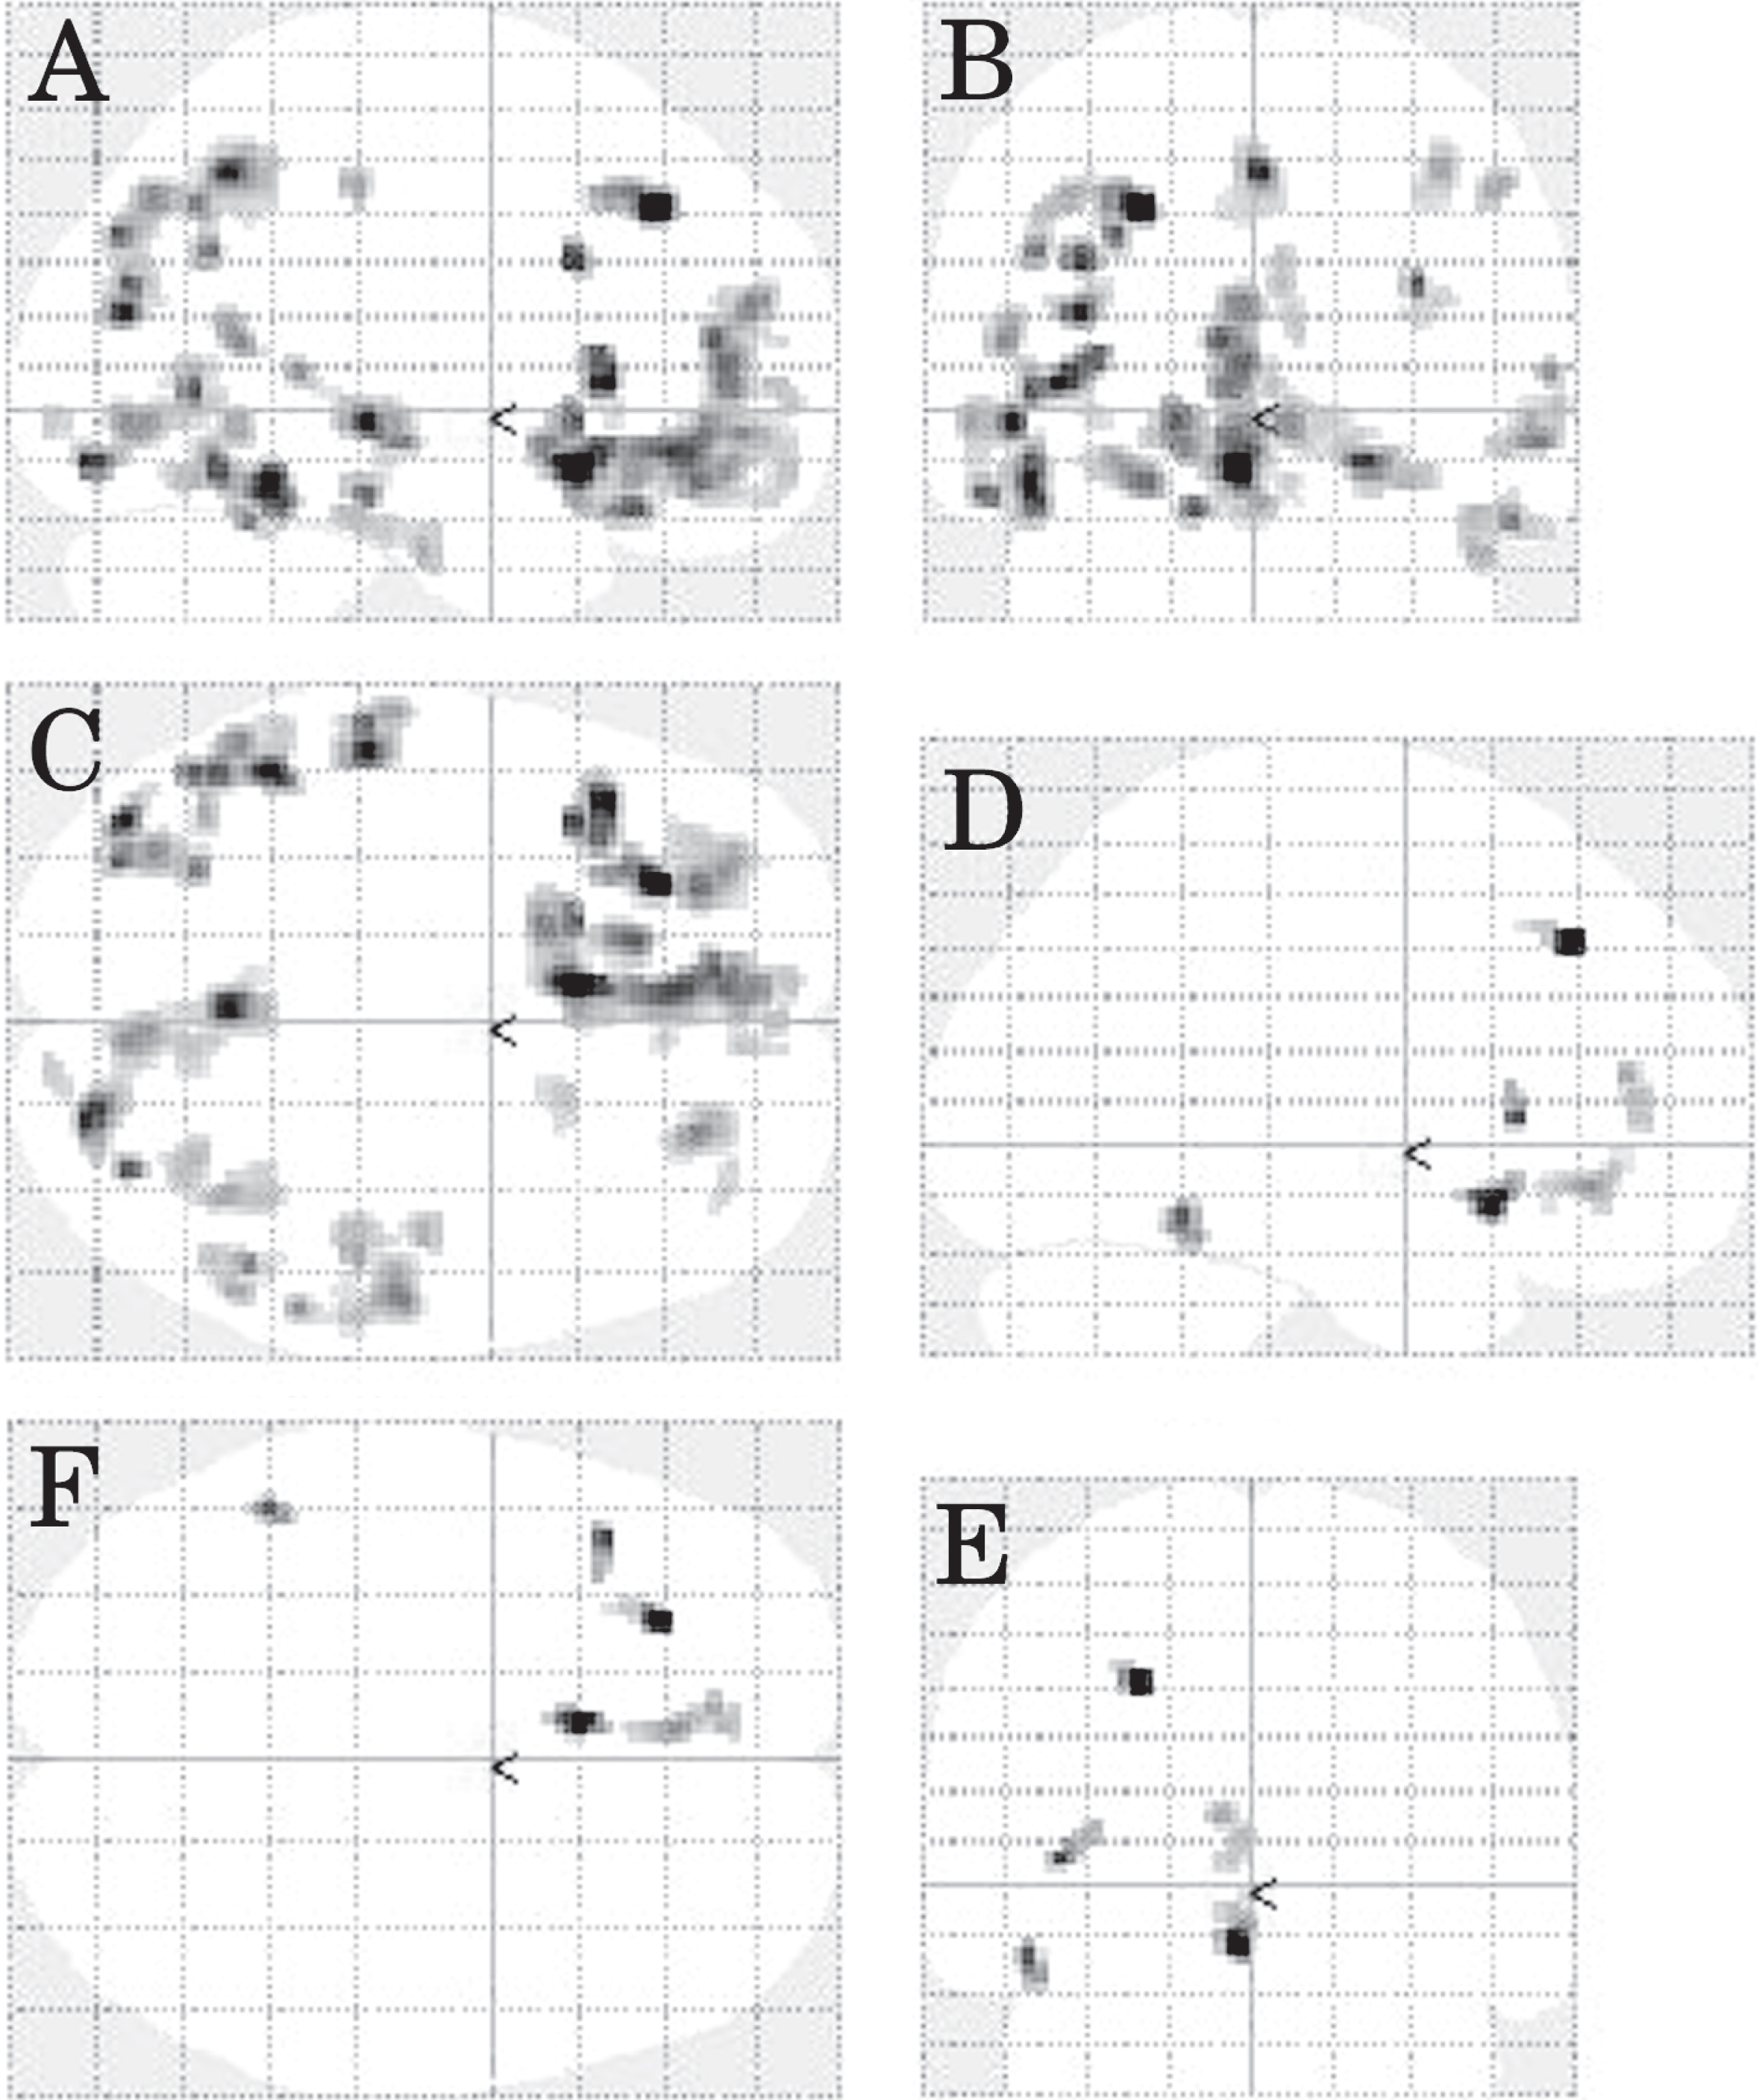
SPM FBB-PET analysis. SPM analysis (A, lateral view; B, frontal view; C, superior view) of FBB-PET showing brain areas with statistically significantly increased FBB-uptake by comparing the nine CAA-ri patients against seven controls. When using a stringent level of significance of p < 0.001 corrected for multiple comparisons adopted with an extent threshold of 20 voxels, increased FBB uptake was observed in the posterior regions and the frontal lobe. When using more stringent level of significance SPM analysis (D, lateral view; E, frontal view; F, superior view) of FBB-PET, when using more stringent thresholds (p < 0.0001, 20 voxels) increased FBB uptake was observed in Brodmann areas 9, 11, 25, 32, 37, and 45.
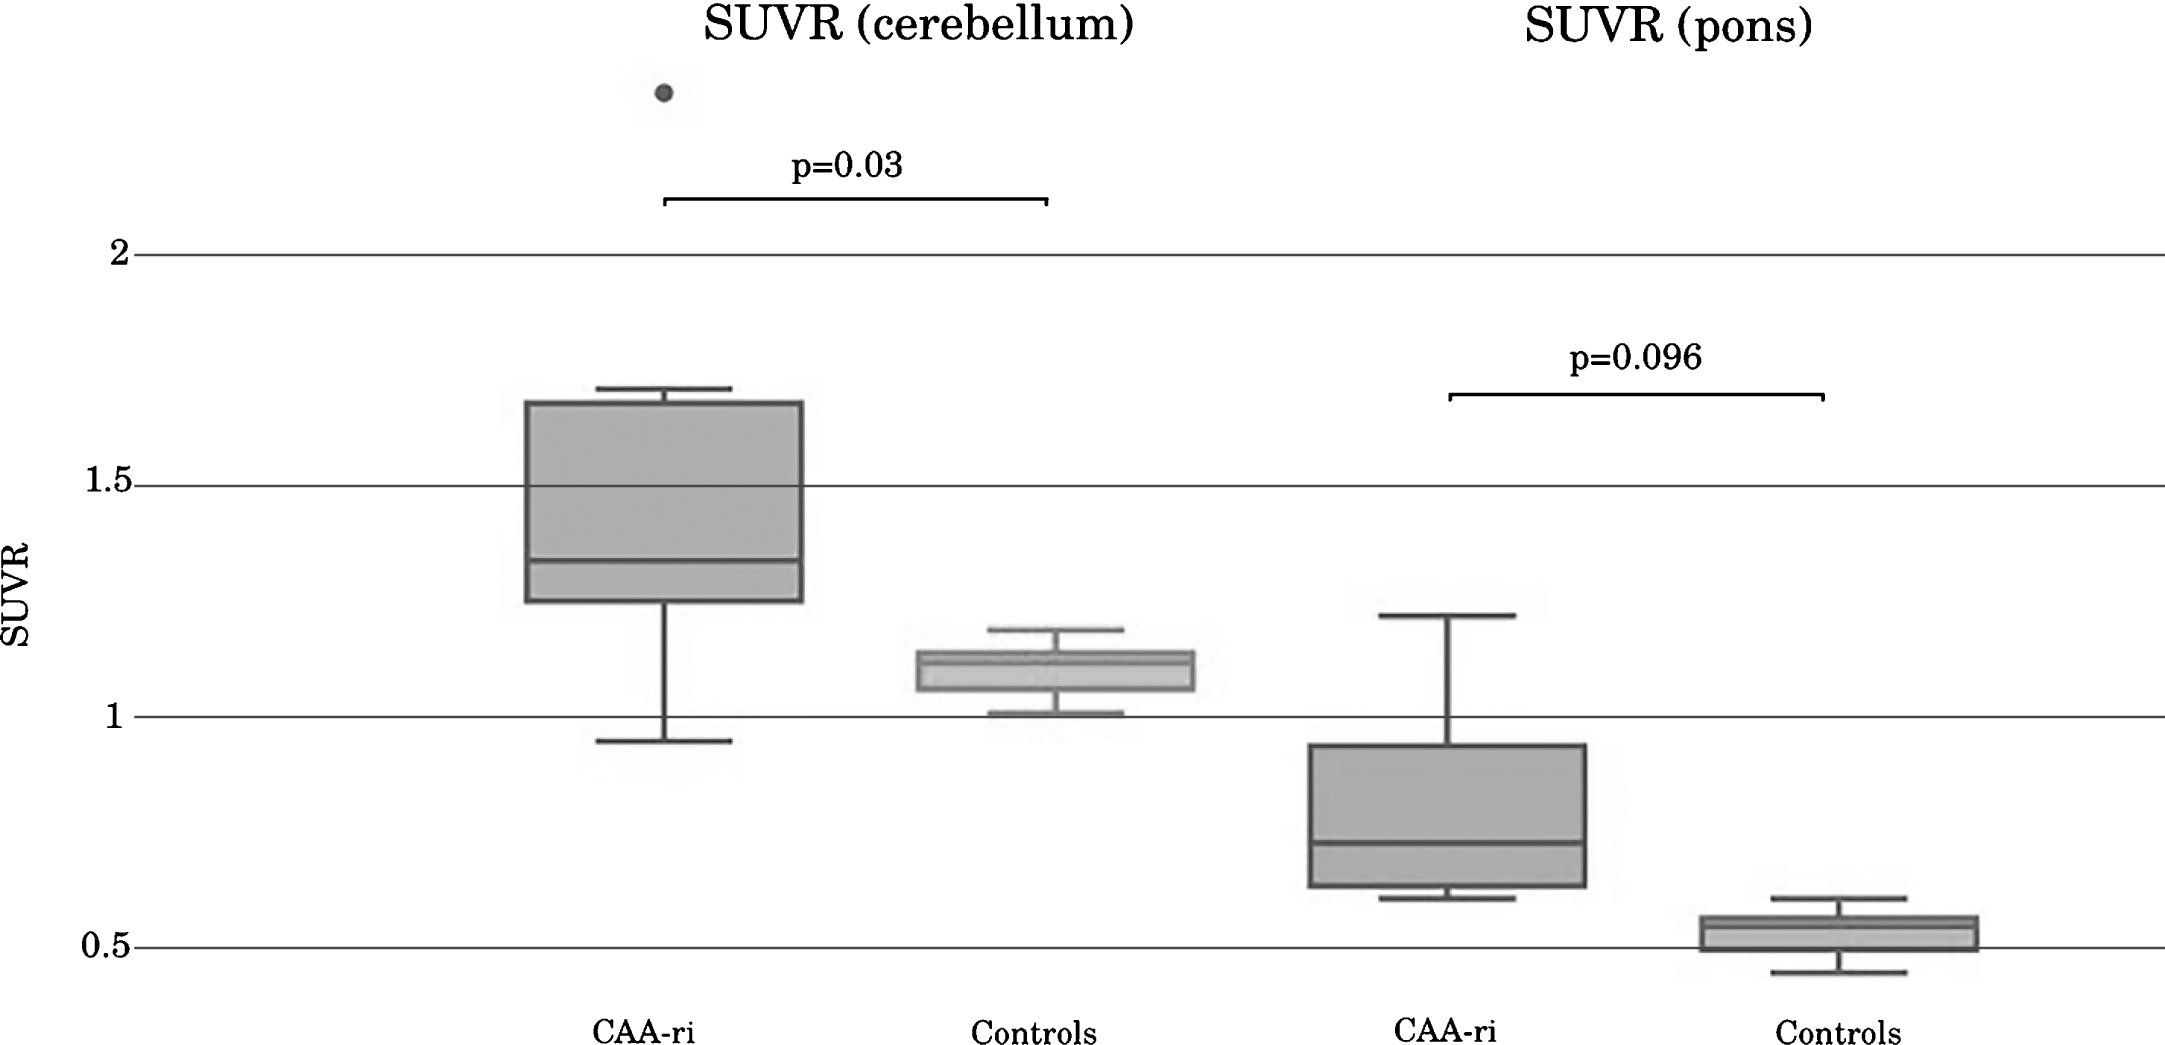
Box-and-whisker diagrams presented as medians and interquartile ranges showing SUVR (with cerebellum and pons as reference region, respectively) in the CAA-ri (n = 9) and the control (n = 7) patients.
DISCUSSION
We studied CSF biomarkers, MRI, and FBB-PET in nine CAA-ri patients. The very high CMB numbers assessed by SWI (median 769 per patient) in CAA-ri patients were in contrast with much lower CMB numbers (up to a median of 111 per patient) earlier reported in CAA [39]. Overall, correlation between CMB numbers and amyloid load on FBB-PET was weak, except for occipital lobes when the pons was used as reference region. The exact relationship between CMB, amyloid load, and inflammation-related features in CAA-ri is unclear. In CAA for instance, pathology studies did not show clear co-localization of Aβ deposition and vessel rupture, questioning the assumption that Aβ deposition in the walls of the cortical vessels directly causes CAA-related microhemorrhages [40]. In CAA-ri, it has to be determined if CMB is a manifestation of the underlying CAA pathology or rather a consequence of inflammation-related mechanisms. In this study, we observed positive correlation between CMB numbers and WMH severity, earlier evoked by our group, suggesting direct or indirect interaction between CMB and inflammation-related processes [41]. Proposed hypotheses include more severe underlying CAA in CAA-ri patients than in patients with simple CAA, CAA-ri occurrence as attempt at amyloid clearance (and CMB as an amyloid-burden feature), or CMB presence as a CAA-ri-induced process. This should be confirmed by PET and pathological studies directly comparing CAA and CAA-ri patients.
SPM FBB-PET analysis in the CAA-ri patients lacked a clear posterior predominance as classically described in CAA. This might be explained by a dynamic process suspected in CAA-ri where inflammation may preferentially occur in areas with higher amyloid burden (as an attempt at amyloid clearance) followed by reduced amyloid burden once CAA-ri has settled. Assuming that WMH are directly related to the inflammatory CAA-ri process, the extent of radiological WMH might be a time-related issue (i.e., with higher WMH score in patients with longer delay between CAA-ri symptom onset and diagnosis/treatment).
Thus, CMB and WMH might not be directly or quantitatively related to amyloid deposition, possibly explaining the lack of correlation between CMB/WMH and FBB-PET uptake in our study.
FBB-PET data (and comparison with MRI and CSF data) of our study have to be interpreted with caution because of the small sample size and the heterogeneity of the CAA-ri patients in regard to the disease state, the treatment status, and the timing of FBB-PET performance.
Very strong, statistically significant, negative correlation was observed between CSF Aβ40 levels and amyloid load on FBB-PET when using the pons as reference region, whereas only moderate and statistically non-significant correlation was seen when using the cerebellum as reference region. Moderate, statistically non-significant correlation was seen between CSF Aβ40 levels and CMB numbers. Lack of statistical significance for certain correlations in our study might be related to the low patient numbers (explained by low CAA-ri incidence).
When using the cerebellum as reference value for FBB-PET, two patients had low global SUVR values (0.95 and 1.14, respectively). In these two patients, visual analysis showed high uptake in both supratentorial brain lobes and cerebellum, whereas high cerebellar uptake was absent using visual analysis in the other seven patients, probably explaining low SUVR values in these two patients. One of these patients with low global SUVR values had one cerebellar CMB versus 942 supratentorial CMB and the other patient had 56 cerebellar CMB versus 3335 supratentorial CMB, evoking the possibility of cerebellar amyloid deposition in end stage CAA in these patients [40]. Based on our data, amyloid load assessed by FBB-PET seems to correlate best with other paraclinical CAA-ri abnormalities (i.e., CSF and MRI) when the pons was used as reference region. For these reasons, the pons might be a more reliable reference region than the cerebellar cortex when assessing amyloid load by PET in CAA and CAA-ri patients.
In studies analyzing CSF biomarkers, CSF Aβ40 levels have been reported to best discriminate CAA and CAA-ri from AD, with lower levels seen in CAA and CAA-ri [8, 33]. The findings of our study, based on quantitative analyses of amyloid load on FBB-PET, suggest that CSF Aβ40 levels reflect the severity of amyloid load in CAA-ri. One previous study described negative correlation between Aβ42 and amyloid load on FBB-PET in AD patients, but other CSF biomarkers were not analyzed [42].
In our study, lower Aβ40 levels were moderately, although not significantly, correlated with higher CMB numbers. In an earlier report in mutation carriers with hereditary cerebral hemorrhage with amyloidosis-Dutch type, decreasing CSF Aβ40 was associated with higher lobar CMB count and presence of cortical superficial siderosis [9]. These data suggest that Aβ40 might be considered as a potential biomarker for bleeding risk in CAA-related disorders. To assess this potential risk factor in future studies, Aβ40 levels must be recorded in larger cohorts of pathologically-confirmed CAA and CAA-ri patients and analyzed by consecutive MRI studies. Although our CAA-ri patient did not have pre-existing cognitive impairment reported by the patients or their family, concomitant incipient AD pathology (also modifying CSF biomarkers and FBB-PET data) could not be ruled out.
Limitations of our study were the lack of pathological CAA-ri confirmation in the majority of patients, the different MRI scans and sometimes also parameters used, limited analyses of auto-antibodies against Aβ40 and Aβ42, the limited number of control patients, and the presence of cognitive deficit or bleeding in some of the control patients used for FBB-PET, meaning they did not represent genuinely healthy controls.
Our study provides insights into how different paraclinical CAA/CAA-ri-related abnormalities (CSF, MRI, and amyloid PET) are related within a group of CAA-ri patients. However, to better understand the pathophysiological mechanisms and to analyze the reliability of the different ligands used for cerebral fibrillar Aβ imaging in amyloid-related disorders, CSF, MRI, and amyloid PET should be studied in and compared between larger groups of pathologically-confirmed CAA, CAA-ri, and AD patients, and healthy controls.