
Abstract
Background:
Brain imaging measurements can provide evidence of possible preclinical Alzheimer’s disease (AD). Their ability to predict individual imminent clinical conversion remains unclear.
Objective:
To investigate the ability of pre-specified volumetric magnetic resonance imaging (MRI) and fluorodeoxyglucose positron emission tomography (FDG-PET) measurements to predict which cognitively unimpaired older participants would subsequently progress to amnestic mild cognitive impairment (aMCI) within 2 years.
Methods:
From an apolipoprotein E4 (APOE4) enriched prospective cohort study, 18 participants subsequently progressed to the clinical diagnosis of aMCI or probable AD dementia within 1.8±0.8 years (progressors); 20 participants matched for sex, age, education, and APOE allele dose remained cognitively unimpaired for at least 4 years (nonprogressors). A complementary control group not matched for APOE allele dose included 35 nonprogressors. Groups were compared on baseline FDG-PET and MRI measures known to be preferentially affected in the preclinical and clinical stages of AD and by voxel-wise differences in regional gray matter volume and glucose metabolism. Receiver Operating Characteristic, binary logistic regression, and leave-one-out procedures were used to predict clinical outcome for the a priori measures.
Results:
Compared to non-progressors and regardless of APOE-matching, progressors had significantly reduced baseline MRI and PET measurements in brain regions preferentially affected by AD and reduced hippocampal volume was the strongest predictor of an individual’s imminent progression to clinically significant memory decline (79% sensitivity/78% specificity among APOE-matched cohorts).
Conclusion:
Regional MRI and FDG-PET measurements may be useful in predicting imminent progression to clinically significant memory decline.
Keywords
INTRODUCTION
One of the keys to slowing the rates of incident Alzheimer’s disease (AD) is to detect the disease early when interventions are likely to be most effective [1]. Even at the stage of mild cognitive impairment (MCI) [2], high levels of cerebral amyloid, hippocampal volume loss, and cognitive/memory impairment are already substantial [3]. Therefore, the best hope for delaying, slowing, or even preventing the onset or the progression of AD requires instituting interventions prior to the development of MCI, which in turn requires methods to identify sensitive biomarkers that precede and predict future symptomatic onset.
The present analysis examined imaging data approximately 2 years before clinical evidence of disease (baseline), with the long-term goal of developing predictive tools for clinicians using readily available neuroimaging biomarkers, such as volumetric MRI and FDG PET. Prior research suggests that brain atrophy accelerates about 2 years prior to clinical detection of MCI [4]. Neuroimaging studies predicting progression from normal to MCI/AD have varied in design, e.g., cross-sectional data [5, 6], group based comparisons [5, 7], longitudinal data with baselines greater than 2 years before clinical symptoms [8 –11] and/or reporting rate of change [4 , 12–14]. These studies suggest that progression to the clinical stages of AD can be predicted by FDG PET measured glucose metabolism reductions in posterior cingulate [8], medial temporal [11], parietal regions [11], hippocampus [10], and entorhinal cortex [9] or MRI measures of hippocampus [7 , 15], entorhinal cortex [5, 15], medial temporal lobe [7, 13], and temporal lobe thickness [6, 14]. Importantly, the time between baseline neuroimaging measures and clinically significant symptoms also varied among these studies, which may account for some of the differences in results. We therefore specifically focused on approximately 2 years before the onset of symptoms for this study. Our cohort of individuals with incident MCI is younger (early 70 s) than those in the Alzheimer’s Disease Neuroimaging Initiative (ADNI) study (late 70 s) and our study examines MRI and PET scans simultaneously at a timepoint that is early enough so emerging preclinical interventions might be more effective. While this longstanding study did not have PET or CSF biomarkers of amyloid or tau pathology, our study provides potential new insights regarding the best established brain imaging measurements of neurodegeneration in the preclinical stages of AD.
MATERIAL AND METHODS
Participants
Study participants were a sub-cohort of 280 from our 23-year longitudinal Arizona APOE cohort study [16 –18]. At the time of this prediction study, 18 participants in the longitudinal study had developed clinically significant memory impairment (16 diagnosed with aMCI, 1 with amnestic and visuospatial MCI, and 1 with AD) and had both MRI and FDG PET data while still cognitively unimpaired at the epoch approximately 2 years prior to progression to MCI/AD. From the cohort of 280, we found a total of 20 participants who had at least 4 years over which they remained cognitively unimpaired (based on clinical, informant, neuropsychological data, and a MMSE>26) that could be matched to these 18 aMCI/AD progressors for sex, age, education, and APOE allele dose. We included a second complementary control group of majority APOE noncarriers due to concern that the APOE-matched comparison group, while clearly not evidencing any signs or symptoms of AD based on clinical presentation or neuropsychological test results, was restricted to mostly APOE4 carriers by virtue of the APOE4 matching and would allow for better interpretation to have a comparison non-progressor group with an APOE4 carriage rate more akin to the general population. The second nonprogressor group was therefore comprised of 35 participants who remained otherwise matched but less weighted for APOE4 carriers, of whom 9 (3 APOE4 homozygotes, 3 APOE4 heterozygotes, and 3 APOE4 noncarriers) overlapped with the APOE4 matched nonprogressors. We utilized the 4-year criteria for nonprogressors to maximize confidence that they were not at undetected preclinical stages of AD.
Entry criteria for the Arizona APOE cohort included a score of at least 27 on the Mini-Mental State Examination (MMSE [19]; with at least 1 of 3 on the recall subtest), a score of 10 or less on the Hamilton Depression Rating Scale, perfect scores on the Functional Activities Questionnaire [20] and Instrumental Activities of Daily Living Questionnaire [21], absence of a current psychiatric or vascular disease, normal neurological examination, and no clinically significant imaging abnormalities. All participants had a family history of dementia, were between 47–68 years of age at study entry, APOE genotyped, completed a full battery of neuropsychological testing, and had both FDG PET and T1 volumetric MRI measurements at every two-year epoch (visit). At entry into the study and at baseline scanning, all members of our cohort were clinically unimpaired, fulfilled study criteria, and had normal neuropsychological profiles. That is, all neuropsychological tests were within normal limits based on normative data from either the testing manual (such as the WAIS-R) or the MOANS (Mayo Older Adult Normative Studies). Participants with one abnormal score could be deemed clinically unimpaired if all other scores within the same cognitive domain were solidly normal and there were no functional impairments. Each subsequent testing periods were reviewed by DECL and RJC for evidence of abnormal scores or decline from the prior epoch. Amnestic MCI (aMCI) diagnosis was determined by RJC and DECL based on published criteria [22, 23] using clinical, functional, and neuropsychological data that included a wide battery of tests with >1 test per domain.
This study was approved by the Mayo Clinic and Banner Good Samaritan Institutional Review Boards, and after complete description of the study to the subjects, written informed consent was obtained.
Brain imaging
18F-fluorodeoxyglucose (FDG) PET and volumetric T1-weighted MRI were obtained from each subject as previously described [24, 25]. All MRI scans were performed on the same 1.5-T Signa system (General Electric, Milwaukee, WI). The reconstructed images included 128 contiguous horizontal MRI slices with slice thicknesses of 1.5 mm and in-plane voxel dimensions of 0.94×0.94 mm. All PET scans were performed on either the HR+ scanner or the 951/31 Scanner (both from Siemens, Knoxville, TN) and the scanner type variation was accounted for in the analysis. PET images acquired during the last 30 min were used for the analyses of this study.
Image analyses
The a priori measures included MRI based regional left, right and total hippocampal volumes, left and right parahippocampus thickness, left and right entorhinal thickness, FDG PET based posterior cingulate cerebral metabolic rate of glucose (CMRgl) [26, 27] and the hypometabolic convergence index (HCI) [31]. We subsequently also examined the performance of the 5 meta-ROIs from ADNI based on coordinates cited frequently in other FDG studies comparing AD, MCI, and cognitively unimpaired subjects (http://adni.loni.usc.edu/methods/research-tools/). Voxel-wise analyses were also conducted to examine areas of decreased grey matter volume and spatial patterns of lower CMRgl across the whole brain in individuals who progressed to aMCI compared to those who remained cognitively unimpaired. To adjust significance levels for the number of resolution elements in a priori regions known to be affected by AD, the progressor/non-progressor difference in each of the ROIs listed above was corrected for multiple comparisons with family-wise error (FWE) correction. A threshold of p < 0.05 was used via the small volume correction procedure in SPM. Additional exploratory voxel-based analyses, p≤0.005, uncorrected for multiple regional comparisons, were used to identify significant differences in regional measurements. The use of the uncorrected p = 0.005 was emperically determined previously to provide a balance between type-I and type-II errors [24].
Volumetric MRI
The automated brain mapping algorithmic programs FreeSurfer (http://surfer.nmr.mgh.harvard.edu/) and Statistical Parametric Mapping (SPM) (http://www.fil.ion.ucl.ac.uk/spm/) voxel-based morphometry (VBM) were each used with default setting to pre-process MRI data. Automated segmentation and normalization procedures were applied to each subject’s MRI to exclude non-brain tissue and to generate gray matter probability map and to smooth this map with a kernel of 8 mm in full width at half maximum in the Montreal Neurological Institute (MNI) template coordinate space [28, 29]. A common mask was created and applied to the segmented gray matter maps to include gray matter voxels with an intensity value of at least 0.2 for subsequent analyses. After each pre-processing step, images were visually examined carefully per our routine quality control (QC) procedure. No MRI scans were excluded due to quality concerns for the VBM analysis. FreeSurfer was used to estimate a priori MRI hippocampus volumes and entorhinal and parahippocampal cortical thickness [30, 31] for differences between those individuals who subsequently progressed to clinically significant memory decline and those who did not. Careful QC of the FreeSurfer outcomes was also performed. All except one in the non-APOE4 matched control group passed the QC without requiring additional editing of the parcellation results, including the medial temporal lobe segmentation. The one with failed QC (even after some attempted editing) was excluded in the subsequent analysis. The hippocampus volume was corrected for the intracranial volume (ICV) so the hippocampus volume we reported was relative volume (to ICV).
FDG PET
SPM8 was independently used to linearly and nonlinearly deform (normalize) each participant’s FDG PET image into the coordinates of the MNI space using the PET template and spatially re-smoothed with a 3D Gaussian kernel with 8-mm FWHM. The Automated Anatomical Labeling toolbox [32] was used to extract the PET data from the bilateral posterior cingulate ROI based on our own previous voxel-wise analysis [26, 27] for each person. Posterior cingulate measurements were normalized for individual variation in whole-brain measurements using proportionate scaling to form what is referred to as the relative CMRgl. We then subsequently performed separate SPM and posterior cingulate ROI analyses using the cerebellum and pons as reference regions, due to the concern that the reference region may affect the results.
The HCI was calculated as previously described [33]. The HCI reflects in a single measurement the extent to which the pattern and magnitude of cerebral hypometabolism in an individual’s FDG PET image corresponds to that in probable AD patients, and is generated using a fully automated voxel-based image analysis procedure. The HCI, alone or in combination with hippocampal volume, has been shown to be predictive of conversion to AD from MCI [33], and is also associated with APOE4 allele dose [34].
Modeling and analysis for the prediction analyses
Independent two-sample t-tests were used to examine the differences between a priori measurements in progressors and nonprogressors. These measures were then each used separately or in combination to examine the statistical power in distinguishing the two groups using Receiver Operating Characteristic (ROC) together with binary logistic regression and leave-one-out procedures. Using the pROC procedure from R Project (http://www.r-project.org) and the DeLong method [35], steps in the ROC analysis included: 1) logistic regression based classifier training on (n-1) cases; 2) classifier testing on the one left out, repeating n times until every case had been classified; 3) examining the one-tailed significance of the ROC’s area under the curve (AUC), as reported previously [36]. The Minimized Difference Threshold (MDT) [37] was used to determine sensitivity and specificity of the classifications.
Our primary analysis used only imaging data in the model, because the diagnosis of MCI considers all longitudinal cognitive and functional data (but not imaging data), including the epoch prior, i.e., baseline. At the conversion epoch, other than the 1 participant who progressed to AD, all progressors met published criteria for MCI [22, 23]. Although at baseline no participants fulfilled criteria for MCI and all were cognitively unimpaired, baseline data were part of a continuum of data that also included historical information, the Clinical Dementia Rating scale, and a large battery of neuropsychological tests including multiple tests and test scores within each cognitive domain including but not limited to memory. MCI due to AD represents a decline from a prior level of performance. Participant performances fluctuate up and down over time on most measures, and making a diagnosis of MCI in the setting of a longitudinal study must take all available data into account [17, 38]. As a secondary analysis we also did a post-hoc analysis using binary logistic regression and leave-one-out procedures that included each of the cognitive measures.
RESULTS
Progressors included 13 APOE4 homozygotes, 3 APOE4 heterozygotes and 2 APOE4 non-carriers. APOE4-matched nonprogressors included 13 APOE4 homozygotes, 4 APOE4 heterozygotes, and 3 APOE4 non-carriers. The nonprogressor group not matched for APOE4 included 3 APOE4 homozygotes, 11 APOE4 heterozygotes, and 21 APOE4 non-carriers. The average age of aMCI/probable AD dementia diagnosis was 70.7±5.0 (range: 61 to 78 years). On average, the baseline scans for this prediction study were collected 1.8 years±0.8 (range: 1 to 4 years) prior to aMCI/AD diagnosis for the progressor group. The range of years that individuals in the progressor group had been followed since they entered the original prospective cohort study and the epoch before they developed cognitive impairment (i.e., time of baseline scan) was 2 to 14 years (average 7.6 years, SD = 4.4 years). The range of years that individuals in the nonprogressor groups had been followed after their scans was 4 to 12 years (average 6.8 years, SD = 2.3 years) in the APOE4 matched cohort and 4 to 17 years (average 8.7 years, SD = 3.7 years) in the cohort not matched for APOE4. Given our matching criteria, age, sex, and education were similar at the time of scan, as was APOE allele dose for the nonprogressor group that was matched for APOE4 allele dose. Progressors and both sets of nonprogressors also did not differ in their family history of dementia, i.e., the proportions of father, mother, or both parents. For both the APOE4-matched and non-matched groups, there were no significant differences between progressors and nonprogressors on WAIS-R subtests, Dementia Rating Scale (DRS), or Controlled Oral Word Association Test (COWAT). Significant differences were found on memory tests, as expected on the basis of receiving the amnestic MCI diagnosis— based in part on memory test decline— in the progressor group at the subsequent epoch. Group characteristics are reported in Table 1. Although group averages appeared below published norms for AVLT, individual progressors did not exhibit impaired scores on more than one memory test at this stage and appeared to be a result of normal intraindividual variability [38, 39], nor were there functional impairments. Differences in measures of memory were also evident at their first entry into the prospective cohort study even though group averages were completely normal, and there were no group differences at time of entry into study on measures of general intellect, language, working memory, mental speed, problem solving, or depression/anxiety.
Characteristics of amnestic MCI progressors and nonprogressors at the time of baseline scan
Sex and genotype p-values were calculated by chi-squared tests, while all other category p-values were calculated by t-tests. HM, ɛ4 homozygote; HT, ɛ4 heterozygote; NC, ɛ4 non-carrier; MMSE, Folstein Mini-Mental State Exam; DRS, Dementia Rating Scale; CFT, Rey-Osteirreth Complex Figure Test; WAIS-R, Wechsler Adult Intelligence Test-Revised; WMS, Wechsler Memory Scale; BNT, Boston Naming Test; COWAT, Controlled Oral Word Association; AVLT, Rey Auditory Verbal Learning Test. All scores above are raw scores except the WAIS-R subtests, which are age-corrected scaled scores.
Neuroimaging group differences, prespecified ROIs and the HCI
Statistical analysis of predefined ROIs confirmed that progressors had smaller volume in hippocampus, entorhinal thickness and parahippocampal thickness than both nonprogressor groups. Progressors also showed increased HCI but no significant differences from both nonprogressor groups in posterior cingulate metabolism (Fig. 1).
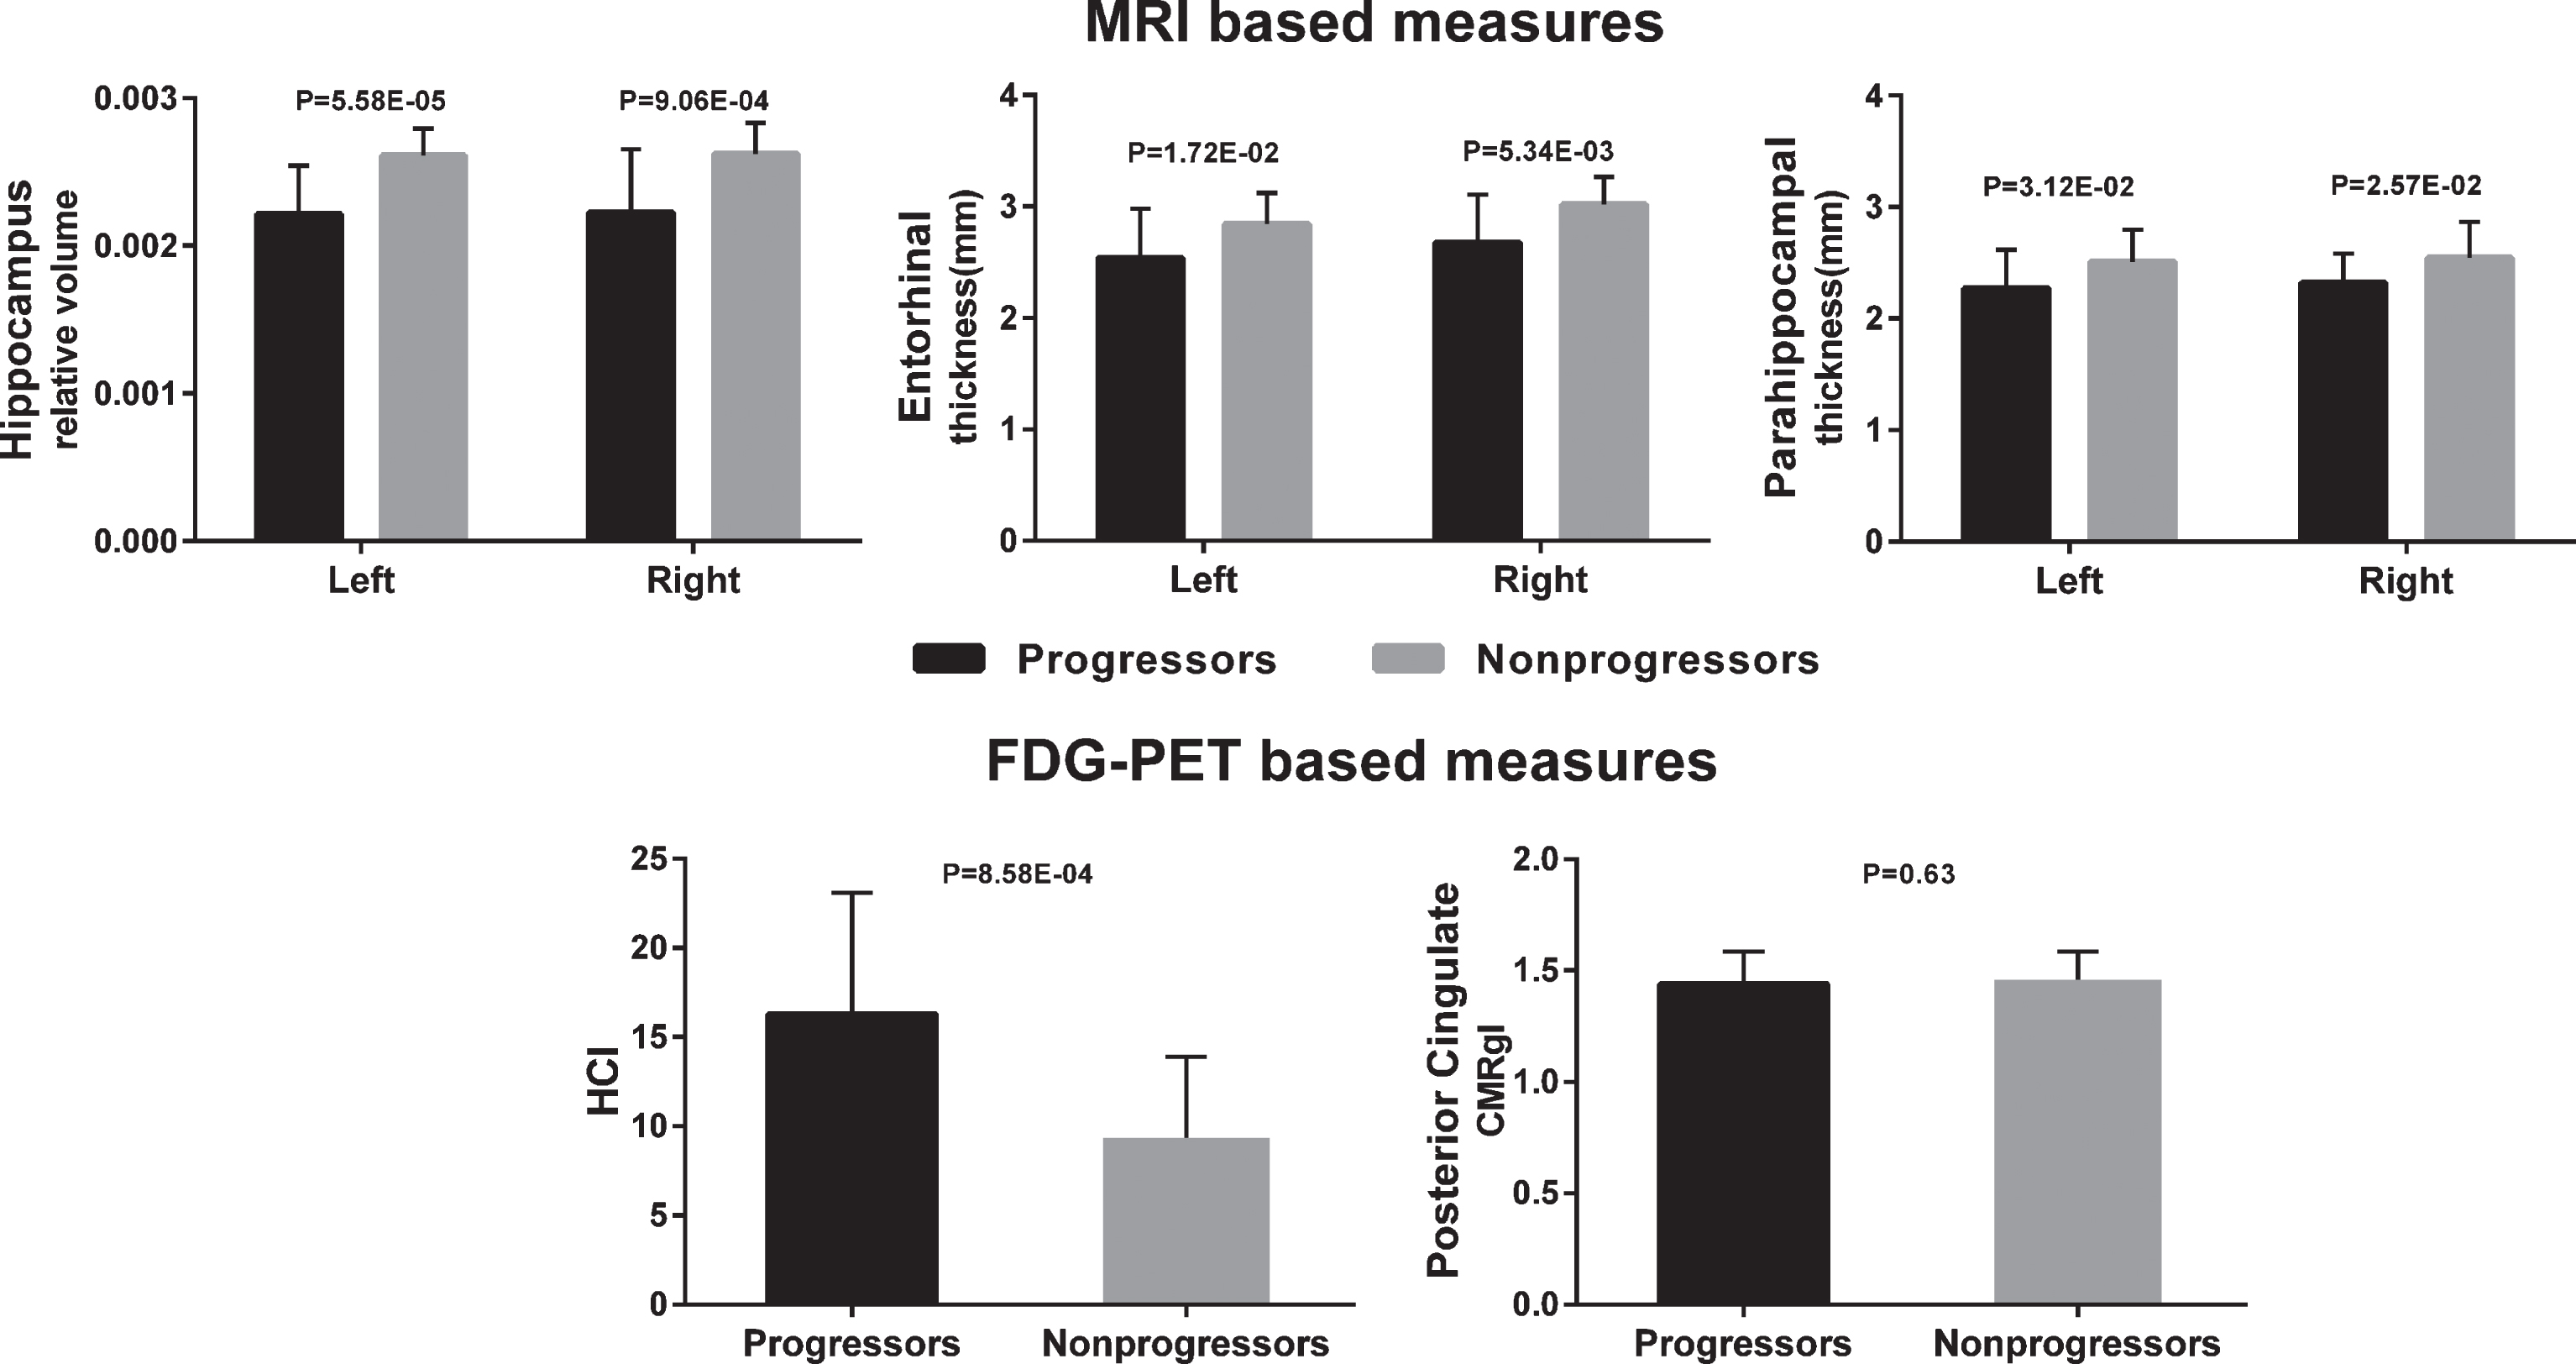
Neuroimaging group differences for a priori baseline regions of interest (18 Progessors and 20 APOE-matched Nonprogressors).
Neuroimaging group differences, voxel-based analysis findings
Compared to both groups of nonprogressors, those who progressed to incident aMCI/AD had lower (FWE corrected p < 0.05) FDG PET measured CMRgl in right and left parietal, left and right temporal, and occipital regions (Fig. 2). At uncorrected p = 0.005, glucose hypometabolism (lower CMRgl) in the progressors was found in additional brain areas, including angular, frontal and parietal regions. Results did not change when using cerebellum as the reference region instead of the global mean for FDG PET data; however, we found a greater magnitude and more wide-spread spatial extent differences between progressors and nonprogressors when using the pons as reference. MRI VBM analysis revealed that progressors had significantly lower gray matter volume compared to the nonprogressors (FWE corrected p < 0.05) in left and right hippocampal, left and right parahippocampal, left and right parietal, posterior cingulate, left and right precuneous, and left and right temporal regions (Fig. 3). At uncorrected p = 0.005, lower regional gray matter volume was found in additional brain areas, including frontal, amygdala, angular, calcarine, fusiform, lingual and caudate.
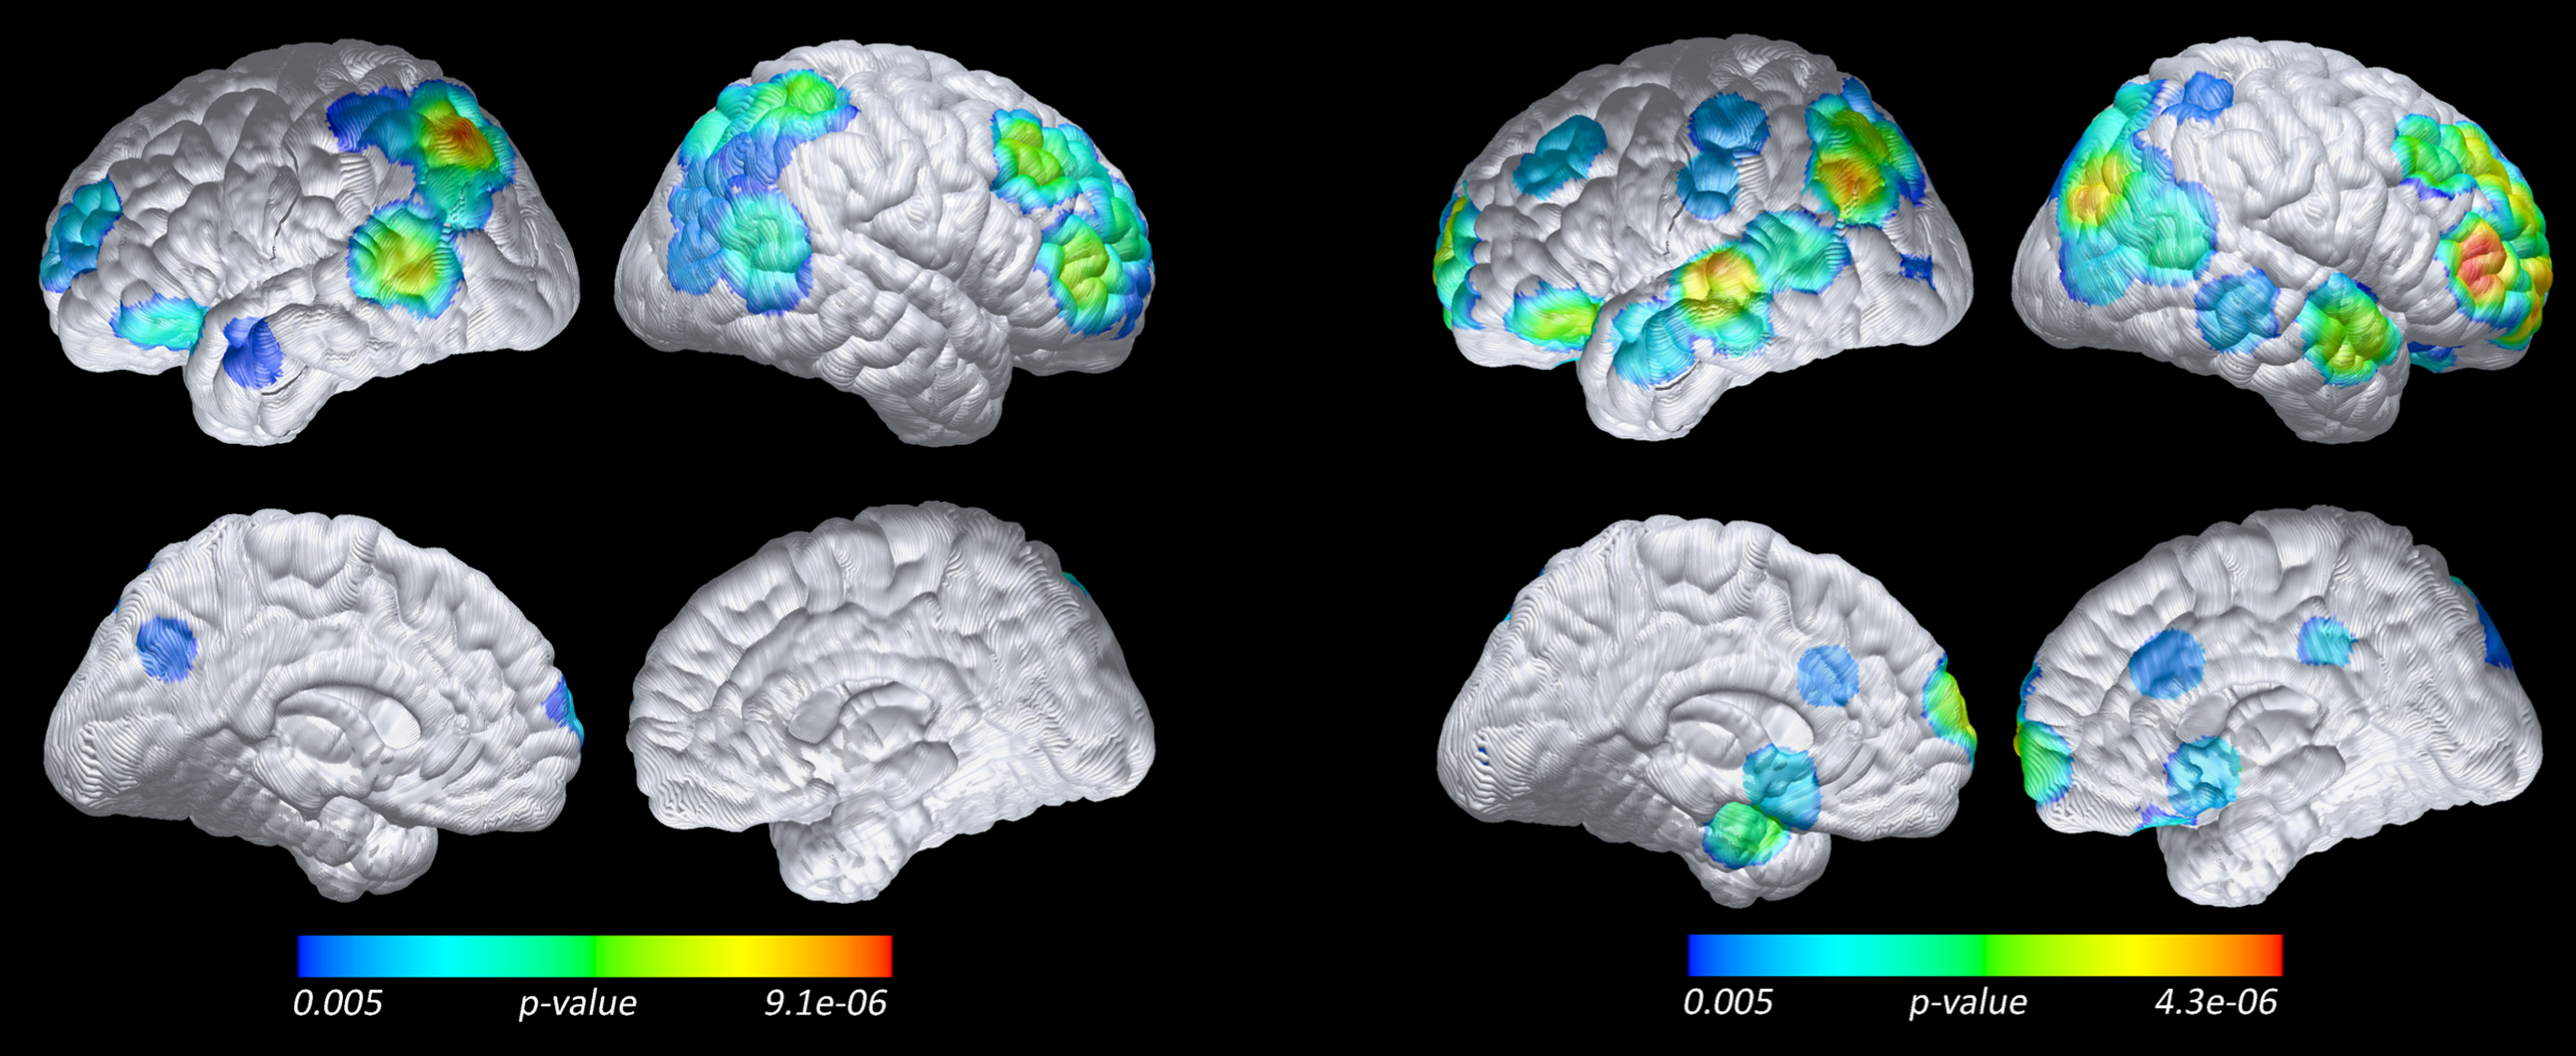
Lower baseline CMRgl in 18 Progressors compared to 20 APOE-matched Nonprogressors (left), and 35 Non-APOE-matched Nonprogressors (right) (voxel-based analysis, FDG PET, p = 0.005 uncorrected and without spatial clustering, with whole brain as reference).
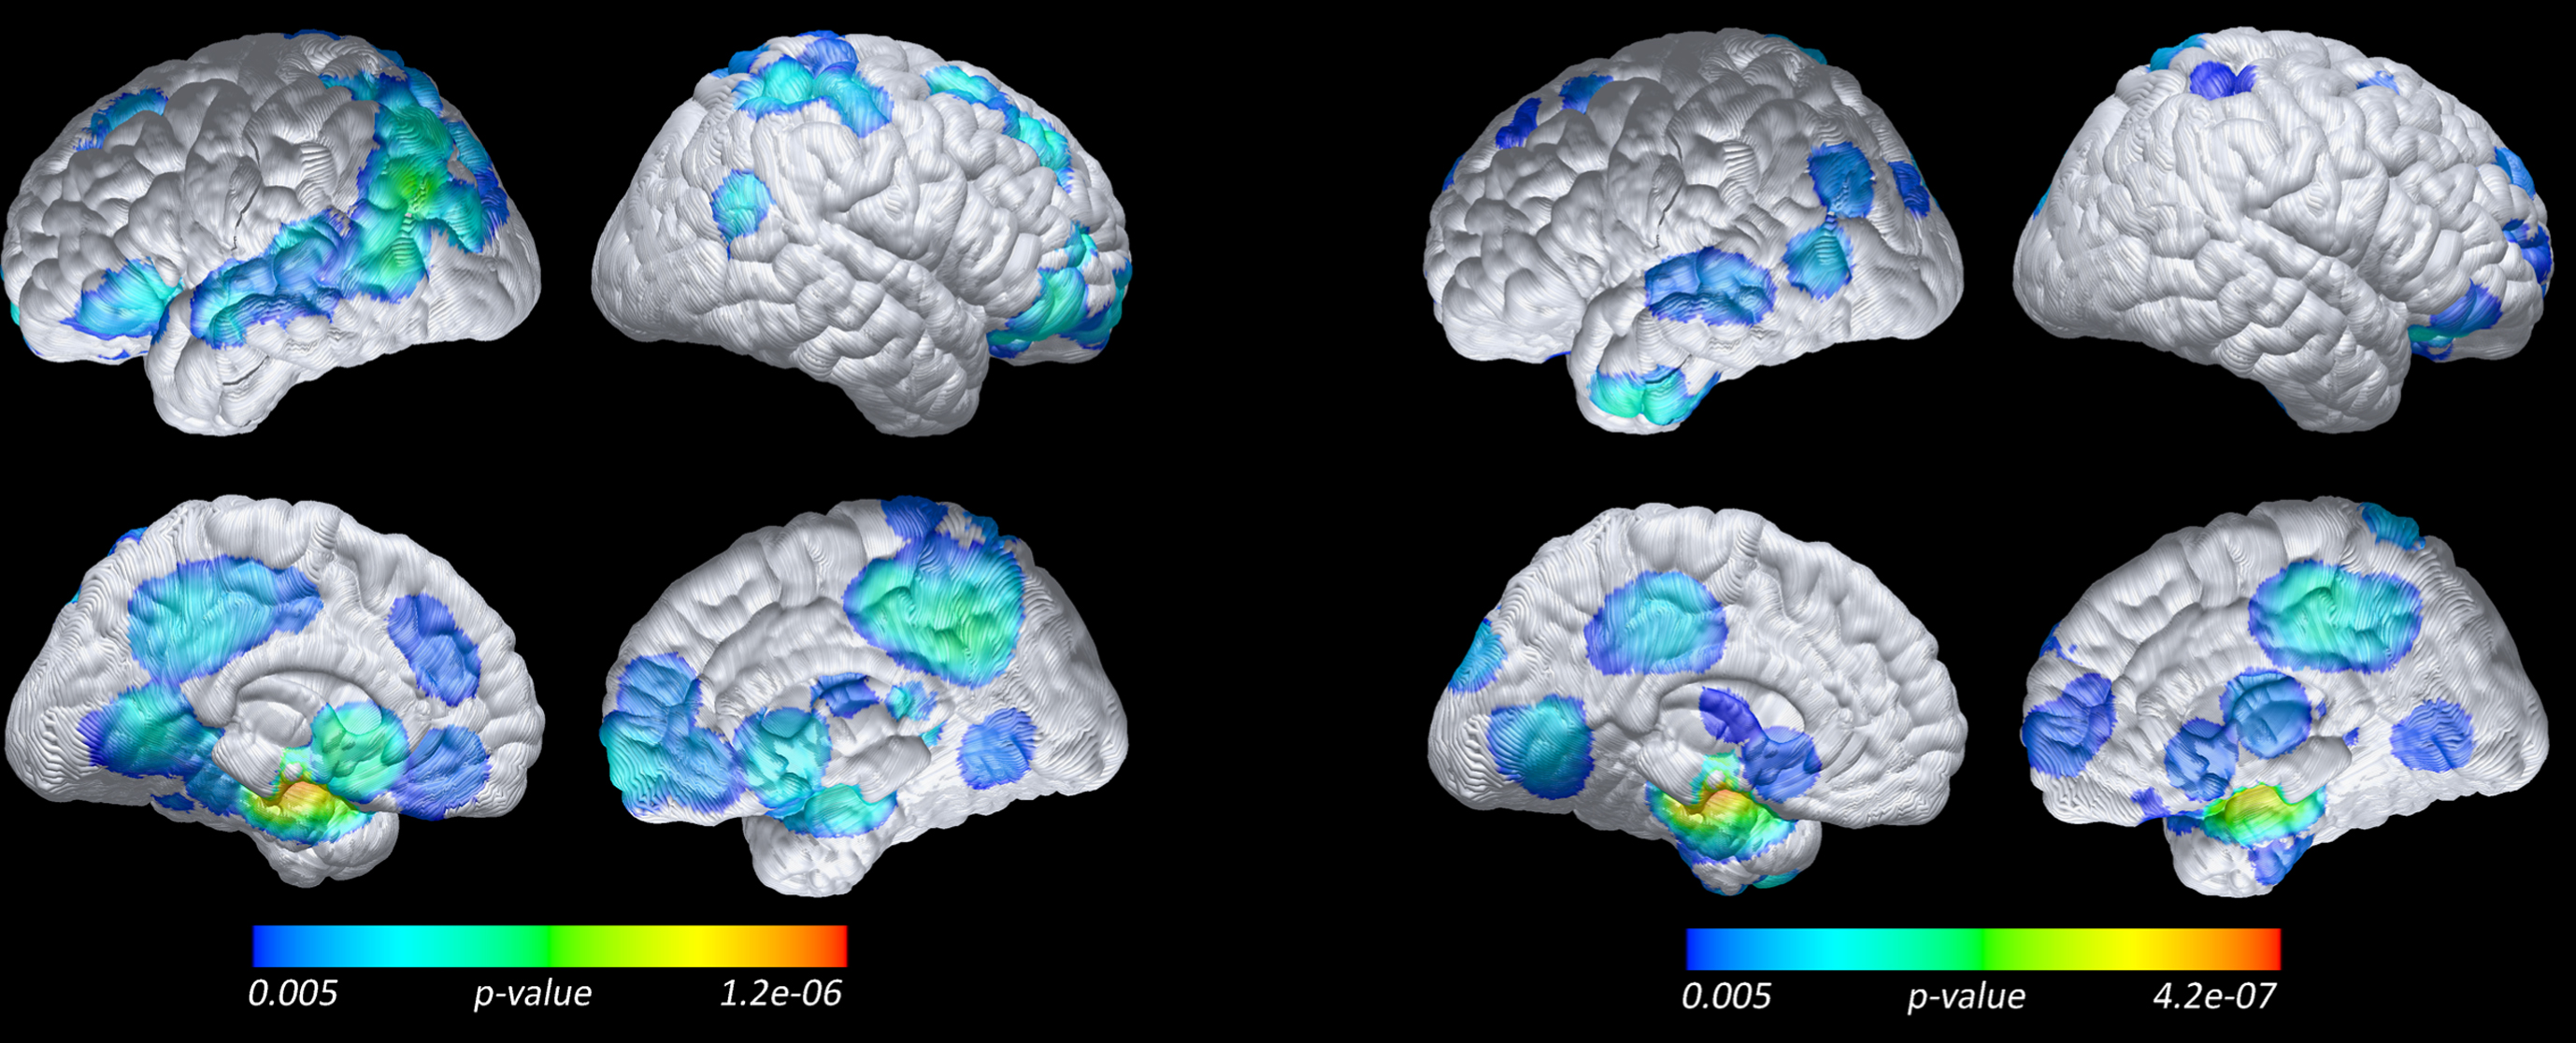
Lower baseline regional grey matter in 18 Progressors compared to 20 APOE-matched Nonprogressors (left), and 35 Non-APOE-matched Nonprogressors (right) (voxel-based analysis, MRI, p = 0.005 uncorrected and without spatial clustering, with whole brain as reference).
Predicting progressors from nonprogressors based on primary imaging ROI measures and HCI
The predictive power, separate and combined, of FDG PET HCI, posterior cingulate, ADNI’s meta-ROI CMRgl measures, MRI hippocampal volume and entorhinal cortical thickness measures to identify individual progressors and nonprogressors is summarized in Table 2. P values in Table 2 reflect one-tailed significance levels regarding whether AUC for the ROC is statistically greater than 0.5, the null hypothesis being less than or equal to 0.5. As noted in Table 2, the best single predictor of imminent progression to aMCI/AD in the APOE4 matched groups was right and left hippocampal volume, each with 79% sensitivity and 78% specificity; left hippocampal volume was the single best predictor of progression for the non-APOE matched groups, with 74% sensitivity and 72% specificity. There was no improvement in performance when adding FDG PET data. Using the cerebellum as reference yielded results similar to that of whole brain reference. However, we found better performance of posterior cingulate using pons as reference than with the whole brain reference. Nonetheless, HCI remained the best predictor among FDG PET ROI’s (Table 2). A post-hoc analysis showed that among the cognitive measures, AVLT long-term memory (LTM) scores were the best predictor of progression at 74% sensitivity and 72% specificity in both the APOE4-matched and non-matched groups— no better than hippocampal volume despite the potential bias of including our cognitive data in the model. Combining AVLT LTM with hippocampal volume did not improve prediction from hippocampal volume alone in the APOE-matched groups, but it did improve the prediction accuracy for the non-APOE-matched groups to 80% sensitivity and 78% specificity. All a priori measures were predictive of outcome with a p value less than 0.05 except posterior cingulate (whole brain reference), left temporal, and right angular CMRgl and parahippocampal thickness. Among the FDG PET or MRI based progressor predictors, the DeLong test indicated that the template-based posterior cingulate CMRgl was significantly worse than the other variables.
ROC logistic regression leave-one-out results for MRI, PET, and MRI PET combined. Results are separated by APOE-matched Nonprogressors (top) and Non-APOE-matched Nonprogressors (bottom)
ROC, Receiver Operating Characteristic; HCI, Hypometabolic Convergence Index; HCV, Hippocampal Volume. Meta ROIs are from Alzheimer’s Disease Neuroimaging Initiative (ADNI): http://adni.loni.usc.edu/methods/research-tools/. *MRI results are based on 18 progressors and 19 non-progressors due to 1 non-progressor failing quality control for the Freesurfer preprocessing pipeline. This did not affect VBM analyses. ** post-hoc analyses.
DISCUSSION
This study utilized longitudinal clinical outcome data from a well-defined age, sex, education, and APOE4-dose balanced sub-cohort of cognitively unimpaired individuals who progressed to incident aMCI within approximately 2 years and “non-progressor” individuals who did not develop clinical symptoms (and who were observed for at least 4 years to remain asymptomatic). Our study is unique in that we directly compared the prognostic value of FDG PET and MRI in predicting imminent clinical progression for individual subjects. Statistical analysis of predefined ROIs indicated that progressors, compared to both APOE4-matched and non-matched nonprogressors, showed reduced hippocampal volume, entorhinal thickness, and parahippocampal thickness. Progressors also showed increased HCI and decreased right temporal CMRgl but no significant differences in posterior cingulate metabolism. We further established that among MRI measures of gray matter volume and cortical thickness and FDG PET regional CMRgl measures, hippocampal volume was the best predictor of progression to clinically significant decline occurring within approximately 2 years. Using a binary logistic regression classifier, hippocampal volume was predictive of clinical progression to MCI/AD for any given individual with 79% sensitivity and 78% specificity; combining FDG PET and MRI data did not improve the performance. Similarly, in the non-APOE4 matched cohort, left hippocampal volume was the single best predictor of progression and combining FDG PET and MRI did not improve the performance. Interestingly, despite our concerns about potential bias with including cognitive data in the model, cognitive measures did not out-perform hippocampal volume in predicting clinically significant memory decline.
Though we subsequently introduced amyloid PET and tau PET to this overall study, we did not have these data for this specific sub-cohort available at baseline. Given the emerging convention to characterize preclinical AD based on brain imaging or fluid biomarker evidence of amyloid, tau pathology, and neurodegenerative pathology, this additional information is likely to impact the prediction of subsequent progression to the clinical diagnosis of aMCI or AD dementia— and to clarify the extent to which of these measures specifically predict progression to those forms of clinically diagnosed aMCI and AD dementia that are associated with significant amyloid pathology [40]. However, our findings may be of particular value to those researchers and clinicians who are limited to available MRI or FDG PET data. Despite significant baseline FDG PET group differences between progressors and nonprogressors in brain regions preferentially affected by AD and the HCI, FDG PET changes probably occur earlier than hippocampal atrophy [3 , 42]. We previously showed that MRI changes occur later than FDG PET changes [43, 44]. Whether the earlier FDG PET changes reflect a progression of neuronal loss versus very early developmental metabolic reductions in APOE4 carriers, FDG PET may not have additional value at the stage of imminent clinical progression. Future studies should examine the predictive power of earlier baseline data, e.g., 10 years prior to diagnosis, and in those cases the functional imaging data and/or amyloid or tau biomarkers may contribute more information than the MRI data alone.
Our study complements and partly contradicts findings from a similar multimodal prediction study that utilized longitudinal data from the ADNI data base [11]. Ewers and colleagues found that FDG PET, not MRI, was predictive of progression to MCI/AD. The different result can be explained by several factors. First, both studies had a relatively small n (the ADNI study had 11 progressors and we had 18 progressors), which unfortunately limits generalizability and consistency of results and underscores the need to have additional studies, including this report. Second, their population was on average 10 years older (79 years for progressor and 74 years for non progressor versus ours at 69 years for progressor and 67 and 68 years for nonprogressor groups), had more men than ours (63% versus 38%), and their progressor and nonprogressor groups were not as closely matched for age and sex as ours. We had an APOE enriched sample and 2 nonprogressor groups, one matched for APOE4 and the other with significantly less APOE4 carriers, though our non-APOE matched nonprogressors were comparable to the proportion of APOE4 carriers in the ADNI study’s progressor group. Their nonprogressors were followed a minimum of 3 years, whereas ours were followed a minimum of 4 years. Additionally, their baseline was 3 to 4 years prior to progression, whereas we specifically targeted 2 years prior to progression. However, focusing on either 2 or 3 years prior to clinical progression is practical for the clinical setting. Both studies and other like them lay the groundwork for development of a clinical tool to aid in predicting imminent clinically significant decline using biomarker data such as MRI and/or FDG PET.
Our sample was enriched for APOE4 allele dose, well defined, and assessed with a wealth of additional clinical and cognitive measurements. Thus far, 8 were later diagnosed as definite AD, 6 developed probable AD, 3 remain aMCI likely due to AD, and 1 improved in memory and function at the epoch subsequent to the aMCI diagnosis but again declined to conform with an aMCI diagnosis at the most recent epoch. The one individual who improved had the largest hippocampal volume of all the progressors, consistent with our conclusion that hippocampal volume is a good predictor of imminent clinically significant decline. When the one participant who showed improvement in the epoch after MCI diagnosis was removed from the analysis, the prediction for combined right and left hippocampal volume improved to 84% specificity and 82% sensitivity; otherwise the results were unchanged. This underscores the utility of having sufficient follow-up data or other biomarker evidence to increase confidence that the groups are accurately defined. More sensitive methods to examine subregional hippocampal surface differences [45, 46] may also allow for more accurate classification of imminent progression than hippocampal volume, and we are currently investigating those methods.
Prior research, largely from cross-sectional data, supports the hypothesis that hippocampal volume is predictive of progression from MCI to AD [47 –51] at least 18 months before MCI symptom onset [3, 52]. Cross-sectional data from the Dominantly Inherited Alzheimer’s Network prospective longitudinal study [53] suggest that hippocampal atrophy can be detected 15 years before expected symptom onset. Another cross-sectional study comparing Autosomal Dominant AD mutation carrier biomarkers to noncarriers [41] indicates that CSF and PET measures of Aβ pathology 20 years before symptoms are followed by CSF measures of tau pathology and regional CMRgl decline, followed by hippocampal atrophy 6 years before symptoms, followed by clinical progression. Finally, a biomarker study [42] of late-onset sporadic AD also suggested that amyloid PET changes 17 years before, hippocampal changes 4 years before, and memory impairment at 3 years before a CDR of 1.
We used global normalization, i.e., whole brain reference, for the FDG PET analyses, based on significant findings with this method in our previous publications on cognitively unimpaired individual carrying 0, 1, or 2 copies of APOE4 allele [24 , 54], or on AD patients [26, 27]. However, after noticing the relatively poor performance of the posterior cingulate ROI, we performed post-hoc additional SPM and ROI analyses using separately the cerebellum and pons as reference regions. Although not numerically better than HCI, we indeed found better performance of posterior cingulate when using pons as the reference region. Moreover, for the voxel-wise analysis, we found greater magnitude and more widespread spatial extent differences between progressors and nonprogressors when using the pons as reference region. The results from these exploratory analyses underscore the need for further study to establish best methods for analyses of pre-clinical FDG PET biomarkers.
This study has limitations. First, all participants were selected to have a first-degree family history of dementia, so results may not generalize to those without this family history. Second, although we found similar results regardless of whether the nonprogressors were APOE4 carriers, the progressors were largely APOE4 carriers and results may not generalize to APOE4 noncarrier progressors. Third, the absence of baseline PET or CSF biomarker measurements of amyloid or tau pathology for the entire sample made us unable to use those biomarkers either in the predictive model or for further characterizing our two groups. This is of particular relevance in light of a recent study reporting that abnormal levels of amyloid and tau, independent of APOE, appear to predict subsequent cognitive decline (though with a much larger age range and younger subject group than in our study) [55]. We know that there is heterogeneity in amyloid positivity or negativity among individuals with a clinical diagnosis MCI and dementia due to possible or probable AD, so having confirmatory amyloid or tau data would have strengthened the quality of our training set. We are acquiring those measurements in an increasing number of subjects, so future studies from this cohort should be able to use such data. Fourth, the sample size of the progressor group was relatively small and may not have the power to detect all of the relevant differences between groups. Fifth, the MRI data used here were from a 1.5T scanner; greater sensitivity and specificity might be achieved with 3T MRI data, especially if hippocampal subregions are tested. We did not use MRI data to correct the partial volume effects of the FDG PET data, but we have previously found comparable results with and without such correction [54]. Sixth, our FDG PET data were from 2 different scanners. Although we adjusted for scanners in the analysis and we also found similar, yet reduced statistical significance due to smaller sample size, results in an analysis of the subset of subjects from a single scanner, we cannot exclude the possibility of the difference of the HR+ and 951/31. The latter had a limited field of view and very low spatial resolution and was decommissioned on 3/27/2004. Our design differs from others that analyzed baseline scans of individuals who subsequently did or did not develop cognitive impairment at various time points. We specifically targeted neuroimaging markers of progression to impairment within approximately 2 years, and our results must be interpreted accordingly. For example, it is likely that prediction models from several years prior to clinical progression may benefit more from combining FDG PET data with MRI data. Finally, in order to minimize Type 1 error associated with multiple regional comparisons, modality specific region selections were based on cross-sectional group differences with the assumption that these regions should also yield the best disease progression prediction. These are two different questions and potentially different brain regions are involved in static disease state differences and dynamic disease progression. It is possible that if a non-biased data driven approach were used to compare predictive value of two imaging modalities, FDG may have more added value.
The major strengths of this study include our use of a very well-defined, unique APOE4 allele dose matched and nonmatched cohorts, younger than in many other studies, in which the subsequent diagnosis of AD was likely in the majority of the clinical progressor group, consideration of FDG PET and MRI simultaneously in the prediction models, and implementation of pre-specified brain regions based on prior research from independent data sets. Even though those in the nonprogressor group may evidence disease in the future, we know that none of these individuals developed cognitive impairment for at least 4 years, and our goal was to determine imaging predictors of imminently clinically significant decline. Further research is needed to determine how far in advance brain imaging measurements, other biomarkers, cognitive measurements, APOE4 allele dose and other risk factors can be used in cognitively unimpaired adults to predict progression to the clinical stages of AD.
Footnotes
ACKNOWLEDGMENTS
The authors thank Bruce Henslin and Kathryn DeMarco for their help with data management and Mike Malek-Ahmadi for his statistical assistance.
This study was funded by NIH APOE4 grant, “Brain Imaging, APOE and the Preclinical Course of Alzheimer’s Disease” (R01AG031581); ADCC grant, “Alzheimer’s Disease Core Center” (P30AG019610); API 1, “Alzheimer’s Prevention Initiative” (RF1AG041705); and API 2, “Alzheimer’s Prevention Initiative APOE4 Trial” (UF1AG046150).
None of the above funders had any role in the study design; collection, analysis and interpretation of data; writing of the report; or in the decision to submit the article for publication.