
Abstract
Background:
Frailty is a condition which is characterized by a reduction in the homeostatic reserves of the individual and which entails an increased vulnerability to stressful endogenous and exogenous agents. The Frailty Index (FI), proposed by Rockwood, was designed following an accumulation of deficits model: the greater the number of deficits in a given individual, the greater the degree of frailty.
Objective:
The aim of this study was to verify the existence of associations between FI and cerebral atrophy.
Methods:
The TREDEM Register (Treviso Dementia) provided retrospective observational data from 1,584 patients. The FI was calculated based on 50 variables comprising diseases, disability, behavioral disturbances, and blood chemistry parameters. The severity of atrophy in the cortical and subcortical regions, such as the amplitude of the lateral ventricles, were detected by computerized axial tomography (CAT). Multiple logistic regression models using the stepwise backward method were used to analyze possible associations between FI and atrophy.
Results:
For each increment of one hundredth of the FI, the probability of cortical atrophy increases by 2%. The female gender is a protective factor for cortical and subcortical atrophy. At each increase of one percent of the FI, the probability of a severe degree of cortical atrophy increases by 3%. The FI was significantly associated with frontal and temporal cortical atrophy. The relationship between overall subcortical atrophy and the FI was not significant, whereas it was the one with the severe degree of subcortical atrophy. The FI is significantly associated with the atrophy of the peri-insular subcortical region. Similar associations were found considering only demented patients.
Conclusion:
The FI is associated with the presence, degree, and some localization of cerebral atrophy in a population of cognitive-decline patients.
INTRODUCTION
The term frailty refers to a geriatric condition characterized by the reduction of the individual’s homeostatic reserves, leading to an increased vulnerability to endogenous and exogenous stressors [1]. It is a marker of biological aging [2] and is closely associated with health-related events, including functional impairment, hospitalization, institutionalization, and death [3].
The concept of frailty, born in the geriatric field, has extended to various specialties such as cardiology [4], infectious disease medicine [5], and oncology [6]. Contrary to what one might expect, the concept of frailty has found few applications in neurology, particularly in the area of cognitive decline [7].
Out of the most commonly used operational definitions of frailty, the Frailty Index (FI), proposed and validated by Rockwood and colleagues in the Canadian Study of Health and Aging [8], has been designed on an arithmetical model of deficit accumulation: the more deficits a person has, the more the person will be frail [9, 10].
The FI is made using a checklist of non-predefined variables (i.e., deficits) including symptoms, diseases, disabilities, and laboratory findings. The FI is the ratio between deficits presented by the individual and the total number of deficits considered, thus providing a continuous measure of frailty ranging between 0 (absence of frailty) and 1 (maximum of frailty) [11]. Estimates of risk have been reported to be highly reliable when a minimum set of 40 heterogeneous and multidimensional, age-related variables are considered [11].
Different frailty indexes can be realized using different databases. Therefore, the conceptual construct of the FI proposed by Rockwood expresses that there is no a single FI but that it can be calculated according to the variables available in each dataset.
As far as we know, there is little evidence in the literature on the relationship between frailty and the morphological and structural aspects of the brain. The purpose of this study is to verify whether associations between the FI and cerebral atrophy exist.
METHODS
This retrospective observational study is a secondary analysis of the Treviso Dementia (TREDEM) Registry, a clinical, neuroradiological, and neuropsychological survey in the North-East of Italy, the details of which have been described previously [12–18]. The Tredem Registry, approved by the Treviso Province Ethics Committee, is a permanent observational prospective data collection on dementia conducted at the Cognitive Impairment Centre of the Local Health Authority n. 2 (LHA2) Marca Trevigiana.
In this study, we present data from 1,584 outpatients attending the Cognitive Impairment Center at different times between the years 2000 and 2016. Patients with psychosis and severe depression diagnoses were excluded. All of the eligible patients examined in the outpatient clinic during the study period were invited to participate in the research. Only subjects undergoing a complete biological, clinical, neuroradiological (brain CT), and neuropsychological evaluation were included in the TREDEM study. Participants, or caregivers when needed, provided informed consent.
All participants received a multidimensional assessment consisting of sociodemographic and clinical (cognitive, behavioral, neurological, functional, physical) data collection. The clinical history was obtained from the patient’s family and/or caregiver and was focused on symptoms allowing the diagnostic differentiation of the most frequent forms of dementia (i.e., memory, language and executive functions, behavioral disturbances, disability in daily activities, hallucinations, and other psychiatric symptoms). All patients underwent the standard laboratory and instrumental workup for dementia (including assessment of thyroid-stimulating hormone, vitamin B12, folate and homocysteine concentrations, as well as brain CT scan) [13].
Data collection
The data used in this study is shown in Tables 1 and 2. Age, gender, education, alcohol intake, smoking, body mass index (BMI), and blood tests were obtained. The cognitive diagnosis, other chronic diseases, disability assessment, neuropsychological and behavioral disorders’ assessment, and CT structural neuroimaging were considered. The variables shown in Table 2 were used in the calculation of the FI [18].
The main data
The 50 items composing the TREDEM Frailty Index, which contains a number of diseases, disabilities, behavioral disorders, and blood chemistry parameters
GDS, Geriatric Depression Scale; NPI, Neuropsychiatric Inventory. *For brevity, the six Activities of Daily Living and the eight Instrumental Activities of Daily Living variables are summarized in the means of the respective lost skills.
Cognitive diagnosis
The criteria of the National Institute of Neurological and Communicative Disorders and Stroke and the Alzheimer’s Disease and Related Disorders Association (NINCDS-ADRDA) [19] and the diagnostic criteria of the National Institute of Neurological Disorders and Stroke and the Association Internationale pour la Recherche et l’Enseignement en Neurosciences – NINDS–AIREN [20] were used to identify the diagnoses of AD and AD+cerebrovascular disease, respectively.
Consensus criteria for clinical diagnosis of dementia with Lewy bodies [21], of frontotemporal dementia [22], and of mild cognitive impairment (MCI) [23] were used.
Other chronic diseases and disability assessment
Clinical assessment included a comprehensive medical geriatric and neurological assessment. Careful anamnestic collection of all the pathologies present in each subject was performed (Table 2).
Functional disability was measured using the activities of daily living (ADL) [24] and the instrumental ADL (IADL) scales [25, 26].
Neuropsychological and behavioral disorder assessment
A trained psychologist performed a complete neuropsychological assessment of the participants by administrating several tests [17]. In the current study, we used Mini-Mental State Examination (MMSE) [27] and Clinical Dementia Rating (CDR) scale [28, 29]. The Geriatric Depression Scale [30], and The Neuropsychiatric Inventory [31] were used to evaluate non-cognitive symptoms.
Structural neuroimaging
CT scans were acquired using an EMOTION 6 Siemens volumetric scanner. Section orientation was parallel to the orbito-meatal plane. Sections on the same plane (time of 2 s, 120 kV, 130 mA, section thickness of 5 mm, no intersection gap) covered the remaining brain from the inferior aspect of the cerebellum to the vertex of the cranium. Data was analyzed from 8 to 10 images in the temporal lobe region, and from 16 to 18 images rostral to the temporal region. No contrast medium was used. All the measurements were taken and recorded by two independent trained raters working blind to the clinical information. We considered the reliability of repeated CT scan evaluations of two raters as described in Statistical analysis: a physician neuro-radiologist and another subject, from the Cognitive Impairment Center, both experienced in image assessment [13, 16].
Brain atrophy evaluation
The severity (low, moderate, or severe) of atrophy in (frontal, parietal, temporal, and occipital) cortical and (peri-insular, basal, vault) subcortical regions, as well as lateral ventricular enlargement, were recorded. The severity of atrophy was detected by the widening of sulci and narrowing of gyri and by the reduction in amplitude of the respective regions [13, 16].
Frailty Index
The FI was produced using 50 non-predefined variables such as diseases, disabilities, behavioral disorders, and laboratory findings routinely collected within the TREDEM Register. The list of variables used is shown in Table 2 [18]. As reported above, the FI is simply the ratio between deficits presented by the individual and the total number of variables considered, thus providing a continuous measurement of frailty ranging between 0, absence of frailty, and 1, maximum frailty. The variables used by Rockwood [11] to characterize illnesses, disabilities, and behavioral disorders are very similar to those considered in our study.
We also considered a FI-brain calculated using all eight brain related variables (parkinsonism, stroke, depression, and behavioral symptoms) and a separate FI-nonbrain considering the other 42 internistic variables (Table 2).
Finally, we repeated the analysis concerning the degree of atrophy only on demented patients excluding the MCI and subjective cognitive impairment (SCI) subjects.
Statistical analysis
Interrater reliability refers to the accuracy of repeated measurements of any given subject by two different raters. We used the Kappa statistic as the index of agreement [32]. Values greater than 0.80 are considered as an indication of good agreement. Our agreement statistic was high (0.86).
Statistical analyses were performed using the R software [33]. Descriptive analysis of frequency distribution of all variables was performed. Continuous data was shown as average and standard deviation, while categorical data was shown as absolute and relative frequencies. Multiple logistic regression models were evaluated to analyze the possible relationship between the FI and brain atrophy.
Using Backward stepwise method [34, 35], in addition to FI, BMI, smoking habit, consumption of alcohol, age, sex, MMSE, and CDR have also been considered. We have evaluated various logistic regression models having as dependent variables the presence of atrophy, its marked intensity, and its predominance in specific brain regions. By using the backward method, we started from models that included all the variables described above and those that were not significant were removed one by one. The probability for stepwise remove was 0.05.
For each regression, both crude and adjusted ORs and 95% confidence intervals are reported. Both the likelihood ratio test and Wald’s test were performed; p < 0.05 was considered statistically significant.
RESULTS
The main characteristics of the study cohort are presented in Table 1. The sample was composed of 551 men and 1,033 women; mean age was 79.5±7.4 years, while the age range was between 43.1 and 100 years. Education was 5.9±3.4 years and the range was between 0 and 21 years. The average number of deficits was 11.4±6.2 corresponding to FI 0.228±0.124, range: 0–0.56 (Fig. 1). The FI showed the same score in men as in women (mean 0.228). The frailty index distribution across the major subgroups of diagnostic categories AD, vascular dementia (VaD), and MCI was 0.223±0.103; 0.297±0.111 and 0.127±0.07 respectively (Fig. 2).
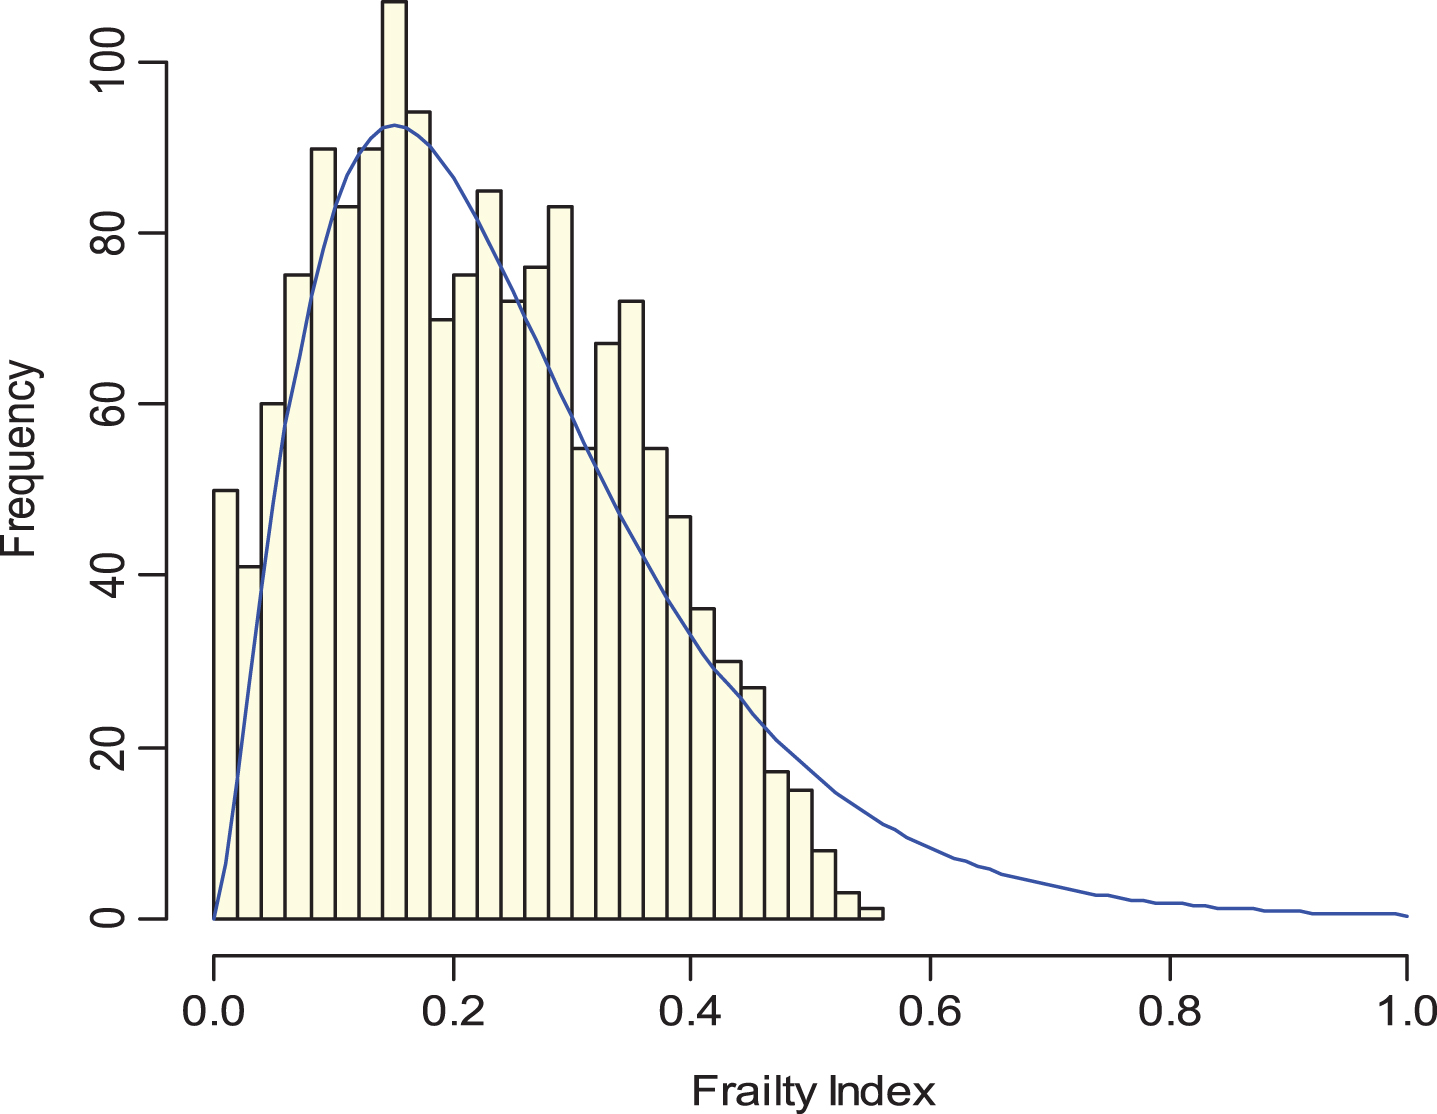
The FI is simply the ratio between deficits presented by the individual and the total number of deficits considered, thus providing a continuous measurement of frailty ranging between 0, absence of frailty, and 1, maximum frailty; Mean 0.228 (0.124), median 0.22, range 0–0.56.
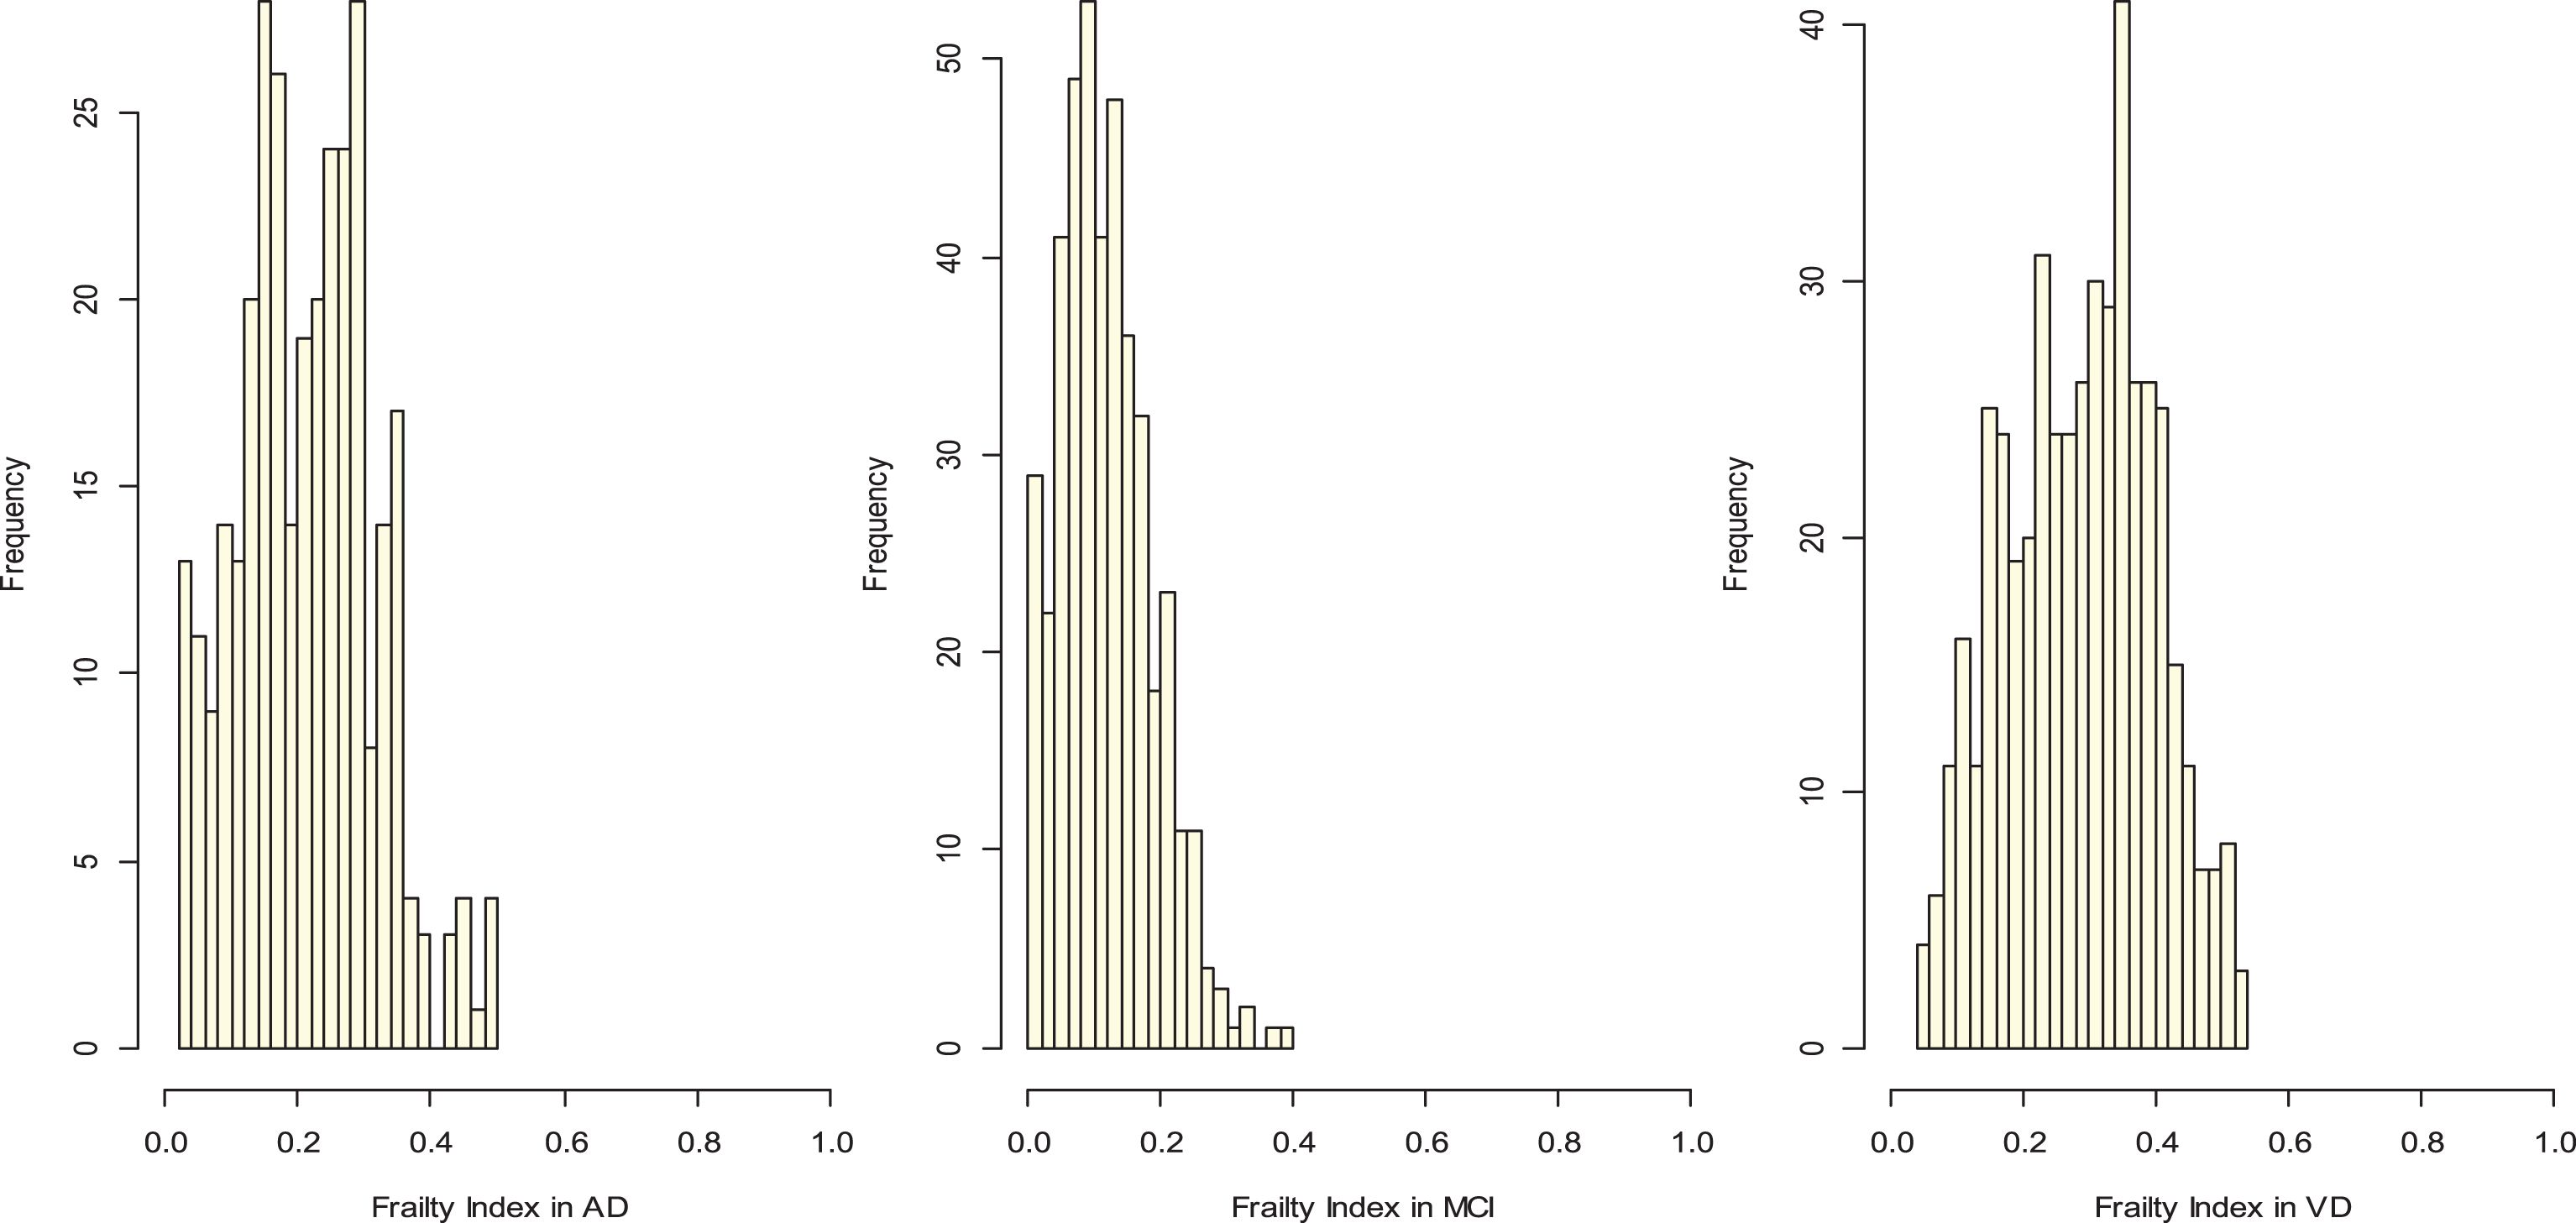
Distribution of frailty index in the three main diagnostic subgroups: Alzheimer’s disease (AD), mild cognitive impairment (MCI), and vascular dementia (VD). AD mean 0.223 (0.103), median 0.22, range 0.02–0.5; MCI mean 0,127 (0.07), median 0.12, range 0–0.4; VD mean 0.297 (0.111), median 0.3, range 0.04–0.54.
Participants had a mild degree of cognitive impairment (MMSE 21.0±5.8 and CDR 1.3±0.8), 42.8% of patients consumed alcohol (mainly wine), and active smokers were just 5.6%. In the study sample, the prevalence of AD was 20.3%, of VaD 29.6%, and MCI 26.9%. The participants in the study exhibited high concentrations of homocysteine in 49.9% of cases. In our sample, 80.7% of participants showed cortical atrophy and 71.7% subcortical atrophy. In particular, 16.2% of patients showed a severe degree of cortical atrophy and 15.4% a severe degree of subcortical atrophy. The sample presented a moderate degree of disability (ADL lost skills 1.62±1.78 and IADL lost skills 4.46±2.86).
A variety of associations between the FI and atrophy were detected via multiple logistic regression models with stepwise backwardness. For each increment of one hundredth of the FI, the probability of cortical atrophy (cortical atrophy yes/no) increased by 2% [adj.OR 1.02 (1,1.03) p = 0.03] (Table 3). The female gender was a protective factor for cortical atrophy [adj.OR 0.61 (0.45,0.82) p < 0.001], as was the increase in the MMSE score [adj.OR 0.89 (0.86,0.92) p < 0.001]. As age increased, the likelihood of cortical atrophy increased [adj.OR 1.06 (1.04,1.08) p < 0.001].
Logistic regression predicting cortical atrophy (cortical atrophy yes/no). For each increment of one hundredth of the Frailty Index, the probability of cortical atrophy increases by 2%. Female gender is a protective factor for cortical atrophy as well as the increase in Mini-Mental State Examination (MMSE) score. As age increases, the chance of cortical atrophy increases
At each increase of one percent of the FI, the probability of a severe degree of cortical atrophy (severe degree of cortical atrophy versus no atrophy plus other minor degrees of cortical atrophy) increased by 3% [adj.OR 1.03 (1.02,1.05) p < 0.001] (Table 4).
Logistic regression predicting severe degree of cortical atrophy (severe degree of cortical atrophy versus no atrophy plus other minor degrees of cortical atrophy). At each increase of one percent of the Frailty Index, the chance of severe cortical atrophy increases by 3%. MMSE, Mini-Mental State Examination
Considering the cerebral cortical regions, the FI was significantly associated with frontal cortical atrophy (frontal cortical atrophy yes/no) [adj.OR 1.02 (1.01,1.03) p < 0.001] and temporal cortical atrophy (temporal cortical atrophy yes/no) [adj.OR 1.02 (1, 1.03) p = 0.01] (Tables 5 and 6).
Logistic regression predicting frontal cortical atrophy (frontal cortical atrophy yes/no). At each increase of one percent of the Frailty Index, the chance of frontal cortical atrophy increases by 2%. Only the significant variables in the stepwise model have been reported in the table. MMSE, Mini-Mental State Examination
Logistic regression predicting temporal cortical atrophy (temporal cortical atrophy yes/no). At each increase of one percent of the Frailty Index, the chance of temporal cortical atrophy increases by 2%. Only the significant variables in the stepwise model have been reported in the table. CDR, Clinical Dementia Rating Scale
The relationship between overall subcortical atrophy and the FI was not significant, whereas the relationship between the degree of severity of the subcortical atrophy and the FI was: at each increment of one percent of the FI, the probability of severe subcortical atrophy (severe degree of subcortical atrophy versus no atrophy plus other minor degrees of cortical atrophy) increases by 3% [adj.OR 1.03 (1.01, 1.04) p < 0.001] (Table 7). With regard to the subcortical brain regions, the FI was strongly associated with the peri-insular atrophy (peri-insular atrophy yes/no) [adj.OR 1.02 (1.01,1.03) p < 0.001] (Tables not shown).
Logistic regression predicting severe degree of subcortical atrophy (severe degree of subcortical atrophy versus no atrophy plus other minor degrees of cortical atrophy). At each increase of one percent of the Frailty Index, the chance of severe cortical atrophy increases by 3%. MMSE, Mini-Mental State Examination
The female gender was a protective factor also for subcortical atrophy [adj.OR 0.66 (0.49,0.89) p = 0.007].
Considering the FI-brain, calculated using all eight brain related variables, we did not find any statistically significant associations. Otherwise, for the FI-nonbrain, we have confirmed the association between the FI and the degree of cerebral atrophy. At each increase of one percent of the FI, the probability of a severe degree of cortical atrophy (severe degree of cortical atrophy versus no atrophy plus other minor degrees of cortical atrophy) increased by 4% [adj.OR 1.04 (1.02,1.06) p < 0.001]. At each increase of one percent of the FI, the probability of a severe degree of subcortical atrophy (severe degree of subcortical atrophy versus no atrophy plus other minor degrees of subcortical atrophy) increased by 3% [adj.OR 1.03 (1.02,1.05) p < 0.001] (Tables 8 and 9).
Frailty Index-nonbrain analysis. Logistic regression predicting severe degree of cortical atrophy (severe degree of cortical atrophy versus no atrophy plus other minor degrees of cortical atrophy). At each increase of one percent of the Frailty Index-nonbrain, the chance of severe cortical atrophy increases by 4%. MMSE, Mini-Mental State Examination
Frailty Index-nonbrain analysis. Logistic regression predicting severe degree of subcortical atrophy (severe degree of subcortical atrophy versus no atrophy plus other minor degrees of subcortical atrophy). At each increase of one percent of the Frailty Index-nonbrain, the chance of severe subcortical atrophy increases by 3%. Only the significant variables in the stepwise model have been reported in the table. MMSE, Mini-Mental State Examination
The analyses carried out only on demented patients confirm the same associations shown for the entire sample. At each increase of one percent of the FI, the probability of a severe degree of cortical atrophy (severe degree of cortical atrophy versus no atrophy plus other minor degrees of cortical atrophy) increased by 3% [adj.OR 1.03 (1.01,1.05) p < 0.001]. The same result was found for the probability of subcortical atrophy (severe degree of subcortical atrophy versus no atrophy plus other minor degrees of subcortical atrophy) [adj.OR 1.03 (1.01,1.04) p < 0.001]. (Tables 10 and 11).
Only demented patients (No. of observations = 1100). Logistic regression predicting severe degree of atrophy (severe degree of cortical atrophy versus no atrophy plus other minor degrees of cortical cortical atrophy). At each increase of one percent of the Frailty Index, the chance of severe cortical atrophy increases by 3%. MMSE, Mini-Mental State Examination
Only demented patients (No. of observations = 1100). Logistic regression predicting severe degree of subcortical atrophy (severe degree of subcortical atrophy versus no atrophy plus other minor degrees of subcortical atrophy). At each increase of one percent of the Frailty Index, the chance of severe cortical atrophy increases by 3%. Only the significant variables in the stepwise model have been reported in the table. MMSE, Mini-Mental State Examination
DISCUSSION
In this study we found that the FI, conceptualized as a measurement of the individual’s homeostatic reserves and vulnerability, was associated with brain atrophy.
Our study was conducted in a mixed cohort of memory clinic patients. The prevalence of AD was 20.3%. However, after excluding 426 MCI and 52 SCI from the whole sample and adding AD subjects with associated vascular lesions (mixed dementia), the prevalence of AD rose to 39.9%, closer to the prevalence generally reported in literature [36]. On the other hand, the prevalence of VaD (29.6%) was moderately higher than that usually reported [37]. Supporting a high vascular risk profile of the elder sample, the participants in the study exhibited high concentrations of homocysteine in 49.9% of cases.
The observed distribution of the FI of Rockwood [11] and his upper limit of 0.60 were very similar to our FI distribution (Fig. 1) and upper limit of 0.56. The FI values in the diagnostic categories AD, VaD, and MCI appear to correspond to the severity of the cognitive condition: lower in the MCI group and higher in AD and VaD (Fig. 2).
To our knowledge, the relationship between frailty measurements and brain atrophy has been explored by very few authors, while no data is available on the relationship between frailty, gender and brain aging.
It is worth considering that even before the conceptualization of “frailty” and the development of frailty scales and indexes, some neuroradiological evidence suggested that the progression of brain atrophy was affected by general health conditions. In 2003, Resnick et al. [38] reported, in a four-year longitudinal MRI study conducted on 92 non-demented subjects, a slower rate of brain atrophy in individuals who remain medically and cognitively healthy. In 2008, Burns et al. [39] found that increased cardiorespiratory fitness is associated with reduced brain atrophy in AD; however, in this study a measure of physical frailty was used as a covariate in the statistical model that also included gender, dementia severity, and physical activity.
More recently, Del Brutto et al. showed, in a study of 298 participants, a significant association between cortical atrophy and the categorized Edmonton Frail Scale score [40], which consists of 10 domains with only 11 items including cognition, general health status, functional independence, social support, medication use, nutrition, mood, incontinence, and balance and motility. These authors focused their interest on the presence of global cortical atrophy.
The results of the present study are in line with this finding, confirming the effect of frailty on cortical structures in a larger series of patients and expanding this association also to specific brain regions, namely the frontal and temporal lobes, and the peri-insular subcortical region.
The number of participants in our sample is higher than the previous sample as is the number of variables taken into consideration in building the index of frailty. Moreover, in our study we also explored FI associations with the cortical and subcortical individual brain regions.
Chen et al. examined grey matter volume associations with frailty status and individual frailty components in 456 subjects [41]. The participants were assessed for frailty status (robust, prefrail, and frail) based on the presence of the five frailty components (slow walking speed, muscle weakness, low physical activity, exhaustion, and weight loss) of Fried criteria [42]. These authors used an accredited scale but with just five criteria and without considering cognition. In this case, the association between the volume loss of grey matter in some strategic areas and the loss of performance in the movement may be plausible and predictable.
While the effect of age and cognitive status on brain atrophy found in the present study is expected, the association between gender, brain atrophy, and frailty warrants further consideration.
Indeed, in our multivariate analysis the female gender appears to be less affected by brain atrophy, resulting as a protective factor in both models evaluated: cortical and subcortical atrophy.
Our data is in line with former observations from neuroradiological studies that found a greater degree of atrophy in aging males [43–46]. These earlier neuroradiological research studies are mostly focused on healthy aging subjects. Exposure to sex hormones, bioenvironmental factors, and different lifestyles are some of the candidate explanations for these observations.
It is noteworthy that the results of our study, which is collocated in the clinical scenario of cognitive decline, corroborate the concept of gender dimorphisms in brain degeneration, and shed light on a possible gender sensitivity to physical frailty conditions.
The relationship between physical frailty and gender has been reviewed in a recent meta-analysis. Based on the data from 37,426 participants, Gordon et al. [47] found that females live longer than males notwithstanding their higher levels of co-morbidity and disability measured with the FI, yielding to a ‘male-female health-survival paradox’. In the present study we did not find different levels of FI according to gender. Furthermore, this study is collocated in the Province of Treviso, where life expectancy at birth is the highest in Italy, particularly for women. In a previous study [48] we found that the prevalence of the APOEɛ4 allele in Treviso is 16.3%, lower than the 25% commonly observed for northern European populations without dementia. In this case, low APOEɛ4 allele frequency could contribute to the longevity observed within this region.
Therefore, women do not have a frailty significantly different from men in our study; they live longer and have less cerebral atrophy. Thus, it is possible to speculate that the burden of co-morbidity and disability may interact with the genetic background impacting the brain atrophy progression according to gender.
The authors feel it is significant and interesting that the sum of a variety of internistic deficits (illnesses, disabilities, behavioral disorders, and hemato-chemical parameters) of the TREDEM FI are significantly associated with morphological and structural aspects of the brain, such as cerebral atrophy. From this point of view, the brain seems to be closely connected with the cumulative deficit of other organs of the human body in a holistic system of close interdependence.
Another possible interpretation of the results of this study is that the pathogenic processes responsible for dementia and brain atrophy may be simultaneous to those pathogenic processes observed in the other organs and physiological systems. In this case, the brain atrophy observed in relation to the FI may represent the cerebral counterpart of a more general physical breakdown rather than a secondary result of multi-organ failure.
It is important to note that the FI is associated with the atrophy of some regions such as frontal and temporal cortical atrophy and peri-insular subcortical region. These regions are often the site of atrophy in the elderly patient and this could simply be the effect of the deficits accumulated over time associated with old age.
It is to be considered that some of the different deficits, including in the FI, have been linked to atrophy individually such as heart failure and diabetes [49, 50]. However, an index, which combines a large amount of different deficits, can summarize the whole co-morbidity of the patient and can have a greater descriptive power. The reproducibility of the findings in relation to the frailty index is guaranteed by the choice of a large number of variables, at least above 40. In this way the descriptive and predictive power of the FI is satisfied, indicating “that frailty can be measured in many ways, and therefore can be studied in many existing datasets that might not have set out to measure frailty per se” [11].
The FI-brain calculated with only 8 variables of a more neurological nature does not show significant associations with cerebral atrophy, probably due to the very low number of variables. Otherwise the FI-nonbrain calculated using 42 internistic variables significantly confirms the associations found for the FI calculated with all 50 variables (Tables 8 and 9).
We wanted to study the associations between the FI and a mixed cohort of memory clinic patients, therefore with a “naturalistic and ecological” approach. To exclude that the results have been conditioned by the inclusion of MCI and SCI subjects, we have repeated the most representative analyses, such as those on the degree of cortical and subcortical atrophy, only on demented patients (Tables 10 and 11). The associations are significantly confirmed by demonstrating the robustness of the relationship between the FI construct and cerebral atrophy.
Our study had some limitations. First, the cross-sectional study design does not permit a reliable generalization of the results. Further longitudinal, and possibly interventional, studies will be necessary to define the significance of the FI in the analysis of dementia disorders and its impact on the brain aging and dementia processes.
Second, the use of CT scan does not permit a precise measurement of the degree of cortical atrophy although it allowed us to include a large population of patients.
However, the present study also has some strengths. First, our study shows, in a large sample of 1,584 outpatients subjects, a significant association between the FI of cognitive impaired patients and brain cortical and subcortical atrophy.
Second, the TREDEM FI includes 50 health related components and is likely representative of the sum of a very large series of deficits. Furthermore, we kept a clear separation between the descriptive general variables of the participants (Table 1) and the fifty variables used in the calculation of the FI (Table 2) in order to carefully avoid any bias of collinearity.
It is also noteworthy that the subjects we have been observing reside in their own homes and are representative of the real world. Indeed, the study sample is part of the Treviso Dementia (TREDEM) sample which includes a significant amount of data that was in part set out in previously published works [12–18]. This survey has been conducted in a specific area, the Province of Treviso, where life expectancy at birth is the highest in Italy, particularly for women, and where the resident population has been studied since 2003 in terms of genetics, successful aging, and healthy lifestyles [51, 52].
Conclusions
Our results support frailty as a syndrome associated not only with reduced physiological reserve but also with brain atrophy, and that this effect is more evident in the male gender. We believe that the FI cannot be a substitute for imaging techniques; it may be useful in delineating the relationship between deficits, comorbidity, and morphostructural changes in the brain. The FI can briefly summarize the patient’s overall comorbidity and represent a useful tool for identifying possible prognostic trajectories.
Further group studies with longitudinal observations are needed to investigate the relations of these neural-based aspects to the evolution of frailty.