
Abstract
Leptin, as a link between fat mass and the brain, has been reported to be associated with gender. The gender differences in leptin levels between Alzheimer’s disease (AD) and healthy elderly controls are inconclusive so far. To quantitatively summarize the leptin data available from female and male patients with AD, we searched PubMed and EMBASE for articles published from inception to July 20, 2017. Data were extracted from 27 studies, consisting of 3,014 participants. The pooled results showed that the overall leptin levels were lower in AD (Hedges’ g = –0.481; p = 0.002) than in controls, and the leptin levels in whole blood and serum were decreased with moderate and large effect sizes (g = –0.677, –0.839; respectively; both of p-values <0.001) in AD compared with controls. In blood, there were significantly lower concentrations of leptin in female AD than in female controls (g = –0.590; p = 0.014), but not in male case-control group (g = –0.666; p = 0.067). Meta-regression analysis demonstrated that the decreased extent of leptin levels in AD paralleled the degree of the severity of dementia symptoms, as well as the alterations of body mass index (p-values ≤0.002). The findings provide strong evidence that 1) the blood concentrations of leptin are lower in female AD patients than in female controls; and 2) the greater the severity of dementia symptoms, the greater the decreases in the blood leptin levels. But more future investigations on the blood leptin levels in male AD patients is warranted.
INTRODUCTION
Alzheimer’s disease (AD) is considered as the most common age-related neurodegenerative disorder and the leading cause of dementia among the elderly affecting greater than 26 million people worldwide [1]. It is characterized by the accumulation of the amyloid-β (Aβ) protein and neurofibrillary tangles. The clinical symptoms of AD include a progressive loss of memory and impairment of cognitive ability [2, 3]. Epidemiological studies suggested that, due to more severe neurodegeneration and greater loss of brain parenchyma [4], females were more severely and more frequently affected by AD, with greater risk of developing Alzheimer’s dementia, than males with greater risk of developing vascular dementia [5]. The age of dementia onset does not differ by gender, but females are more likely to proceed to very severe clinical and pathological manifestations [4], and AD pathology is more likely to be clinically expressed as dementia in women than in men [6]. There exists a gender difference in AD pathology, and it is therefore of interest to investigate what factors are closely associated with this difference.
There is accumulating evidence suggesting that alterations in body weight and systemic metabolism have a significant role in AD [7, 8]. Population-based studies found that low body weight in late-life was associated with an increased risk of developing cognitive decline or AD [9, 10], and low body mass index (BMI) was associated with worsening AD [11]. In addition, it has been reported that the weight loss in AD patients can occur prior to the initial cognitive symptoms [12], indicating that individuals with AD, despite unchanged eating habits, begin to lose weight some years before the onset of clinical symptoms of AD [13, 14]. These observations suggest a potential link between adipose tissue metabolism (or body weight loss) and progression of AD [15].
Leptin, which is associated with not only body weight but also gender, is an adipocyte-derived hormone that acts to reduce food intake and increase energy expenditure by binding and activating its specific receptor [16]. As body weight and fat stores fall, circulating leptin levels decrease; this decrease in leptin levels signals to the brain to restore body weight by increasing food intake and reducing energy expenditure [17]. In several studies, plasma leptin levels have been found to be lower in AD patients than in control subjects with negative correlation with the degree of dementia [9, 18–22]. However, not all studies have found the association between plasma leptin levels and AD or cognitive decline [23, 24]. Furthermore, although studies found a decrease in leptin concentrations in AD patients, the data on leptin in female and male AD patients are less certain, with both positive [25, 26] and negative [27] findings reported.
The inconsistent findings might be caused by heterogeneous patient populations or by small sample sizes lacking statistical power. Meta-analysis is a quantitative method that combines results from independent studies to increase statistical power in order to derive more solid conclusions. In order to assess gender differences in leptin concentrations, using meta-analysis, we first analyzed the overall difference in circulating leptin concentrations between AD and cognitive healthy controls (HC), and further examined the effects of gender and other possible moderators on leptin levels through subgroup and meta-regression analyses with an evaluation of possible sources of between-study heterogeneity.
MATERIALS AND METHODS
Search strategy and study selection
Literature search, selection of eligible studies, and data extraction were performed by two reviewers (Zhou FT and Chen SR). Studies were identified through electronic searches of PubMed and EMBASE databases using the Boolean terms (blood OR serum OR plasma OR CSF OR cerebrospinal fluid) AND leptin AND Alzheimer*, limited to studies in English. The last search was performed in June 2017. We then manually checked the reference sections of the publications found through our electronic search, to identify additional studies that may have been missed. Additionally, the database of China National Knowledge Information (CNKI) was also searched.
Preferred Reporting Items for Systematic Reviews and Meta-Analyses (PRISMA) was used in the formulation of the meta-analysis. Although the meta-analysis was not registered before it was conducted, we did search PROSPERO (International Prospective Register of Systematic Reviews) and the Cochrane Register after beginning to ensure that no other similar meta-analyses were in progress.
Inclusion and exclusion criteria
The eligible studies must satisfy the following inclusion criteria: 1) concerning the association between leptin and AD; 2) case-control study design; 3) sufficient information accessible (e.g., sample size for each study, leptin concentrations); and 4) cases meeting the clinical criteria for AD. The exclusion criteria include: a duplicated publication, a review, a case report, non-AD cases, an irrelevant study, datum not available, or an abstract.
Data extraction
All variables were extracted from original records. The following data were extracted and tabulated from each paper (Supplementary Table 1): author name, year of publication, sample size, mean/SD, age, gender distribution (% female), Mini-Mental State Examination (MMSE) score, BMI value, sample source (serum, plasma, or CSF), unit and method of measurement, AD diagnosis criteria, blood biochemical parameters including low density lipoprotein (LDL-C), high density lipoprotein (HDL), and triglyceride (TG). If the results were graphically presented and the authors could not provide the data we needed, we used a method for data extraction from the graphs explained by Sistrom et al. [28]. We used the Newcastle-Ottawa Scale (NOS) to assess the quality of the included studies.
Statistical analysis
The standardized mean difference (using Hedges’ adjusted g) and 95% confidence interval (95% CI) of the effect-size (ES) were calculated to estimate differences in leptin levels between AD and HC. An ES of 0.2 is considered as indicating a small effect, of 0.5 indicating a moderate effect, and of 0.8 indicating a large effect. Between-study heterogeneity was investigated by Chi-square based Q-test and quantified with the I2 statistic, with values of 25%, 50%, and 75% taken to indicate low, moderate, and high degrees of heterogeneity, respectively. If heterogeneity was substantial (I2 > 50%), a random effect meta-analysis was performed; otherwise, a fixed effect model was used as default.
To search for potential sources of heterogeneity across studies, subgroup analyses were made according to sample source (CSF and blood) and gender. Unrestricted maximum likelihood random-effects meta-regressions of ES were performed with age, cognitive status (as assessed by MMSE score), sample size, NOS, BMI, and biochemistry variables (LDL, HDL, and TG) as moderators to influence the ES. Sensitivity analyses were conducted to ascertain whether the results of our analyses were strongly influenced by any single study. Thereafter, data were sorted in chronological order, and a cumulative meta-analysis was performed to examine whether the strength of the pooled estimate has been changing markedly over time, as new studies have been published.
To account for significant publication bias, we performed a visual analysis of a funnel plot graph, a scatter plot of the ES against a measure of study size, and conducted the Egger’s test (p < 0.1 for significant asymmetry). Trim-and-fill (Duvall and Tweedie’s method) is a funnel-plot-based method to test and adjust for publication bias in meta-analysis. Finally, the file drawer statistic (i.e. the classic Fail-safe N test) was used to quantify the number of possible negative omitted studies that would be required to make our results non-significant (p > 0.05). Comprehensive Meta-analysis Software version 2.0 (CMA, Borenstein, USA) was employed in all the analyses.
RESULTS
Study Selection
We identified a total of 110 records through electronic searches, most of which had the abstracts written in English. Of these, 87 were excluded on the basis of title and abstract, leaving 18 articles for further evaluation. Some papers were involved in more than one pairwise comparison. Thus, 27 studies fulfilled our inclusion criteria for the meta-analysis.
The studies included in the meta-analysis were published from 2009 to 2017 and varied in sample size (from 3 to 396). Regarding the sample source, 5 studies analyzed leptin in CSF, 13 in serum, and 9 in plasma. As for gender, 5 studies analyzed leptin in males, 8 in females, and 14 in mixed-gender settings. Figure 1 shows the PRISMA flowchart of study selection. Detailed information regarding characteristics of the included studies is provided in Supplementary Table 1.

PRISMA flowchart of the meta-analytic review.
Association of the leptin levels and AD
Supplementary Table 1 summarizes the 27 studies, providing data on 3,014 participants (1,622 were patients with AD and 1,392 were healthy controls). As shown in Table 1, the overall meta-analysis showed that AD patients had significantly decreased levels of leptin with a small ES (g = –0.481, 95% CI –0.799 to –0.183, p = 0.002, Fig. 2).
Statistics of the meta-analysis of the leptin levels between AD and HC
AD, Alzheimer’s disease; HC, healthy controls; CSF, cerebrospinal fluid; MMSEs, Mini-Mental State Examination Score; BMI, body mass index in kg*m-2; ctrl, control; LDL, low density lipoprotein (LDL-C); HDL, high density lipoprotein; TG, Triglycerides; LIA, luminex immunoassay; RIA, Radioimmunoassay; NOS, Newcastle-Ottawa Scale; ELISA, enzyme linked immunosorbent assay. An asterisk indicates that a fixed-effect model was used for the meta-analysis.
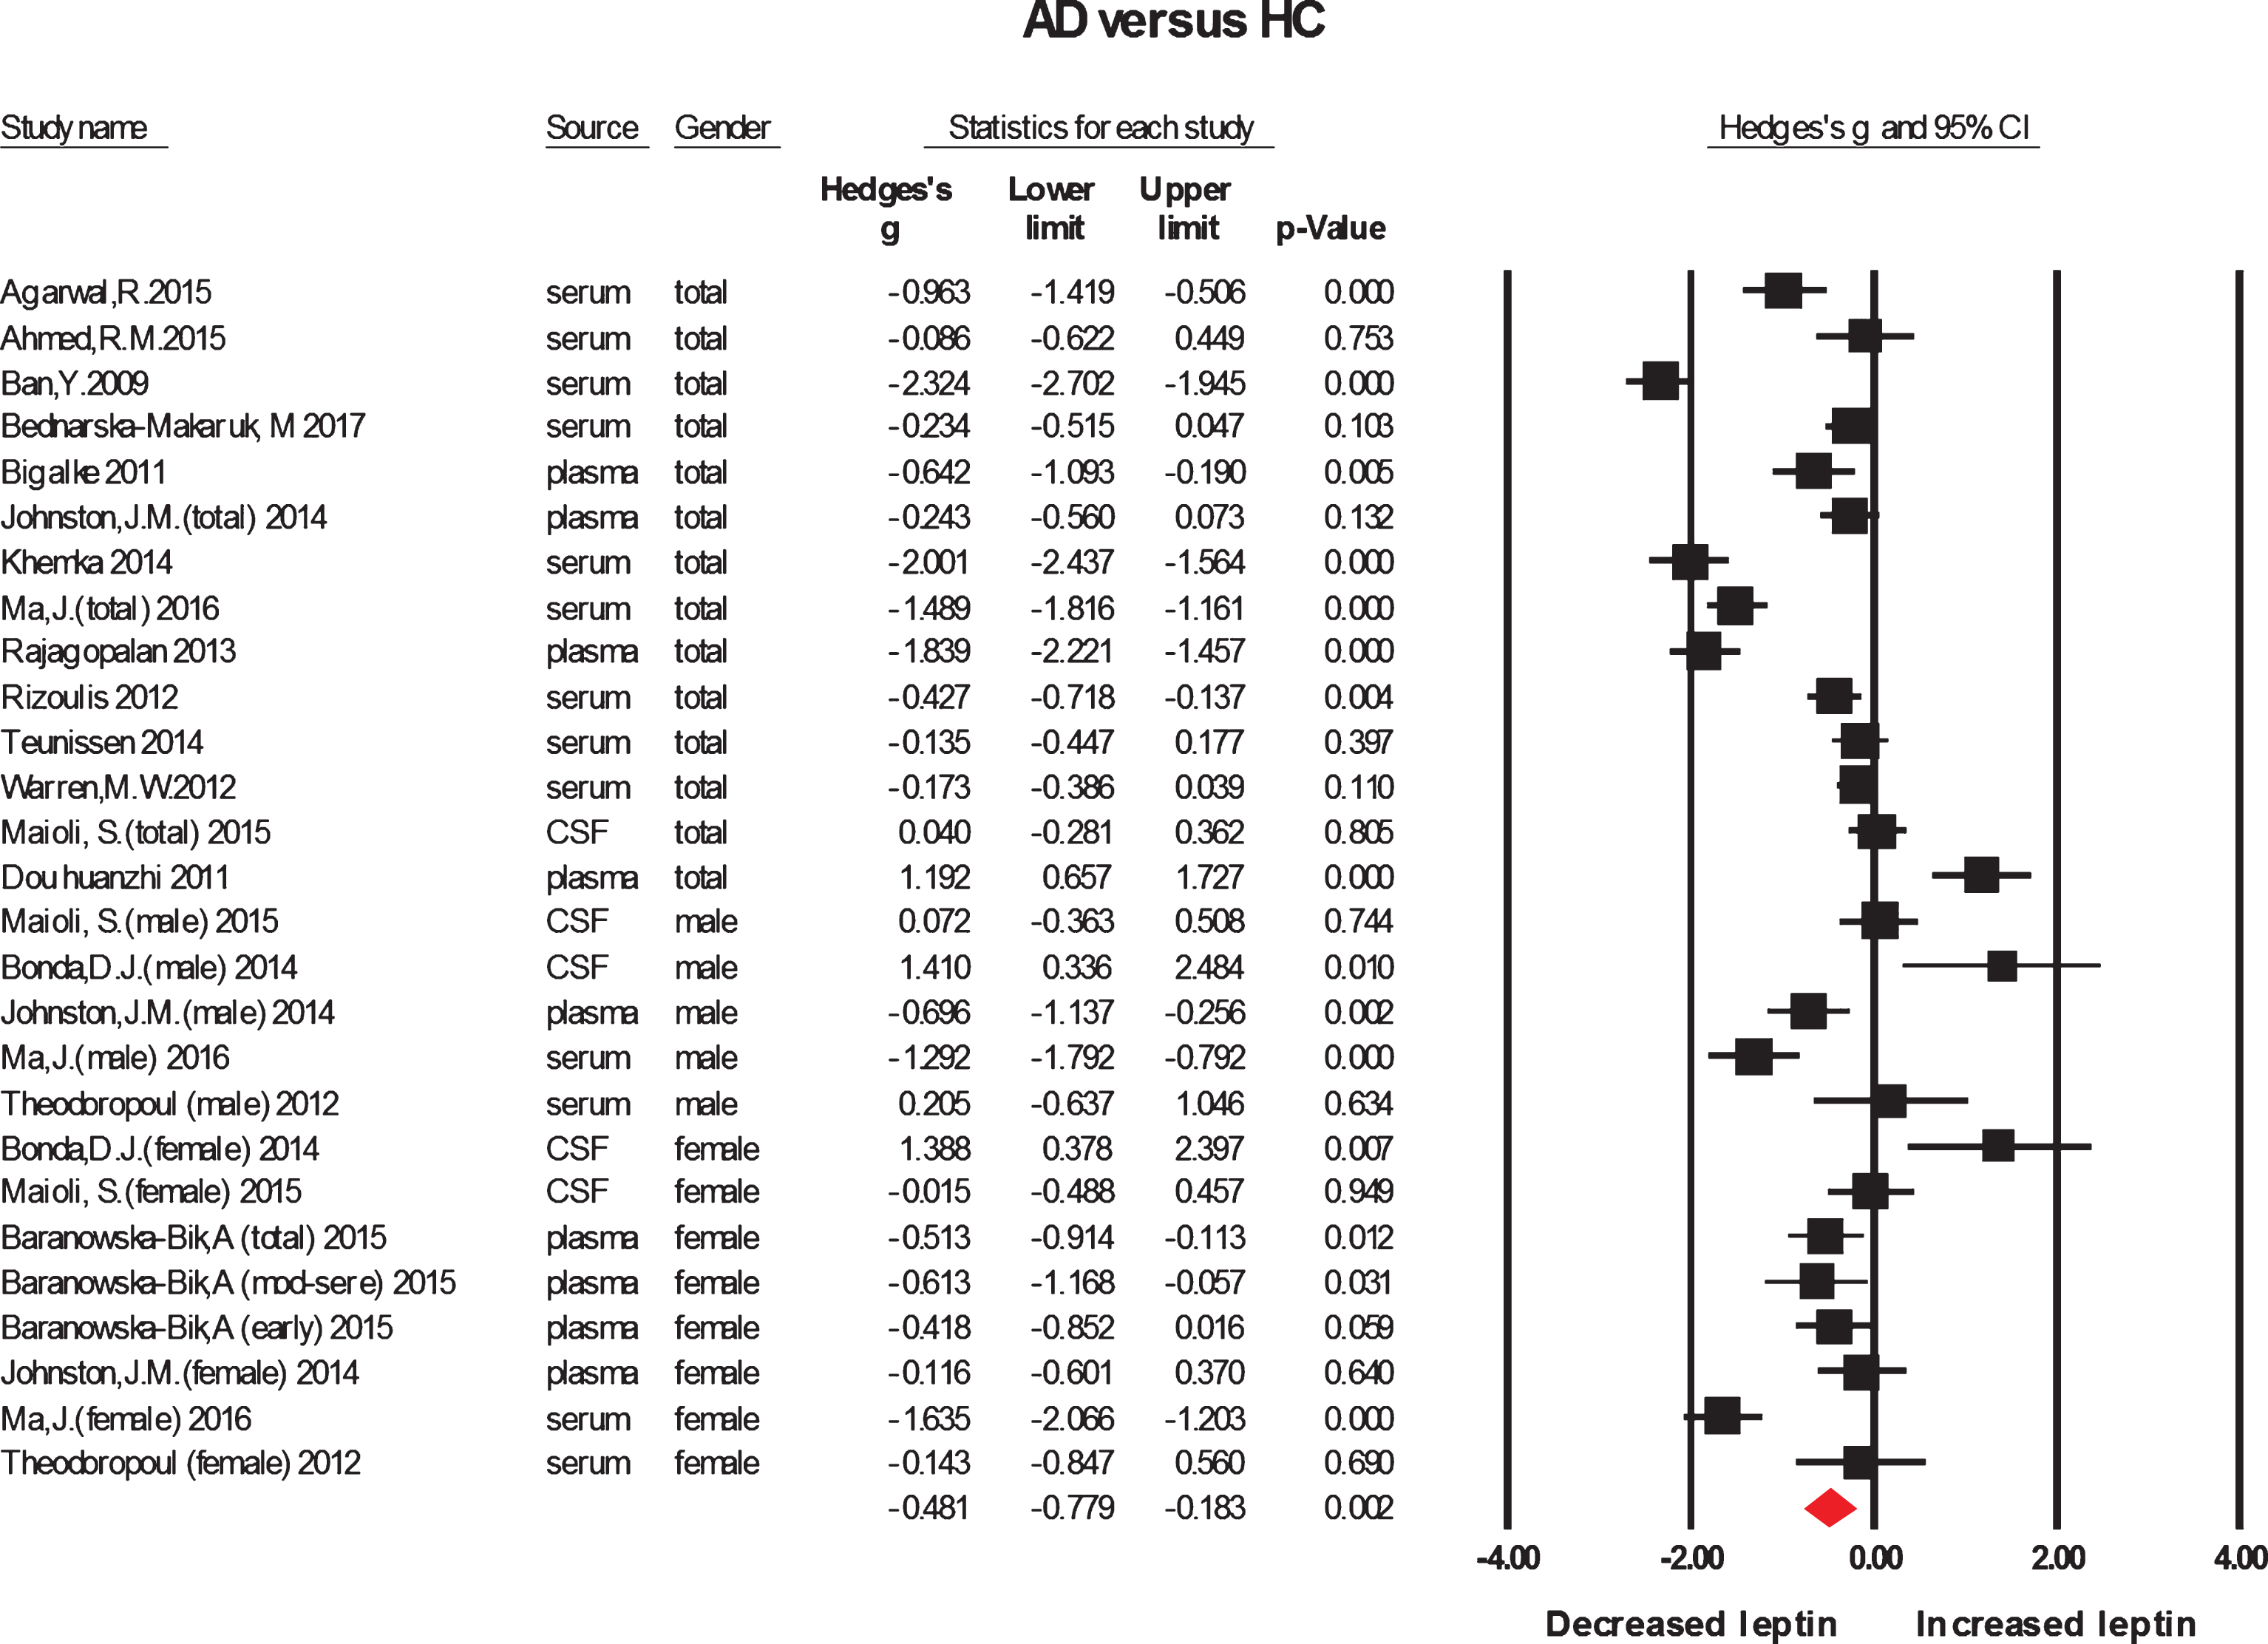
Forest plot for the meta-analysis of overall leptin levels.
To verify the gender differences in the leptin concentrations between AD and HC, a subgroup analysis based on the sample source was performed. Data on the leptin levels in CSF [23, 29] or blood (serum [22, 30–35] and plasma [20, 37]) were extracted, comprising 336 CSF samples and 2,678 blood samples (1,803 in serum, 875 in plasma). The subgroup analysis showed that, compared to HC, AD patients had significantly decreased leptin levels in serum or blood (g = –0.839, –0.677, 95% CI = –1.277 to –0.401, –0.999 to –0.354, 13, 22 comparisons, respectively; both of p values <0.001, Table 1 and Supplementary Figure 2), but neither in plasma nor in CSF (g = –0.442, 0.344, 95% CI = –0.930 to 0.046, –0.088 to 0.776, p = 0.076, 0.119, 9, 5 comparisons, n = 878, 336, respectively, Supplementary Figure 1).
Peripheral leptin, AD, and gender
In order to verify gender differences in the leptin levels between AD and HC, regardless of the leptin levels in CSF, the data were further stratified by gender. There were 6 studies for 446 females [21, 25–27], 3 for 288 males [21, 27], and 13 for 2,044 mixed-gender [20–22, 30–37] subjects. The subgroup analyses demonstrated that for mixed-gender participants, compared with HC, AD patients had significantly decreased concentrations of leptin in blood (g = –0.724, 95% CI = –1.184 to –0.265, p = 0.002, Fig. 3). Blood levels of leptin were significantly lower in female patients than in female controls (g = –0.590, 95% CI = –1.061 to –0.119, p = 0.014, 6 comparisons, n = 446, Fig. 3); there was a reduction trend in male patients (g = –0.666, 95% CI = –1.377 to 0.045, p = 0.067, 3 comparisons, n = 188, Fig. 4) compared with male controls. Interestingly, in plasma samples, leptin levels were significantly decreased in female patients (g = –0.415, 95% CI = –0.644 to –0.186, p < 0.001, 4 comparisons, n = 307, Fig. 4) compared with female controls. We did not perform a subgroup analysis of blood leptin levels in males because of the small number of studies (Table 1 in upper part).
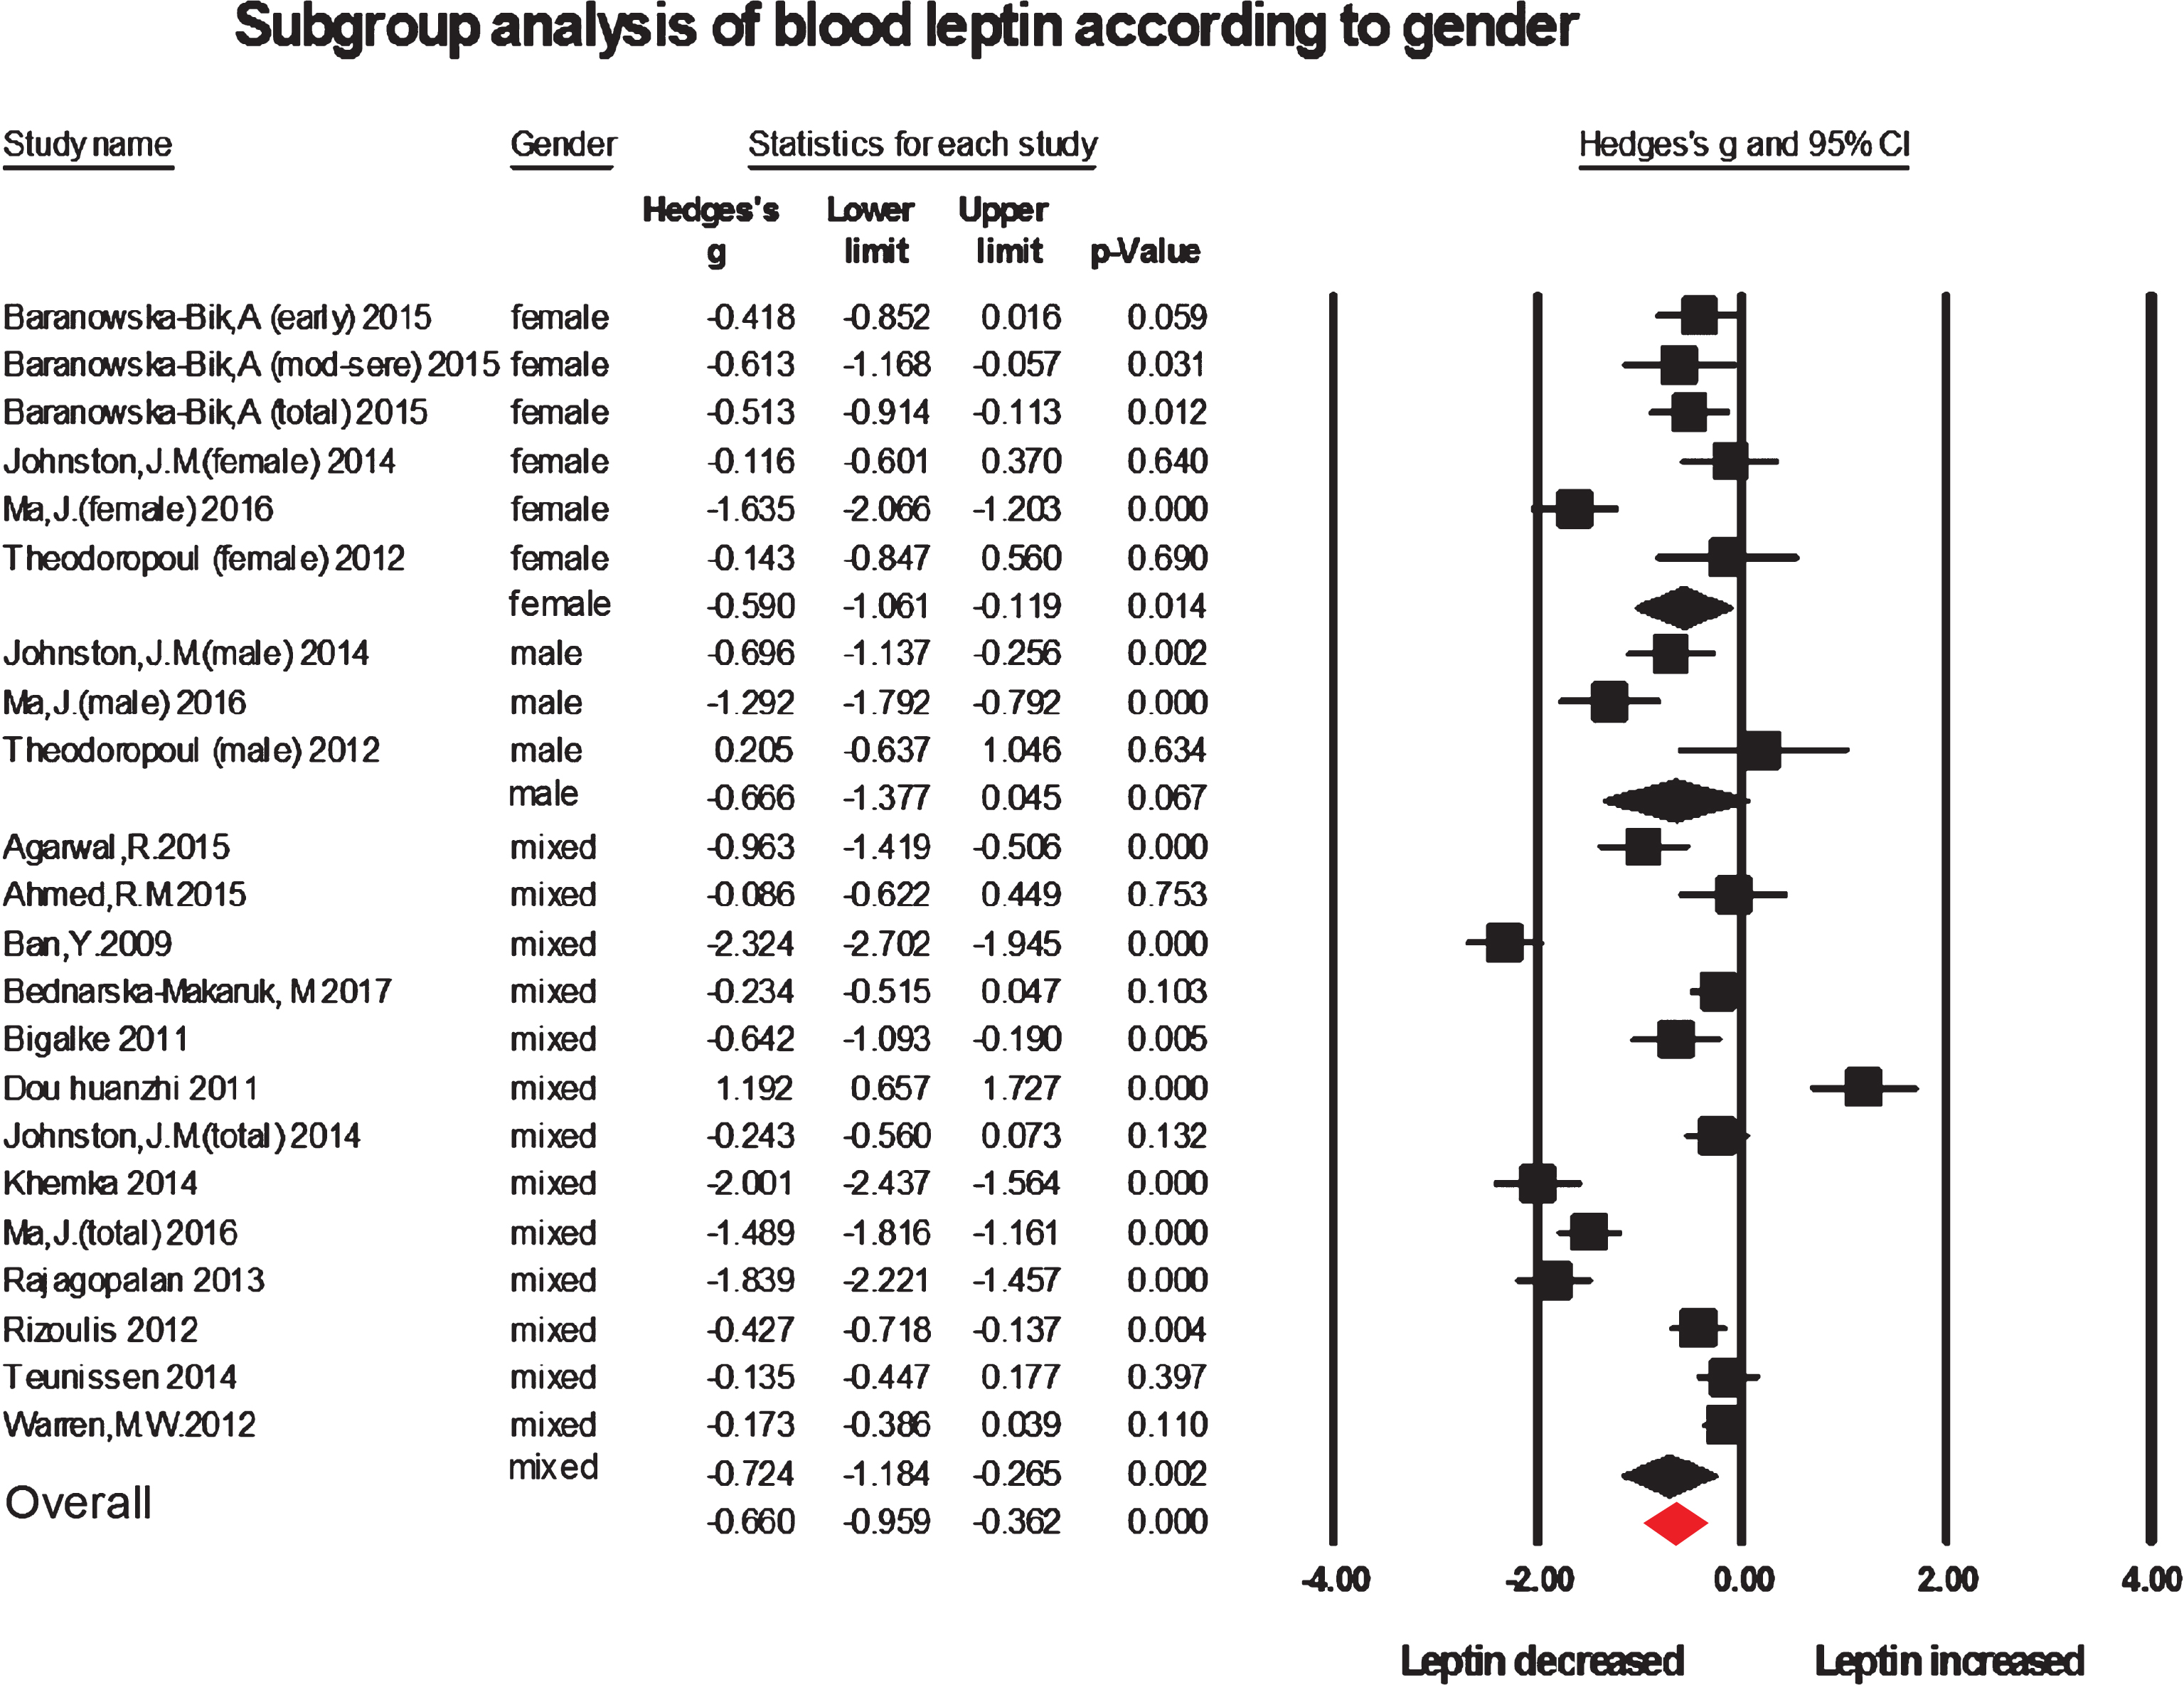
Forest plot for subgroup analysis of blood leptin levels stratified by gender.
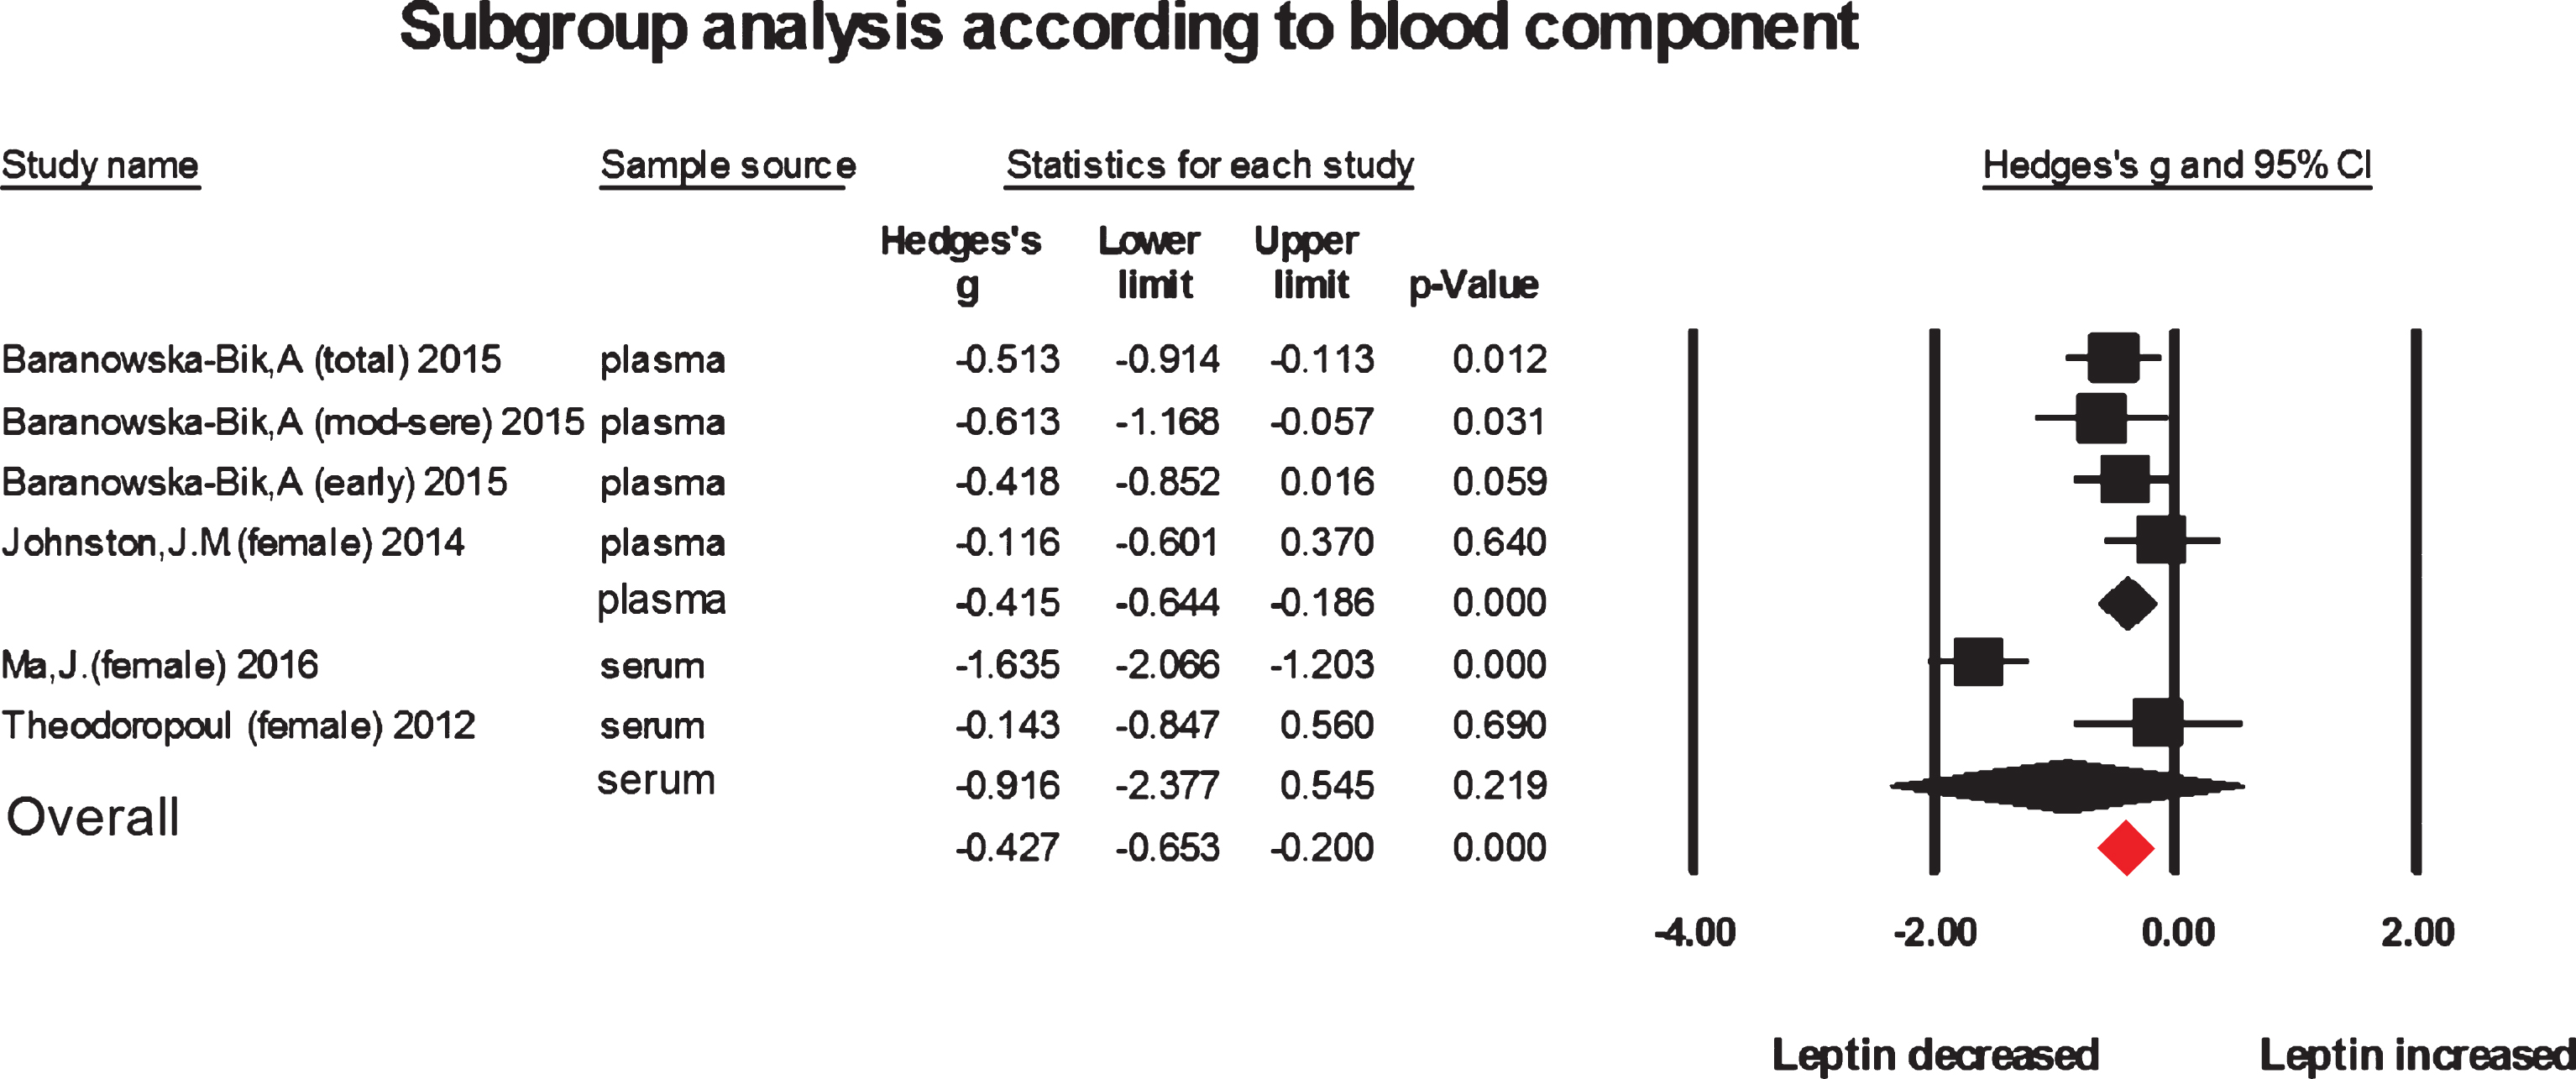
Forest plot for meta-analysis analysis of serum or plasma leptin levels between female AD and female HC.
In current meta-analysis, the degree of heterogeneity, for the whole analysis and the majority of subgroup analyses with the exception of the subgroup analysis of plasma levels of leptin in females, was high, which could not be fully explained by any single variable (sample source, gender and detection method, see Table 1 in lower part). When the studies with low quality (NOS score <6) were excluded, the p-value remained to be significant, and the heterogeneity did not decrease (data not shown).
Moderation analysis
Thereafter, meta-regression analyses were conducted to identify the potential sources of heterogeneity and detect possible effects of moderators. In univariate meta-regression, it was found significant positive or negative relationships between the ES, and 1) the MMSE scores (slope >0.1, p≤0.002, 10 comparisons, n = 1,313); 2) the BMI values of case-control matched subjects or controls (slope >0.3, p < 0.0001, 13 comparisons, n = 1,767); 3) the blood levels of TG in controls (slope = 0.030, 95% CI = 0.023 to 0.036, p < 0.00001, 6 comparisons, n = 953) or of LDL in case-control matched subjects (slope=–1.051, 95% CI: –1.990 to –0.112, p = 0.028, 6 comparisons, n = 914), indicating that these variables might be important confounding factors, and potential sources of heterogeneity. In particular for MMSE, the meta-regression analysis suggested that the lower MMSE scores, the lower the blood leptin levels were (see Table 1 for details). Additionally, there was a negative and significant correlation between the ES and sample size (slope = –0.005, 95% CI = –0.009 to –0.0005, p = 0.029), suggesting that the much smaller sample size yielded greater ES. In contrast, the covariates of age and HDL could not explain the high heterogeneity, meaning no associations between both the moderators and the magnitude of the ES.
Sensitivity analyses
We conducted sensitivity analyses excluding studies one at a time to determine the robustness of the analyses and to verify whether a particular study was responsible for the high heterogeneity. No single study thoroughly explained the heterogeneity and the results remained significant in all cases, even when the study conducted by Warren et al. [24] with larger subject number was excluded (Supplementary Figure 3).
Publication bias
Visual inspection of the funnel plots suggested that there was evidence for publication bias (data not shown) in the overall and the subgroup meta-analyses with the exception of the subgroups (serum, mixed-gender, female in plasma), where 1–4 studies needed to be imputed to yield a symmetric funnel plot (Supplementary Table 2), suggesting that some of the associations between leptin and AD observed in this meta-analysis were caused by publication bias.
As shown in Supplementary Table 2, of the subgroups, imputation led to larger or smaller ES estimates, and after imputation several comparisons without significance produced statistically significant changes, meaning that there were insufficient sample numbers in these subgroups. Furthermore, the Classic fail-safe N was used to estimate how many insignificant effect sizes (unpublished data) would be necessary to reduce the ES to an insignificant level, and the results revealed that many missing studies would be required to make p < 0.05, suggesting the stability of the statistical positive results. No significant publication bias among the other studies was detected as demonstrated by inspection of funnel plots and confirmed by the Egger’s tests.
Statistics showed that, after the trim-and-fill procedure, in the plasma- and male- subgroup comparisons, the adjusted ESs (g) were –0.817 and –0.975, respectively, and both of the p-values achieved statistically significant levels (p < 0.05), suggesting the view that publication bias was likely to be the cause of the negative results of the meta-analyses of both the subgroups.
DISCUSSION
Summary of evidence
Current systematic review includes data from 27 case-control studies comprising 1,622 AD patients and 1,392 healthy control subjects. As far as we know, this is the first meta-analysis carried out so far to investigate the relationship between leptin and AD. Also, our meta-analysis is the first one to take gender into account in assessing the associations of leptin levels with the disease. The current meta-analytic findings confirm that there are higher concentrations of blood (serum) leptin not only in AD, but also in female AD patients, compared with respective controls. Moreover, somewhat unexpectedly, our study corroborated the notion that blood leptin levels correlated directly with the severity of dementia symptoms, which has been investigated, but not been ascertained [20, 22]. Sensitivity analysis indicated that the significant associations observed in this meta-analysis were not influenced by any single study. Although publication bias was detected, our analyses suggested that these positive results were unlikely to be influenced by publication bias. Therefore, we imply that patients with female AD, as well as AD, have decreased circulating blood, in particular serum, leptin levels in comparison with age-, gender-, and body weight-matched controls. As for the negative results, in particular for the subgroup analysis based on males, however, due to significant publication bias, it is inappropriate that such a conclusion can be drawn that blood leptin concentrations is lower in male AD patients than male controls.
This meta-analysis found a large amount of heterogeneity among studies, and sensitivity analysis showed that no single study fully explained the heterogeneity. The strength of this work is that subgroup and meta-regression analyses were used to adjust for potential confounders, showing that both MMSE and BMI were confounding factors, which resulted in high heterogeneity. The subgroup meta-analyses showed that decreased heterogeneity was partially observed, although, in general, the heterogeneity remained high in the other subgroups. Meta-regression analyses suggested that the covariates (age and HDL) could not explain the high heterogeneity. However, MMSE score was found to be significantly positively associated with blood leptin levels, indicating disease severity had a moderating effect on the outcome of the meta-analysis. Therefore, the between-study heterogeneity in this meta-analysis could be partly explained by disease severity. The meta-regression on the effects of blood biochemistry variables revealed significant or non significant associations with the ES; the analyses may have been underpowered, having only 5 or 6 studies included, as for meta-regression a minimum of 10 studies is recommended [38]. Other confounding factors, including APOE ɛ4 allele status [24, 35] and serum testosterone levels [27], which failed to be tested in current study due to limited published data, might be important moderating factors. Thus, more studies are required to validate these relationships.
Recent epidemiological and human studies have suggested that leptin can play an important role in AD [17]. Plasma leptin levels exhibit sexual dimorphisms, with women having higher plasma leptin levels even after controlling for body adiposity [39]. It was also found that moderately elevated leptin concentrations were correlated with lower risk of all-cause mortality and cardiovascular diseases-related mortality among older women, whereas no association was observed in men [40], suggesting that leptin exerts a physiological role in a gender-dependent manner. Contrary to our expectation, a significant reduction in blood leptin levels, as it does in female AD patients, failed to be observed in male AD patients, relative to same-gender controls. However, after the trim-and-fill correction, the subgroup analysis also revealed a significant reduction (p < 0.05) in blood leptin levels in male AD patients compared with male controls. So, this still did not support the hypothesis that there would be a greater reduction in blood leptin levels only in female, but not in male AD patients, and instead suggested that the magnitude of blood leptin reduction might be similar across gender.
In the current meta-analysis, although AD patients had significantly lower leptin levels in serum, not in plasma, based on the adjusted g-value due to publication bias, in plasma, there were also significantly decreased leptin levels with a large ES in AD patients than controls, suggesting that there is no difference between plasma and serum levels of leptin in AD patients compared with controls. Regarding the circulating leptin concentration analysis, some studies explored serum levels, and others reported plasma concentrations. To date, however, there were no studies reporting the comparison of plasma with serum in leptin levels. It is also important to be known that negative findings tend not to be reported in the medical literature, which is why we think that it does not exist the difference between plasma and serum of leptin levels.
The hypothesis that the decreased leptin contributes to the progression of AD is plausible in view of the considerable evidence showing the significant role of leptin in AD pathology [41–43]. Exogenous leptin administration to transgenic mice overexpressing APP decreased the brain levels of Aβ and phosphorylated tau. In addition, both exogenous leptin administration and leptin viral gene transfer led to improvements in behavior and memory tasks in a transgenic mouse model of AD [44]. In contrast, leptin deficiency can worsen brain amyloid burden and cognitive function as demonstrated consistent with a role for leptin as a neurotrophic and neuroprotective agent; low leptin levels or leptin insensitivity can contribute to the worsening cognitive decline and AD pathology in animal models. Leptin has been shown to decrease with increasing AD severity as measured by the MMSE [24]. We found that the greater the severity of positive symptoms, the lower leptin levels were. Our unpublished data showed that mild cognitive impairment subjects, a prodromal stage of AD, had a trend, but not significant reduction of blood leptin levels, which supports the notion that the degree of the severity of dementia symptoms is close related to blood leptin concentrations. This makes leptin an attractive potential biomarker of AD progression, mirroring severity. If future studies reveal an increase in leptin in AD subjects right before exacerbations of positive symptoms, and that it increases predicts the occurrence of exacerbations of the disease, this would possibly make leptin a very useful biomarker to guide strategies in the clinical setting.
Limitations
A potential source of bias in any review is a failure to retrieve a comprehensive sample of studies. This problem also applies to the present meta-analysis, where our search strategy may have missed some studies, particularly unpublished studies. However, the results of our Fail-safe N and Egger’s test analyses suggest that this review on females is unlikely to be subject to publication bias. More comprehensive reporting of all relevant data in future case-control studies of peripheral and CSF leptin concentrations in AD would enable clarification of the role of reduced leptin in the disease process.
Our study relied on a moderate sample size, which permitted us to draw results using meta-analysis and meta-regression techniques. Due to the small number of subjects, in particular for plasma samples and in male participants, which is a primary limitation of our study, our results are less definitive for subgroup analysis. So, although our study found that leptin could, to a large extent, distinguish female AD from cognitive healthy female subjects, this result should be understood with caution and needs to be validated in further investigations with more samples.
Conclusions
To conclude, the results of our meta-analysis provide evidence that blood leptin concentrations are decreased in female patients with AD, with lower blood leptin concentrations accompanied by more severe dementia symptoms. Future studies need to investigate whether changes in leptin levels in males have a significant relationship to the development of AD, and whether blood biochemistry parameters are correlated with leptin levels.