
Abstract
Neuroglobin (Ngb) has been reported to be increased in early and moderately advanced Alzheimer’s disease (AD) stages but declined in the severe stage. However, its regulatory mechanisms and pathophysiological roles in the disease remain to be defined. In this study, we found that Ngb expression was significantly upregulated by low dose Aβ25–35, the neurotoxic fragment of Aβ1 - 40 and Aβ1 - 42, but was not further increased by a higher dose of Aβ25–35. Mutation analysis and supershift assay demonstrated that transcription factor Nuclear Factor κB (NFκB), κB2 and κB3 sites located in mouse Ngb promoter region were involved in dynamic regulation of Ngb expression in response to different doses of Aβ25–35 stimulation. In addition, we found that suppression of endogenous Ngb expression exacerbated Aβ25–35-induced neuronal cell death and mitochondrial dysfunction. Our results indicate that endogenous Ngb expression may be upregulated by low dose Aβ25–35, which is responsible for protecting against Aβ25–35-mediated neurotoxicity. These experimental findings suggest that upregulation of endogenous Ngb expression might be an effective intervention approach for AD.
INTRODUCTION
Alzheimer’s disease (AD) is the most common form of dementia that is characterized by the deposits of extracellular amyloid-β (Aβ) plaques, intracellular neurofibrillary tangles (NFT), and neuronal loss in neocortex, hippocampus, and other subcortical regions which are important for cognitive function [1, 2]. Extensive evidence suggests that the neurotoxic forms of Aβ peptide are originally derived from the amyloid-β protein precursor (AβPP) via proteolytic cleavage by β- and γ-secretases [3]. Among the Aβ fragments, Aβ1 - 40 and Aβ1 - 42 are thought to be two main neurotoxic Aβ fragments in the plaques. Aβ25–35 has been frequently used to mimic the neurotoxic role of Aβ1 - 40 or Aβ1 - 42 in experimental studies, as it represents the biologically active region of Aβ1 - 40 or Aβ1 - 42, and causes enhanced neurotoxicity [4]. It is generally accepted that Aβ25–35 is not naturally formed, but some studies found the presence of Aβ25–35 in the brains of AD patients [5, 6]. Emerging experimental investigations have demonstrated that there are endogenous molecules that are neuroprotective to protect against Aβ neurotoxicity, understanding the regulatory mechanisms of pathological roles of endogenous neuroprotective molecules might lead to develop a novel and effective intervention approach for AD. Neuroglobin (Ngb) is one of the top candidate molecules [7].
Ngb is an oxygen-binding globin protein that is highly expressed in the neurons of vertebrate central and peripheral nervous systems [8]. Emerging experimental findings from our laboratory and others have suggested that Ngb is a novel endogenous neuroprotectant that can be upregulated by hypoxic/ischemic [9, 10] and oxidative insults [11, 12]. Ngb exerts its neuroprotective functions by preserving mitochondrial ATP production [12, 13], inhibiting cell death signaling pathway [14], scavenging reactive oxygen species (ROS) [15, 16], and modulating nitric oxide homeostasis [17, 18]. Moreover, we previously described that Ngb can translocate into mitochondria in response to oxygen-glucose deprivation (OGD) [19], inhibit OGD-induced mitochondrial permeability transition pore opening [20] and mitochondrial respiratory chain complex III activity elevation [21], and eventually attenuate OGD-induced neurotoxicity, suggesting that Ngb’s neuroprotective roles are closely associated with preservation of mitochondria function.
Very interestingly, experimental evidence strongly linked Ngb in AD pathophysiology and progression. For example, Ngb was upregulated in the temporal lobe of AD patients, but decreased to baseline levels in cases of severe AD pathology [22]. Consistently, another study suggested that Ngb is increased in the early and moderately advanced AD, but declined in the severe stage [23]. Experimental investigations have found that Ngb attenuates Aβ neurotoxicity in vitro and transgenic Alzheimer phenotype in vivo [24]. Taken together, in this study we hypothesize that Ngb expression might be upregulated by Aβ peptide exposures, and the Ngb expression in response to Aβ stimulation is protective against Aβ-induced neurotoxicity by preserving mitochondrialdysfunction.
To test our hypothesis, in this study we used Aβ25–35, the neurotoxic fragment of Aβ1 - 40 or Aβ1 - 42 [4], to treat primary mouse cortical neurons and mouse Neuro2A (N2a) neuroblastoma cells, and investigated response and regulatory mechanisms of Ngb gene expression. Furthermore, the role of endogenous Ngb in Aβ25–35- induced neurotoxicity and its attribution in underlying mitochondrial dysfunction was also studied. Our results found that non-neurotoxic low dose Aβ25–35, but not neurotoxic high dose Aβ25–35, significantly induced Ngb upregulation, and transcription factor Nuclear Factor κB (NFκB) and its κB2 and κB3 sites located in mouse Ngb promoter region were involved in this delicate regulation process. In addition, our data showed that suppression of endogenous Ngb expression in primary mouse cortical neurons exacerbated Aβ25–35-induced neurotoxicity and mitochondrial dysfunction, which includes decrease of ATP production, mitochondrial membrane potential (ΔΨm), and increase of complex III activity, implying that the increases of Ngb in response to low dose of Aβ25–35 might protect against Aβ25–35-induced neurotoxicity. Therefore, seeking upregulation of endogenous Ngb expression might be a novel and effective strategy for intervention of AD.
MATERIALS AND METHODS
Materials
Dulbecco’s modified Eagle’s medium (DMEM), Lipofactaminetrademark 2000, Lipofectaminetrademark RNAiMAX, geneticin, and penicillin were purchased from Thermo Fisher Scientific. Fetal bovine serum (FBS) and 0.25% trypsin-EDTA were purchased from Gibco. The N2a cell line was obtained from the American Type Culture Collection. Aβ25–35 was purchased from Sigma-Aldrich. Mouse Ngb siRNA and control siRNA were purchased from Origene. Dual-Luciferase Reporter Assay kit and CellTiter-Glo® Luminescent Cell Viability Assay kit were purchased from Promega. JC-1 assay kit was obtained from Thermo Fisher Scientific. Anti-p50, Anti-p65, and Anti-cRel antibodies were purchased from Abcam. Antibodies against cleaved caspase 3, caspase 3, and β-actin were purchased from Cell Signaling Technology. Chicken anti-Ngb primary antibody was purchased from BioVendor. Reporter plasmids P-554 (−549/+6) and constructs with mutations to the NFκB-binding sites were constructed as described previously [25].
Cell culture
The animal protocol was approved by the Institutional Animal Care and Use Committee of Massachusetts General Hospital. Primary mouse cortical neuronal culture was performed as described before [20, 26]. Briefly, primary mouse cortical neurons were prepared from the cortex of embryonic day 15 (E15) obtained from the pregnant C57BL/6 female mouse. The cell pellets were re-suspended in Neurobasal medium (NBM), supplemented with 2% B27, 0.8 mM L-Glutamine, and 100μg/mL penicillin/streptomycin, seeded onto 6 cm wells plate pre-coated with poly-D-lysine at density of 3×10⁵ cells/mL and cultured at a humidified (5% CO2, 37°C) incubator. Medium was half changed every 3 days. All experiments were performed on cultures at days 7–9 in vitro.
The mouse N2a neuroblastoma cells were maintained in DMEM with 10% heat-inactivated FBS and 100μg/ml penicillin/streptomycin in a humidified (5% CO2, 37°C) incubator. The cells were seeded onto 24 wells plate or 6 wells plate at a density of 1.5×10⁵ cells/mL.
Transfection
For transfection with siRNAs, on the 8th day after seeding, the primary mouse cortical neurons were transfected with Ngb siRNA or control siRNA using Lipofectaminetrademark RNAiMAX following the manufacturer’s protocol. For transfection with luciferase reporter constructs into N2a cells, the cells with approximately 70% confluence were transiently transfected with DNA constructs using Lipofectamine 2000trademark following the manufacturer’s protocol as described previously [25].
Preparation of A β25–35
Aβ25–35 was prepared as described previously [26]. Briefly, Aβ25–35 was dissolved in deionized distilled water at 1 mM, and subsequently aged for 5 days at 37°C before being used.
Cell viability assay
Cell viability was measured by MTT assay according to manufacturer’s protocol as described previously [27]. N2a cells with approximately 70% confluence were transfected with Ngb siRNA or control siRNA for 24 h, followed by Aβ25–35 treatment. After treatment for 24 h, cells were treated with fresh DMEM containing MTT for 4 h in the cell culture incubator. The medium was subsequently aspirated and the formazan crystals were dissolved by DMSO. The absorbance at 570 nm was measured by using a microplate reader. Percentages of live cell counts were used for assay normalization.
Real-time quantitative PCR (RT-qPCR)
RT-qPCR was performed as previously described [25]. Briefly, total RNA from primary mouse cortical neurons was isolated with the RNeasy Lipid Tissue Mini Kit (Qiagen) according to the manufacturer’s instruction. Then cDNA was synthesized by reverse-transcription with SuperScript system (Thermo Fisher Scientific). The mRNA levels of Ngb were measured by quantitative real-time PCR using SYBR green kit in an ABI 7000 real-time PCR system (Applied Biosystems). The following sequences were used as primers for real-time PCR amplification: mouse Ngb sense primer, 5’-ATGCTGCAGTGACCAACGTG-3’; mouse Ngb antisense primer, 5’-GCGGTCCTTGTAGCTGGTGT-3’; and mouse 18sRNA sense primer, 5’- AGGGGAGAGCGGGTAAGAGA-3’; mouse 18sRNA antisense primer, 5’- GGACAGGACTAGGCGGAACA-3’; Data were analyzed according to the comparative threshold cycle method with expression for sample normalization. Real-time qPCR assay was performed in triplicate for each sample to ensure reproducibility.
Western blot analysis
Western blot analysis was performed as described previously [25]. Briefly, mouse primary cortical neurons or N2a cells were lysed in cell lysis buffer (Cell signaling Technology) supplemented with 100× protease inhibitor (Sigma), and 20μg of total proteins were separated using 4–12 % SDS-PAGE gel (Thermo Fisher Scientific) and transferred onto nitrocellulose membrane (Thermo Fisher Scientific). The membrane was blocked with 5% non-fat dried milk in 10 mM PBS buffer (PH 7.2) for 1 h, followed by immunoblotting by incubation with primary antibodies overnight at 4°C, and subsequently incubated with secondary antibodies for 1 h at 25°C. After washing with TTBS, immunoreactive proteins were determined by enhanced chemiluminescence (Amersham Pharmacia Biotech) according to the manufacturer’s protocol and then exposed to film (X-Omat; Eastman Kodak Co.).
Luciferase assay
Luciferase assay was performed as described previously [25]. The reporter plasmids P-554 (−549/+6) or its mutated constructs and control plasmid PRL-TK were co-transfected into N2a cells for 24 h, then cells were lysed with 1× passive lysis buffer. 50μL lysates were used for luminescence measurements with Dual-Luciferase Reporter Assay kit. The luciferase activities of firefly and Renilla were successively detected in a VeritasTM Microplate Luminometer (Turner BioSystem). The relative luciferase activity was defined as the firefly/Renilla luciferase ratio.
Electrophoretic mobility shift assay
Electrophoretic mobility shift assay (EMSA) was performed as we described previously [25]. Nuclear extracts from N2a cells were prepared using NE-PER Nuclear and Cytoplasmic Extraction kit (Thermo Fisher Scientific). The following oligonucleotides were synthesized, labelled with biotin using biotin 3’-end DNA-labelling kit (Thermo Fisher Scientific) and annealed to obtain double-stranded DNA probes:
κB2 sense, AGCCTGGACATTTCCCAGGCCTC; κB2 antisense, GAGGCCTGGGAAATGTCCAGGCT; κB3 sense, CCCAAGCGGGGTCCCCGGAAGCG; κB3 antisense, CGCTTCCGGGGACCCCGCTTGGG.
DNA-protein binding reactions for supershift assays were performed using Lightshift EMSA optimization and control kit (Thermo Fisher Scientific). DNA-protein complexes were loaded on to a 6% non-denaturing polyacrylamide gel and electrophoresed, and subsequently transferred to a nylon membrane (Ambion). The membrane was cross-linked and detected using the Chemiluminesent Nucleic Acid Detection Module (Thermo Fisher Scientific), and exposed to film (X-Omat; Eastman Kodak Co.).
ATP production assay
ATP production assay was performed according to the manufacturer’s instruction as described previously [28]. Briefly, 100μL of neurobasal medium were mixed with the same volume of CellTiter-Glo® reagent and then added into primary mouse cortical neuron cultures. The lysates were transferred to black 96-well plates, and incubated at room temperature for 10 min to stabilize luminescent signal, which was subsequently recorded by the plate reader (Wallac Tri-Lux beta, PerkinElmer Life and Analytical Sciences, Waltham, MA).
Mitochondrial membrane potential measurement
The mitochondrial membrane potential (ΔΨm) was measured by staining primary mouse cortical neurons with JC-1 (5, 5’, 6, 6’-tetrachloro-1, 1’, 3, 3’-tetraethylbenzimidazolyl-carbocyanine iodide) as we previously described [28]. The ΔΨm in each treatment group was calculated as the fluorescence ratio of red (JC-1 aggregates) to green (JC-1 mononers). After the indicated treatment, primary cortical neurons were incubated with JC-1 probe (final concentration 1μg/ml) at 37°C for 20 min, followed by rinsing with PBS for 3 times and further stained by DAPI. Subsequently, the fluorescence in cells was either detected by a microplate reader (green fluorescence, excitation 489-nm and emission 529-nm; red fluorescence, excitation 570-nm and emission600-nm) and imaged with a fluorescence microscope.
Complex III activity assay
At 8 days of culture, primary mouse cortical neurons were transfected with Ngb siRNA or Control siRNA for 24 h, followed by exposures of indicated doses of Aβ25–35 for another 16 h. Mitochondria were isolated from neurons using the Mitochondria isolation kit (Thermo Scientific) according to the manufacturer’s instructions. Complex III Activity was measured using Mitochondrial Complex III Activity Assay Kit (Biovision, Milpitas) following the manufacturer’s instruction. Briefly, three reaction mix groups including background control group, sample group, and sample-inhibitor group (sample mix with complex III inhibitor) were prepared and added into wells of the clear bottom 96-well half area plate. Subsequently, 2μL mitochondrial samples and 6μL cytochrome c (substrate) were added into wells containing sample group and sample-inhibitor group. Immediately, the absorbance at 550 nm was read at 30 seconds intervals for up to 10 min by a microplate reader.
Statistical analysis
Data were expressed as mean±SD. Statistical significance (p < 0.05) were analyzed using ANOVA with Tukey’s post hoc tests for multiple comparisons using GraphPad Prism 7 software.
RESULTS
Aβ25–35 induces dose-dependent neuronal cell death of primary mouse cortical neurons and N2a cells
Primary cultured mouse cortical neurons and N2a cells were treated with Aβ25–35 at different doses, and neuronal cell death were measured by MTT assay. Our data showed that treatment with 10μM and 20μM of Aβ25–35 for 24 h led to significant cell death of primary mouse cortical neurons (Fig. 1A), and exposure of N2a cells to 20μM of Aβ25–35 also markedly induced cell death (Fig. 1B). These results suggested that Aβ25–35 induces neuronal cell death of primary mouse cortical neurons and N2a cells in a dose-dependent manner.
Effect of Aβ25–35 on neuronal cell death. A) Cell viability was measured by MTT assay in primary mouse cortical neurons cultured in 24 wells plate treated with different dose of Aβ25–35 (mean±SD); n = 4, *p < 0.05 compared with normal control (Aβ25–35 0μM). B) MTT reduction was measured by MTT assay in N2a cells cultured in 24 wells plate treated with different dose of Aβ25–35 (mean±SD); n = 4, *p < 0.05 compared with normal control (Aβ25–35 0μM).
Aβ25–35 increases Ngb expression of primary cultured mouse cortical neurons and N2a cells
To investigate the effect of Aβ25–35 on Ngb protein expression, primary cultured mouse cortical neurons and N2a cells were treated with Aβ25–35 for 24 h at different doses, and Ngb protein levels were measured by western blot analysis. Our data showed that exposure of primary mouse cortical neurons and N2a cells to Aβ25–35 (2–20μM) increased the expression of Ngb with the maximal effect at concentration of 2 and 5μM, respectively (Fig. 2A, B). We also determined the effects of Aβ25–35 on Ngb mRNA levels in primary mouse cortical neurons, and found 5μM of Aβ25–35 induced the maximal increase of Ngb mRNA expression at 8 h after Aβ25–35 exposure (Fig. 2C). Furthermore, in a dose-range experiment, we found that treatment with 10μM Aβ25–35 for 8 h also significantly induced Ngb mRNA levels, while the higher dose 20μM of Aβ25–35 significantly reduced Ngb mRNA compared to 10μM of Aβ25–35 (Fig. 2D). These data suggested that Aβ25–35 increases Ngb expression of primary cultured mouse corticalneurons and N2a cells.

Effect of Aβ25–35 on Ngb expression. A) Ngb protein levels were measured by western blot in primary mouse cortical neurons cultured in 6 wells plate treated with different dose of Aβ25–35 (mean±SD); n = 3, *p < 0.05 compared with normal control (Aβ25–35 0μM). B) Ngb protein levels were measured by western blot in N2a cells cultured in 6 wells plate treated with different dose of Aβ25–35 (mean±SD); n = 4, *p < 0.05 compared with normal control (Aβ25–35 0μM). C) The relative Ngb mRNA levels were examined by RT-qPCR in primary mouse cortical neurons cultured in 6 wells plate treated with 5μM of Aβ25–35 with different time course (mean±SD); n = 4, *p < 0.05 compared with normal control (Aβ25–35 0μM). D) The relative Ngb mRNA levels were examined by RT-qPCR in primary mouse cortical neurons cultured in 6 wells plate treated with different dose of Aβ25–35 for 24 h (mean±SD); n = 4, *p < 0.05 compared with normal control (Aβ25–35 0μM). #p < 0.05 compared with Aβ25–35 (10μM).
NFκB binding sites in Ngb promoter region are involved in Aβ25–35-induced Ngb expression
Next, we sought to further test whether Aβ25–35 is involved in the induction of Ngb gene expression in transcription level. We transfected mouse Ngb promoter vector P-554 (−549/+6) into N2a cells for 24 h, followed by treatment with different doses of Aβ25–35 for another 24 h. As expected, we found Aβ25–35 significantly increased Ngb promoter activity of P-554 (−549/+6) (Fig. 3A). Our previous data showed that κB2 and κB3 sites located in mouse Ngb gene promoter region from –549 to +6 could be bound by NFκB and mediated hypoxia-induced Ngb promoter activity [25], we thus investigated whether the κB sites were involved in Aβ25–35 induced Ngb promoter activity. As expected, our results indicated that mutations of κB2 and κB3 sites significantly inhibited Aβ25–35 induced Ngb promoter activity of P-554 (−549/+6) (Fig. 3B).
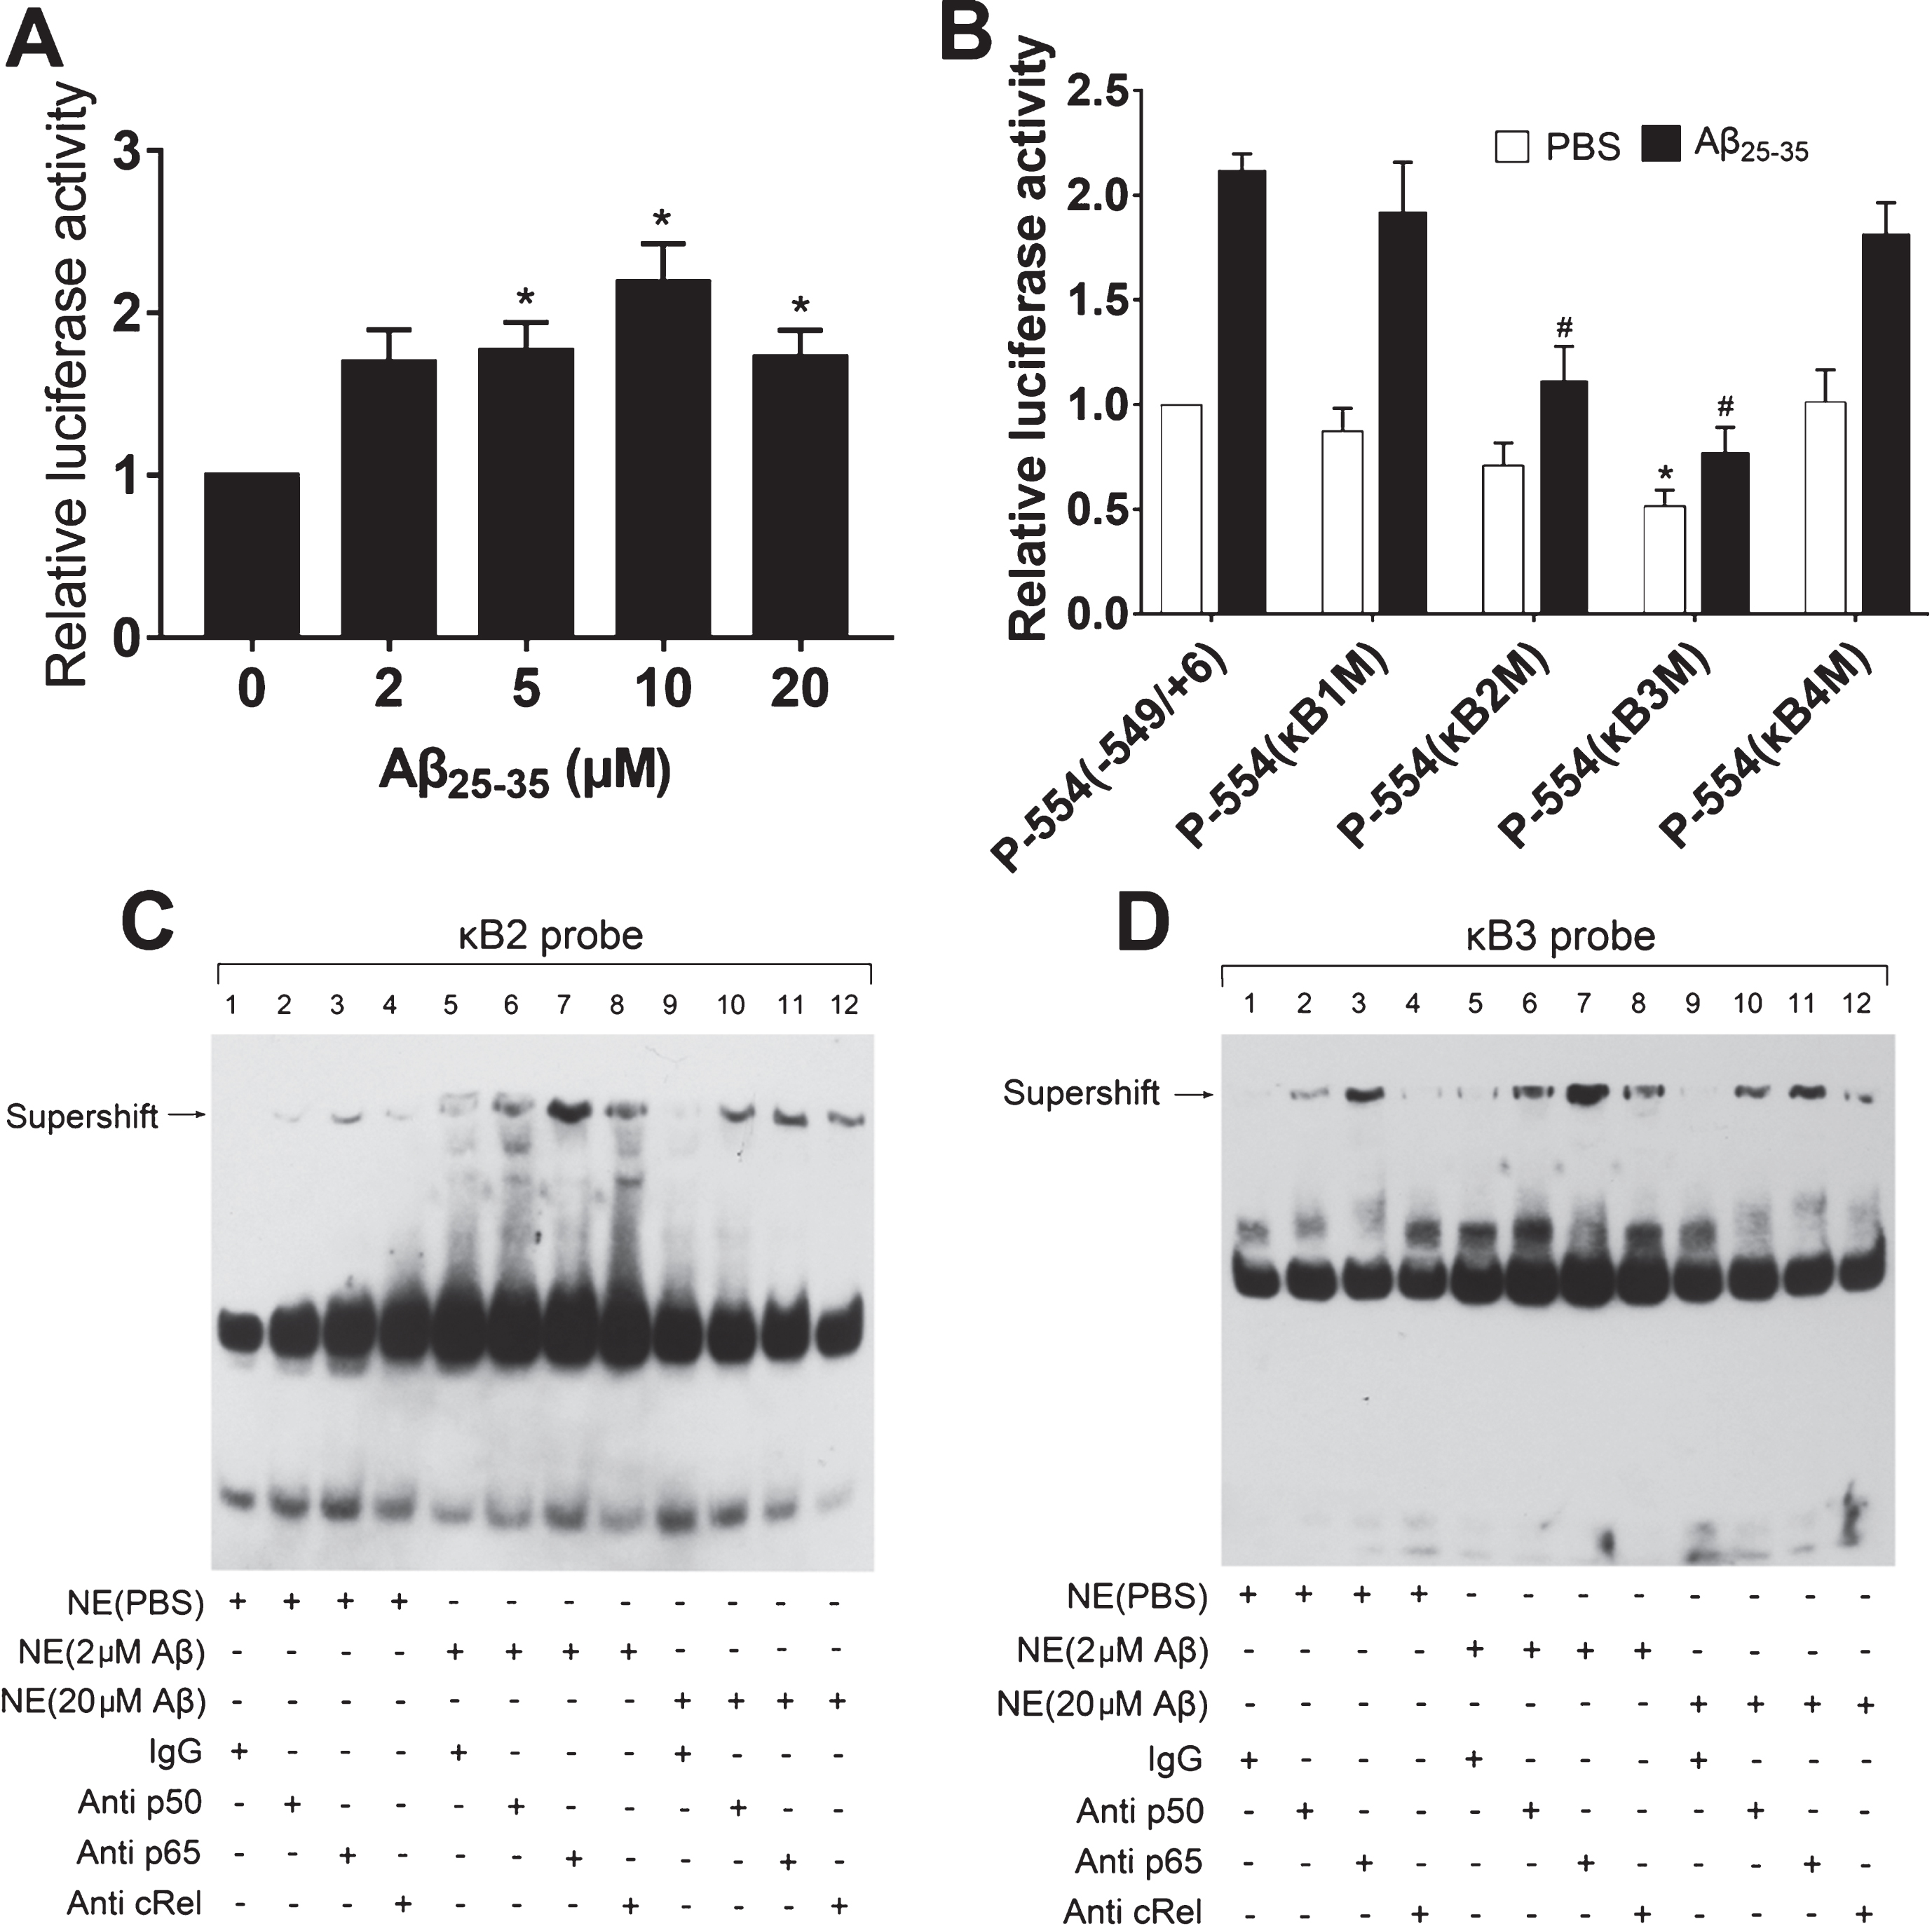
Effect of κB sites mutation in the Ngb promoter on Aβ25–35 increased Ngb expression. A) Relative Ngb promoter activities were determined by Luciferase assay in N2a cells cultured in 24 wells plate treated with different dose of Aβ25–35 (mean±SD); n = 5, *p < 0.05 compared with normal control (Aβ25–35 0μM). B) Relative Ngb promoter activities were determined by luciferase assay in N2a cells cultured in 24 wells plate and transfected with wild-type or mutated mouse Ngb promoter plasmids, followed by treated by 5μM of Aβ25–35 (mean±SD); n = 4, *p < 0.05 compared with N2a cells transfected with P-544(-549/+6). #p < 0.05 compared with N2a cells transfected with P-544(-549/+6) and treated with Aβ25–35 (5μM). C) Supershift assay of NFκB subunits (p65, p50, and cRel) binding to the κB2 site. Biotin-labeled κB2 probes were incubated with the nuclear extract (NE) of N2a cells treated with different dose of Aβ25–35, with or without addition of antibodies against p50, p65, and cRel. D) Supershift assay of NFκB subunits (p65, p50, and cRel) binding to the κB3 site. Biotin-labeled κB3 probes were incubated with the nuclear extract (NE) of N2a cells treated with different dose of Aβ25–35, with or without addition of antibodies against p50, p65, and cRel.
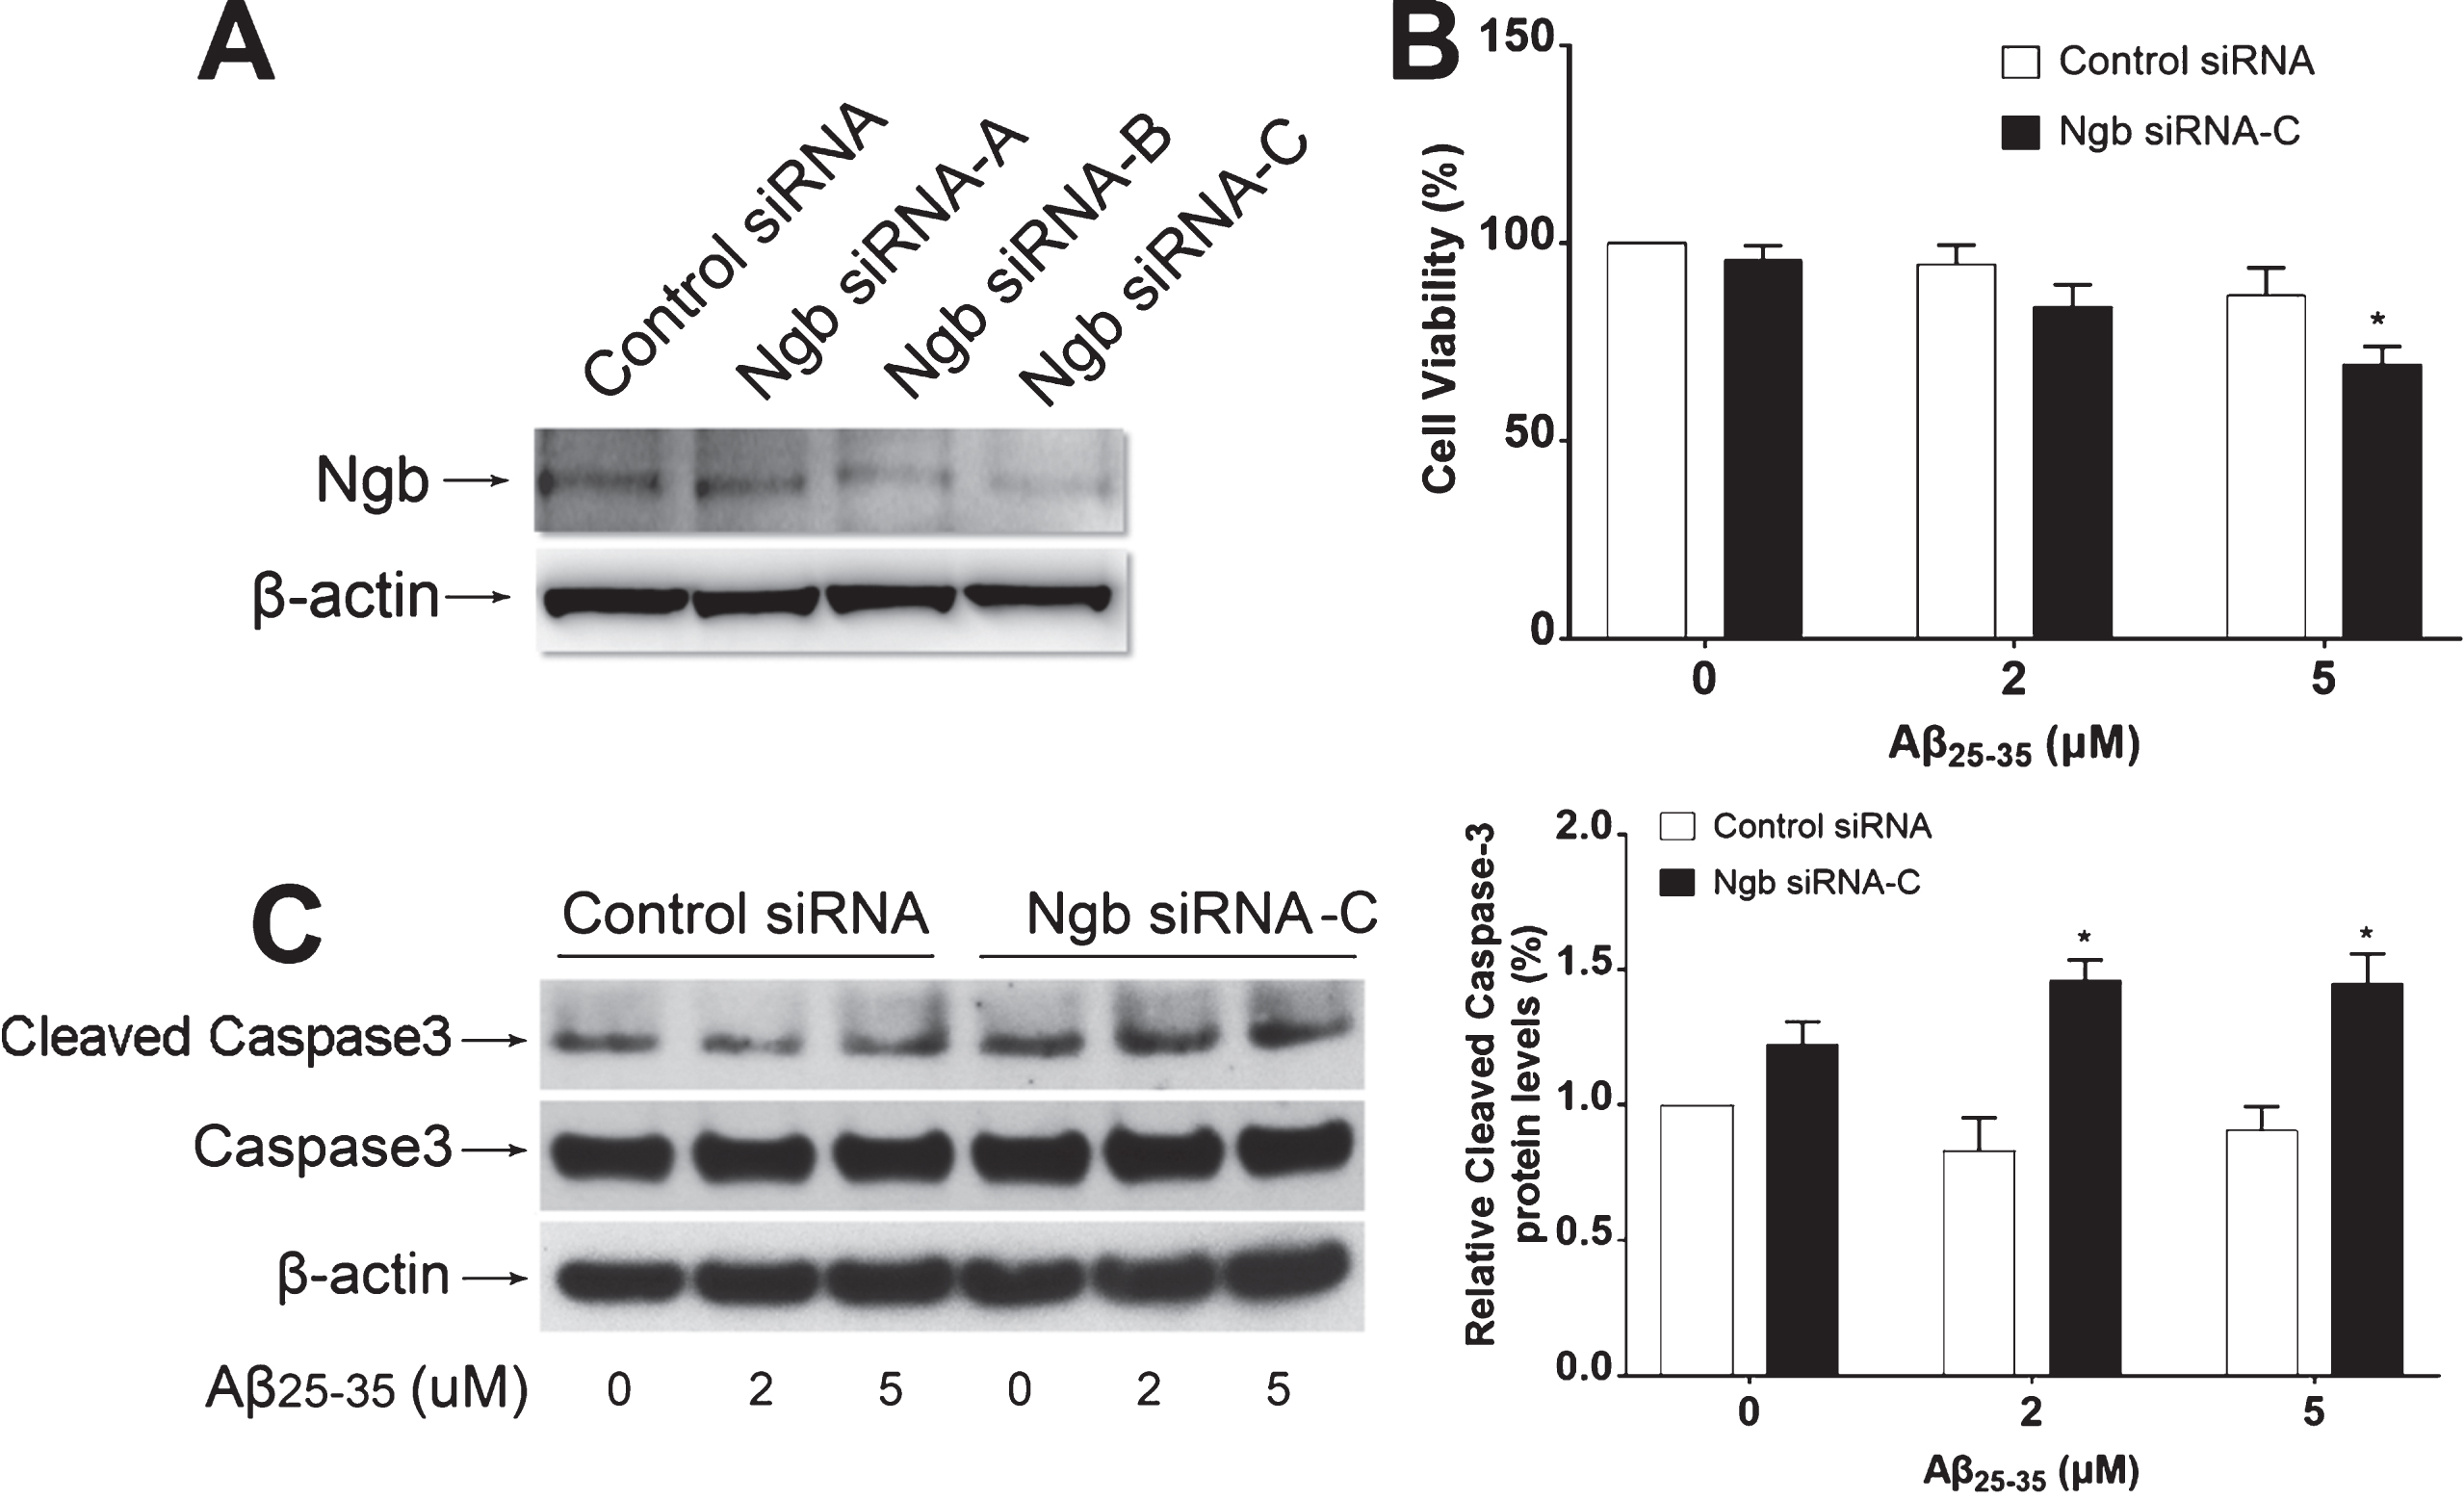
Effect of low dose of Aβ25–35 on neuronal cell death of primary mouse cortical neurons with Ngb knockdown. A) Representative western blot showing that Ngb protein expression was suppressed by specific Ngb siRNAs. B) Cell viability was measured by MTT assay in primary mouse cortical neurons cultured in 24 wells plate transfected with control siRNA or Ngb siRNA-C, followed by treated with different dose of Aβ25–35 (mean±SD); n = 4, *p < 0.05 compared with primary cortical neurons transfected with control siRNA and treated with Aβ25–35 (5μM). C) Cleaved caspase 3 protein levels were measured by western blot in primary mouse cortical neurons cultured in 6 wells plate transfected with control siRNA or Ngb siRNA-C, followed by treated with different dose of Aβ25–35 (mean±SD); n = 4, *p < 0.05 compared with primary cortical neurons transfected with control siRNA and treated with Aβ25–35.
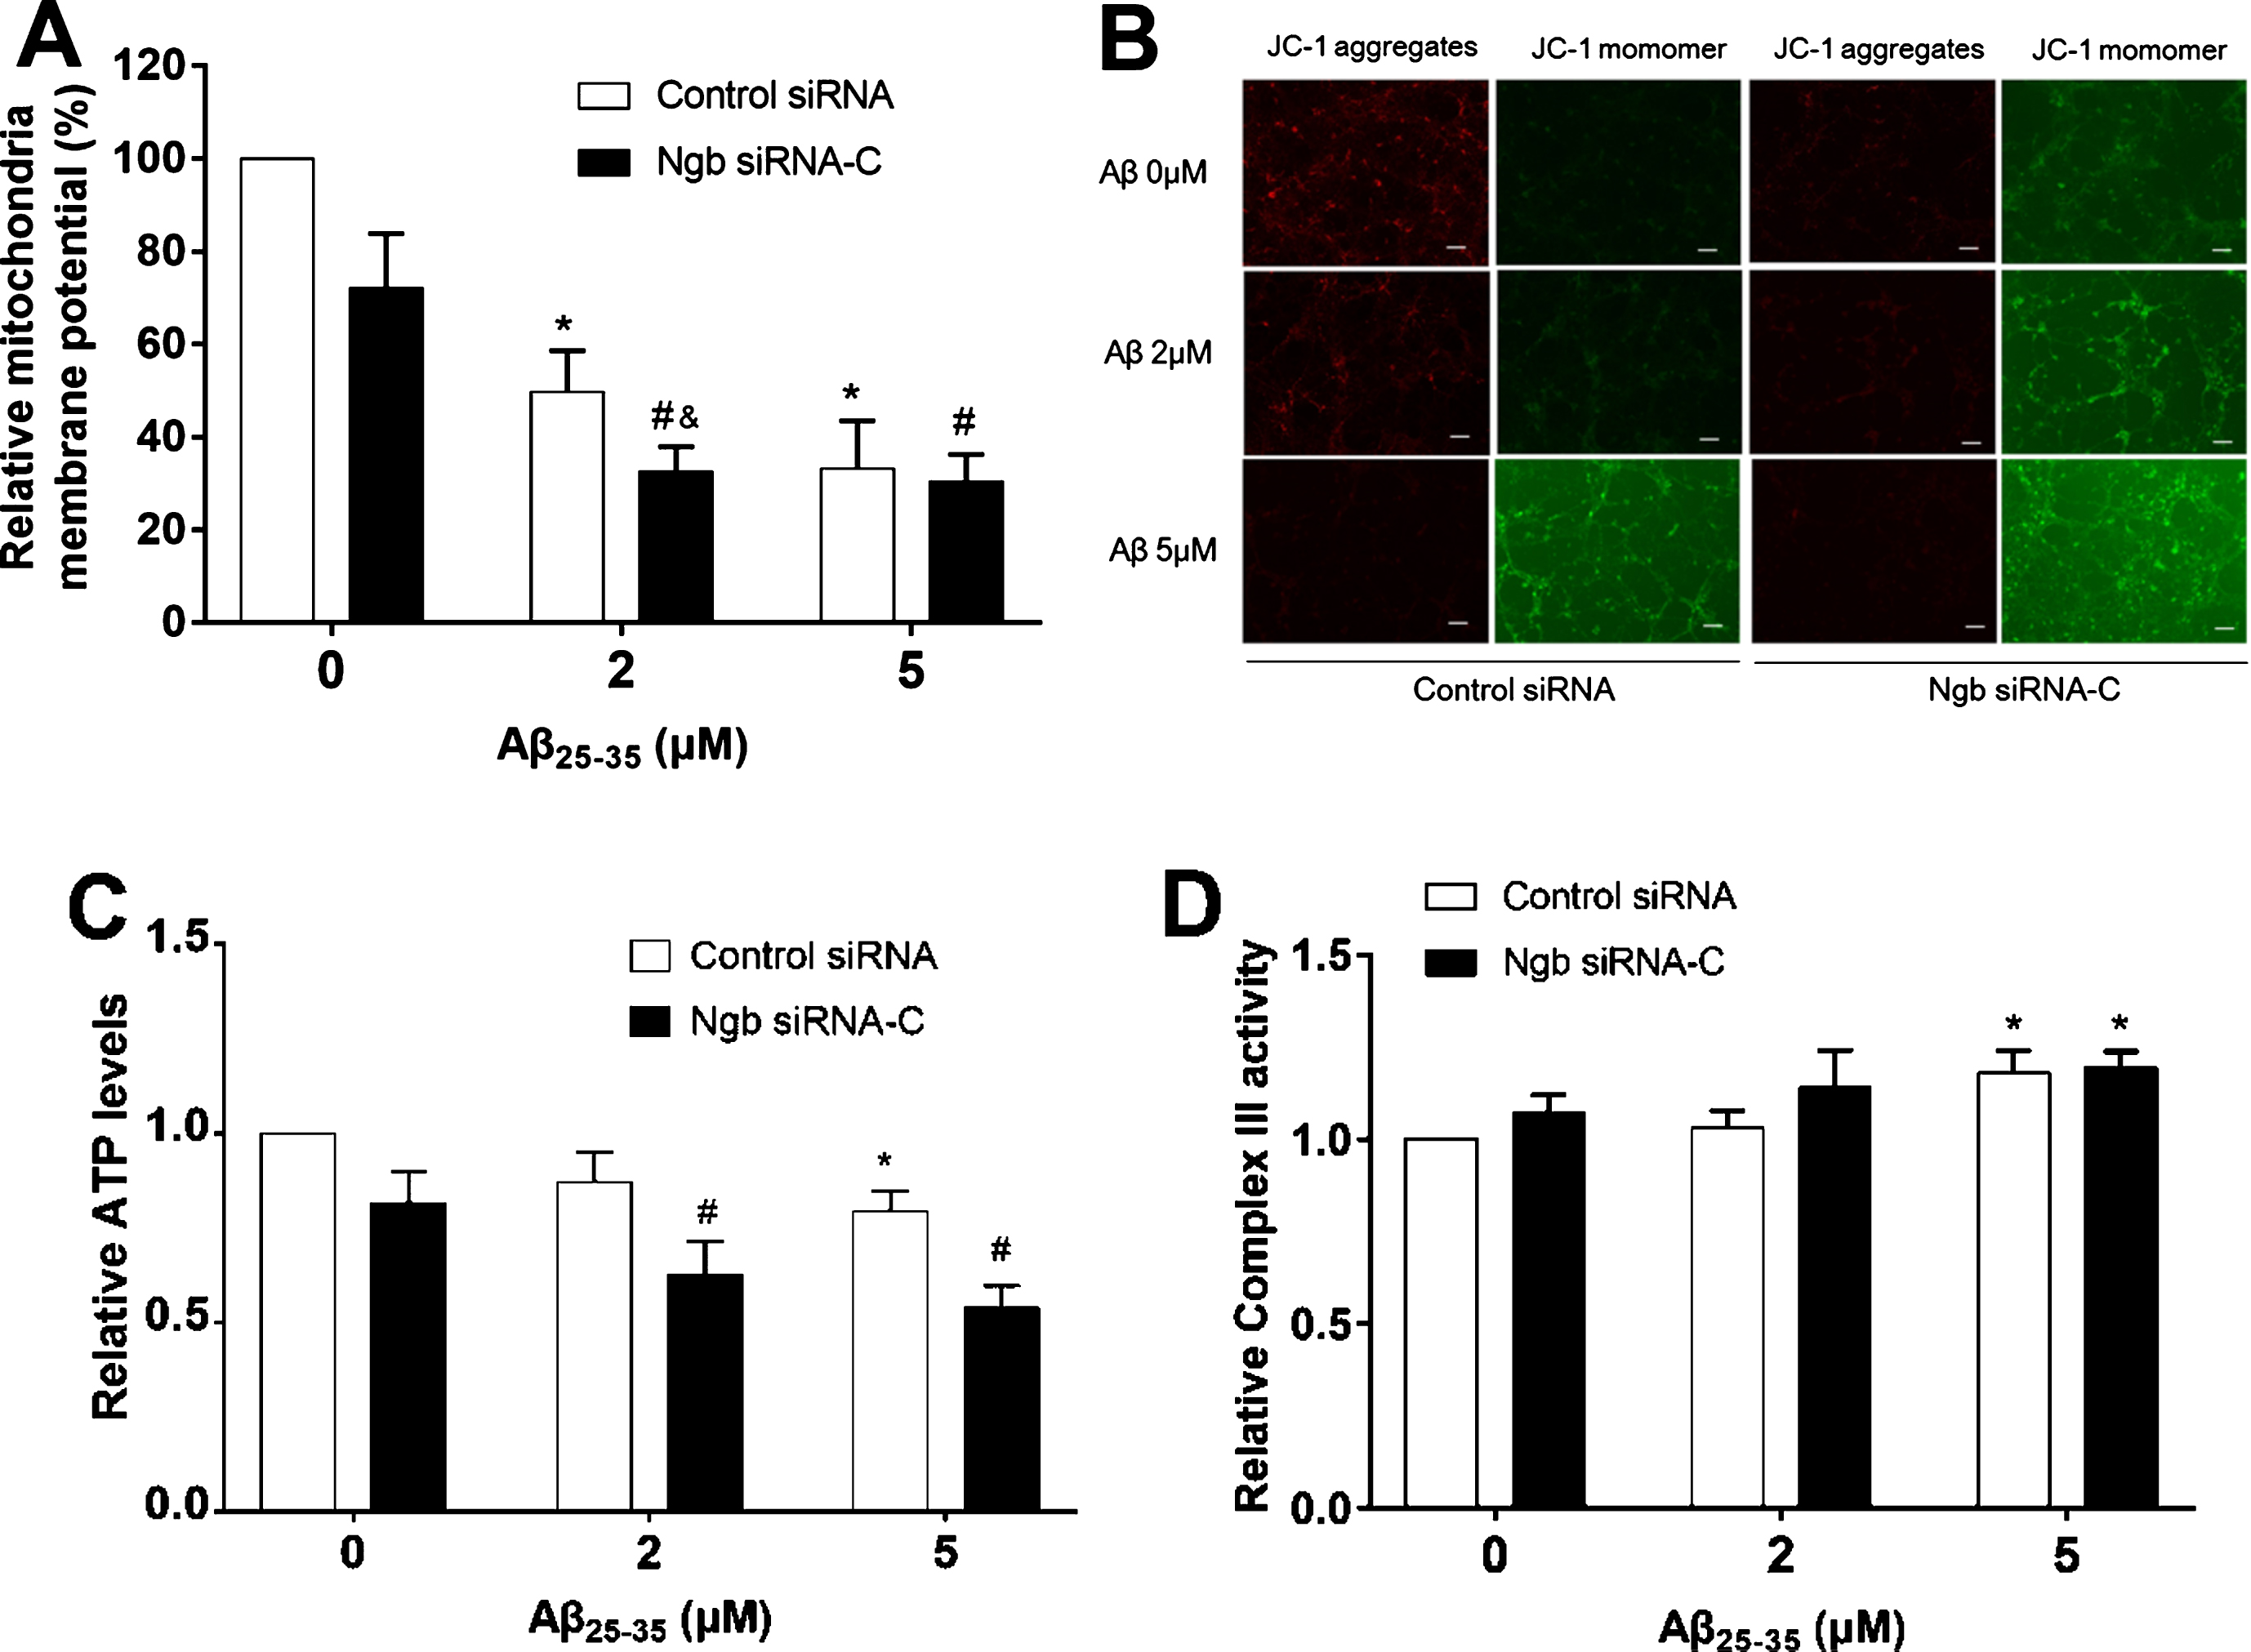
Effect of low dose of Aβ25–35 on mitochondrial function in primary mouse cortical neurons with Ngb knockdown. A) The mitochondrial membrane potential (MMP) was measured by JC-1 assay in primary mouse cortical neurons cultured in 24 wells plate transfected with control siRNA or Ngb siRNA-C, followed by treated with different dose of Aβ25–35 (mean±SD); n = 4, *p < 0.05 compared with primary cortical neurons transfected with control siRNA and treated with Aβ25–35 (0μM). #p < 0.05 compared with primary cortical neurons transfected with Ngb siRNA-C and treated with Aβ25–35 (0μM). &p < 0.05 compared with primary cortical neurons transfected with Ngb siRNA-C and treated with Aβ25–35 (2μM). B) Representative fluorescence microscopic imaging of JC-1 aggregates at 24 h after Aβ25–35 treatment (Scale bar = 50μm). C) The total intracellular ATP levels were measured in primary mouse cortical neurons cultured in 24 wells plate transfected with control siRNA or Ngb siRNA-C, followed by treated with different dose of Aβ25–35 (mean±SD); n = 4, *p < 0.05 compared with primary cortical neurons transfected with control siRNA and normal control (Aβ25–35 0μM). #p < 0.05 compared with primary cortical neurons transfected with Ngb siRNA-C and normal control (Aβ25–35 0μM). (D). The mitochondrial complex III activity was measured in primary mouse cortical neurons cultured in 10 cm dishes transfected with control siRNA or Ngb siRNA, followed by treated with different dose of Aβ25–35 (mean±SD); n = 3, *p < 0.05 compared with primary cortical neurons transfected with control siRNA and normal control (Aβ25–35 0μM).
Our previous results have shown that NFκB family members including p50, p65, and cRel were able to physically bind to κB2 or κB3 sites [25]. To investigate the effect of different doses of Aβ25–35 on the binding capabilities of NFκB family members to κB2 or κB3 sites, in vitro supershift assay was performed. Biotin-labeled κB2 probes were used as DNA targets for binding of nuclear protein extracts of N2a cells that were treated with 0, 2, or 20μM of Aβ25–35. Without Aβ25–35, addition of anti-p65 antibody into the reaction produced a notable shifted band, and addition of anti-p50 and anti-cRel antibodies into the reaction produced weak bands. When N2a cells were treated with 2μM of Aβ25–35, addition of anti-p65, anti-p50, and anti-cRel antibodies caused a dramatic increase in the mobility shift. However, treatment with 20μM of Aβ25–35 did not further increase the shift bands (Fig. 3C). Supershift assays were also conducted using the biotin-labeled κB3 probes, and similar results were observed (Fig. 3D). Moreover, it is noteworthy that addition of anti-cRel antibody into the reaction mixture did not produce a shift band using nuclear extracts of N2a cells without Aβ25–35 treatment, whereas addition of anti-cRel antibody resulted in a strong shift band and a weak band using nuclear extracts of N2a cells with 2μM and 20μM of Aβ25–35 treatment, respectively (Fig. 3D). These data indicated that transcription factor NFκB, κB2 and κB3 sites located in Ngb promoter region are involved in Aβ25–35-induced Ngbexpression.
Suppression of endogenous Ngb worsens low dose Aβ25–35-induced neurotoxicity
To investigate whether low dose Aβ25–35-induced Ngb upregulation is associated with neuroprotection against Aβ25–35, we applied RNA interference to suppress endogenous Ngb expression, and then investigated the effect of low dose Aβ25–35 on cell viability. Our data showed that transfection of primary mouse cortical neurons with specific Ngb siRNA but not control siRNA led to a significant reduction of Ngb protein expression assessed by western blot (Fig. 4A). The primary mouse cortical neurons were then transfected with Ngb siRNA or control siRNA for 24 h, followed by treatment with different doses of Aβ25–35. 2μM or 5μM of Aβ25–35 did not significantly induce neuronal cell death in control siRNA-transfected group, but 5μM of Aβ25–35 led to significant neuronal cell death in Ngb siRNA-transfected group (Fig. 4B), suggesting neuroprotective role of endogenous Ngb against Aβ25–35 s neurotoxicity. Aβ25–35 could cause apoptosis in primary neurons associated with increased activity of caspase-3 [29], which is the predominant caspase involved in apoptotic signaling pathway [30]. To investigate whether inhibition of Ngb expression worsens Aβ25–35-induced apoptosis, we examined the effect of low dose Aβ25–35 on the activation of caspase-3 after knockdown of Ngb expression using specific Ngb siRNA. Our results found that low dose Aβ25–35 did not cause cleavage of caspase-3 after transfection with control siRNA into primary cortical neurons, but significantly induced caspase-3 cleavage after endogenous Ngb downregulation by transfection with Ngb siRNA(Fig. 4C).
Suppression of endogenous Ngb expression exacerbates Aβ25–35-induced mitochondrial dysfunction
It has been well documented that Aβ-induced mitochondrial dysfunction is one of key pathological mechanisms of AD [31]. Our previous studies suggested that Ngb rescues mitochondrial dysfunction in primary mouse cortical neurons after oxygen-glucose deprivation [20, 21]. To investigate whether suppression of endogenous Ngb upregulation was associated with exacerbated mitochondrial dysfunction induced by Aβ25–35, we examined the effect of endogenous Ngb suppression on ΔΨm after Aβ treatment. The fluorescent probe JC-1 was used to determine ΔΨm in primary mouse cortical neurons transfected by Ngb siRNA for 24 h, followed by Aβ25–35 treatment for another 24 h. The results showed that the JC-1 red/green fluorescence ratio was significantly decreased by Aβ treatment compared to untreated control, while Ngb siRNA plus Aβ led to more reduction compared to Aβ treatment alone (Fig. 5A). Consistently, fluorescence microscopy of JC-1 aggregates also showed that the Ngb siRNA plus Aβ resulted in much more significant decreases of JC-1 aggregates, and an increase of JC-1 monomers (Fig. 5B). In addition, the intracellular ATP levels in primary mouse cortical neurons were measured after treatment with Ngb siRNA and Aβ. The results showed the intracellular ATP levels were decreased by Ngb siRNA transfection, Aβ treatment or Ngb siRNA plus Aβ, while Ngb siRNA plus Aβ led to more reduction compared to the other two groups (Fig. 5A). Mitochondrial complex III is a major source of ROS [32], which significantly contributes to neurotoxicity [33]. Our previous study demonstrated that Ngb physically interacts with mitochondrial complex III subunit Cyc1, resulting in suppression of OGD-induced Complex III activity and ROS generation elevation [21]. We thus further investigated the effect of Ngb suppression and Aβ25–35 on mitochondrial complex III activity. The results showed that mitochondrial complex III activity in primary mouse cortical neurons was significantly increased in response to 5μM of Aβ25–35, and 5μM of Aβ25–35 plus Ngb siRNAtreatment.
DISCUSSION
In this study, we revealed significant association between Aβ stimuli and Ngb expression and observed that suppression of endogenous Ngb worsens low dose Aβ25–35-induced neurotoxicity and mitochondrial dysfunction, implying Ngb expression may be delicately and dynamically regulated in AD progression, and higher levels of neuronal Ngb may potentially lower AD risk or slow AD progression.
Aβ itself or its oligomeric forms play central roles in the pathogenesis of AD that leads to disrupted cognitive function, probably through producing excess ROS and triggering neuronal cell death [34, 35]. In the present study, we observed that exposure of primary mouse cortical neurons and N2a cells to relatively high dose of Aβ25–35 (20μM), but not low dose of Aβ25–35 (2μM or 5μM), significantly induced cell death (Fig. 1). Further, we also observed that high dose of Aβ25–35 (20μM) induced relatively lower expression of Ngb compared to the sublethal dose of Aβ25–35 (2μM or 5μM) (Fig. 2). These observations may be simply explained that neurons respond to the lower dose of Aβ25–35 by upregulating Ngb expression to protect against it neurotoxicity, whereas high dose of Aβ25–35 is lethal, which significantly leads neuron death, while deprives the capability of Ngb upregulation. Interestingly, these findings were in agreement with previous studies that increased brain Ngb protein levels were detected in patients with early and moderately advanced AD [22], but declined to control levels in severe stage [23].
A recent study reported that RE-1-silencing transcription factor (REST/NRSF) regulates Ngb expression in APP23 mice brain [36], but the underlying regulatory mechanisms of Ngb in AD are still largely unknown. Interestingly, our previous study demonstrated that hypoxia-induced Ngb upregulation is mediated partially by NFκB [25]. Moreover, it had been reported that pro-inflammatory stimulation with LPS induces Ngb upregulation via NFκB [37], and growth factor PDGF protects against rotenone-induced insult in an astrocytic model by promoting NFκB activation and Ngb expression [38]. Hence, given the strong link between NFκB and Ngb, we investigated whether NFκB is involved in the dynamic regulation of Ngb expression in response to Aβ25–35 stimulation. In this study, we observed that mutations of κB2 and κB3 sites significantly inhibited Aβ25–35-induced Ngb promoter activity, and 2μM of Aβ25–35 did robustly increase the binding ability between NFκB and κB sites, but 20μM of Aβ25–35 resulted in a slight decrease of the binding. It is thus conceivable that the difference of Ngb expression by low-dose and high dose Aβ25–35 is attributed to the dynamic regulation of the binding ability between NFκB and κB sites in the promoter region of mouse Ngb gene. Of note, the binding activity of cRel to κB2 and κB3 sites has been significantly increased by 2μM of Aβ25–35. Previous studies suggested that NFκB activation is the underlying mechanism of the neuroprotective effects of low dose Aβ [39], and the fate of neurons in response to pro-apoptotic or anti-apoptotic stimuli may rely on the recruitment of different NFκB dimers [40], and the activation of cRel-containing dimers could increase the resistance of neuronal cells to glutamate, IL-1β [40] and Aβ insults [41], ischemic stroke and age-related neurodegenerative diseases [42, 43]. In agreement with previous studies, our results indicate that cRel-containing NFκB dimers-mediated Ngb upregulation might be one of the neuroprotective mechanisms elicited by low dose Aβ in the early stages of AD, whereas cRel containing NFκB dimers and Ngb expression are relatively decreased by high neurotoxic dose of Aβ in the severe stages, and therefore result in neuronal cell death.
Suppression of endogenous Ngb expression by specific siRNA exacerbates Aβ25–35-induced neurotoxicity, implying that reduced Ngb expression may increase neuron susceptibility to AD. By analyzing single nucleotide polymorphisms (SNPs) of Ngb gene in AD patients, a previous study reported that there is strong genetic linkage of Ngb to AD, and the carriers of the risk allele with low Ngb expression have increased risk for AD [22]. As Ngb expression is significantly decreased from early moderately advanced stage to severe stage of AD [23], prolonged or upregulated Ngb expression by pharmacological Ngb activators might be beneficial for delaying neuronal degeneration during AD development. Moreover, experimental investigation have suggested that some Ngb activators such as formononetin [27] and 17β-estradiol [44, 45] might have therapeutic potential for AD. Therefore, screening and identification of more potent Ngb activators may facilitate the development of the new therapeutics for AD.
Mitochondrial dysfunction has been reported to be closely linked to the pathogenesis of AD [46], although the specific mechanisms resulting in mitochondrial dysfunction in AD remain largely unknown. A substantial body of evidence indicated that Aβ promotes mitochondrial dysfunction by increasing mitochondrial structural abnormalities and ROS generation, reducing ATP production, and disrupting ΔΨm [47]. Our previous studies found that elevated Ngb expression is associated with preserved mitochondrial function in primary mouse cortical neurons after OGD [19–21], implying that Ngb may also protect against Aβ-induced mitochondrial dysfunction. As expected, our results showed that suppression of endogenous Ngb expression worsens low dose Aβ25–35-induced decrease in ΔΨm and ATP production. Additionally, the mitochondrial complex III activity was significantly elevated in the groups of 5μM of Aβ25–35 and Aβ25–35 plus Ngb siRNA, which is consistent with our recent study that Ngb overexpression significantly attenuated OGD-induced upregulation of mitochondrial complex III activity and ROS generation [21]. These data strongly suggest that Ngb might function as a key endogenous neuroprotectant for AD by preserving neuronal mitochondrial function. Although present experimental findings strongly suggested the involvement of Ngb in AD [23, 24], the underlying mechanisms remain to be fully defined in the future. Moreover, the expression and pathological role of Ngb in AD will be tested and validated in AD animal models in next step.
In summary, in this study we found that Ngb was dynamically regulated by Aβ25–35 in cultured neurons, which was mediated by NFκB and its binding sites κB2 and κB3 in Ngb promoter, and endogenous Ngb expression functions in protection against Aβ25–35-induced neurotoxicity. Further experimental investigations to define roles and underlying molecular mechanisms of Aβ peptide in Ngb gene expression and neurobiological function might help in development of new intervention strategy of AD.
Footnotes
ACKNOWLEDGMENTS
This work was supported in part by the China Natural Science Foundation (81601122), Hunan Natural Science Foundation (2017JJ3205), the Cooperative Innovation Center of Engineering and New Products for Developmental Biology of Hunan Province, the 973 Project of the Ministry of Science and Technology of China (No. 2010CB529900), Hunan Provincial Department of health (2016044), and AHA FDA Winter 2015 Scientist Development Grant (15SDG25550035).