



Abstract
Background:
Studies on subjective cognitive impairment (SCI) and neural activation report controversial results.
Objective:
To evaluate the ability to disentangle the differences of visual N170 ERP, generated by facial stimuli (Anger & Fear) as well as the cognitive deterioration of SCI, mild cognitive impairment (MCI), and Alzheimer’s disease (AD) compared to healthy controls (HC).
Method:
57 people took part in this study. Images corresponding to facial stimuli of “Anger” and “Fear” were presented to 12 HC, 14 SCI, 17 MCI and 14 AD participants. EEG data were recorded by using a HD-EEG HydroCel with 256 channels.
Results:
Results showed that the amplitude of N170 can contribute in distinguishing the SCI group, since statistically significant differences were observed with the HC (p < 0.05) and the MCI group from HC (p < 0.001), as well as AD from HC (p = 0.05) during the processing of facial stimuli. Noticeable differences were also observed in the topographic distribution of the N170 amplitude, while localization analysis by using sLORETA images confirmed the activation of superior, middle-temporal, and frontal lobe brain regions. Finally, in the case of “Fear”, SCI and HC demonstrated increased activation in the orbital and inferior frontal gyrus, respectively, MCI in the inferior temporal gyrus, and AD in the lingual gyrus.
Conclusion:
These preliminary findings suggest that the amplitude of N170 elicited after negative facial stimuli could be modulated by the decline related to pathological cognitive aging and can contribute in distinguishing HC from SCI, MCI, and AD.
Keywords
INTRODUCTION
While people age, few people are those who experience decay on cognitive functions that extends beyond what is considered healthy aging, yet not exhibiting dementia. This transitional cognitive state has been characterized as mild cognitive impairment (MCI) [1]. However, a subjective awareness of memory loss by the elderly in the absence of any organic or identifiable condition by neuropsychological examination is called subjective cognitive impairment (SCI) [2]. This state is known to cause memory disturbance and has great value as a preliminary stage of MCI [3] and as a predictor of dementia [4]. The endeavor to detect the very early signs of dementia with the possibility of developing interventions to slow its progression has provided the impetus for increased interest in SCI. What do we know about the brain function and emotional processing of people with SCI? How is the brain responsiveness of people who have just started to be aware of their memory loss? These were the questions that triggered our research interest and this study comes to present some preliminary pieces of evidence regarding people with SCI and their brain functionality, as well as provide insights into the processing of negative facial stimuli [5, 6] in the early stages of Alzheimer’s disease (AD).
Until today, the prognostic value of the SCI condition is a controversial issue [7–9]. In population-based studies, including both cognitively normal subjects and those with probable cognitive impairment, the prevalence of SCI ranges from 10% to 81% [9, 10]. Several longitudinal population-based studies of SCI in older adults without dementia have reported an association with future cognitive decline [11–13], dementia [14–19], AD [20, 21], depression [22], and AD pathology at autopsy [23]. However, a variety of studies have demonstrated a relationship between SCI and putative AD biomarker evidence, such as gray matter volume loss [20, 24], cerebral hypometabolism [7], amyloid accumulation [25, 26], brain activation on functional imaging [27, 28], volume reduction of cortex [20], cerebrospinal fluid biological markers [29], and genetic risk for AD [30]. Clinic-based studies of similar groups have reported that, compared to healthy controls, SCI exhibit smaller volumes of left and right hippocampus [31], entorhinal cortex [20], and posterior callosal [15], reduced frontoparietal, parahippocampal, medial temporal and grey matter density [32], as well as reduced metabolism of parahippocampal region [33]. On the other hand, it has been suggested that SCI, at the stage of preclinical AD, may indicate initial cognitive declines that are otherwise undetectable with standardized objective tests of cognitive performance [34]. Since the earliest stages of cognitive impairment related to AD pathophysiology are hardly distinguishable from changes due to “normal aging”, it is important to seek and investigate the neurophysiological, psychological, and cognitive decline of populations that are still considered to be in the expected cognitive level, based on their age and education. This will allow us to gain better knowledge about the dementia process and its potential correlation with changes or abnormalities in brain functionality.
Facial emotional processing [6, 36] is considered an important cognitive function that is commonly affected in people with cognitive impairment and other neuropsychiatric conditions [6, 37–42]. A deficit in the perception of negative emotions of a facial stimulus, specifically of anger, sadness, and fear, has been found in elderly people [43–45] and has been associated with the deterioration of the frontal and temporal lobes, including the amygdala [43, 46]. Results from neuroimaging studies propose that, in parallel with the development of lesions in the hippocampal area, the amygdala undergoes early atrophy in AD [47–49], which raises several questions about the impaired mechanisms of facial emotion recognition in dementia as well as its early cognitive stages. In all cases, the use of neuroimaging techniques becomes necessary for finding evidence of cognitive impairment, which are impossible to be detected with other methods.
Event-related potentials (ERPs) elicited in response to some stimulus are considered reliable biomarkers of cognitive operations and have been proven sensitive to the functional changes occurring in AD, MCI, and neurodegeneration in general. More specifically, N170 is the earliest and most studied ERP, while it is widely regarded as face-sensitive because its amplitude is elicited particularly at occipito-temporal electrodes, between 140 and 200 ms after trigger of facial stimulus [50, 51]. Modulations of N170 amplitude by facial expressions have been extensively reported in the literature [52–54] suggesting that the activity during this time period can index the discrimination of facial expressions. N170 is considered to represent multiple sources of neural activity [55–57] but predominately represents the integration of face or object features into a meaningful percept, including the spatial configuration of features (i.e., configural processing) [50] and discrimination of individual face identities [58]. The N170 component is selective and sensitive to facial stimuli and has been found to have an enlarged negativity over occipito-temporal electrode sites with positive dominance over frontocentral areas after negative facial stimuli [59–62], while recent neuroimaging studies have also found increased activation in disgusted, sad, and fearful faces in the left lingual gyrus [62–64]. In a broader sense, temporal pole binds complex, highly processed perceptual inputs to facial response. Negative stimuli such as “Anger” and “Fear” have typically subsumed under the singular concept of negative, potentially threatening affect, mostly studied in comparison to neutral or positive stimuli and not between each other [40, 65]. Since the majority of the studies, which have deployed other stimuli than fearful and angry expressions, have found that greater negativities with regards to the ERP components (e.g., N170) were obtained with negative rather than happy and neutral expressions irrespective of task demands [39, 66–68], recent studies have been focused solely on negative stimuli to capture any cognitive and aging changes [59, 70–78]. These pieces of evidence demonstrate different processing of negative stimuli during the presentation of faces, which might contribute to previously reported deficits in facial emotion recognition [38, 80]. In addition, the temporal evolution of distinct emotions is a crucial component, and it should be taken into account in “emotion facial processing” research. To this end, in order to study the effect of N170 on specific brain source localization fields, an additional means of visual inspection is used, standardized low-resolution brain electromagnetic tomography (sLORETA), that refers to a functional imaging technique capable of solving the inverse problem of electroencephalography (EEG), i.e., modeling 3D distributions of the cortical source patterns generating from scalp EEG data [81]. The use of N170 and sLORETA is further motivated by the fact that many studies suggested that face perception difficulties might be caused by age-related and cognitive impairments on higher-level perceptual processes, such as reduced sensory processing speed [82], reduced attention/working memory capacity [83], impaired prefrontal inhibitory control [84], and reduced cognitive flexibility as evidenced by a general reduction in task switching performance [85]. Thus, there may be an optimal timeframe in which SCI will contribute to our ability in identifying individuals at-risk for cognitive decline and eventual MCI and AD, but the role of SCI in the early detection of AD remains to be fully elucidated.
In contrast to the literature available on elders with cognitive impairment, the body of evidence regarding facial processing with brain maturation in SCI is still limited, almost absent especially where N170 ERP and sLORETA is concerned. Since recent studies [35, 40] have indicated that cognitively impaired people have shown impaired recognition effects for negative faces on the amplitudes of N170, suggesting deficient memory-related processing of negative faces at the stage of structural encoding and during an early recognition stage at which faces are individuated, we choose to select only negative facial stimuli to test our hypothesis, taking into consideration that our results may not be utilized in neutral or positive emotional stimuli. The purpose of this study is to determine whether specific brain regions, which have been found to be highly activated after negative facial stimulus, are also activated in different groups of subjects with cognitive impairment and healthy controls. More specifically, we examine the modulations evoked by facial stimuli to healthy controls (HC), SCI, MCI and AD on the N170 component during the explicit and implicit processing of negative facial stimulus (“Anger” and “Fear”). The face-selective N170 component characteristics were used to constrain brain localization, having in mind that a neurophysiologic marker evoked by facial stimuli will reflect differences in the intensity of responses in brain regions specifically devoted to the decoding of “Anger” or “Fear” faces. Moreover, the brain source localization of N170 is identified for each facial stimulus along with the alterations induced by the participants. Our focus was to find any potential differences of brain activity as revealed by N170 amplitude and latency among the four groups in grounds of facial processing, which is considered as an important cognitive function, commonly affected in people with cognitive impairment and whether a possible correlation between well-established neuropsychological tests would be existed. Therefore, we deployed well-established neuropsychological tests to determine the differences among groups, as well as to identify which cognitive functions are highly-correlated with N170 values. Our expectation is that any cognitive impairment affecting the facial processing related to perception would be reflected on modulations (in amplitude and latency) of N170 ERP. A second aim of this study was to determine whether specific brain regions are being activated after the presentation of the stimulus, motivating the use of sLORETA and Topographic Distribution analysis to investigate potential differences among groups, which provides evidence about the degeneration of multiple functional neural circuits supporting subsequent deterioration of emotional processing in people with SCI, MCI, and AD.
In our previous study, we have also explored the elicitation on N170 ERP component as recorder in T6 (P8) by using a HD-EEG (EGI GES 300) among young and elder female [59]. The delay of the N170 peak and the augmentation of its amplitude reflect the difficulty in computing spatial relations among face features and understand the different negative emotions of facial expressions [86]. However, an alternative account for these effects can be offered by relating the N170 component to a face-detection mechanism. A recent study reported a larger amplitude of N170 in elderly adults with cognitive impairment which has not been previously detected, posing that the underlying cognitive mechanism (early perceptual processing) is deteriorated in these participants [87]. Their results suggest that N170 is modulated by the decline associated to pathological cognitive aging, particularly to the processes related to AD. Moreover, advanced EEG analysis of our previous studies in MCI and AD subjects has shown significant correlations with signs of neurodegeneration [88, 89]. We have demonstrated that P300 and latencies were prolonged in MCI patients compared to HC [90–105]. Recently we have investigated also the effect of gender in bottom-up and top-down visual attention control using high-density (HD) EEG (256 channels) where higher N200 and P300 amplitudes detected for females compared to males [98]. Similarly, we employed an auditory oddball task to acquire HD EEG recordings from healthy elderly controls, MCI, and AD patients. The MMN and P300 ERP components were then extracted and their relationship with neurodegeneration was examined [106]. The results revealed a decline of both ERPs amplitude and a statistically significant prolongation of their latency as cognitive impairment advances. Finally, a recent electrophysiological study has investigated the potential of EEG features, and more specifically increased theta band, to serve as a reliable marker for the cognitive decline related to MCI and mild AD [91], however, to our knowledge, no report exist about N170 and SCI.
MATERIALS AND METHODS
Participants: Settings
From 1 September 2015 to 30 August 2016, participants were recruited from the Memory & Dementia Clinic of the 3rd Neurological Department of Aristotle University of Thessaloniki, Greece (http://www.med.auth.gr/), and from the Day Centers of the Greek Association of Alzheimer’s Disease and Related Disorders (GAADRD; http://www.alzheimer-hellas.gr/index.php/el/). Patients with AD were diagnosed by a neuropsychiatrist (MT) according to history, neurological examination, neuropsychological tests, structural magnetic resonance imaging (MRI), and other necessary laboratory examinations. The study was carried out in accordance with the Declaration of Helsinki and was approved by the GAADRD Scientific & Ethic Committee (27 November 2016). Overall, 68 participants took part in the study. Eleven individuals generated EEG data that contained excessive head or eye movement artifacts, and hence were excluded from subsequent data analysis, leaving 57 participants to be included in the study. The SCI group consisted of 14 participants (mean±SD: age = 69. 9±6.83), the MCI group consisted of 17 participants (mean±SD: age = 68.7±6.19), while the AD group consisted of 14 participants (mean±SD: age = 72.3±6.54). An additional elderly group of 12 healthy participants (HC) was also formed, spanning a similar range of ages (mean±SD: age = 65.8±2.82). Participants fulfilled the Diagnostic and Statistical Manual of Mental Disorders (DSM-V) criteria for dementia of Alzheimer type (APA, 1994) and the National Institute of Neurological and Communication Disorders and Stroke/Alzheimer’s Disease and Related Disorders Association (NINCDS-ADRDA) criteria for probable AD [107], Petersen criteria for MCI [108], and the recent NHI-AA-IWG1 [109] and IWG-2 Guidelines [110] as well as the latest SCD-I Working Group suggestions [111] for SCI. More specifically, HC and SCI were mentally and physically healthy who shared a similar age and educational background. Since there are some existing studies [112, 113], which have shown that in discrimination tasks, the amplitude is greater, with smaller corresponding latencies, in left-handed participants versus right-handers, to avoid any confounding factor, we excluded people who were left-handed. Thus, all participants were right-handed, had normal or corrected-to-normal vision and audition (effective communication between patient and clinician), and had no other neurological, psychological, or serious medical disorders. Written informed consent was obtained from all participants prior to their participation in the study.
Moreover, the identification of SCI participants further included self-perceived memory decline compared to other cognitive functions and in reference to others of the same age occurring during the past five years as determined by the individuals’ medical history and an informant report, at an age cut-off of 60. We additionally strived to exclude participants where other etiologies could explain self-perceived memory deficits including vascular (examination of ischemic lesions of MRI, blood testing), psychiatric (interview, depression scale, psychoactive drugs, etc.), or other systematic etiologies by carefully evaluating laboratory results including blood samples, structural MRI, the patient’s medical history, and additional questionnaires following the SCD-I Working Group criteria [111]. Our team of multi-disciplinary clinicians (MT, AT, IL) meticulously ensured the compliance of these criteria for every SCI, MCI, or AD participant prior to classifying them as such. Moreover, a mild clinical depression (as per pathophysiology often a comorbid condition) was considered an exclusion criterion for all SCI, MCI and AD patients provided it may be the primary cause of the cognitive deficits. Depressive symptoms were assessed with the Geriatric Depression Scale rating scale using a cut-off score of <5 at the time of the study visit. Equivalently, we have used the Perceived Stress Scale (PSS) [114] and Neuropsychiatric Inventory (NPI) [115] for the assessment of mood and emotional state, since it is a critical component for the evaluation of the SCI and MCI subjects, since emotional distress can cause or exacerbate cognitive problems. To ensure adherence to the inclusion criteria and accurate categorization of our three groups, all available data of each individual including laboratory results, neuroimaging data, the patients’ medical history, and additional questionnaires were carefully reviewed. Consequently, participants with structural abnormalities, including incidental findings such as cysts or vascular infarcts which may lead to SCI due to vascular or SCI due to psychiatric problems were also excluded from the present study. Thus, by taking all aforementioned measures, we have minimized the risk of recruiting participants with SCI due to reasons other than AD.
Inclusion criteria
Subjects were aged 60 years or older (the average age with the standard deviation for each group of study is shown in Table 1). Additional inclusion criteria for the SCI and HC subjects were to have a normal general medical, neurological, and neuropsychological examination without any chronic systemic illness, not receiving psychoactive drugs, and without a history of present or previous neurological or psychiatric disease. More specifically, criteria used for diagnosis of SCI were based also on recent studies in the same direction [13, 28]: “i) self-perceived memory deficit persistent and severe enough to seek advice from a healthcare professional; ii) memory complaint perceived as a clear decline from previous memory performance and not a lifelong or longstanding non-progressive deficit; iii) performance within normal limits for age and educational background on the neuropsychological tests; iv) absence of any physical or psychiatric illness that may be responsible for the perceived memory deficit; v) normal activities of daily living; vi) absence of MCI or dementia”.
(M) and standard deviation (SD) of demographic characteristics of participants (n = 57): healthy controls (HC, n = 12), subjective cognitive impairment (SCI, n = 14), mild cognitive impairment (MCI, n = 17), and Alzheimer’s disease (AD, n = 14)
p value indicates the statistical significant difference of demographic characteristics between groups.
Exclusion criteria
Included 1) any severe physical illness; 2) current psychiatric or neurological disorder, history of drug or alcohol abuse and use of neuro modifying drugs other than cholinesterase inhibitors or memantine in AD group; 3) having any somatic disorder that may have caused subjective or objective cognitive impairment such as a cerebrovascular accident, other neurodegenerative diseases, traumatic brain injury, brain tumor, alcohol abuse, and depression or other psychiatric disorders; 4) left handedness; or 5) being under treatment at least for 90 days before the experiment. During the neuropsychological interview, particular attention was devoted to rule out subjects reporting any symptom of severe memory problems or depressive symptoms.
Neuropsychological assessment
All participants went through a standard neuropsychological assessment, which involved a psychiatric interview, mental state examination, medical history, physical and neurological examination, as well as a detailed cognitive assessment. All subjects were assessed for the magnitude of cognitive decline at baseline, using the Global Deterioration Scale (GDS) [116] for age-associated cognitive decline and primary degenerative dementia. Those with a GDS score of 2 were considered as potential study subjects of SCI. All subjects were assessed with a standardized neuropsychological test battery. Briefly, subjects at GDS stage 1 are free of subjective complaints or objective evidence of cognitive impairment. Subjects at GDS stage 2 have subjective complaints in the absence of objectively manifested deficits. Subjects at GDS stage 3 have mildly manifest deficits consistent with a diagnosis of MCI [15]. Subjects at GDS stage 4 or greater meet DSM-V criteria for dementia. Cognitive assessment was performed by means of a neuropsychological battery designed to comprehensively evaluate attention, working memory, memory, executive functioning, and language. We also administered the Brief Cognitive Rating Scale [117], where participants with score at the scale of 2 were considered as SCI. The neuropsychological battery included the Greek version of Mini-Mental State Examination (MMSE) [118] to assess the general cognitive function, RBMT-story direct and delayed recall [119] for episodic memory, Rey Osterrieth Complex Figure Test copy and delay recall (ROCFT-copy and delayed recall) [120] which measures visuospatial long-term memory and executive functioning, Rey Auditory Verbal Learning Test (RAVLT) in order to measure the ability of learning and long-term memory, Trail Making Test part-B [121], to examine visuo-spatial ability, attention and executive functions, FAS for testing verbal fluency [122], Functional Rating Scale for Dementia (FRSSD) and Functional and Cognitive Assessment Test (FUCAS) [123] to assess daily functionality. Assessment of mood and emotional state is a critical component for the evaluation of the SCI and MCI subjects as emotional distress can cause or exacerbate cognitive problems. Therefore, the assessment of mood comprised of interview data and responses to brief self-report measures, PSS [114] and NPI [115]. Psychiatric disorder in SCI participants was excluded by a psychologist using the Structured Clinical Interview for DSM-IV Axis I Disorders Clinical Version (SCID-CV) [124]. Relevant physical illness was excluded by physical and neurological examination and appropriate investigations.
Ekman faces task design
The emotional task included the Pictures of Facial Affect (POFA; http://www.paulekman.com). The POFA collection includes 110 black and white photographs of facial expressions [125]. The facial stimuli used in the experiment were chosen from Ekman and Friesen’s Face stimuli [125]. Female and male faces with facial expressions were used, displaying 17 “Angry” and 17 “Fearful” expressions, yielding altogether 33 stimuli. More specifically, the images were randomly projected for 5 s after a 5-s black screen period, a 5-s period in which countdown frames were demonstrated and 1-s projection of a cross shape in the middle of the screen to attract the sight of the subject. This would help the participant return to the normal or neutral state from emotional excitation. The procedure of the Ekman experiment is illustrated in Fig. 1. The projection of each image was sent to the EEG acquisition system via a photocell and an audio-visual (AV) device to correctly map the brain functionality with the projection of each image. The grand average ERP waveforms of the two facial stimuli, i.e., the “Anger” and the “Fear”, along with the difference wave of the two stimuli were extracted for each group and the voltages were transformed into reference-independent values by average referencing [126]. The N170 component was defined as the highest negative peak within 140–200 ms post-stimulus at the “P8 (former T6)” [55] channel for each participant and facial stimuli.
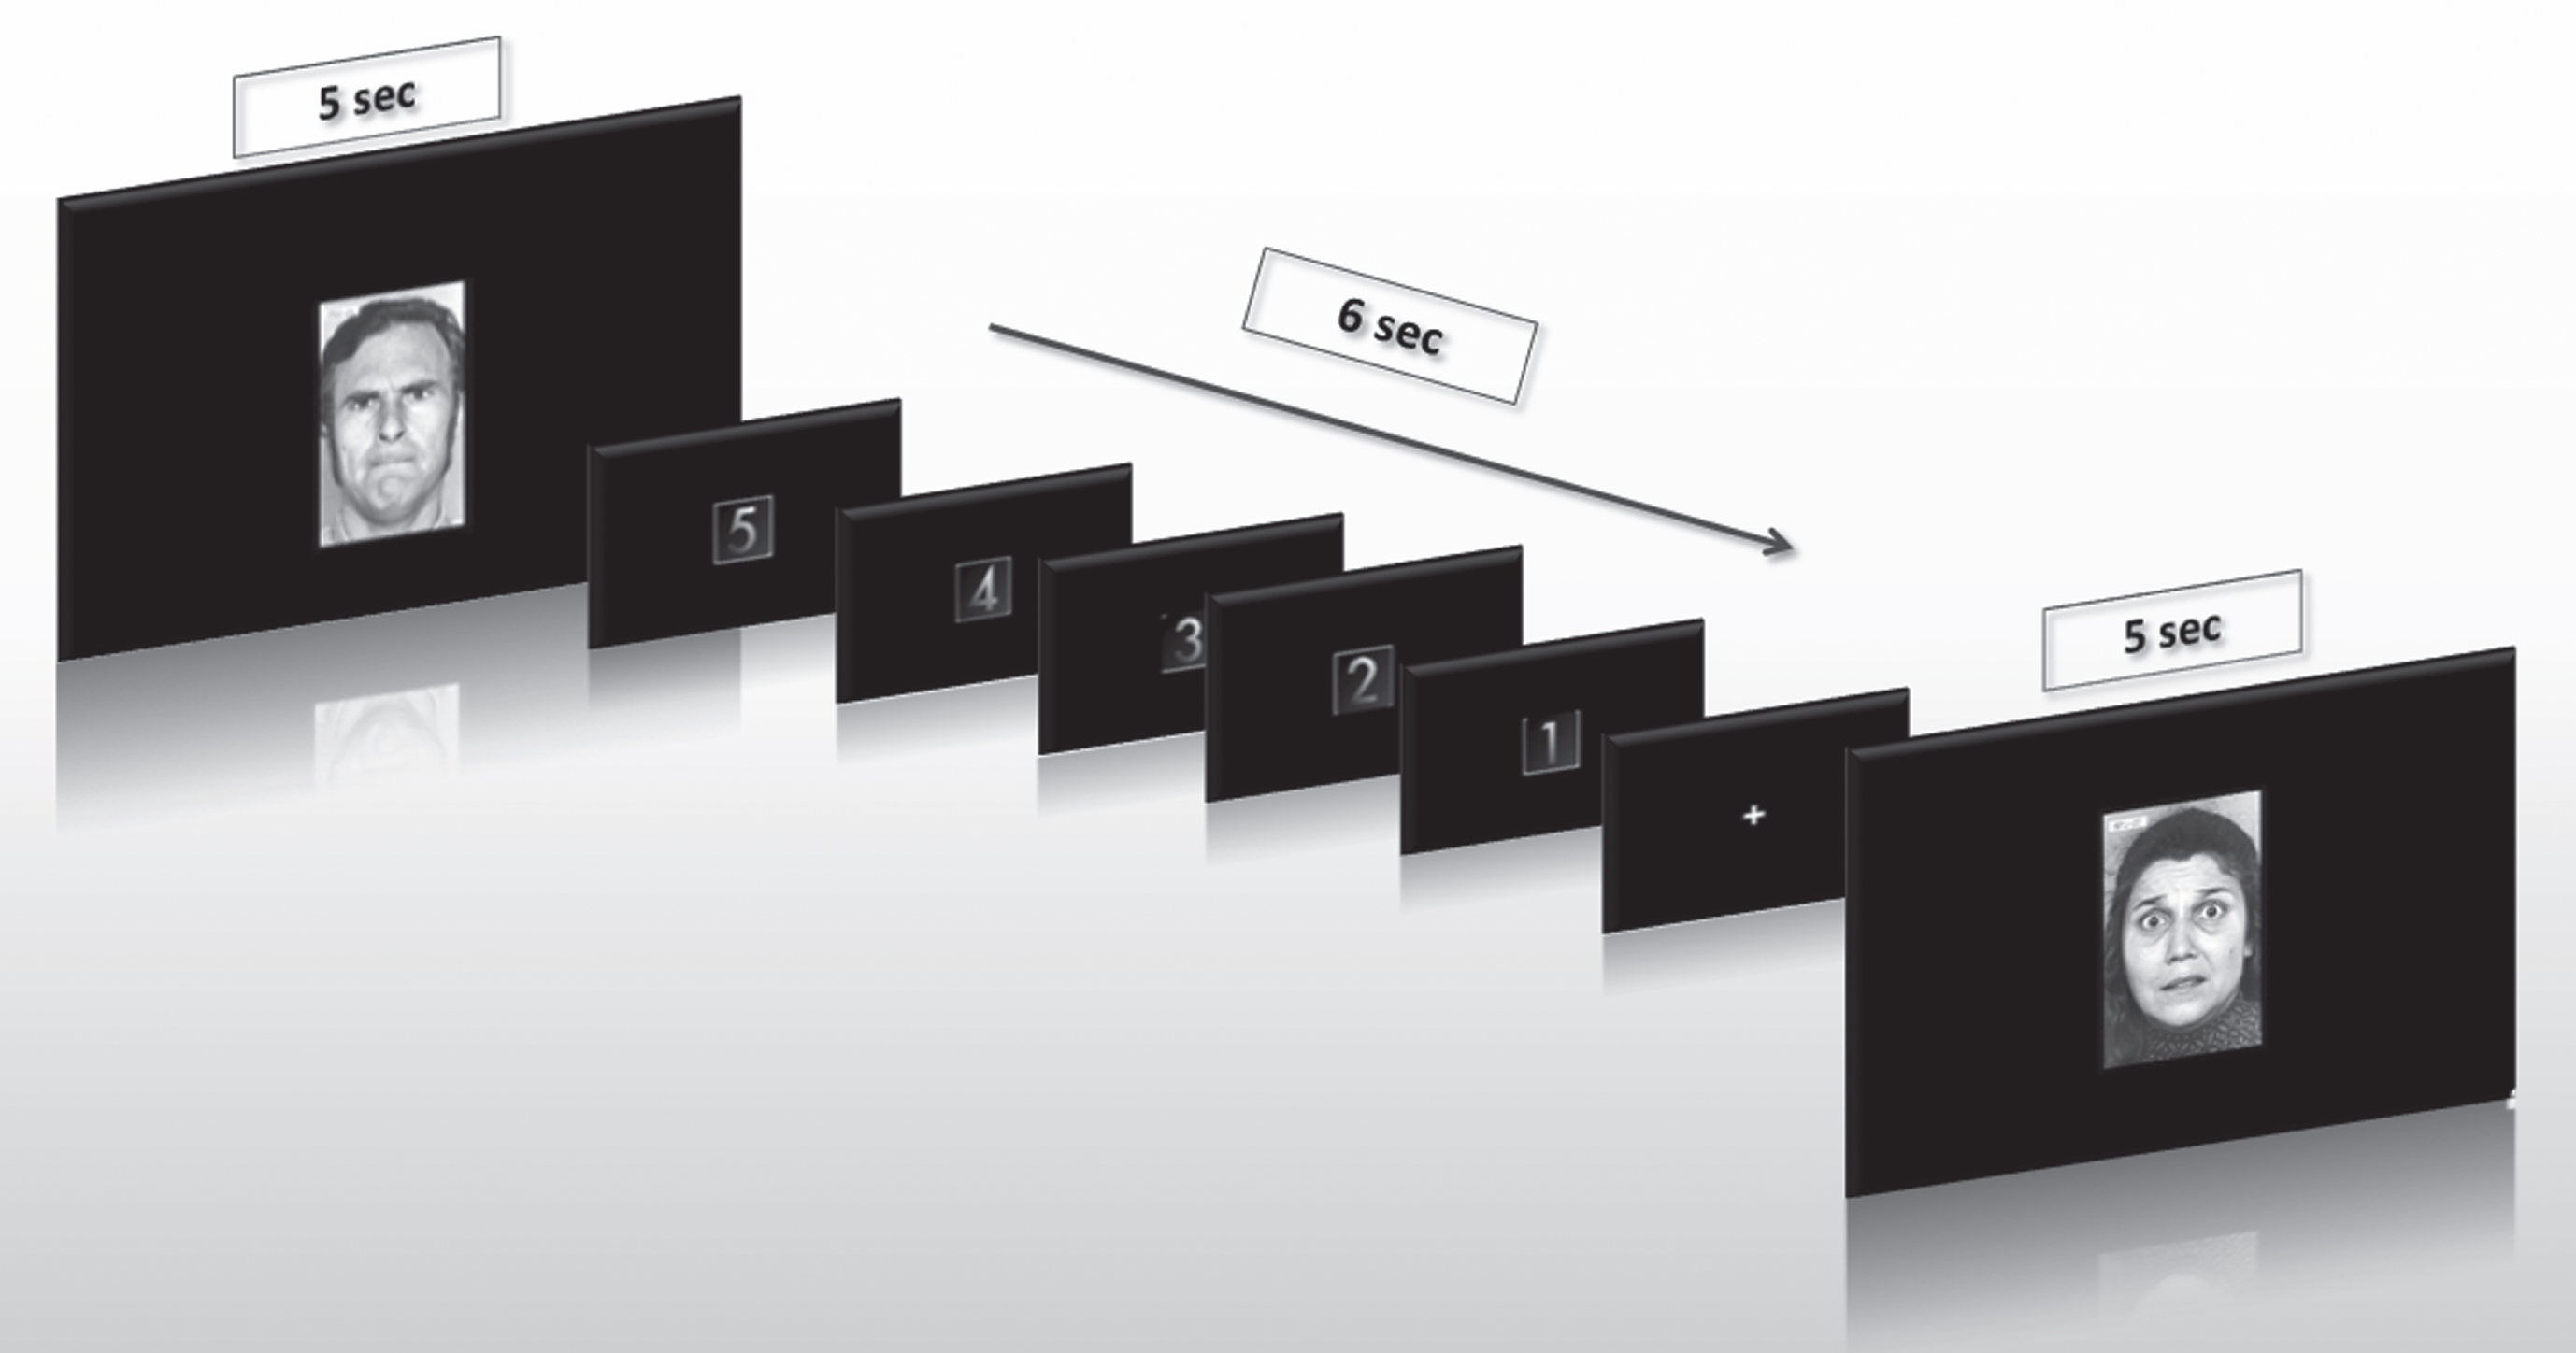
The procedure of Ekman experiment.
ERP acquisition, analysis, and experimental paradigm
Subjects were seated in a dimly lit, sound-attenuated room. A computer screen was placed at a viewing distance of approximately 50 cm. The participants were seated on a chair in a comfortable position and asked to move as little as possible. Following the preparation phase, participants were instructed about the tasks. Practice trials were presented before the main experimental task, in order to familiarize participants with the procedure. HD-EEG data were collected with the EGI 300 Geodesic EEG system (GES 300) using a 256-channel HydroCel Geodesic Sensor Net (HCGSN) and a sampling rate of 250 Hz (EGI Eugene, OR). Electrodes were positioned according to the ‘256 HCGSN adult 1.0’ montage system. HD-EEG signals were recorded relative to a vertex reference electrode (Cz) and with AFz as the ground electrode. The impedance of all electrodes was kept below 50 kΩ as recommended [127] for the high-input impedance amplifier (NetAmps 300, Electrical Geodesics, Inc. (EGI), Eugene, OR, USA). The HD-EEG data were analyzed offline using the Net Station 4.3 software (EGI). To verify the validity of the EEG signals collected in our study, in Supplementary Figure 1A-D, we provide the individual ERP waveforms at P8 for all individual subjects, with the grand average represented in bold. More specifically, we provide one butterfly diagram for each of the four subject groups and for both facial stimuli (“Anger” and “Fear”) using the same amplitude scale. It is evident from these diagrams that despite minor abnormalities that can be considered rather typical in an EEG protocol, the waveforms reveal that the recordings have been collected with the proper impendence for the electrodes resulting in meaningful EEG signals. The channel of 170 (P8, former T6) as its right-hemispheric complement was selected based on peak negative amplitude. In particular, we have chosen P8 since it has been considered the most sensitive electrode to measure N170 in response to faces and emotional stimuli according to the literature [55, 128] and our previous study [59]. Regarding the amplitude of N170 (identified as the largest negative peak within a 140–200 ms post-stimulus window), at P8 it has been proved that larger amplitudes can be obtained than that at P3 and P4 [128], PO9 and PO10 [35], and at P7 electrodes [53, 129], showing that N170 amplitude can be maximal at parietal than occipito-parietal and temporo-pariental regions and especially in right hemisphere after the presentation of facial stimulus [128], which supports the dominance of the right hemisphere after the presentation of a facial stimulus [56, 130].
The SMI Red500 (SensoMotoric Instruments) eye-tracker was used to make sure that the participants maintained their fixation on the screen. The experiment was projected on a 22” monitor and the task was developed using the Experiment Centre Software, powered by SMI. HD-EEG data were initially filtered with 5th-order bandpass butterworth IIR filter of 0.1–30 Hz and then segmented using task trigger timestamps and an epoch time of 1 s, including 200 ms pre-stimulus time. Artefact detection and bad channel replacement was performed. More specifically, after the segmentation, artefact detection was conducted with Net Station artefact detection tool, which automatically detects eye blinks and eye movements. Identification of “bad” segments was also performed, marking a segment as “bad” when the peak-to-peak amplitude was higher than 100μV. A channel was entirely marked as bad throughout recording, if it was marked bad for more than 10% of the segments. Signals from rejected (bad) electrodes were replaced using an interpolation processes provided by the ‘bad channel replacement’ algorithm (Net Station 4.3). Data were afterwards baseline-corrected using a 200 ms pre-stimulus period using the Net Station 4.3 software (EGI) and average re-referenced to transform into reference-independent values. The ERPs waveform analysis was conducted in Matlab 2016a (The Mathworks, Natick, USA), with the topographic distribution scalp maps extracted using the EEGLab library (https://sccn.ucsd.edu/eeglab/index.php).
In our study, high-density EEG recordings are utilized, and the active neuronal sources in the brain are investigated by applying the sLORETA brain source localization technique. sLORETA refers to a functional imaging technique capable of solving the inverse problem of EEG, i.e., modeling 3D distributions of the cortical source patterns generating from scalp EEG data [81]. sLORETA computes 3D linear solutions (sLORETA solutions) for the EEG inverse problem standardized with respect to instrumental and biological noise, which are mathematically defined in the original paper by Pascual- Marqui [81]. sLORETA solutions are computed within a specific model space which is made by a three-shell spherical head models including scalp, skull and brain compartments. The main problem concerning the inverse EEG solution is that the exact position of the electrodes recording brain activity on the head surface is not exactly known. Thus, in order to solve the so called “inverse problem", various parametric and non-parametric methods have been developed. Grech et al. evaluated the performance of these techniques concluding that the three dimensional source localization method [131], low resolution electromagnetic tomography (LORETA) introduced by Pascual-Marquis [132, 133] gives satisfactory results. More recently, the LORETA methods have been refined via standardized (sLORETA) [81, 134] and exact (eLORETA) [135] localization procedures. The sLORETA method has been found to give the best solution in terms of both localization error and ghost sources [131]. Given their ability to perform localization analysis, the artifact-free EEG data relative to the HC, SCI, MCI, and AD subjects can be given as input to the original sLORETA software for analyzing the cortical sources of the EEG rhythms [81] (http://www.uzh.ch/keyinst/NewLORETA/LORETA01.htm). In our experiments, the sLORETA was computed using the Geosource module of the Net Station 4.3 software.
Statistical analysis
Data analysis was performed using SPSS v24.0 for Windows (IBM Corporation, Armonk, NY, USA) statistical software. The Kolmogorov-Smirnov test was used to assess the normality assumption for continuous variables. The chi-squared test was used to test the independence between categorical variables. Comparisons between two independent groups were conducted using the Kruskal-Wallis test depending on the normality assumptions of the data, while Mann-Whitney U test was used for comparison between each group (e.g., HC and SCI). Spearman Correlation test was used to compare neuropsychological tests and ERP parameters between groups. p-values less than 0.05 were considered statistically significant. Mann Whitney U test was used with respect to age and education and no statistical difference was found between the two groups, with p = 0.615 and p = 0.253, respectively. Chi-Square analysis was used to determine gender differences and we found that there is statistical significant difference between the two gender groups (p = 0.022), which also reflects the prevalence of dementia and cognitive impairment among women. The Mann Whitney U test was also used to figure out if there was any statistical significant difference in neuropsychological tests at baseline. Post-hoc Bonferroni corrections were used for multiple comparisons (αcriticalvalue =αfamilywise (.05)/ cnumberofcomparisons (6) = 0.008) in order to avoid any false-positive result in neuropsychological performance and following classification of the participants. After the Bonferroni correction p-values less than 0.008 were considered statistically significant.
RESULTS
Comparison of neuropsychological performance between HC, SCI, MCI, and AD participants
As shown in Table 2, among the set of cognitive tests, performance of all the HC and SCI subjects was within the normal range without any clue of cognitive deterioration. On the other hand, the MCI and AD group received significantly, as Kruskal-Wallis test revealed, worse performance scores on all the items in MMSE, in the two daily functionality tests (FRSSD and FUCAS) and some of their subscales, in the three memory tests (Rey of Auditory Verbal Learning Test, Rey Osterrieth Complex Figure Test, Rivermead Behavioral Memory Test), PSS and the language FAS test. The detailed neuropsychological performance is illustrated in Table 2, where the mean and standard deviation of each group are presented. Superscripts indicate statistical significance between the groups after Mann-Whitney U test. Also, the score of each group is depicted in Fig. 2. Statistical analysis indicated that in:
Neuropsychological performance of the participants (n = 57). Means (M) and standard deviation (SD) of neuropsychological tests. Kruskal-Wallis test was used for evaluation of statistical significance between groups. Level of significance was set at p = 0.05
iDiffers from AD p < 0.05, iiDiffers from AD p < 0.001, iiiDiffers from AD p < 0.001,
*
** ***
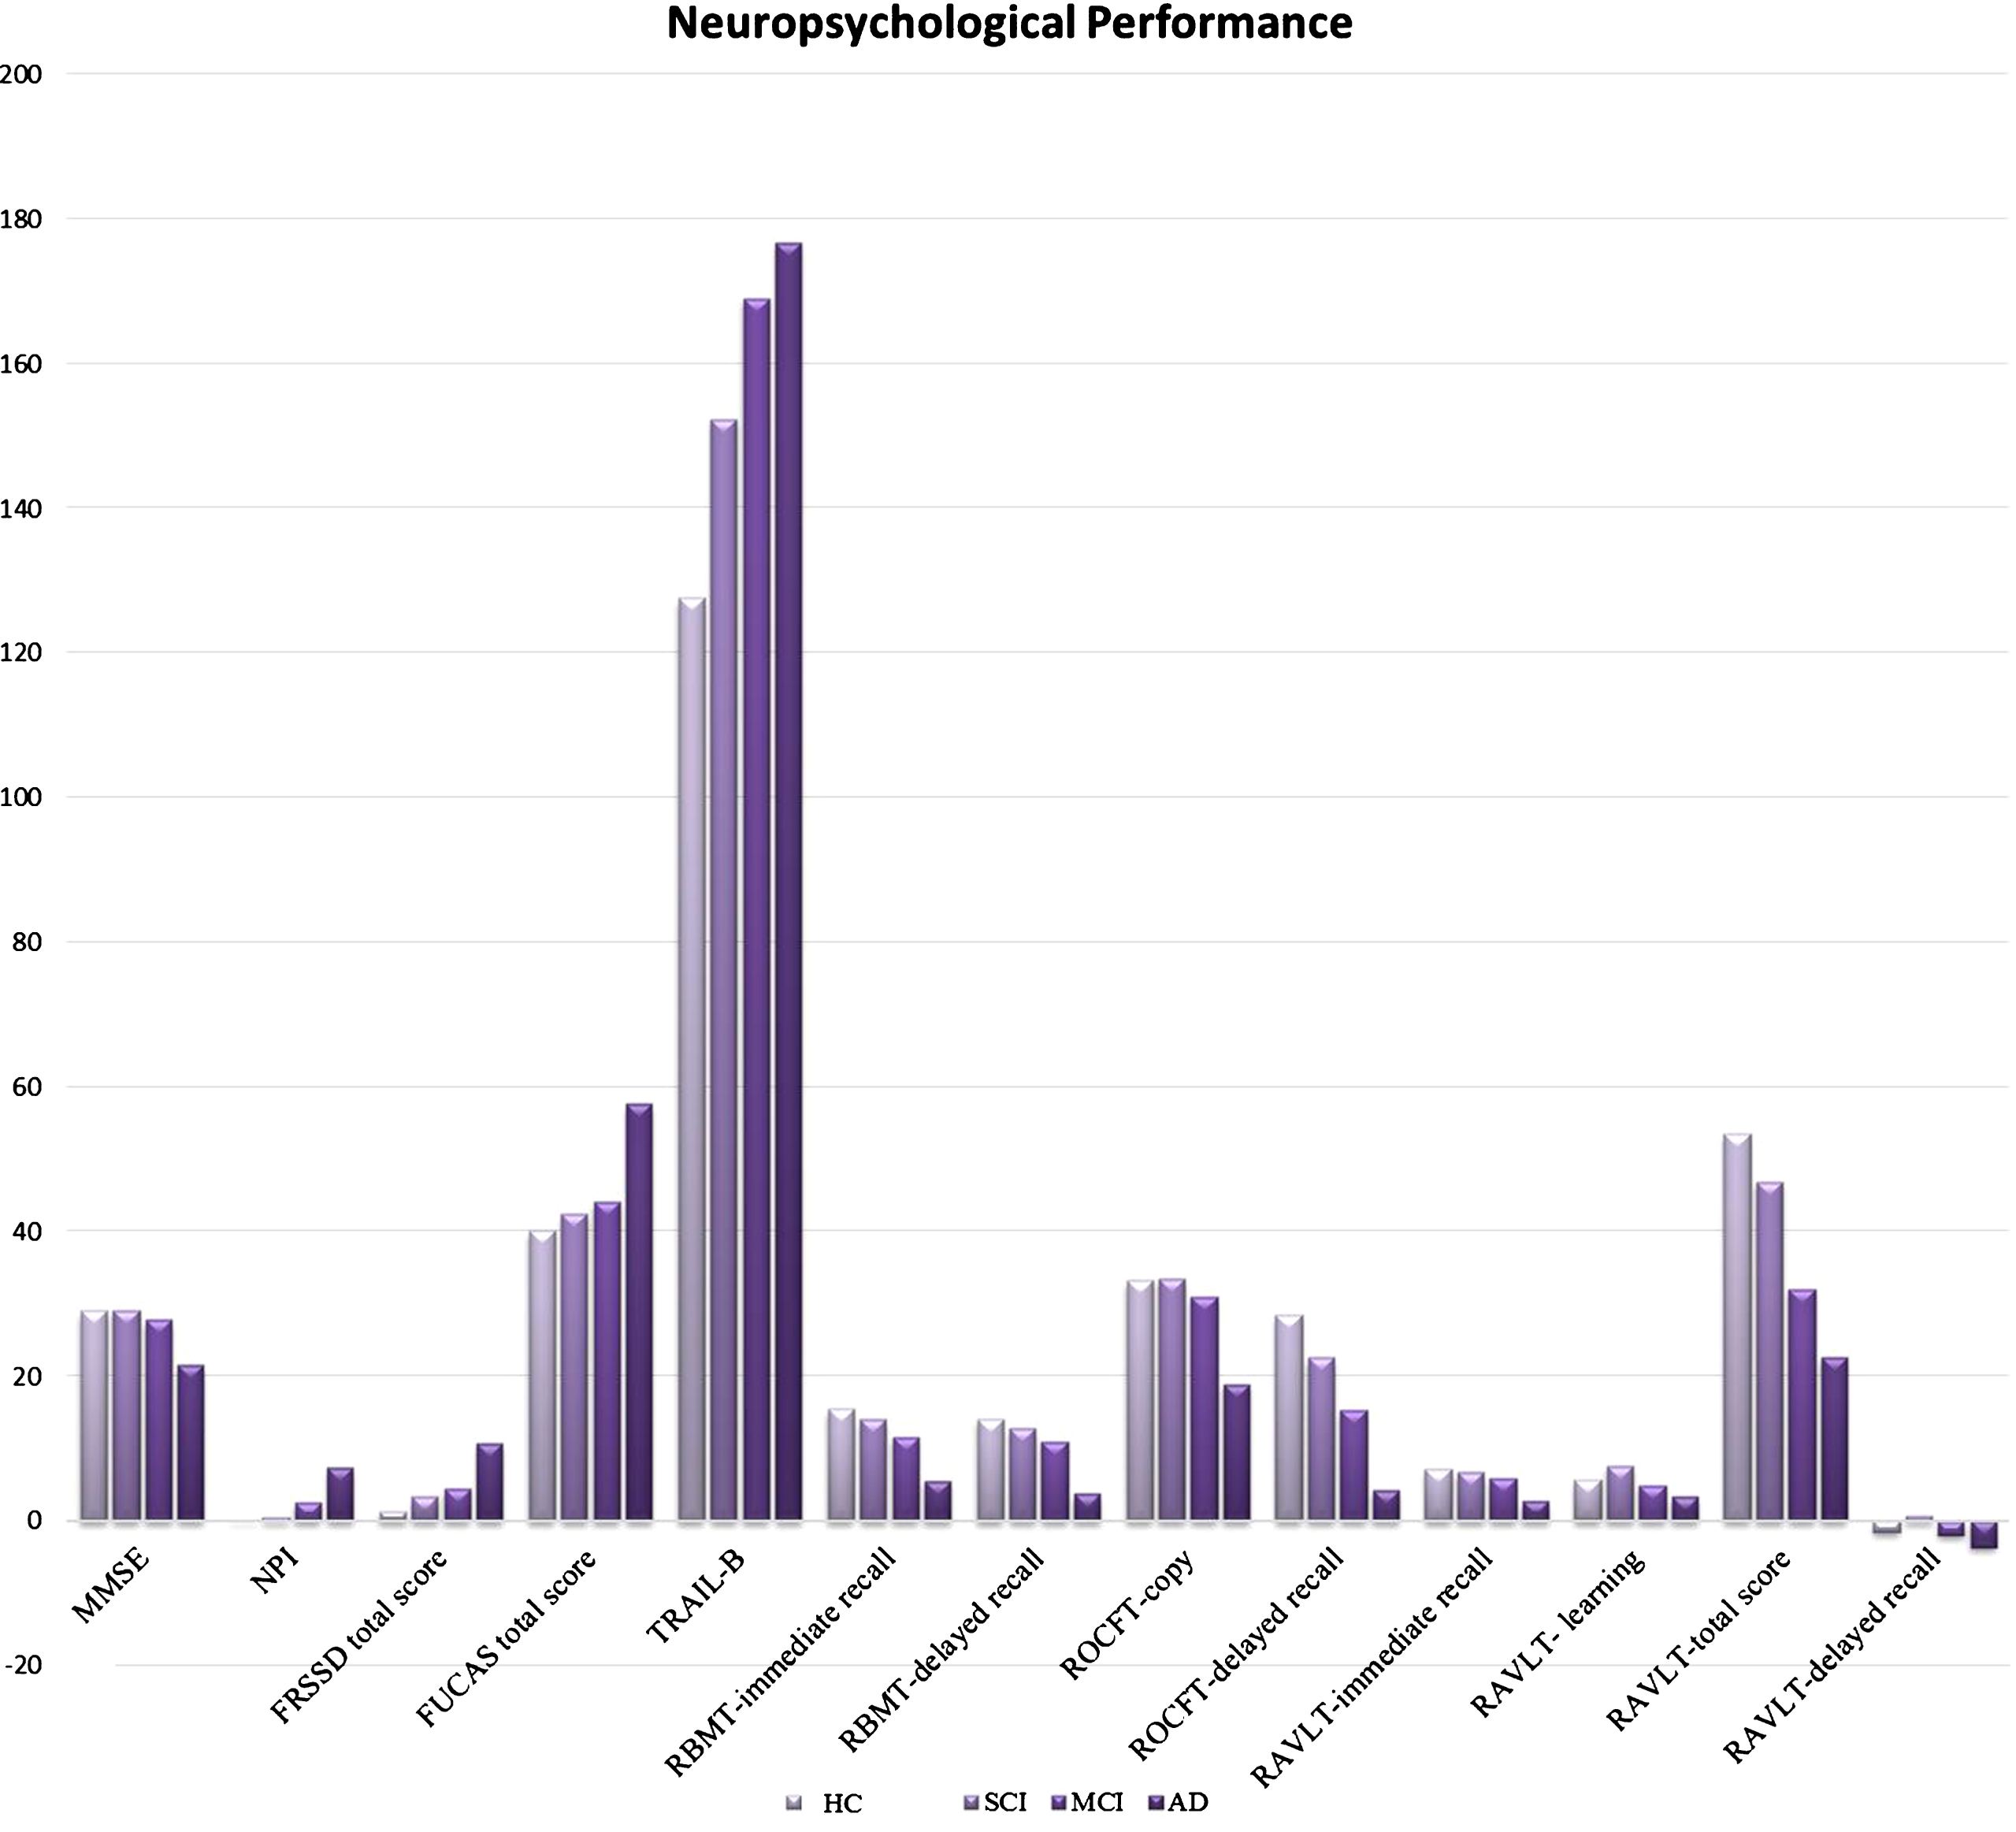
Neuropsychological performance of participants, n = 57 (HC = 12, SCI = 14, MCI = 17, AD = 14).
Global cognition
According to Mann-Whitney U test MMSE score was better for HC compared with MCI Z = – 2.66, p < 0.001, and AD group Z = – 5.56, p < 0.001. In this common vein, the SCI group also outperformed MCI Z = – 2.85, p = 0.004, and AD group Z = – 5.44, p < 0.001 in MMSE, while MCI demonstrated statistically significant better performance compared to AD Z = – 5.15, p < 0.001. Bonferroni corrected test revealed also statistical significant differences between the groups (HC versus MCI and AD, SCI versus MCI and AD, MCI versus AD) in global cognition as measured by neuropsychological tool, p’s<0.008.
Daily functionality
Mann-Whitney U test revealed that the FRSSD and FUCAS total score was better for HC than MCI Z = – 4.42, p < 0.001; Z = – 4.03, p < 0.001 and AD group Z = – 5.32, p < 0.001; Z = – 5.61, p < 0.001. Furthermore, as regards to FRSSD subscales (verbal communication, memory of faces, memory of names, memory of events, mental alertness) and FUCAS subscales (telephone, financial management, memory, accuracy, competence) statistical significant difference indicated better performance of HC compared to MCI Z = – 4.95, p < 0.001; Z = – 1.66, p = 0.03; Z = – 3.12, p = 0.002; Z = – 4.82, p < 0.001; Z = 3.59, p < 0.001; Z = – 3.30, p = 0.001; Z = – 1.94, p = 0.05; Z = – 2.47, p = 0.01; Z = – 2.88, p = 0.004; Z = – 3.98, p < 0.001, respectively. Also, HC showed better performance than MCI in some subscales of functionality tests such as FRSSD (dressing Z = – 2.25, p = 0.02; verbal communication Z = – 4.02, p = 0.001; memory of faces Z = – 4.17, p = 0.001; personal hygiene Z = – 2.55, p = 0.01; memory of names Z = – 4.21, p < 0.001; memory of events Z = – 4.87, p < 0.001; mental alertness Z = 5.26, p < 0.001; orientation Z = – 3.62, p < 0.001; social responsiveness Z = – 3.19, p = 0.001) and FUCAS (medication Z = – 5.73, p < 0.001; communication Z = – 5.59, p < 0.001; financial management Z = – 4.12, p < 0.001; memory Z = – 5.55, p < 0.001; planning Z = – 5.18, p < 0.001; time Z = – 3.85, p < 0.001; sequence Z = – 4.67, p < 0.001; accuracy Z = 5.65, p < 0.001 and competence Z = – 5.12, p < 0.001) respectively. Bonferroni corrected test revealed also statistical significant differences between the HC and MCI comparisons, as for daily functionality measurements, p’s<0.008, except the subcategory of FUCAS-memory and FRSSD-personal hygiene.
Moreover, SCI group demonstrated better performance than MCI in FRSSD Z = – 2.09, p = 0.03 and FUCAS total score Z = – 2.33, p = 0.02. Also, SCI showed better performance than MCI in some subscales of functionality tests such as FRSSD memory of events and FUCAS (communication Z = – 2.50, p = 0.01; memory Z = – 2.73, p = 0.006; accuracy Z = – 1.93, p = 0.05 and competence Z = – 2.72, p = 0.007), respectively. Also, SCI showed better performance in some subscales of functionality tests FRSSD (verbal communication Z = – 2.14, p = 0.03; memory of names Z = – 3.17, p = 0.002; memory of events Z = – 4.19, p < 0.001; mental alertness Z = – 3.05, p = 0.002; orientation Z = – 3.03, p = 0.002; social responsiveness Z = – 5.20, p < 0.001) and FUCAS (medication Z = – 5.30, p < 0.001; communication Z = – 3.37, p = 0.001; financial management Z = – 4.73, p < 0.001; transportation Z = – 5.29, p < 0.001; memory Z = – 4.99, p < 0.001; planning Z = – 3.69, p < 0.001; time Z = – 4.49, p < 0.001; sequence Z = – 5.05, p < 0.001, accuracy Z = – 3.53, p < 0.001 and competence Z = – 5.12, p < 0.001) than AD group. Finally, MCI group had greater scores than AD in FRSSD-total score Z = – 2.76, p = 0.006 and FUCAS total score Z = – 5.19, p < 0.001 as well as in the majority of subscales of FRSSD (memory of faces Z = – 3.27, p = 0.001, memory of names Z = – 2.85, p = 0.004, memory of events Z = – 2.85, p = 0.004, mental alertness Z = – 4.30, p < 0.001, orientation Z = – 3.07, p = 0.002 and social responsiveness Z = – 3.85, p < 0.001) and FUCAS (medication Z = – 5.81, p < 0.001 telephone-communication Z = – 5.08, p < 0.001; financial management Z = – 2.98, p = 0.003; transportation Z = – 4.15, p < 0.001; memory Z = – 4.78, p < 0.001; planning Z = – 5.25, p < 0.001; time Z = – 4.08, p < 0.001; sequence Z = – 4.62, p < 0.001; accuracy Z = – 4.91, p < 0.001 and competence Z = – 5.12, p < 0.001). Bonferroni corrected test revealed also statistical significant differences between SCI and MCI as for daily functionality measurements, p’s<0.008, except the total score of FUCAS and FRSSD, while as for AD and MCI no strong statistical significant comparison was found (p’s>0.008). Moreover, Bonferroni corrected test revealed statistical significant difference between AD and HC in all measurement and subscales, p’s<0.008.
Memory and executive function
HC had better scores than MCI in TRAIL-part B Z = – 2.26 p = 0.02, RBMT-immediate Z = – 2.67, p = 0.006; and delayed recall Z = – 2.46, p = 0.014, ROCFT immediate Z = – 3.35, p = 0.001 and delayed recall Z = – 2.66, p = 0.008. Also, HC had better performance than AD group in the same tests as well Z = – 4.12, p < 0.001; Z = – 4.20, p < 0.001; Z = – 3.20; p < 0.001, respectively. Moreover, SCI group had better performance in RBMT-immediate Z = – 2.78, p = 0.006 and RBMT-delayed recall Z = – 1.92, p = 0.05; ROCFT- copy Z = – 3.73, p < 0.001 and ROCFT- delayed recall Z = – 2.52, p = 0.01, RAVLT-learning and total score than MCI. In this common line, HC and SCI also outperformed AD in RBMT-immediate Z = – 4.12, p < 0.001 and Z = – 4.44, p < 0.001; and delayed recall Z = – 4.20, p < 0.001 and Z = – 4.44, p < 0.001, respectively; ROCFT- copy Z = – 3.20; p < 0.001 and Z = – 5.25, p < 0.001; and ROCFT- delayed recall Z = – 3.33, p < 0.001 and Z = – 4.66, p < 0.001, respectively. Furthermore, SCI group had better scores as far as RAVLT-learning Z = – 2.29, p = 0.02 and RAVLT-total score Z = – 2.63, p = 0.009 than MCI, while MCI had better scores in RBMT-immediate Z = – 5.28, p < 0.001 and RBMT- delayed recall Z = – 4.27, p < 0.001, ROCFT-copy Z = – 4.32, p < 0.001 and ROCFT- delayed recall Z = – 4.33, p < 0.001. Bonferroni corrected test revealed also statistical significant differences between groups of HC, SCI, MCI, and AD in memory and executive function neuropsychological tests, p’s<0.008. However, Bonferroni correction did not reveal statistical significant difference between HC and MCI in TRAIL-part B and RBMT-delayed recall, p’s > 0.008 and similar between SCI and MCI in ROCFT-delayed recall (p > 0.008), while as for AD and SCI comparison, Bonferroni corrected test revealed no statistical significant difference in RAVLT-learning (p < 0.008).
Verbal fluency-learning
HC outperformed MCI in RAVLT total score Z = – 2.66, p = 0.008, while HC had better performance in RAVLT- immediate recall Z = – 3.03, p = 0.001; RAVLT- learning Z = – 2.7, p = 0.006; total score Z = – 3.23, p < 0.001; and delayed recall Z = – 2.05, p = 0.04; and FAS Z = – 2.60, p = 0.008 than AD group. SCI also demonstrated better performance than AD in RAVLT- immediate recall Z = – 4.14, p < 0.001; RAVLT- learning Z = – 3.77, p < 0.001; RAVLT- delayed recall Z = – 3.23, p = 0.001 and RAVLT-total score Z = – 2.23, p = 0.02 and FAS Z = – 3.53, p < 0.001. Also, MCI outperformed AD in RAVLT- immediate recall Z = – 4.24, p < 0.001; RAVLT- learning Z = – 2.56, p = 0.01 and delayed recall Z = – 1.98, p = 0.04; and FAS Z = – 2.93, p = 0.003. Bonferroni corrected test revealed also statistical significant differences between groups of HC, SCI, MCI, and AD in memory and executive function neuropsychological tests, p’s<0.008. However, as for AD and MCI comparison, Bonferroni corrected test revealed statistical significant differences except in RAVLT- learning and RAVLT delayed recall (p’s>0.008).
Mood
Lower scores which indicate better performance for HC and SCI were found in NPI compared with MCI Z = – 3.48, p < 0.001 and Z = – 2.09, p = 0.03 and AD group Z = – 5.05, p < 0.001 and Z = – 4.22, p < 0.001, respectively. Also, MCI and SCI had better performance in PSS than AD group Z = – 3.01, p = 0.003 and Z = – 2.65, p = 0.008, respectively. Bonferroni corrected test revealed also statistical significant differences between the HC, SCI, MCI, and AD comparisons, as for mood measurements, p’s<0.008, except the SCI and MCI in NPI (p > 0.008). However, all groups had no clinical profile of any depressive or anxiety problems (mean scores of NPI and PSS below the cut-off scores).
Therefore, as statistical analysis revealed the four groups (HC, SCI, MCI, and AD) differed statistically significant in all neuropsychological measurements (except HC with SCI), which shows that our participants are well-differentiated in all categories (Global Cognition, Daily functionality, Memory and Executive Function and Mood), as measured by well-established neuropsychological tests. Therefore, the next following step was to seek for any potential difference between the four groups in grounds of N170 ERP component after the presentation of negative facial emotional stimuli.
Association between the neuropsychological assessment and N170 ERP component
One of the purposes of our study was to further evaluate cognitive impairment in SCI, MCI, and AD participants by using extensive neuropsychological tests and seek for any potential correlation with the amplitude of N170 as elicited after the presentation of the facial stimulus of “Anger” and “Fear”. To verify possible correlations between the neuropsychological performance and the N170 amplitude, Spearman’s correlation was used, and it was observed that in most of the tests, there was a strong correlation (p < 0.05, p < 0.01) between different cognitive functions and N170 amplitude, especially in case of Fear (Table 3). More specifically, we can see that values of cognitive performance, attention and executive functions and daily functionality decreased performance levels, were highly correlated with the values of N170 generated during the emotional processing of negative facial emotional stimuli. However, since SCI and MCI, are considered as highly affected conditions by mood and depression, specific attention was paid in the correlation of NPI and N170. More specifically, in the scatterplots illustrating the correlation between NPI and the amplitude of N170 (see Supplementary Figure 1A and B), there are only weak correlations observed.
Correlation between neuropsychological tests and N170 Amplitudes of all participants (n = 57), both for emotional condition of “Anger” and “Fear”
*
**
Comparison of N170 amplitudes and latencies among HC, SCI, MCI, and AD participants
Mean amplitude statistical analysis revealed differences among groups. The statistical evaluation of the characteristics of the N170 component among the four groups revealed significant differences in the amplitudes of the N170 component for both types of facial stimuli, whereas the differences on latencies for the two facial emotional conditions from P8 were not statistically significant. The grand average of N170 amplitude collected from P8 (T6) electrode for both facial stimuli (“Anger” and “Fear”) are presented in Fig. 3, after having been smoothed using Matlab’s polyfit function (https://www.mathworks.com/help/matlab/ref/polyfit.html) to make their differences more evident and allow to visually inspect whether the statistical properties of each group are sufficient to support the creation of a biomarker (the same curves prior to applying the polyfit function can be found in the Supplementary Figure 2). More specifically, Mann-Whitney analysis showed that N170 amplitude in case of “Fear” can discriminate SCI from HC, which is currently not possible with neuropsychological tests. In the following, the mean values of the N170 amplitudes and latencies are presented and the significance of the differences is measured using a non-parametric Mann-Whitney U-test, which compares the different groups in pairs.
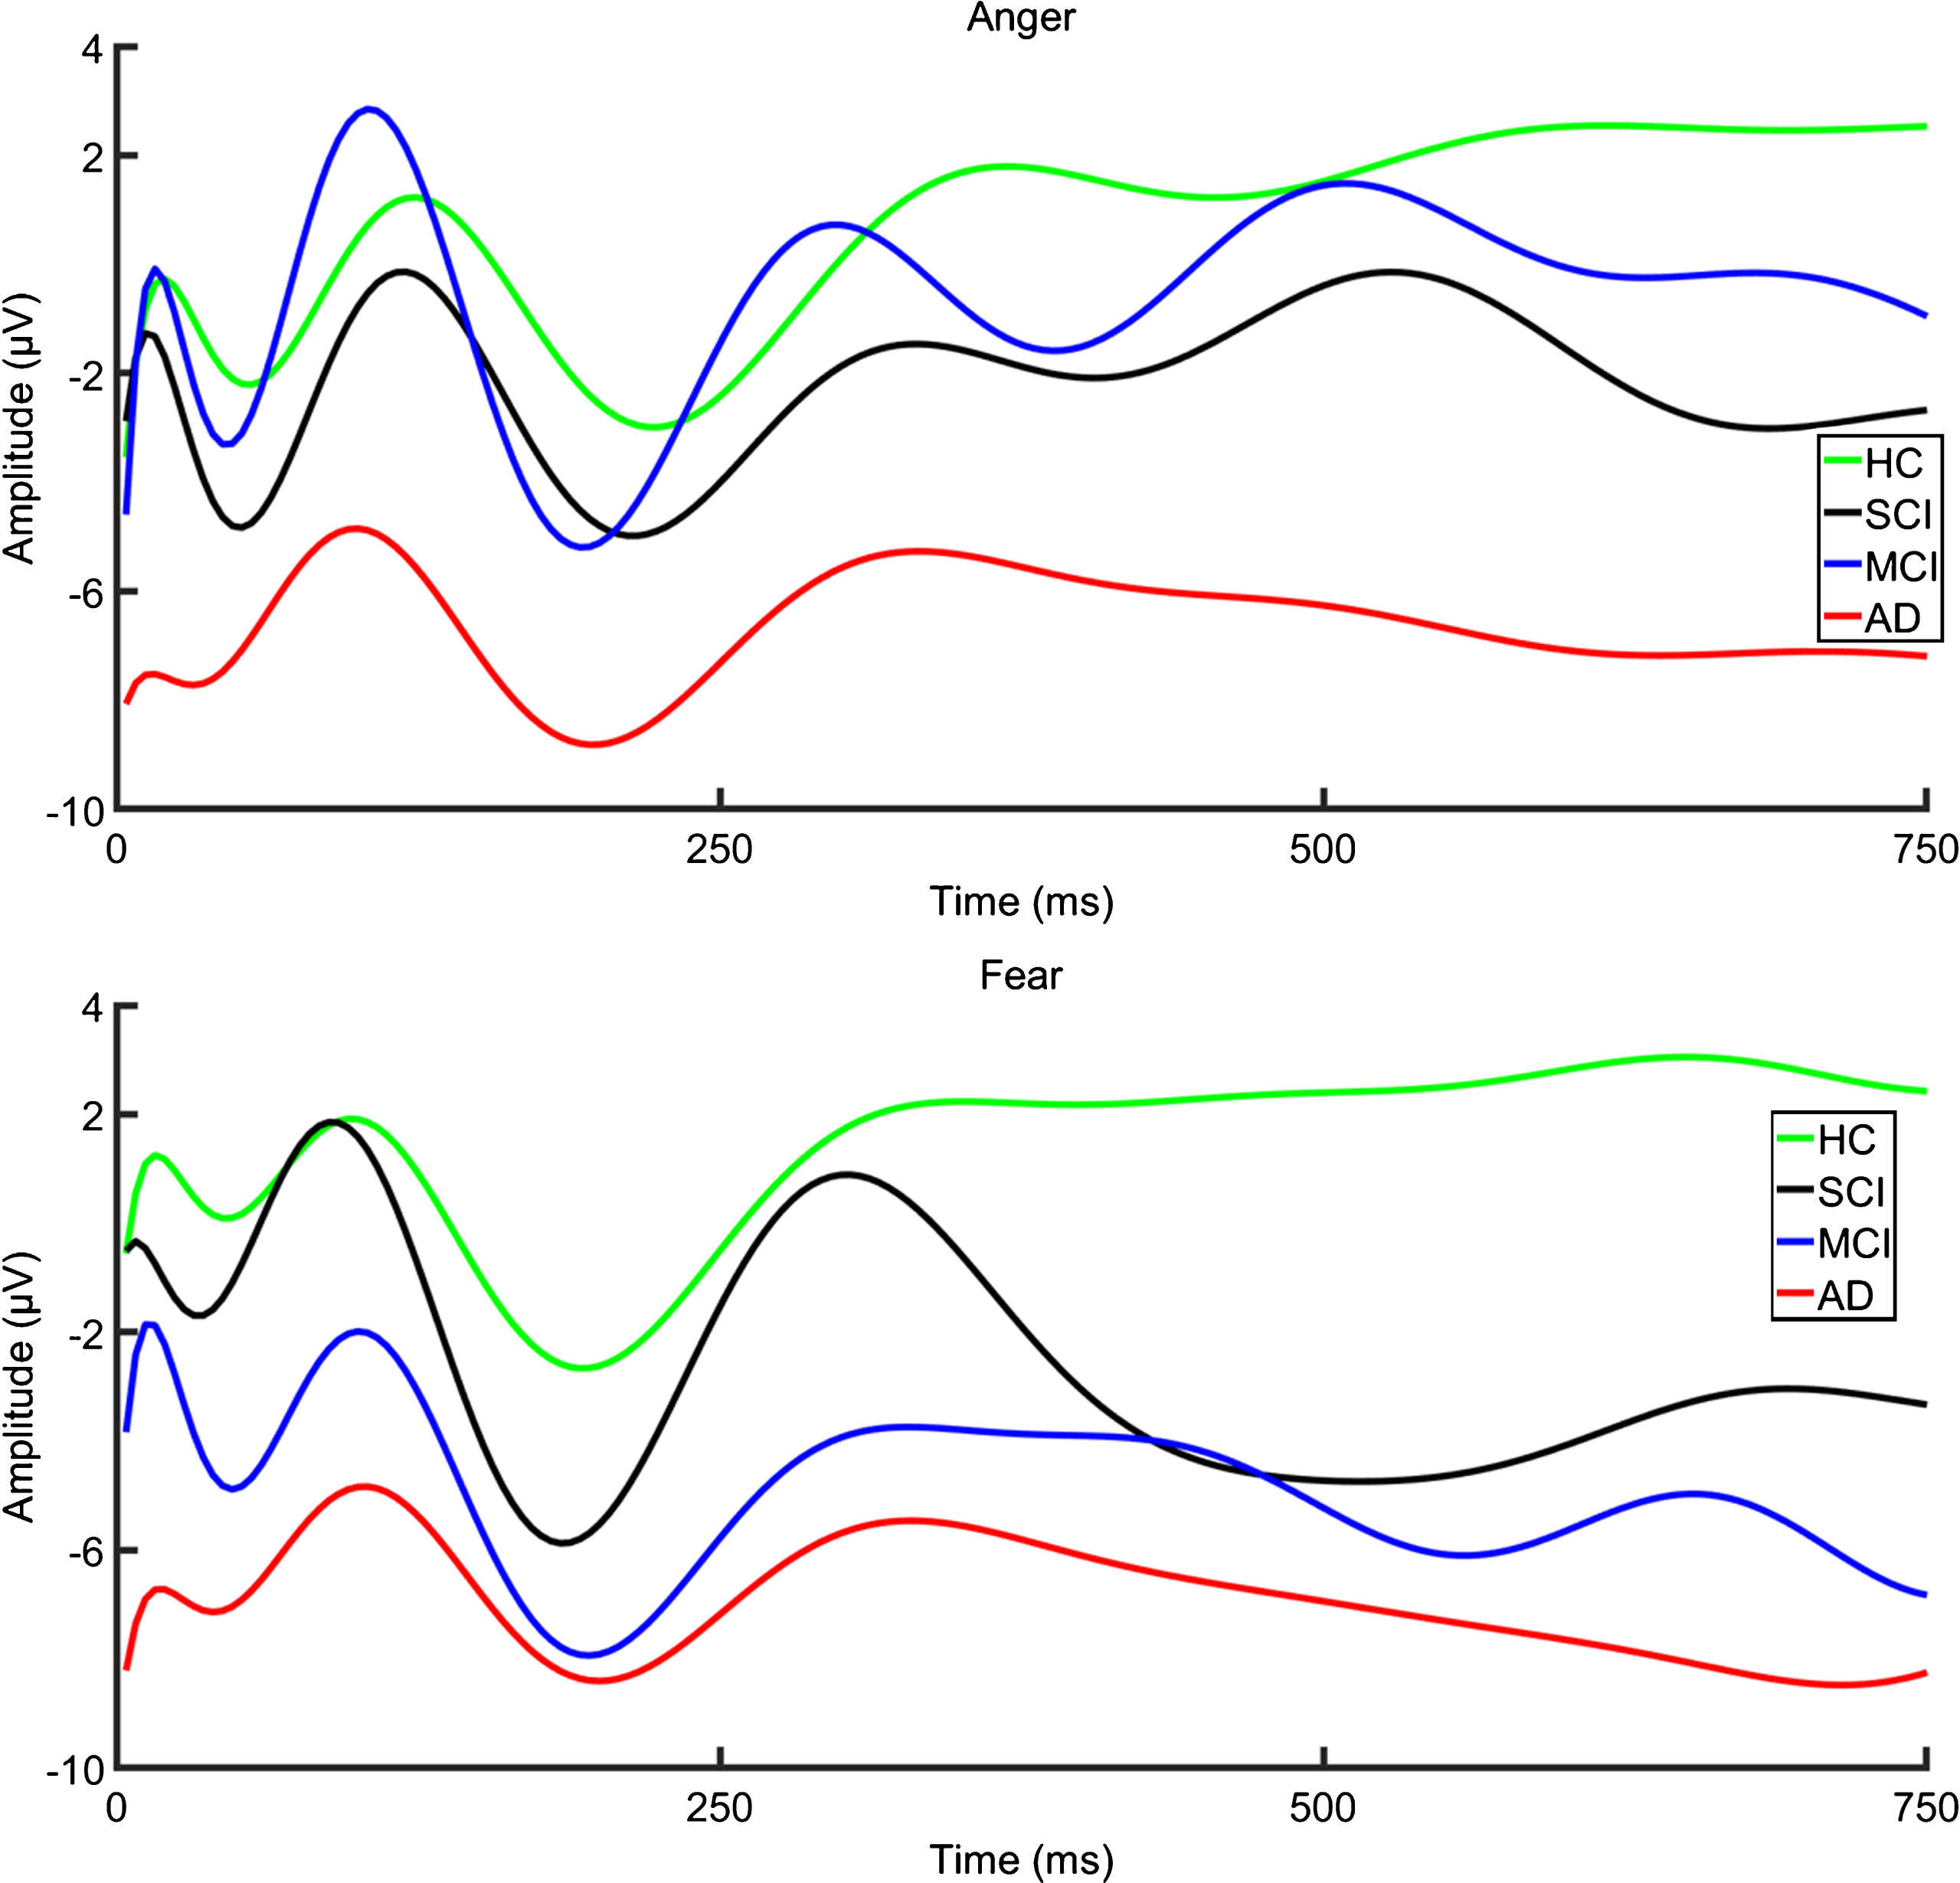
Grand averages ERPs evoked for “Anger” (upper) and “Fear” (lower) at P8 electrode showing N170 for all participants (HC = 12, SCI = 14, MCI = 17, AD = 14). The x axis shows the time in milliseconds (ms) and the y axis the amplitude of ERPs represented in μV. Moreover, the curves have been smoothed using Matlab’s polyfit function to make their differences more evident.
HC versus SCI
Regarding the N170 amplitude as recorded from P8, for the facial stimuli of “Anger”, SCI group elicited larger (– 4.99μV) amplitude than HC group (– 3.35μV), Z = – 1.64, with p = 0.10 that indicates no statistical significance. In addition, fear faces, as recorded from the same electrode, elicited also larger N170 amplitudes for SCI (– 5.81μV) than HC group (– 2.63μV), respectively, with statistical significant difference, Z = – 2.16, p = 0.03. Nevertheless, the N170 latencies both in the facial stimuli of “Anger” and “Fear” for SCI and HC group were not significantly different, which indicates that similar performance was noticed for both groups.
HC versus MCI
The N170 amplitude, for the emotional condition of “Anger”, in the MCI group (– 6.82μV) was larger than in the HC group (– 0.23μV) Z = – 4.40, p < 0.001, with statistical significant difference. Moreover, in case of “Fear”, recordings from P8 elicited larger N170 amplitudes with statistical significant difference for MCI (– 8.22μV) than HC (– 0.34μV), Z = – 4.65, p < 0.001. On the other hand, the N170 latencies for both emotional conditions were not statistical significant between groups.
HC versus AD
In this common vein, the N170 amplitude in case of “Anger” as recorded from P8 in the AD group (– 8.80μV) was much larger than in the HC group (– 3.35μV) Z = – 1.6, p = 0.11, with a trend to statistical significant difference. However, in case of “Fear” larger N170 amplitude for AD (– 8.37μV) than HC group (– 2.63μV) with statistical significant difference, Z = – 2.11, p = 0.03 was found. Moreover, the N170 latency, as recorded in both emotional conditions of “Anger” and “Fear”, was longer for AD (160.58 ms) and (159.51 ms) than HC group (156.64 ms) and (154.27 ms), respectively, however there was no statistical significant difference, Z = – 0.95, p = 0.34 and Z = – 1.11, p = 0.29, respectively.
MCI versus SCI
Regarding the emotional condition of “Anger”, the N170 amplitude of MCI group (– 5.18μV) was almost equivalent to SCI group (– 4.99μV) without statistical significant difference, Z = – 0.12, p = 0.91. As far as “Fear” condition is concerned, although MCI had larger amplitude (– 7.97μV) than SCI (– 5.81μV), Z = – 1.35, p = 0.17, no statistical significant difference was found. As far as N170 latencies for both emotional cases (“Anger” and “Fear”), although longer for MCI in case of “Fear”, no statistical significant difference was detected.
SCI versus AD
Data recorded from P8 electrode showed that although AD elicited larger N170 amplitude both for “Anger” (– 8.80μV) and “Fear” (– 8.37μV) than SCI (– 4.99μV) and (– 5.81μV), Z = – 1.12, p = 0.26 and Z = – 0.87, p = 0.38, respectively, no statistical significant difference was found. In addition, although longer latencies were observed in AD group for both emotional conditions, the N170 latency both for “Anger” and “Fear” for AD and SCI group were not statistical significant.
MCI versus AD
In case of “Anger” as recorded from P8, larger N170 amplitude observed in AD (– 8.80μV) than MCI (– 5.18μV), Z = – 1.19, p = 0.23 but not statistical significant difference was found. Moreover, as for “Fear” although N170 amplitude was larger in the AD group (– 8.37μV) than in the MCI group (– 7.97μV), Z = – 0.15, p = 0.88, there was no statistical significant difference. Similarly, latencies both for “Anger” and “Fear” had no statistical significance between AD and MCI, although greater latency was detected in AD.
In summary, the analyses revealed that: 1) in all groups faces elicited larger N170 amplitudes for the most cognitive impaired participants, 2) SCI had statistically significant larger amplitudes compared to HC; and 3) finally, Mann-Whitney U-test test revealed that although the N170 amplitudes were larger for the most cognitively impaired than for the HC participants in response to both “Anger” and “Fear”, the difference was more significant in the case of “Fear” (Table 3).
Receiver-operating characteristics (ROC) curves by type of diagnosis: Sensitivity and specificity of N170 component
In the previous section, we have compared the amplitudes and latencies among SCI, MCI, AD, and HC participants with the intention to verify whether the different groups can be distinguished based on the statistical properties of the elicited ERPs. In this section, we move one step further toward simulating the usage of N170 as a biomarker of the patient’s condition (i.e., SCI, MCI, AD, or HC) by creating a number of classifiers trained to classify an “unseen” subject (i.e., a subject with no prior information about its condition) to one of the available classes, based on its N170 response. More specifically, we have decided to train six bilateral classifiers in a pairwise mode, as well as four classifiers in an “one versus other” mode. These classifiers can essentially simulate the use of N170 as a biomarker that would indicate the condition of an “unseen” subject as being SCI (and not MCI, AD, or HC), being MCI (and not SCI, AD, or HC), etc. Given that SCI is still a condition that is not identifiable through neuropsychological examination, we consider these classifiers to be of particular clinical interest, since they can verify the SCI condition of a certain subject with sufficient reliability. Thus, by positioning this subject at the earliest stages of AD, we can help introduce a set of interventions that could potentially prolong the progression of the disease.
More specifically, we have created classifiers using the technique of Random Forests. Classifiers were trained with the features of both latency and amplitude, sourcing from the P8 electrode. Different classifiers were obtained for the “Anger” and “Fear” conditions. Subsequently, classification accuracy, specificity and sensitivity rates were computed with the help of SPSS v24.0. More specifically, in using SPSS, we constructed corresponding ROC curves and identified the best threshold (i.e., the threshold that maximizes the sum of sensitivity and specificity) of the N170 amplitude values to differentiate our four groups. A ROC curve provides the sensitivity and the specificity over a range of possible threshold values; an area under the curve (AUC) of 100% corresponds to a perfect prediction whereas a value of 50% to a useless model (Figs. 4 – 6). A minimum value of 65% for both sensitivity and specificity can be considered as acceptable, based on a recent neurophysiological study [136]. The sensitivity and specificity scores corresponding to the cutoff thresholds (as define above) together with the AUC are presented in Tables 5 and 6.

ROC Curves presenting for N170 amplitude for the emotional condition of “Anger” from P8 for discrimination between: A) SCI and HC, B) MCI and HC, C) AD and HC, D) MCI and SCI, E) SCI and AD, F) MCI and AD.
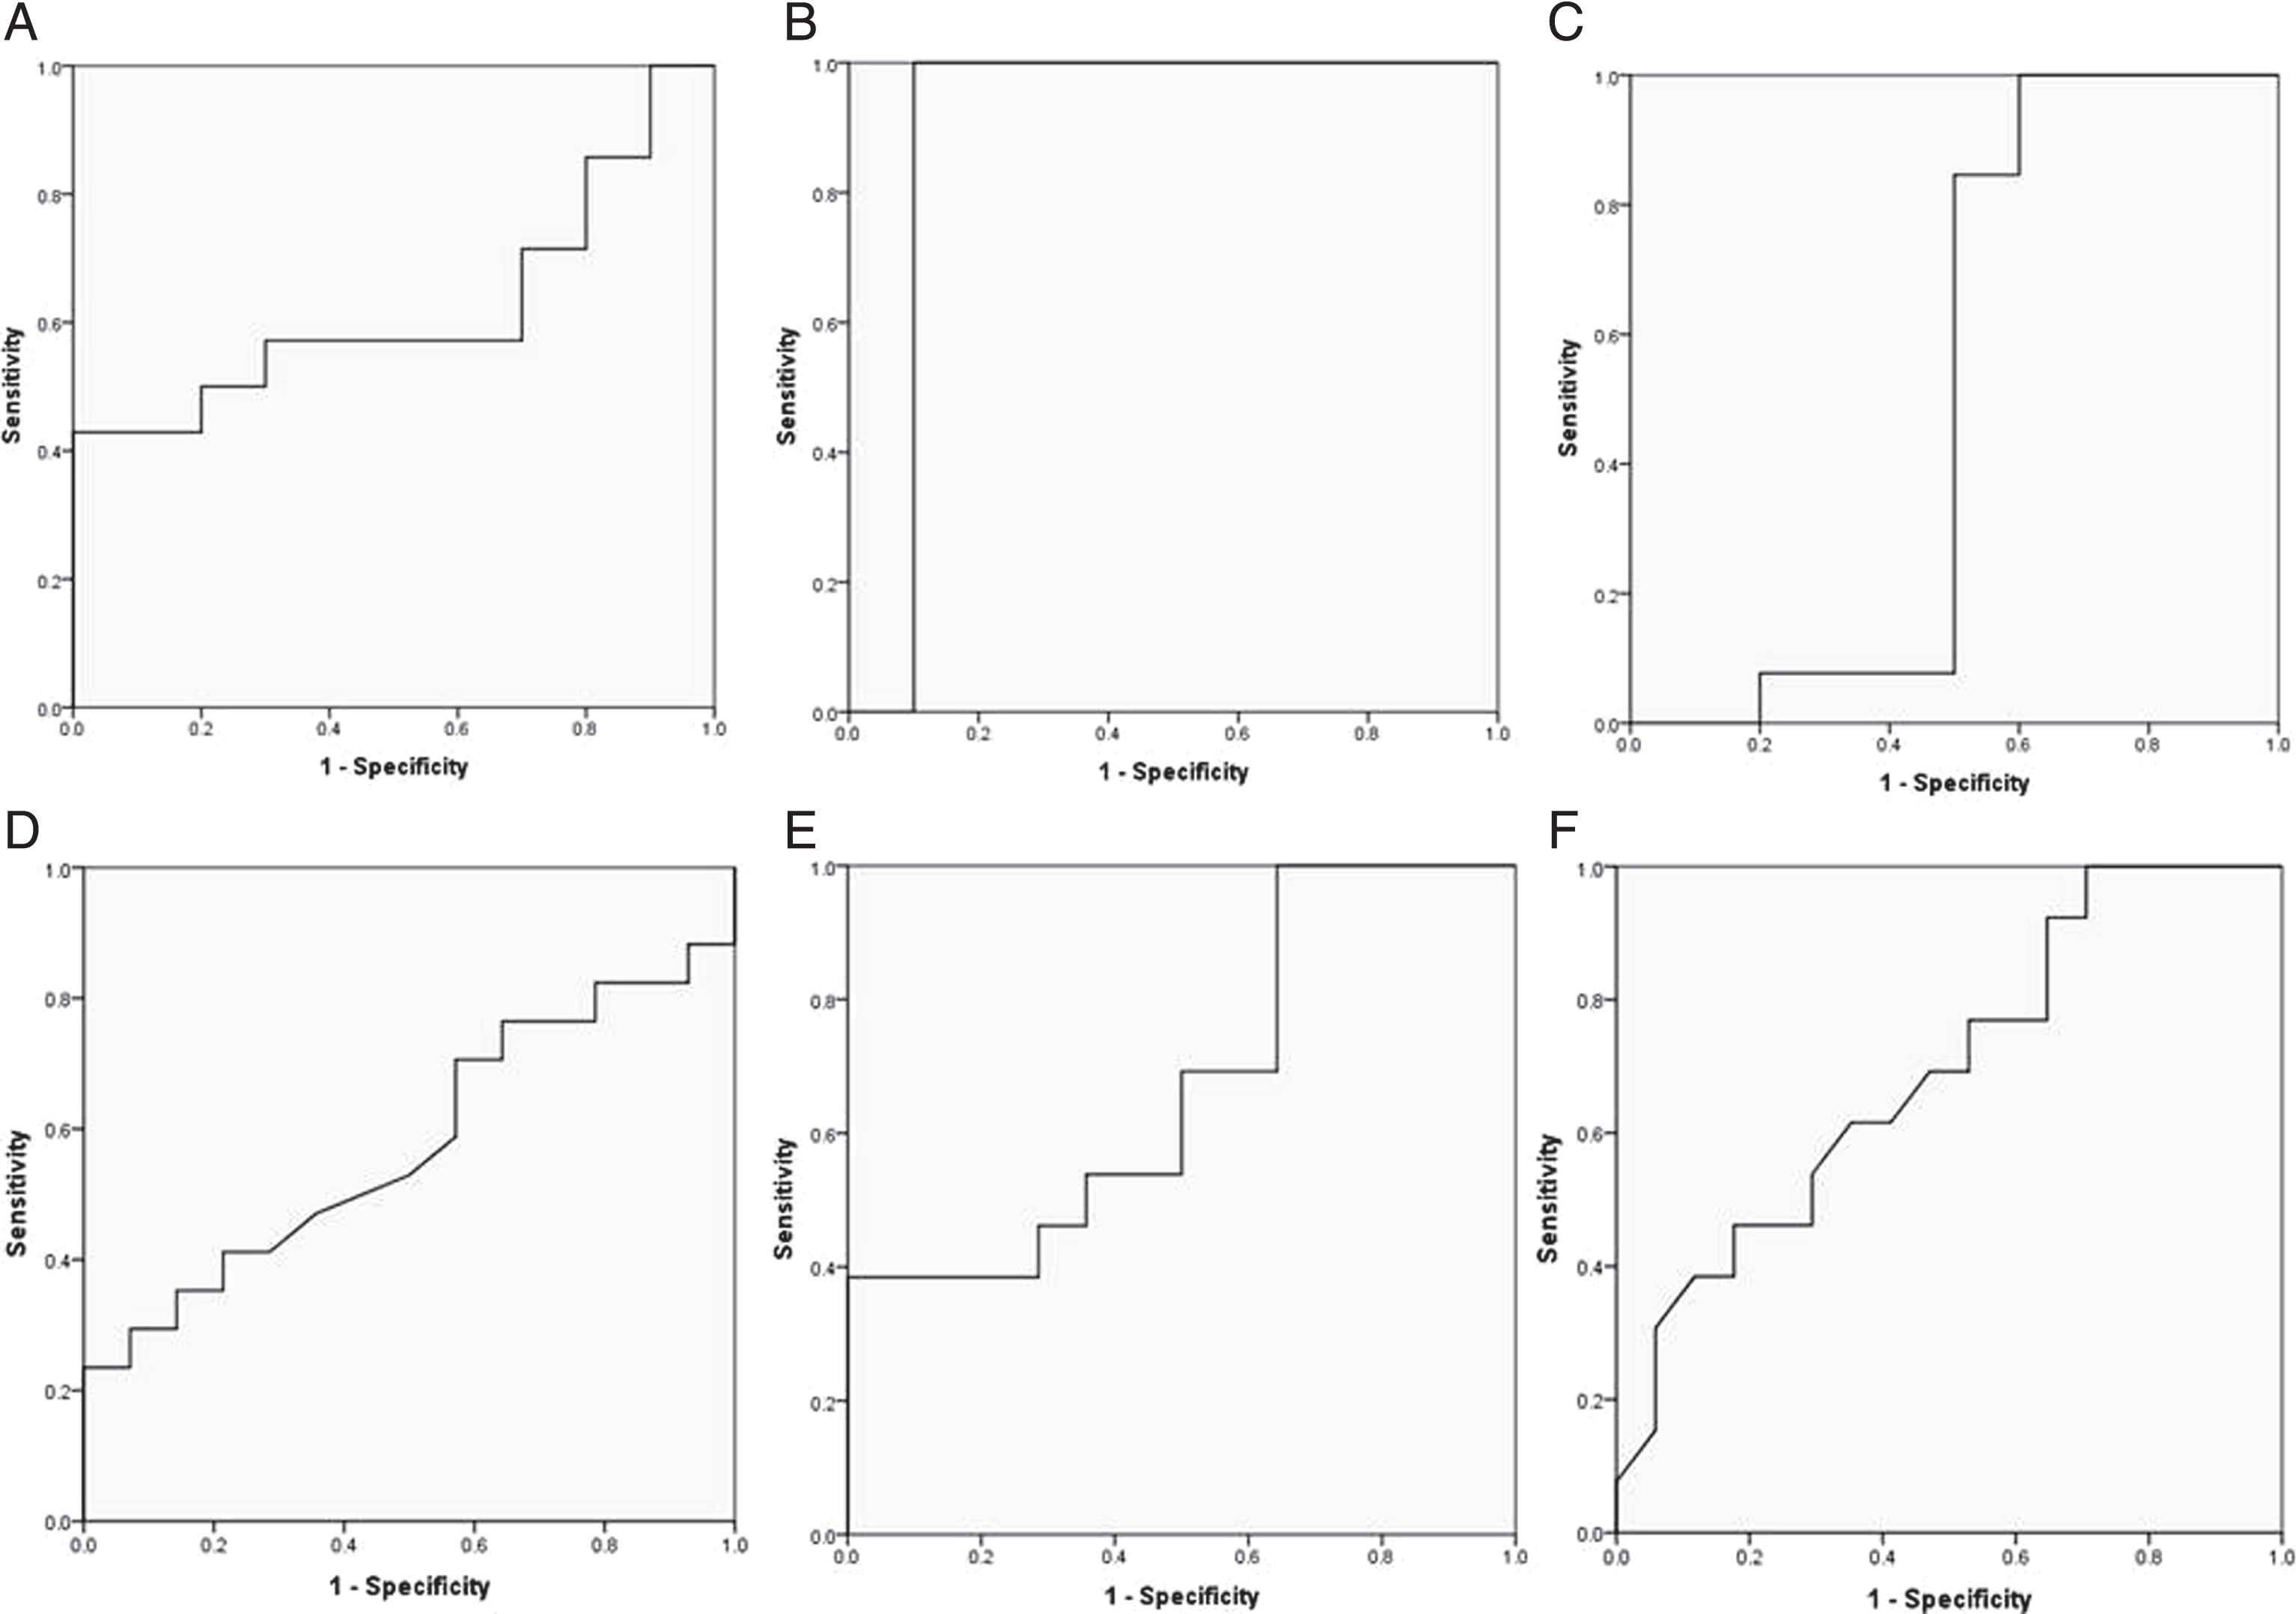
ROC curves presenting for N170 amplitude for the emotional condition of “Fear” from P8 for discrimination between: A) SCI and HC, B) MCI and HC, C) AD and HC, D) MCI and SCI, E) SCI and AD, F) MCI and AD.

ROC Curves presenting for N170 amplitude for both emotional conditions (“Anger” and “Fear”) from P8 for comparison of each group with the rest groups: A) HC from SCI, MCI, and AD, B) SCI from HC, MCI, and AD, C) MCI from HC, SCI, and AD, D) AD from HC, SCI, and MCI.
Sensitivity and specificity of N170 amplitudes from P8 both for Anger and Fear for each type of diagnosis
and specificity of N170 amplitudes from P8 both for Anger and Fear for each group of participants compared with the rest groups
“Anger”
For the facial stimuli of Anger as recorded from P8 electrode in right hemisphere, four ROC curves reached the minimum threshold value of 65% of sensitivity and specificity: 1) for discriminating SCI participants from the HC, MCI, and AD groups the sensitivity was 86% and the specificity 82%; 2) for discriminating of MCI from HC, SCI and AD participants, the values were 83% and 67%, respectively; 3) for discriminating AD from HC, SCI, and MCI participants, sensitivity was 77% and specificity was 85%, and 4) for discriminating HC from SCI, MCI, and AD participants, the values were 100% and 79%, respectively.
In general, seven AUC reached the 65% threshold: 1) for discriminating the SCI from the HC, this was 66%; 2) for discriminating the AD from the HC, 66%; 3) for discriminating the SCI from the AD, 66%; 4) for discriminating the HC from the SCI, MCI, and AD groups, 96%; 5) for discriminating the AD from the HC, MCI, and SCI groups, 82%; 6) for discriminating the SCI from the HC, MCI, and AD groups, 86%; and 7) for discriminating the MCI from the HC, SCI, and AD groups, 86%.
“Fear”
Moreover, for the emotional condition of “Fear”, five ROC curves reached 65% of sensitivity and specificity for discriminations at P8 electrode position: 1) for discriminating the MCI group from the HC group, the sensitivity was 71%, and the specificity was 80%; 2) for discriminating HC from the SCI, MCI, and AD group, the sensitivity was 100% and the specificity was 79%; 3) for discriminating SCI from HC, MCI, and AD group, the sensitivity was 93% and the specificity was 87%; 4) for discriminating MCI from HC, SCI, and AD group, the sensitivity was 75% and the specificity was 81%; and 5) for discriminating AD from the HC, SCI, and MCI groups, the sensitivity was 100% and the specificity was 80%.
In general, eight AUC reached the 65% threshold: 1) for discriminating the MCI from the HC, the AUC was 90%; 2) for discriminating the AD from the HC, 76%; 3) for discriminating the AD from SCI, 68%; 4) for discriminating the AD from the MCI, 69%; 5) for discriminating the MCI from the HC, SCI, and AD groups, 78%; 6) for discriminating the SCI from the HC, MCI, and AD groups, 95%; 7) for discriminating the HC from the SCI, MCI, and AD groups, 91%; and 8) for discriminating the AD from the HC, SCI, and MCI groups, 96%.
Hence, the best parameter for this discrimination was the facial stimuli of “Fear”, which is in line with our findings based on Kruskal-Wallis and Mann-Whitney analysis, where the best parameter for differentiating our groups was also the stimuli related to “Fear”.
N170 topography
The N170 topographic maps for both facial stimuli (“Anger” and “Fear”) from temporo-parietal electrode P8, revealed an enlarged negativity over parietal electrode sites for the group of the most cognitively impaired elderly along with a limited positivity over fronto-central channels (Fig. 7). For the group of HC, the positivity in the fronto-central channels seems to be higher, whereas the negativity in the parietal channels seems to be lower compared to the case of the SCI, MCI, and AD. Figure 7 also shows the differential topography created in “Anger” and “Fear” condition. As one can see in this graph, the N170 topography observed in each of the two facial stimuli changes with diagnosis. More specifically, the topography of the N170 component reveals high positivity in the fronto-central and high negativity in the occipito-temporal electrodes of the N170 component in the case of the “Anger” and “Fear” condition, whereas as the pathology gets worse, less positive dominance in fronto-central areas and greater negativity over parietal sites, is observed.
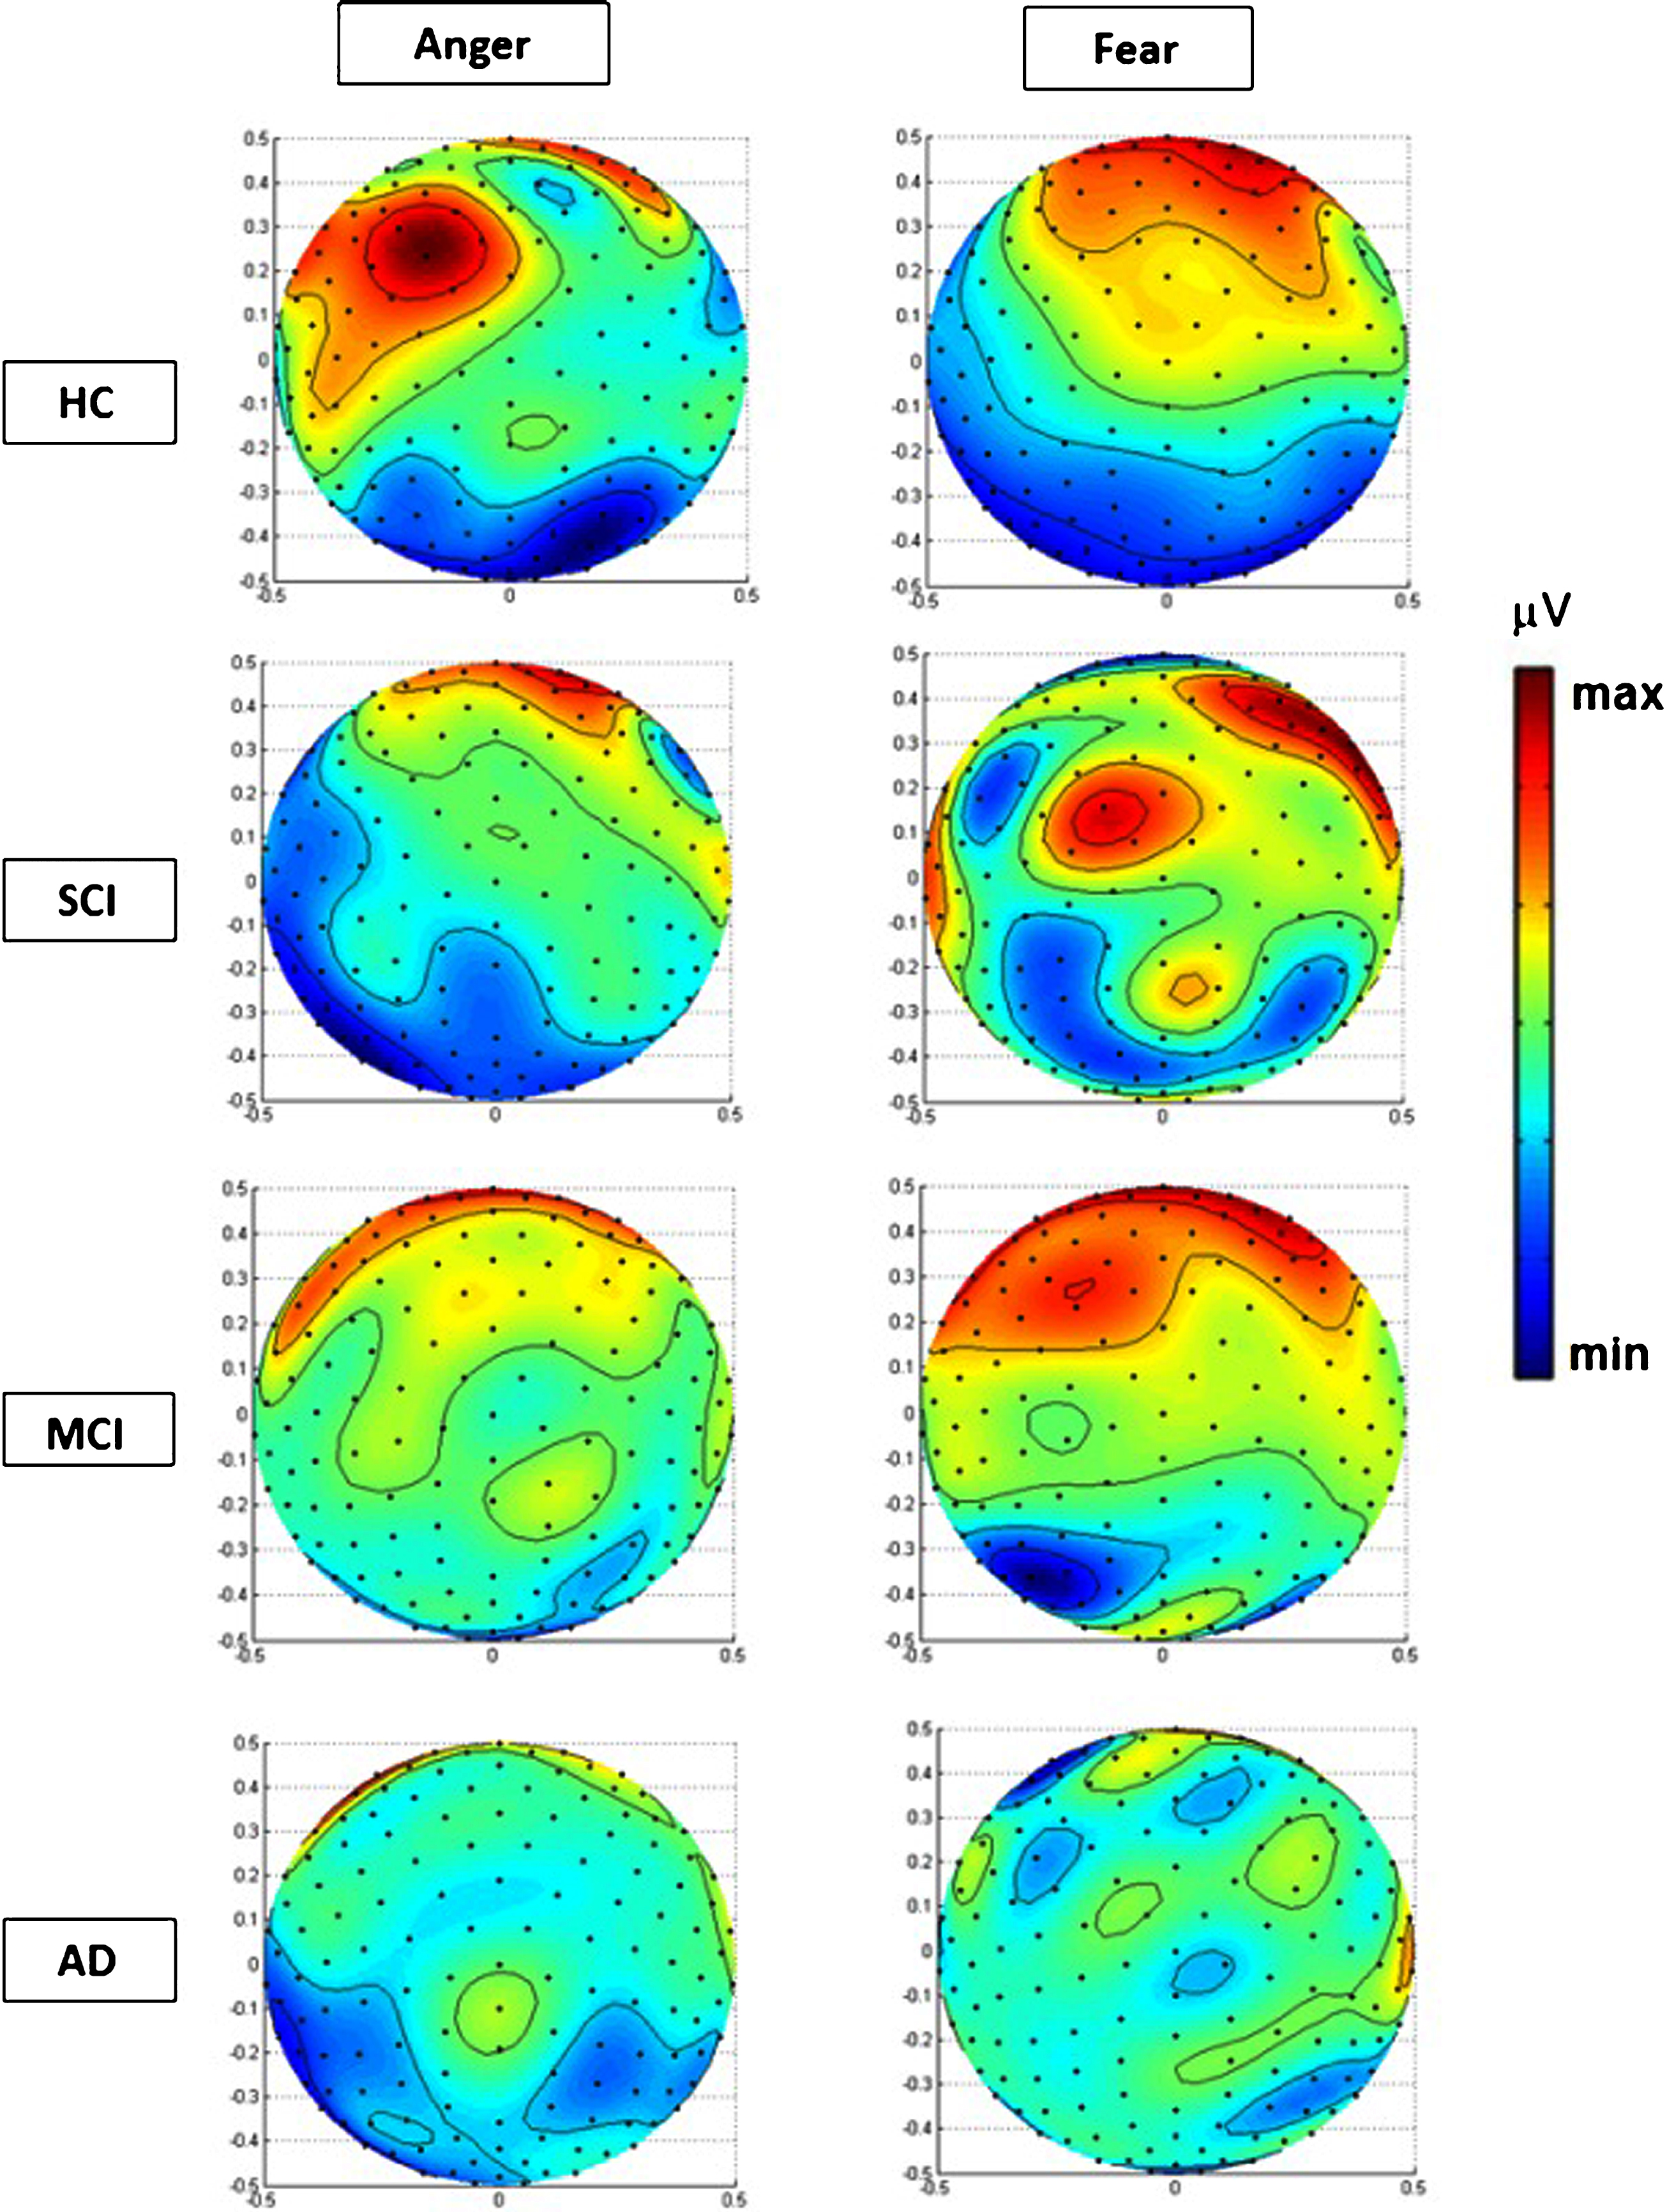
Polar projections and topographic view of spherical spline interpolations of the voltage topography (in microvolts) 170 ms following the onset of the face stimulus for two conditions of Anger and Fear. Topographic maps depicting the scalp distribution of ERP for negative faces in HC, SCI, MCI, and AD group in both emotion conditions. Data illustrated is the average ERPs across conditions at the latency of the N170.
In addition, we further examined the ERP waveforms from recording sites placed in areas other than the parietal (P8). In this direction, sensors that seemed to have an impact on the topographic representations (Fig. 7), from the frontal, central, and occipital area were selected for further analysis. For the sake of conciseness, we examine the case of “Fear” that has shown to produce the most consistent findings in our study. More specifically, in an attempt to cross-verify the aforementioned observations through the source analysis of electrodes lying in the frontal, central, and occipital areas of the scalp, we provide in the Supplementary Figure 1A-C the ERP waveforms (similar to the ones obtained from P8) obtained from Fz, Cz, and Oz electrodes, respectively. The ERP waveforms depicted in these figures fully comply with our observation that the positivity in the fronto-central areas is higher and the negativity in the parietal channels is lower for the HC compared to SCI, MCI, and AD. Thus, we may conclude that there is strong consensus between the source analysis stemming from the parietal (P8), the frontal (Fz), and the central (Cz) as well as occipital (Oz) areas of the scalp.
Brain source localization sLORETA of N170
The brain sources were evaluated using the sLORETA for the N170 component to the grand average of the four groups. Figure 8 depicts the sLORETA images at selected axial slices of the brain from the medial (Z = 45) to the superior (Z = 145), according to the Talairach coordinate system [137] in case of “Anger” (Fig. 8A) and “Fear” (Fig. 8B). In Table 7, the effect of cognitive impairment in the characteristics of the maximum observed current density of the N170 in case of “Anger” and “Fear” based on sLORETA can be found. In case of “Anger” in HC, SCI and MCI groups increased activation was observed in the “Frontal” lobe, whereas in AD only in “Occipital” we saw activation. On the other hand, different brain regions are activated in case of “Fear” among the four groups. More specifically, increased activation in frontal lobe area in the SCI group compared to HC was located in rectal gyrus (Broadmann Area – BA 11), which is part of frontal lobe, while HC demonstrated increased brain activity in inferior frontal gyrus (BA 47). In the MCI group, increased activation was observed in the inferior temporal gyrus (BA 20) whereas in AD, activation was observed in the occipital lobe and more specifically in the lingual gyrus (BA 18).
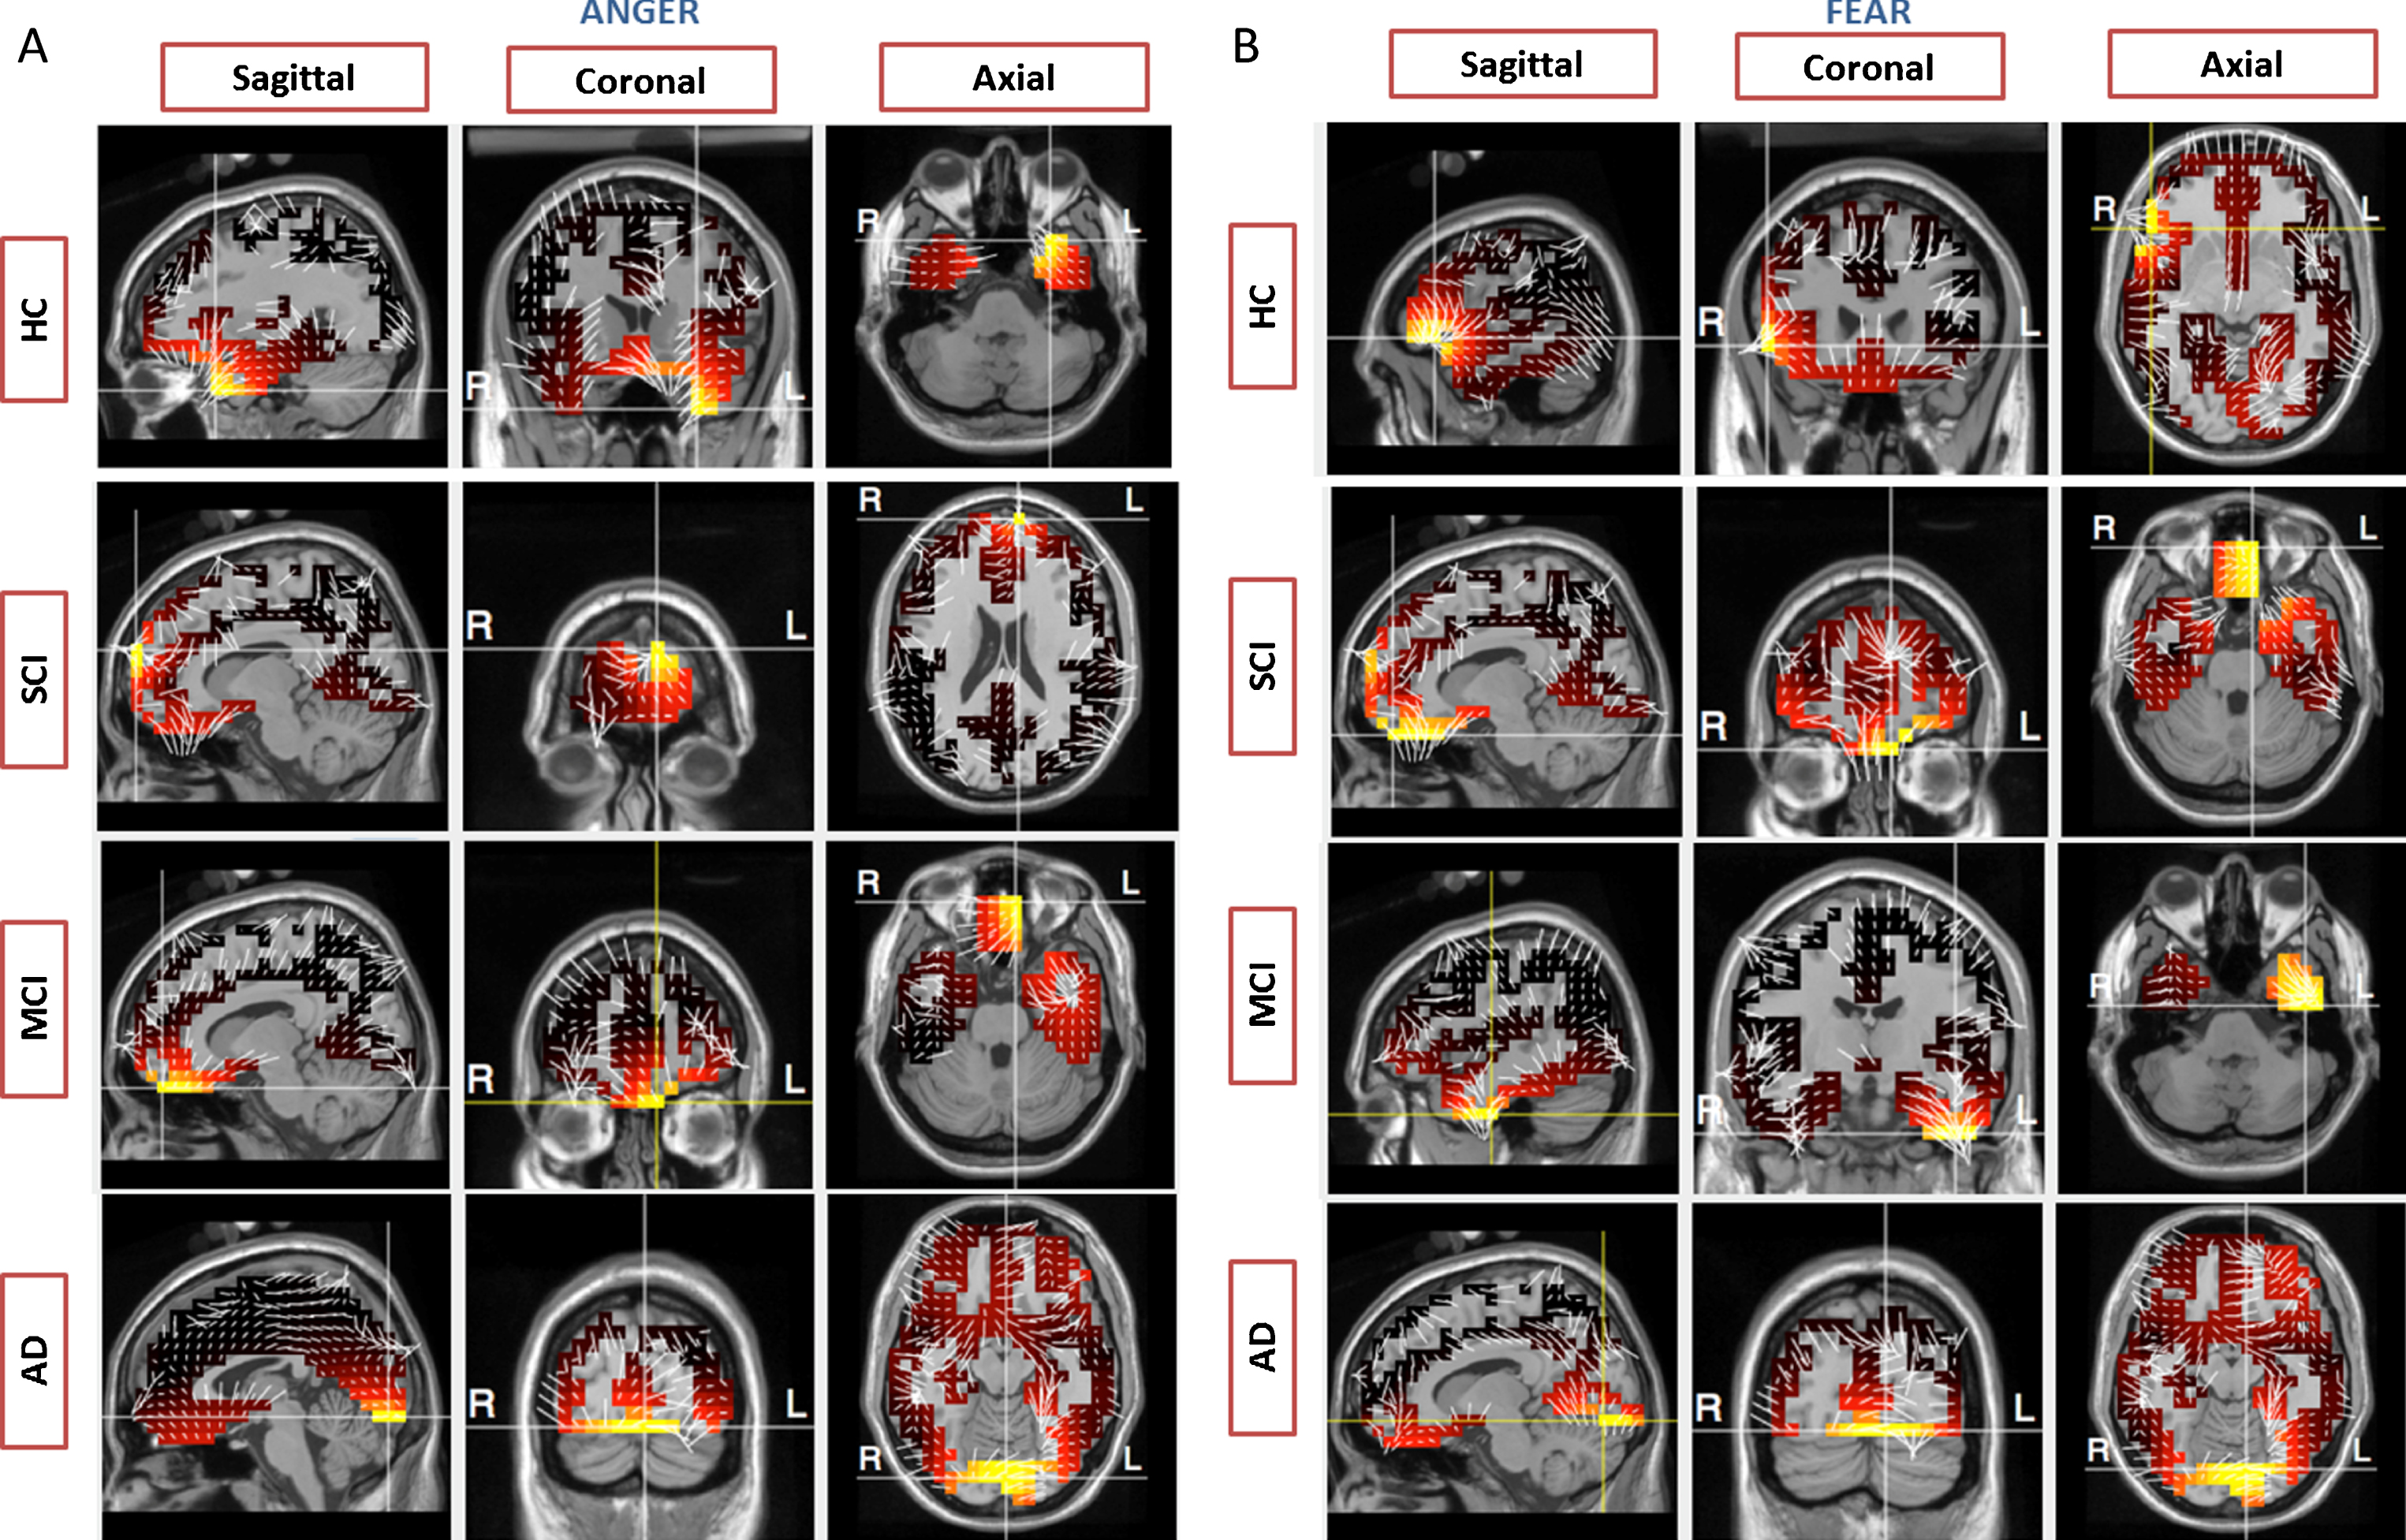
sLORETA images of N170 “Anger” (A) and “Fear” (B) current densities in the HC, SCI, MCI and AD participants respectively. The axial slices are shown for the medial view (Z = 45 mm) to the superior view (Z = 145) as indicated by the Talairach coordinate system.
effect of cognitive impairment in the characteristics of the maximum observed current density of the N170 “Anger” and “Fear” component based on sLORETA
DISCUSSION
The present study measures neuropsychological and N170 ERP data obtained in order to examine the course of processing negative facial stimuli among HC, SCI, MCI, and AD participants. To our knowledge, this is the first electrophysiological study with dense-array 256-channel electrode distribution to investigate the neural activation corresponding to processing after negative facial stimuli in people with SCI, MCI, and AD as compared to individually matched HC. Our study is the first work that provides evidence of the utility and importance of N170 acquired through a HD-EEG, as a potential marker to evaluate the cognitive impairment of individuals, even at SCI stage. More specifically, the main aim of this study was to collect both cognitive-neuropsychological and N170 ERP data elicited after facial negative emotional stimulus in order to examine for the first time the earliest stages of cognitive impairment related to AD and more specifically in the very controversial group of SCI subjects. Our results confirm and extend the statement of previous studies suggesting that ERPs, and more specifically N170, could potentially serve as neurobiological markers for SCI, MCI, and AD compared to HC. Fearful expressions have been extensively studied in recent years and our results underline and prove the strong connection between SCI and emotional perception-processing [138]. Summarizing the main findings, SCI group compared to HC, had larger amplitude to negative faces, while brain activation in fronto-central areas, during N170 elicitation was less than expected compared with HC. Similarly, MCI and AD group exhibited also larger N170 amplitudes and less brain activation, in the respective areas, was observed compared to HC.
Neuropsychological data
An additional purpose of this research was to assess the neuropsychological status of people seeking help for subjective memory complaints at an out-patient memory clinic and day centers of AD. Our aim was to determine the prevalence of certain cognitive conditions in cognitively intact and impaired participants, since SCI stage may hold value in the elder population as benchmark for future cognitive decline. As revealed by the detailed neuropsychological assessment, our participants with SCI had equal neuropsychological performance with HC elders. Although in the ROCFT and FRSSD tests, HC outperformed the SCI group, both groups were within normal limits. On the other hand, in the AD and MCI groups, statistically significant differences were detected in scales measuring attention, visio-spatial ability, general cognitive function, and daily functionality. In this common line, previous cross-sectional studies have sought to identify any association between SCI and objective memory performance, with conflicting results. Studies have either demonstrated weak associations [14, 139], or no such association [140, 141]. A possible explanation for this discrepancy is that standard memory tests may not be sensitive enough to detect SCI. Moreover, in one particular study [142], 364 non-demented elderly participants with a one year follow up period were examined with cognitive measurements, had demonstrated either normal or impaired cognitive function on neuropsychological assessment. It was found that subjects with memory complaints at baseline examination had significantly greater decline in memory and cognition than subjects without memory complaints but only if they had some cognitive impairment at baseline [142]. However, this study lacks in the fact that if objective cognitive impairment clues exist we should rather speak about MCI stage and not SCI. Although these different approaches of measuring memory complaints based on neuropsychological properties may correlate with one another, they are not equivalent and not entirely comparable. In our study statistical significant differences were observed between HC compared with MCI and AD groups as well as between SCI compared to MCI and AD. More specifically, HC differed in global cognition, visio-spatial ability, memory, and executive functions from MCI and additionally in many scales of daily function from AD.
N170 ERP component
In the present study, N170 both for “Anger” and “Fear” contributes in acquiring better knowledge of cognitive deterioration and dementia-related deficits in the group of cognitively-impaired people (SCI, MCI, and AD) compared to HC. Cognitive impaired participants had lower values on the N170 amplitude of P8 electrode both for “Anger” and “Fear”, which implies that the processing for negative faces is deteriorated in SCI, MCI, and AD. Supposing that facial emotion acts as cue to trigger activation of stored configural representations, the difference in SCI compared to HC may at least partly explain the impaired processing after presentation of negative faces. In contrast to HC, the SCI group exhibited enhanced N170 amplitude for “Fear” compared to the negative emotion of “Anger” (Table 4). Furthermore, greater variability was observed among AD participants and this can be explained based on ERP and neuroimaging studies, which have raised and addressed also this important issue [129]. In general, neurophysiological studies have implicated increased intra-individual variability as a marker of generalized cognitive decline especially in AD [143]. Dementia patients are also reported to be more variable in performance than normal elderly [144], with some evidence for different levels of variability in different dementia disorders [145–148]. Since ERP amplitude means correlate with attention, stimulus identification, and memory, many studies suggest that face and emotional perception difficulties, might be caused by age-related and cognitive impairments on higher-level perceptual processes, such as reduced processing speed [82], reduced attention/working memory capacity [83], impaired prefrontal inhibitory control [84], and reduced cognitive flexibility as evidenced by a general reduction in task switching performance [85]. We assume that the amplitude variability of AD in our study reflects the absence of efficiency and stability of neural networks necessary for reliable recognition, processing, and retrieval for emotional processing after presentation of negative emotional facial stimuli. For example, neuroimaging has demonstrated that regions of the right prefrontal cortex, including dorsolateral regions, fronto-polar areas, working in conjunction with temporal lobe areas, are key neuroanatomical correlates of emotional processing [60, 61]. It is possible that disease-related atrophy in prefrontal and temporal areas would lead to instability in the respective sites leading to a more variable electro-cortical signal indicative of poor fronto-temporal control. These pieces of evidence demonstrate different processing of negative emotions during the presentation of faces, which might contribute to previously reported deficits in facial emotion recognition [38, 80]. Interestingly, previous research has also shown that delayed structural face emotional encoding is associated with prolonged behavioral outcome [58, 149]. A similar relationship has been identified in the present study as reflected by a positive correlation between N170 amplitude and specific subscales across neuropsychological tests (p < 0.05 at P8). According to the literature, anxiety influences early perceptual processing of negative emotions such as angry and fearful faces compared to other positive or neutral faces [68]. According to our present results, fearful faces provoked larger amplitude compared to angry faces in all groups. This fact enhances the view that different emotional expressions of human faces can modulate the N170 component [150, 151]. In our study, we have chosen P8 electrode, which is close to the para-hippocampal place area and the right fusiform gyrus that is well-known to play an important role for the perception of emotional stimulus and face recognition [152]. This assumption confirms that the N170 is likely to be generated in basal parietal areas [51] and it is considered an ERP that reflects a “face detector” mechanism that triggers the face-encoding process [86] and social tasks conditions [153]. This underlines and confirms that the posterior-parietal–located N170 has larger amplitude when elicited by faces [154] and may be modulated by facial emotional expression [52].
(M) and standard deviation (SD) of amplitudes and latencies of N170 both for “Anger” and “Fear” as recorded from P8 electrode (HC = 12, SCI = 14, MCI = 17, AD = 14). Kruskal-Wallis Statistical Test within groups. The level of significance was set at α= 0.05.
iDiffers from SCI p < 0.05, iiDiffers from HC p < 0.001, iiiDiffers from HC p < 0.05. No superscripts indicate no statistically significant difference.
On the other hand, other studies have not found N170 amplitude statistical significant differences among HC and participants with amnestic MCI (aMCI), although larger N170 amplitudes have been observed in the aMCI, after presentation of angry faces [35]. Albeit larger N170 amplitudes in AD participants have been reported in two studies [128, 155]. However, no statistical significant differences regarding the latency have been found in AD [128], although slower peak latencies have been reported in participants with aMCI [35], while earlier N170 latencies were correlated with faster reaction times in an emotion discrimination task. In this common vein, we did not find statistical significant differences among groups regarding the latency of N170 both for “Anger” and “Fear”. However, longer latency of N170 was observed for the AD group compared to HC, SCI, and MCI group, but this difference was not statistical significant neither for “Fear” nor “Anger”. The observed absence of statistically significant differences between the N170 latencies of the two emotions, is in agreement with current literature [68, 156] and our previous study in which we compared N170 response in case of “Anger” and Fear” between young and elderly individuals [59]. Moreover, Saavedra et al. [87] reported in their study larger amplitude of N170 in elderly adults with cognitive impairment and reached the conclusion that the underlying cognitive process (early perceptual processing) is impaired in these patients. Their results are aligned with the outcomes of our study, which suggest that N170 is modulated by the decline associated to pathological cognitive aging, and in particular to the processes related to AD [82–85]. Moreover, a recent study has demonstrated that in contrast to HC group, the peak latency of N170 for the aMCI group was clearly prolonged (t = 5.57, p = 0.01), which indicates that face recognition processing and emotional memory is impaired in patients with aMCI and that such damage mainly occurred in the early coding stages [40].
To the best of our knowledge, there are no studies which have investigated the N170 in SCI participants compared to AD, MCI, and HC. However there are few existing studies that have investigated P300 ERP differences among those groups and hold diagnostic value in MCI or SCI patients,considering as a useful component in the early stages of the disease [102, 158]. Such studies have proved that MCI patients have prolonged P300 latency and reduced P300 amplitude compared to HC [159, 160]. However, others have not found any differences in P300 amplitude or latency in MCI compared to HC [161–164]. In a more recent study [165], the authors investigated the P300 value in a series of patients with SCI using a prospective cohort design, using P300 (auditory oddball task). The diagnostic value of P300 latency at baseline examination for AD had a sensitivity of 52.9% and a specificity of 76.9%. Findings from this study suggest that assessment of evoked related potentials may contribute to the early detection of AD. However, this study proved only the significance of ERPs in people who developed in AD. In our study, we proceed to ROC curves analysis in order to define the cut-off scores and the specificity and the sensitivity of every variable (N170 amplitude and latency for “Anger” and “Fear”). Based on our findings, the N170 amplitude for the two negative emotions may be considered as a potential biomarker for the detection of SCI, discriminating SCI from the other groups (HC, MCI, and AD) with 85% sensitivity and 82% specificity (AUC = 86%, in ROC curves) in case of “Anger” and 93% sensitivity and 87% specificity (AUC = 95%, in ROC curves) in case of “Fear”, and MCI from HC with 100% sensitivity and 90% specificity in case of “Fear” (AUC = 90%, in ROC curves). Table 6 and Fig. 6 display the respective AUC, cut-offs sensitivity and specificity values for each of the variables. More specifically, eight ROC curves reached the minimum threshold value of 65% in the sensitivity and specificity scores for discriminating our four groups. Out of these cases, the N170 amplitude as recorded in P8 in case of “Fear” proved to have the best discrimination capacity since it was able to distinguish the SCI from HC, MCI and AD with high sensitivity (93%) and specificity (87%) values (95% AUC).
Topographic and brain source localization analysis
It is widely known that the N170 early component is influenced by distinct emotional facial stimulus and in our study proved to have larger amplitudes in individuals with SCI compared to HC. Also, larger amplitudes were also noticed in AD compared to MCI, SCI, and HC as well as MCI compared to HC and SCI, as long as negative stimuli such as “Anger” and “Fear” were used. These findings are consistent with the results of the location of maximum brain activation, which also appear to be different among our four groups. This difference is also evident when observing the N170 amplitudes and the neural activation in topographic maps both for “Anger” and “Fear”. N170 topographic maps differ between the two negative stimuli among the four groups, while less frontal brain activation was noticed in elders with cognitive deterioration compared to HC group. More specifically, Fig. 7 presents the difference of the neural activation between the four groups. This outcome leads us to believe that cognitive impairment affects fronto-temporal and occipito-parietal areas, which take part in facial processing [166]. These findings pave the way to investigate the changes taking place in neural activation at cognitively impaired conditions associated with neuro-degenerative diseases such as SCI, as prodromal stage of cognitive impairment related to AD and demonstrate an interesting shifting of the location of maximum neural activation for the two negative emotions. More specifically, in the case of “Anger” and “Fear” the maximum intensity level appears in frontal lobe in the most cognitively intact groups (e.g., HC and SCI). Our observations are consistent with other studies showing that N170 component is generated by “top-down influences” [153, 167–169], arising from higher order regions of the cortex.
This neural activation seems to be emotion specific, whereas as the pathology gets worse, less brain activation is observed in frontal areas while more negative polarity is detected in parietal areas. Moreover, the N170 topographic maps for both emotional conditions revealed in general, an enlarged negativity over temporo-parietal electrode sites with a limited positive polarity over fronto-central areas for the most cognitively impaired participants, whereas HC participants showed, comparatively, less pronounced negativity in posterior regions and maximum positivity over fronto-central sites. In addition, in the case of SCI participants, the positive dominance over frontal areas seems to be interrupted partially in case of “Fear” as compared to HC participants. These pieces of evidence show that in case of SCI less brain activation in the respective brain areas, compared to HC, is observed during N170 ERPs elicitation. It is also noteworthy, that the topographic maps of HC participants seem to be distinct for each emotional stimulus, whereas in case of cognitively impaired elderly such as SCI, MCI, and AD, both emotions result in similar topographic distribution of the brain source electrical field. Specially, the enhanced N170 amplitude in cognitively impaired groups (SCI, MCI, and AD) may relate to the disrupted interaction between posterior face processing regions and the prefrontal cortex. A recent approach has proved that correlational analyses between face-selective ERP and fMRI markers reveal a strong association between the N170 face-selectivity and face-selective areas in the frontal and temporal lobe, but not in the occipital lobe [57]. In this common line, a recent study has also reported decreased prefrontal cortex activation in SCI subjects compared to controls during an encoding task [170] by using fMRI. Moreover, reduced neural activation in left prefrontal cortex of MCI in comparison with HC has been observed in neuroimaging studies which used fMRI [171] and PET [172]. Our results are in accordance with previous similar studies [28] which tested SCI subjects and HC by divided attention task by using fMRI and found that the SCI group demonstrated increased activation in left medial temporal lobe, bilateral thalamus, posterior cingulate, and caudate, which highlights the substantial difference between HC and SCI group. Our results from sLORETA analysis (Fig. 8) showed that the HC group had increased activation in the superior temporal gyrus, in the case of “Anger”, an area which involves functions such as decision making, processing of rewards, planning, and encoding information for long-term memory, and more specifically in rectal gyrus area and inferior temporal gyrus in the case of “Fear”. Several studies have proposed the ventral and inferior frontal area as a main candidate in expression recognition processes in human [173], which is activated with a negative expression recognition task [62]. This frontal activity apparently reflects cognitive processes such as explicit retrieval and emotion recognition. In our study, we found very little frontal activation in cognitively impaired participants such as MCI and AD but also less frontal activation is observed for the SCI group, compared to HC.
In this common line, sLORETA brain activity after fearful stimulus has been tested to other neuropsychiatric conditions such as schizophrenia compared to HC [169]. More specifically, minimum levels of activation of the middle frontal gyrus and inferior frontal gyrus were associated with the N170 component after presentation of fearful faces in schizophrenia patients compared to HC [169]. In addition, the orbital and medial prefrontal parts have been found to be predominantly involved in affective processing, while the lateral part was involved in cognitive functions [174], which supports that frontal cortex is one of the main part of the human brain which is activated during the emotional processing. In this common vein, a voxel-wise correlation analysis by using fMRI revealed that the N170 was highly correlated with the response to faces in the middle frontal gyrus, anterior cingulate, and superior temporal gyrus [57]. In our previous study [59], we also found that in the case of “Anger”, the maximum intensity level appears in the frontal lobe, whereas in the case of “Fear”, maximum neural activation was observed over the temporal lobe, for both age-based groups, while BA47 and BA11 had the maximum increased activation in case of elders and young, respectively. Similarly, in this present study, BA47 and BA11 have been found to be the most highly active BAs in HC and SCI respectively in case of “Fear”. The activation of the temporal lobe as response to negative emotions such as “Anger” is not a surprise since it is linked with temporal brain structures, responsible for negative emotions recognition, such as amygdala. In this present study, the SCI group had increased activation in superior frontal gyrus and orbital gyrus area, while as far as MCI group is concerned increased activation was found in inferior temporal gyrus and orbital gyrus, a region where high-level visual processing and memory recognition are taking place and which has been found to play pivotal role in similar tasks [52]. In the AD group, the highest activation was observed in the occipital cortex and more specifically in the lingual gyrus, which underlines the inability of AD participants to process any emotional stimulus, and only areas of vision were activated in case of “Fear”, while no fronto-temporal activation was found. However, few existing PET studies have also linked disgusted, sad, and fearful faces with activation in the left lingual gyrus [62–64], particularly for negative emotions [64].
Furthermore, it has been suggested recently that AD may be primarily a disorder of the synapse and synaptic plasticity [175]. Interestingly, the decreased activation of cognitively impaired groups in the present study could be related with the evidence showing that prefrontal synapses are especially vulnerable and their loss is related to cognitive decline [176]. On the other hand, in the case of SCI and HC, maximum frontal and temporal activation was observed, which underlines that as far as the SCI group is concerned, the respective areas are activated. More specifically, in the HC group, the superior temporal and inferior frontal gyrus, areas which have been involved in the perception of emotions in facial stimuli, proved to be the most highly activated after stimulus onset. On the other hand, in the SCI and MCI groups, higher activation was observed in the superior frontal gyrus and orbital gyrus and the inferior temporal gyrus, respectively, which are highly connected with the recognition of faces [64, 169]. This is due to the fact that the amygdala, a brain structure which plays a pivotal role in emotional processing is located in the temporal lobe [177]. According to the literature, the amygdala has often been linked with processing fearful faces [64, 178–180] and the orbital frontal regions with angry faces [181], as we also found in our present study for SCI group. Our results are in alignment with a similar approach that examined different ERP components, among them N170, in healthy and cognitively impaired individuals by applying sLORETA technique and found that the frontal gyrus is highly activated during face processing [182]. Moreover, the frontal activity suggests an underlying frontal processing for emotional expressions, particularly the negative emotions such as anger and fear, as also supported in [52]. In this particular study, it has been proposed that frontal activity in the superior and middle frontal gyri and to a lesser extent in the inferior frontal gyrus, essentially in the right hemisphere, was larger for disgusted and fearful faces [52]. Thus, the disrupted emotional face processing, observed in SCI, MCI, and AD, could be related to the decreased frontal activity as result of synapse loss within the AD spectrum. This fact may lead us to the conclusion that stimulus signaling social disapproval and threat, and the violation of social rules or expectations, such as Angry and Fearful faces, might give us some important findings for the disease evolution.
Limitations and future study
There are certain limitations in the present study that are described subsequently. We failed to find statistical significant differences between elderly adults with SCI and MCI in the cross-sectional analysis. The differences between these groups perhaps will only emerge in the longitudinal study. This could be due to a lack of statistical power to detect the differences between the groups, as a result of our sample size, which is fairly small for a clinical study. However, the majority of electrophysiological studies use sample sizes of similar or smaller volume and in our case, the groups have been carefully assessed at their recruitment visit by the same neuropsychologist and neurologist. Another limitation is that while psychosocial stress, feelings of anxiety, and depressed mood have been taken into consideration, as a possible indicator of memory issues, there might also be additional psychological and behavioral factors that we did not investigate (e.g., “Theory of Mind”) [183]. A thorough clinical and neuropsychological examination, which considers individual differences in the premorbid cognitive level, is necessary. Psychosocial stress and feelings of anxiety might be one explanation as to why these people with normal cognitive performance experience memory problems. We studied a clinical population sample with self-perceived memory deficits prompting presentation to a memory clinic and Alzheimer’s day centers, which may be unrepresentative of the general population. Larger studies with longitudinal follow up will help to further elucidate the nature of the relationship between SCI, brain changes, and its relation to AD. The two negative emotions under investigation in our study (Anger and Fear) have typically subsumed under the singular concept of negative, potentially threatening affect, mostly studied in comparison to neutral or positive stimuli and not between each other. Since the majority of the studies that deployed other emotions than fearful and angry expressions found greater negativities of N170 after negative rather than happy and neutral expressions irrespective of task demands [39, 66–68], we focused only on negative emotions as we have also successfully investigated in our previous studies [59, 184]. Since there is no direct comparison of these two as far as we know in EEG studies, although Functional Atlas of emotional stimuli by fMRI has been presented differences in brain activation due to fearful and angry faces [166], we believed that it would be interesting to study the differences, if any, between two separate (anger and fear), though both negative emotional conditions, in the millisecond range, using an ERP selective component of facial stimuli, detecting, finally, neuronal source activation of SCI, MCI, and AD compared with HC. Future ERP studies should follow up these issues and present some more specific motivated predictions for the preclinical stage of SCI in comparison with other biomarkers (e.g., cerebrospinal fluid).
Conclusion
The novelty of our study is on presenting for the first time, to the best of our knowledge, the neuronal oscillations of N170 ERP component and the cognitive- related alterations that occur in SCI as well as MCI and AD people by using recording of an HD-EEG with 256 channels after presenting negative facial stimuli. Our participants have been screened thoroughly and each of them viewed 34 pictures of two facial stimuli (“Anger” and “Fear”). Using high-density EEG recordings, we proved that it is possible to investigate and identify people with early stages of cognitive impairment, such as SCI. Consequently, although the concept of SCI has been considered with a degree of controversy by some neuroscientists and clinicians, our results confirm and extend the fact on previous studies suggesting that ERPs could be considered as a reliable biomarker of neurodegeneration concerning dementia and provide remarks for the use of different functional neural systems supporting face emotional processing in people with SCI compared to HC. In addition, our study showed that SCI subjects demonstrate brain activation changes during facial emotional processing but show no significant differences on detailed cognitive testing or behavioral measures compared with HC. Thus, identifying SCI by N170 modulation may facilitate the planning of future prevention and treatment of cognitive decline associated to pathological cognitive aging, and particular to the processes related to AD.
Footnotes
ACKNOWLEDGMENTS
We would like to thank Dr. Barry Reisberg (http://nyulangone.org/doctors/1023155504/barry-reisberg), who has conducted numerous studies in the field of SCI, for his advice regarding the applied neuropsychological screening tools for SCI participants, and Dr. Verykouki Eleni (http://mrm.med.auth.gr/faculty/eleni-verykouki/) for her statistical advice and assistance. This work was supported by the following projects: EU Horizon 2020 FP7 project Dem@Care: Dementia Ambient Care – Multi-Sensing Monitoring for Intelligent Remote Management and Decision Support under contract No. 288199 (http://www.demcare.eu/), Project CBP: Cognitive Brain Signal Processing Lab, GSRT Research Excellent Grant ARISTEIA, within the 4th Strategic Objective of the operational program “Education and Lifelong Learning” entitled ‘Supporting the Human Capital in order Promote Research and Innovation’, under grant agreement 440 (http://cbp.iti.gr/), and EU Horizon 2020 MAMEM: Multimedia Authoring and Management using your Eyes and Mind under contract No. 644780 ( ), coordinated by the Information Technologies Institute – Centre for Research & Technology Hellas.