
Abstract
Background:
Regional cortical thickness (rCTh) among cognitively normal (CN) adults (rCThCN) varies greatly between brain regions, as does the vulnerability to neurodegeneration.
Objective:
The goal of this study was to: 1) rank order rCThCN for various brain regions, and 2) explore their vulnerability to neurodegeneration in Alzheimer’s disease (AD) within these brain regions.
Methods:
The relationship between rCTh among the CN group (rCThCN) and the percent difference in CTh (% CThDiff) in each region between the CN group and AD patients was examined. Pearson correlation analysis was performed accounting for amyloid-β (Aβ) protein and APOE genotype using 210 age, gender, and APOE matched CN (n = 105, age range: 56–90) and AD (n = 105, age range: 56–90) ADNI participants.
Results:
Strong positive correlations were observed between rCThCN and % CThDiff accounting for Aβ deposition and APOE status. Regions, such as the entorhinal cortex, which had the greatest CTh in the CN state, were also the regions which had the greatest % CThDiff.
Conclusions:
Regions with the greatest CTh at the CN stage are found to aggregate in disease prone regions of AD, namely in the medial temporal lobe, including the temporal pole, ERC, parahippocampal gyrus, fusiform and the middle and inferior temporal gyrus. Although rCTh has been found to vary considerably across the different regions of the brain, our results indicate that regions with the greatest CTh at the CN stage are actually regions which have been found to be most vulnerable to neurodegeneration in AD.
INTRODUCTION
Alzheimer’s disease (AD) is associated with the excessive aggregation of amyloid-β (Aβ) protein outside neurons and tau protein inside nerve cells. Neuropathological diagnostic criteria for AD [1] require the deposition of Aβ, which accumulates initially and most prominently in neocortical regions, such as the precuneus, posterior and anterior cingulate gyrus, and the orbito-frontal cortex, as well as tau-associated neurofibrillary tangles [2, 3]. Neurofibrillary tangle pathology in AD follows a stereotypical topographic pattern initially involving the most selectively vulnerable regions, such as the entorhinal cortex (ERC) and parahippocampal gyrus, and then progressing to limbic and finally onto the association cortices [4].
Aβ deposition in neocortical regions, such as the posterior cingulate cortex, has been associated with generalized cortical thinning [5], although it is not clear whether Aβ pathology itself, or co-existing tau pathology or other unforeseen factors are responsible for this cortical thinning. Carriers of the apolipoprotein E ɛ4 allele (APOE4), who have an increased risk for developing late-onset AD and earlier age of onset of the disease, also have accelerated cortical thinning, possibly mediated by earlier and greater deposition of Aβ among APOE4 carriers, and other factors which may be independent of Aβ [6–14].
The ERC, which receives afferent input from widespread neocortical regions, is a critical interface between the hippocampus and neocortex in the memory circuitry of the brain. Cortical thinning of the ERC has been shown to parallel the density of neurofibrillary tangle pathology, but not of senile plaques, which are also present in the ERC in AD. Reduction in cortical thickness (CTh) of the ERC can be quantified using structural MR imaging [15]. Selective vulnerability to AD pathology within layer II neurons in the ERC appears to be related to specific developmental, morphological, functional, and molecular features which promote early susceptibility of this cell type to aging and AD [16].
CTh is known to vary greatly across different brain regions, with primary motor and sensory cortices being thinner than the association cortices, although the effect of normal aging and disease may alter this relationship [17]. Thinning of the cortex between young and middle-aged adults was found to be greatest in heteromodal association cortex and regions of high postnatal surface area [15]. Some studies have shown that temporal and occipital regions have less cortical thinning than parietal and frontal cortices, and there may even be age-related thickening of the ERC among older cognitively normal (CN) individuals [17].
In this study, we explored the relationship between the variability of CTh across brain regions and the vulnerability to neurodegeneration, independent of age effects, APOE4 carrier status, and global amyloid load in the CN stage. The standardized uptake value ratio (SUVR) for each cortical region of interest (ROI) was then obtained using standard equations as a measure of the Aβ load for that specific ROI. The SUVR quantifies in PET the degree of a given radiotracer (in this case, 18F-AV-45 Florbetapir) uptake in a region of interest. The index of vulnerability to neurodegeneration was measured by the difference in CTh in CN and the AD stage in any given brain region.
MATERIALS AND METHODS
Study participants
Data used in the preparation of this article were obtained from the Alzheimer’s Disease Neuroimaging Initiative (ADNI) database (http://adni.loni.usc.edu). The ADNI was launched in 2003 as a public-private partnership, led by Principal Investigator Michael W. Weiner, MD. The primary goal of ADNI has been to test whether magnetic resonance imaging (MRI), positron emission tomography (PET), specific biological markers, and clinical and neuropsychological measurements can be combined to predict and gauge the progression of the disease.
In this study, we focused on subjects classified as CN or AD by ADNI, who underwent MRI and AV45 PET scans within 6 months of each other. Because we were unable to find a sufficiently large cohort of ADNI subjects who could be studied longitudinally from the CN stage to the AD stage, we conducted instead a cross-sectional study comparing regional CTh in 105 CN subjects and 105 AD patients who were matched by age, gender and APOE4 carrier status, as shown in Table 1.
Participants’ demographic information
ap-values are for t-test (continuous variables: Age, Education, Clinical Dementia Rating Scale Sum of Boxes (CDR-SB) and Mini-Mental State Examination (MMSE)) and for Chi-square test (categorical variables: gender, APOE genotype (E4–/E4+) and global Aβ load status (Aβ–/Aβ+)), The criteria for significance was set at level p < 0.05. bValues are represented as mean (SD) for all continuous attributes.
Neuroimage data acquisition
For the PET scan, the following steps were taken: 1) Co-registration was first performed on extracted five 5-min frames to the first extracted frame from raw PET, all frames had undergone attenuation correction; 2) the co-registered dynamic six frames were then averaged to generate a single 30 min PET image; 3) the 30-min PET image was reoriented to a standard 160×160×96 voxel image grid with 1.5 mm cube voxels, followed by intensity normalization; and finally 4) the above image was smoothed with a scanner-specific filter. The resulting PET image was identified with “AV45 Coreg, Avg, Std Img and Vox Siz, Uniform Resolution” as in ADNI.
Depending on the type of scanner used, the MRI image underwent some or all of the correction steps in the following order: 1) Correction of the image geometry distortion due to gradient non-linearity (Gradwarp); 2) Correction of non-uniformity of the image intensity by employing the B1 calibration scans (i.e., the B1 field inhomogeneity correction); and 3) Reduction of the intensity non-uniformity due to the wave or the dielectric effect (i.e., non-parametric non-uniformity intensity normalization method or N3) by applying a histogram peak sharpening algorithm to the MRI, resulting in a pre-processed MRI labeled with “N3” as in ADNI. Details of PET and MRI data acquisition and pre-processing steps can be found on the ADNI website (http://adni.loni.usc.edu).
Image processing
The MRI scans were post-processed using the FreeSurfer (V5.3) software [18]. In retrospect, the MRI was first mapped to the standard MNI 305 space (T1.mgz), followed by skull stripping, segmenting, and delineating the cortical and subcortical regions. The CTh was then calculated for each of the 68 cortical regions (34 per hemisphere), so was the volume of each of the 45 subcortical regions in the brain. The segmentation and parcellation information was then saved in the aparc+aseg.mgz image.
AV45 PET was linearly co-registered onto the T1 image using the FMRIB Software Library (FSL) [19]. This guaranteed the AV45 PET image to have the same accuracy in segmentation and parcellation as in the MRI modality, making it possible to evaluate the extent of regional atrophy in relation to the Aβ load in corresponding brain regions.
Severity of change in cortical thickness between CN and AD patients
The percent difference of CTh between CN and AD subjects (% CThDiff) for those with and without the E4 allele was calculated using (1) for each of the 68 brain regions separately.
Amyloid load computation
The mean Aβ standardized uptake value (SUV) of each FreeSurfer-defined region (ROI) was first calculated from the co-registered PET with the aparc+aseg image using Equation (3).
The whole cerebellum, consisting of left/right cerebellum white matter and left/right cortex regions, was considered as the reference region in this study. Its SUV was computed using the volume-weighted mean as expressed in Equation (4).
The Aβ standardized uptake value ratio (SUVR) for each cortical ROI was then obtained using Equation (5) as a measure of the Aβ load for that specific ROI.
The global Aβ load was computed in the same way as for SUV c erebellum, i.e., the volume-weighted mean of rSUVRs for all 68 cortical ROIs. The widely used threshold value of 1.11 is used in this case to delineate amyloid (Aβ) positive (Aβ+) from amyloid Aβ negative (Aβ–) status [20–22].
Statistical analysis
To compare subjects’ characteristics between matched CN and AD participants, a series of Student’s t-tests were employed for age, years of education, and for the cognitive tests that include Mini-Mental State Examination (MMSE) and Clinical Dementia Rating-Sum of Boxes (CDR-SB); while a series of Chi-square tests were used to account for gender, APOE4 status, and global amyloid load status.
The association between % CThDiff and rCThCN across 68 cortical regions was examined using linear regression, as well as Pearson correlation, separately for E4+ and E4–participants. The comparative strength of the magnitude between these correlations was examined using the two-tailed Fisher’s z transformation.
A similar set of procedures was applied to examine the magnitude of correlations between % CThDiff and rCThCN across the 68 cortical regions for all Aβ+ and Aβ–subjects.
All statistical analyses were performed using R software (R 3.3.3) [23] with the statistical significance level was set at p < 0.05.
RESULTS
As shown in Table 1, there was no significant difference between CN and AD subjects, with regards to age, gender, the incidence of E4+, or years of education. However, the incidence of Aβ+ was higher among AD than CN subjects. Table 2 provides the mean regional CTh for the CN and AD groups and % CThDiff in the left hemisphere comparing E4+ and E4–subjects.
CTh in the CN and AD Groups, as well as % mean differences between CN and AD groups (% CThDiff), for E4+ and E4–subjects
aValues are represented as mean (SD) for all continuous attributes. bp-values are for t-test between E4+ and E4–.
Associations between rCThCN and regional % CThDiff for E4+ and E4–subjects
As can be observed from Table 3 and Fig. 1, results indicate that greater rCThCN is associated with greater % CThDiff for both E4+ subjects (r = 0.639, p < 0.001) and E4–subjects (r = 0.768, p < 0.001).
Associations of rCThCN with % CThDiff for E4+ and E4–groups
aLinear regression model: %CTh Diff = α + β rCTh rCTh CN . bp-value: *p < 0.05; **p < 0.01; ***p < 0.001.
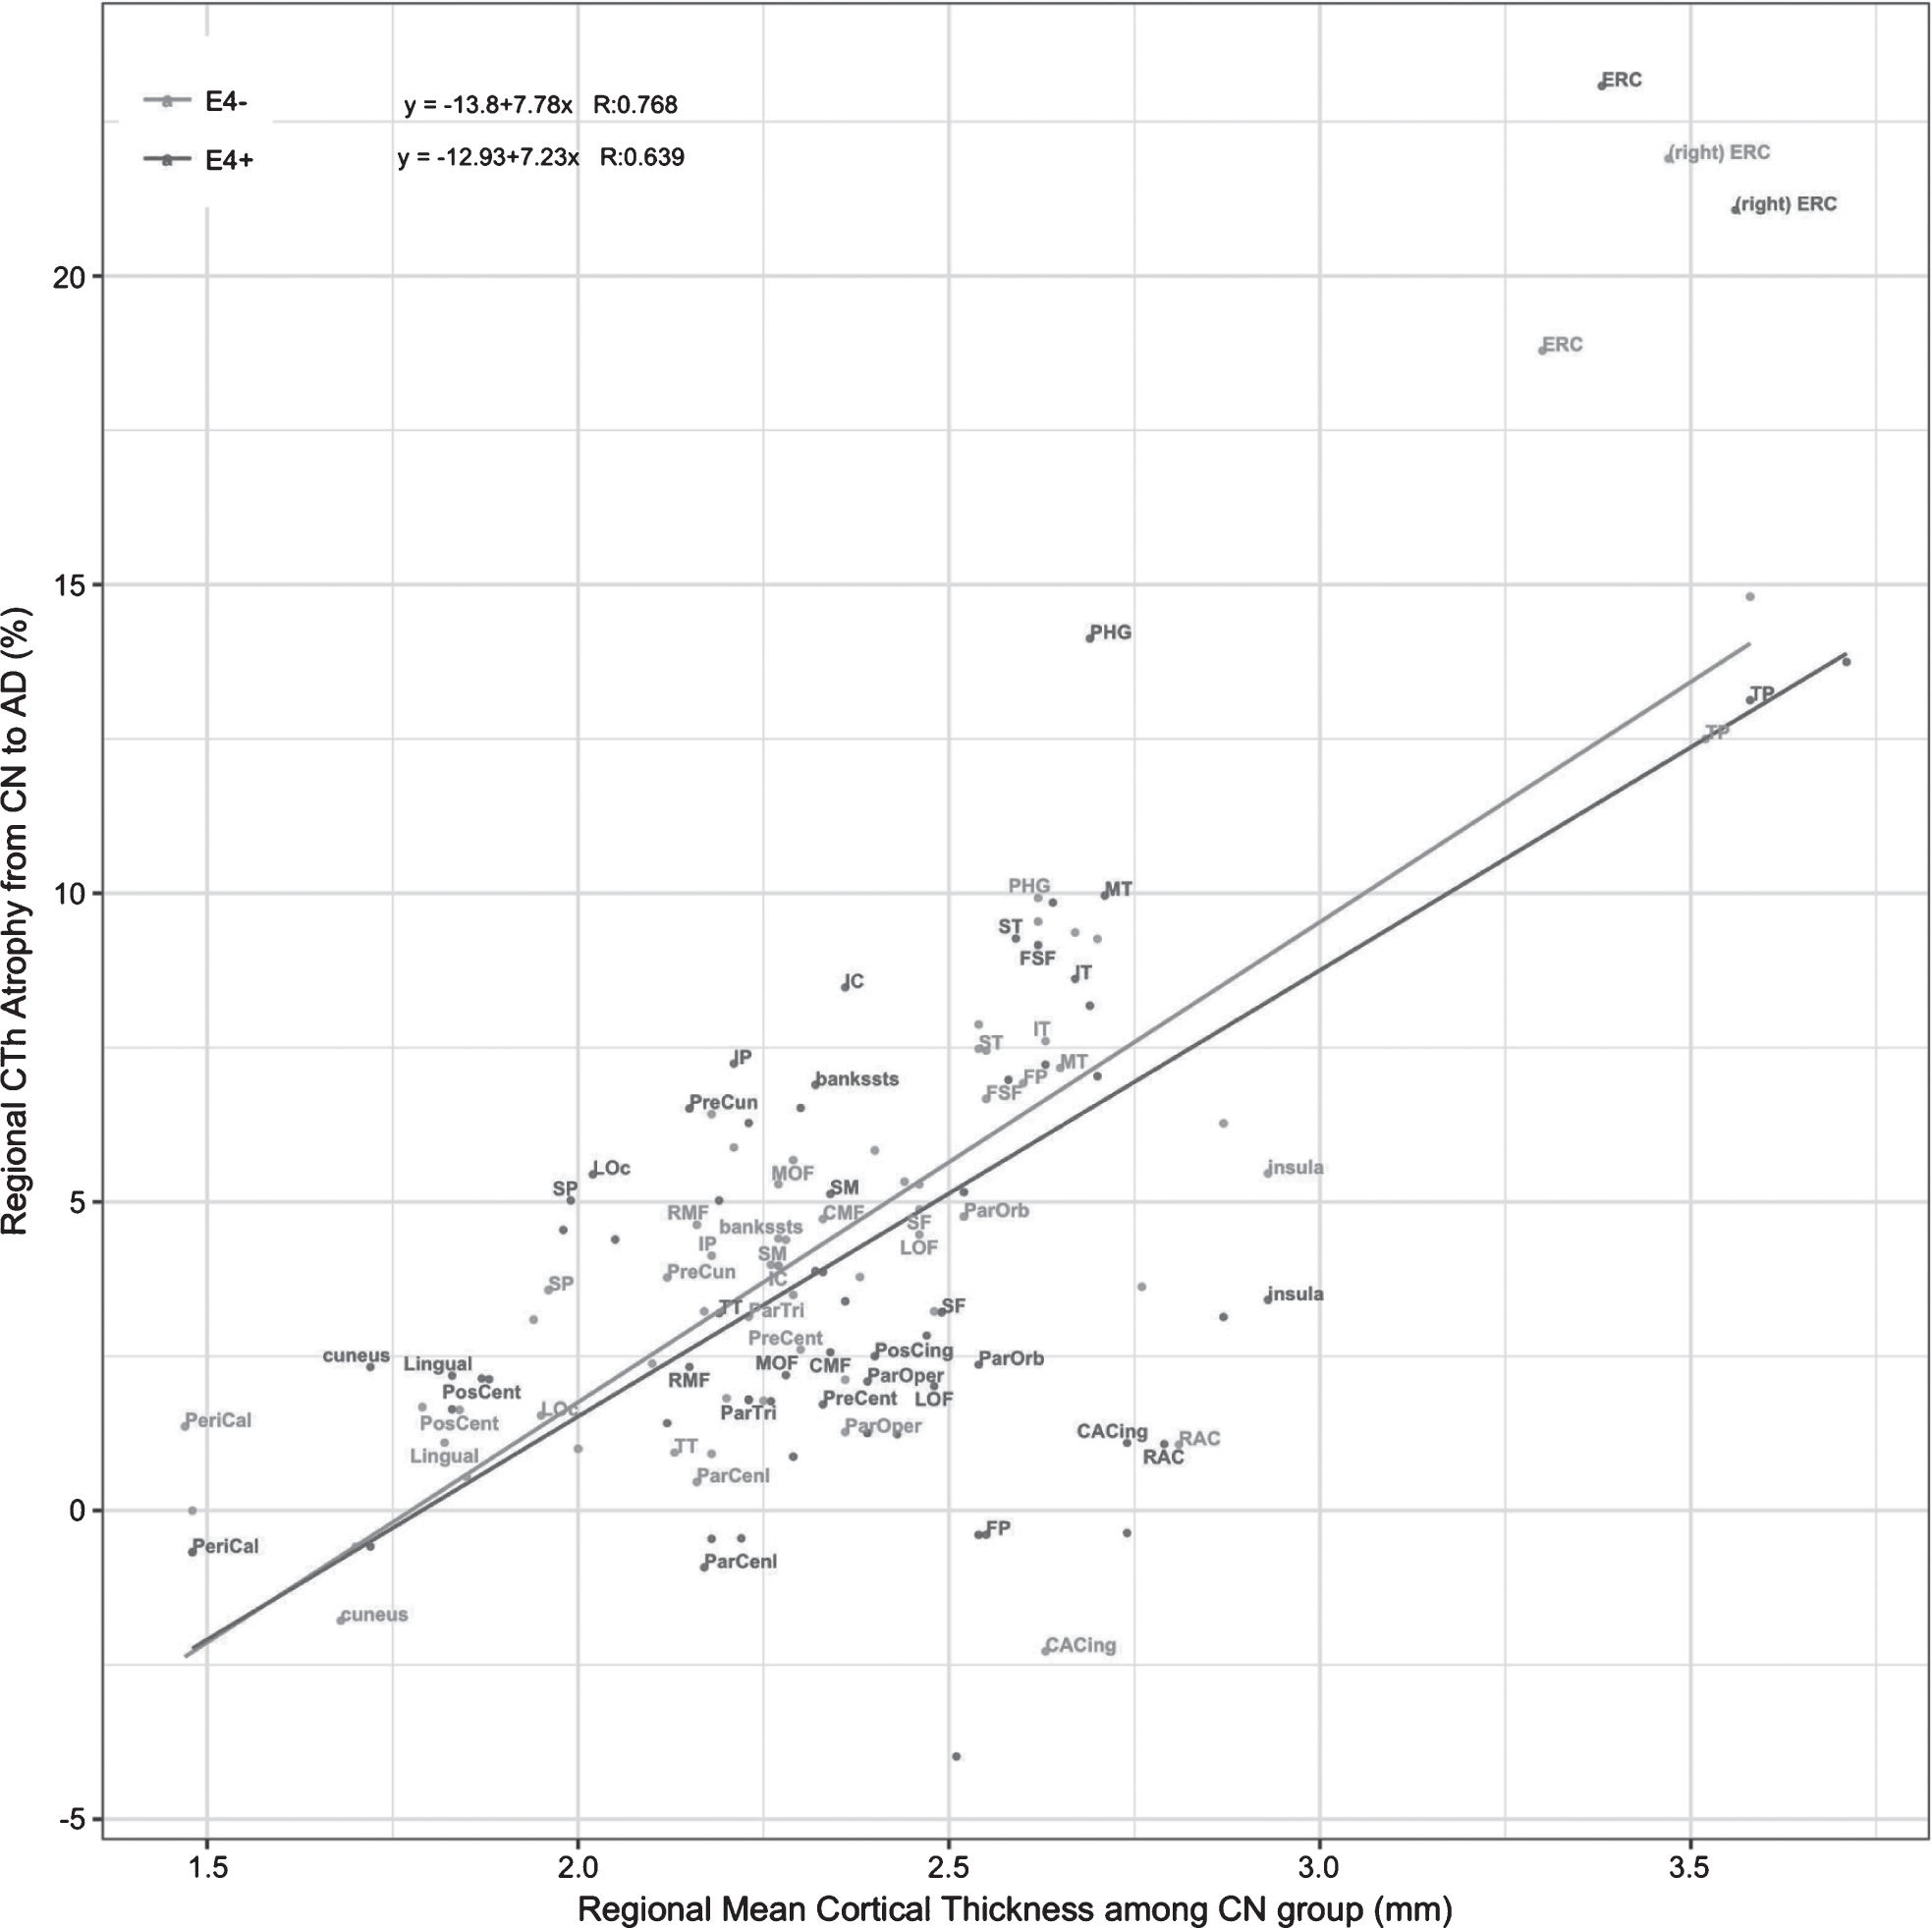
Plot of rCThCN and % CThDiff with the estimated linear regression model for the E4+ and E4–groups. R is the correlation coefficient for the Pearson correlation. bankssts, banks of the superior temporal sulcus; CAC, caudal anterior cingulate; CMF, caudal middle frontal; ERC, entorhinal cortex; IP, inferior parietal; IT, inferior temporal; IC, isthmus cingulate; LO, lateral occipital; LOF, lateral orbitofrontal; MOF, medial orbitofrontal; MT, middle temporal; PHG, parahippocampal; POP, pars opercularis; POB, pars orbitalis; PTG, pars triangularis; PC, posterior cingulate; RAC, rostral anterior cingulate; RMF, rostral middle frontal; SF, superior frontal; SP, superior parietal; ST, superior temporal; SM, supramarginal; FP, frontal pole; TP, temporal pole; TT, transverse temporal. Except for the ERC, only ROIs in the left hemisphere were labeled since the similar patterns are observed in the right hemisphere.
We compared the magnitude of the Pearson correlation coefficients for E4+ versus E4–groups using Fisher’s z-transformation. Results showed no difference in the magnitude of the correlation coefficient between the E4+ and E4–groups (z = –1.469; p = 0.142).
Associations between rCThCN and regional % CThDiff for Aβ+ and Aβ–subjects
Table 4 provides the mean regional CTh for the CN and AD groups and % CThDiff in the left hemisphere comparing Aβ+ and Aβ–subjects.
CTh in the CN and AD Groups, as well as % mean differences between CN and AD groups (% CThDiff), for Aβ+ and Aβ–subjects
aValues are represented as mean (SD) for all continuous attributes. bp-values are for t-test between Aβ+ and Aβ–.
For these associations, the correlation coefficients obtained were 0.613 (p = 2.82e-08) for the Aβ+ group and 0.831 (p < 2.2e-16) for the Aβ–group, which showed significant difference using the Fisher’s z-test (z = –2.724; p = 0.0065) (Fig. 2).

Plot of rCThCN and % CThDiff with the estimated linear regression model for the global amyloid positive (Aβ+) and negative (Aβ–) groups. R is the correlation coefficient for the Pearson correlation. Only ROIs in the left hemisphere were labeled. bankssts, banks of the superior temporal sulcus; CAC, caudal anterior cingulate; CMF, caudal middle frontal; ERC, entorhinal cortex; IP, inferior parietal; IT, inferior temporal; IC, isthmus cingulate; LO, lateral occipital; LOF, lateral orbitofrontal; MOF, medial orbitofrontal; MT, middle temporal; PHG, parahippocampal; POP, pars opercularis; POB, pars orbitalis; PTG, pars triangularis; PC, posterior cingulate; RAC, rostral anterior cingulate; RMF, rostral middle frontal; SF, superior frontal; SP, superior parietal; ST, superior temporal; SM, supramarginal; FP, frontal pole; TP, temporal pole; TT, transverse temporal.
DISCUSSION
Regional cortical thickness (CTh) has been found to vary considerably across regions in human and primate brains, with primary sensory cortices being thinner than motor regions, which in turn are thinner than association cortices [24]. Normal aging is accompanied by global as well as regional structural changes. It has been demonstrated that using both CTh and volumetric measures, the prefrontal cortex, and to a lesser extent the premotor and parietal cortex, are among regions most sensitive to normal age-related thinning. In contrast, the entorhinal cortex, temporal pole and parahippocampal regions paradoxically show increases in cortical thickness in normal aging [17, 26]. Moreover, higher regional Aβ accumulation in the cortex in older individuals is associated with greater regional cortical thinning [27]. In the current study, the age-related change in brain atrophy was accounted for using the age-equivalent CN and the AD group from the ADNI sample to examine those factors that pertained to selective vulnerability for neurodegeneration associated with AD.
Our main findings are that: 1) regions with the greatest CTh at the CN stage are aggregated in regions which have been found to be most vulnerable to neurodegeneration in AD, namely regions in the medial temporal lobe, including the temporal pole, ERC, parahippocampal gyrus, fusiform and the middle and inferior temporal gyrus; 2) regions with the lowest CTh in the CN stage were aggregated in regions which tend to be least vulnerable to neurodegeneration, namely the pericalcarine region, cuneus, and the postcentral; 3) % CThDiff was positively correlated to rCThCN, even after adjusting for the effect of global Aβ load; and 4) there was no overall effect of the APOE4 genotype on the association between the rCThCN and % CThDiff.
Regions such as the ERC and the temporal pole, which were regions with the greatest CTh (between 3.3 and 4 mm in the CN stage), had 12% to 24% greater CTh in CN stage than in the AD stage. In contrast, regions such as the pericalcarine region and the postcentral gyrus had CTh which were between 1.5 to 2 mm in the CN stage, had 0 to 5% greater CTh in the CN stage than in the AD stage (Table 2 and Fig. 1). These findings suggest that greater CTh in the CN stage may be a potential marker of greater vulnerability to subsequent neurodegeneration due to AD.
These findings initially appear divergent with a study by Sabuncu et al. on the ADNI population, which examined the association of a polygenic risk score to CTh in CN subjects and showed that a higher polygenic risk score was associated with decreased CTh among seven AD vulnerable regions [28]. However, further examination of the associations between the polygenic risk score and CTh in individual studied regions showed that the ERC had the greatest CTh among the seven regions studied and showed no association to the polygenic risk score. In contrast, the posterior cingulate region, which was the only individual region showing a significant association between CTh and the polygenic risk score in the study by Sabuncu et al., was in our study the least vulnerable to neurodegeneration of these seven regions to neurodegeneration (% CThDiff = 2.5% for E4+) and had the least CTh in the CN stage (Table 2). As such, the results of the study by Sabuncu et al. are not inconsistent with the notion that greater CTh in the CN stage is associated with greater vulnerability to neurodegeneration. The polygenic risk score appears to confer susceptibility to neurodegeneration by a mechanism which is independent of the mechanism associated with greater cortical thickness.
The medial temporal lobe regions, including the ERC and parahippocampal gyrus receive highly processed input from every sensory modality, as well as input relating to ongoing cognitive processes. This information remains at least partially segregated among the different sensory visual, auditory, olfactory, gustatory, and tactile information from the neocortex and distributes it in a coded fashion to the hippocampus. The superficial layers of the ERC project to the dentate gyrus and hippocampus, with Layer II projecting primarily to the dentate gyrus and hippocampal region CA3, and layer III projecting primarily to hippocampal region CA1 and the subiculum. Spatially sensitive cells in layer II of the ERC have a crucial role in many spatially complex operations, including navigation and judging speed and accuracy of movements [29–33].
There is substantial evidence to support the notion that brain regions with greater cortical thickness are associated with great interconnectivity of those regions. Greater CTh in the ERC and perirhinal cortex most likely represents the greater number of neurons, synapses and complexity of operations which are routinely performed by these brain regions [34]. Greater CTh in medial temporal regions has been shown to be associated with better performance on verbal memory tasks and greater activation in these regions on functional MRI scans, in elderly CN subjects [35]. Progression of neurodegenerative pathology appears to occur preferentially in brain regions with the greatest connectivity and trafficking. For example, Seeley et al. have shown a direct link between intrinsic connectivity and gray matter structure across healthy individuals and have described nodes within each functional network which “exhibited tightly correlated gray matter volumes”. Seeley et al. concluded that their findings suggest that “human neural networks can be defined by synchronous baseline activity, and selective vulnerability to neurodegenerative illness” [36]. The aggregation of misfolded disease proteins arises inside small, selectively vulnerable neuron populations in certain brain regions [37–39] and, as evidenced in human spongiform encephalopathies, conformational changes in misfolded prion protein results in disease propagation along the most active trans-synaptic connections [40]. Neuropathological [4], neuroimaging [41, 42], and transgenic animal models [43], all suggest that neurodegeneration may relate to neural network dysfunction [42, 44], and selective vulnerability of specific brain regions may represent their status as hubs in very active networks.
In this study we have shown that the regions most prone to AD pathology, such as ERC, parahippocampal, and temporal pole [45–48], had the greatest degree of atrophy related to AD and the greatest baseline CTh in the CN stage. Parenthetically, these regions also evidenced the least Aβ load. Conversely, other AD vulnerable regions, such as posterior cingulate, precuneus, inferior parietal, and isthmus cingulate, which are regions with the greatest Aβ burden, had less severe atrophy. This discrepancy between the amount of regional Aβ deposition and regional reduction of CTh in patients with AD has been described previously [49]. These findings are consistent with the prevailing view that Aβ deposition initiates or acts as a catalyst for neurodegeneration indirectly, by initiating neurodegeneration in brain regions such as the ERC, which are most vulnerable to AD pathology, and subsequently inducing spread of this pathology to other vulnerable regions, such as the precuneus and posterior cingulate gyrus [50].
The significant association of larger rCThCN and greater atrophy, accounting for the effect of Aβ burden, agrees with the findings in a previous study [51], which may add credence to the belief that Aβ does not play a leading role in brain atrophy [50]. Instead, tau pathology, inflammation, or disturbance in axonal transport processes may contribute to the ongoing neurodegeneration. The impact of APOE4 carrier status on neurodegeneration was found not to be significant, in comparison to the risk associated with greater regional CTh. Both the E4+ and E4–subjects showed a strong association between CTh in the CN stage and the propensity for neurodegeneration (Fig 1).
The main strength of this cross-sectional study is the availability of Aβ biomarkers and APOE genotypes in this ADNI cohort, which allowed for various factors to be assessed in this analysis of selective vulnerability. Aging and AD may have overlapping effects on atrophy in specific cortical regions [52, 53]. However, in this study, based on the age equivalent CN and AD groups, the effects of AD-specific changes were independent of age-related progressive atrophy.
Although it may be argued that a weakness of this study is that it is a cross-sectional analysis, since it was not feasible in the current ADNI cohort to conduct a longitudinal analysis, mainly because of lack of a sufficient number of CN individuals who have progressed to AD dementia in order to relate cortical thickness in the CN state to changes in cortical thickness in the AD state. The missing data challenge and the issues of follow up and drop out of subjects inherent of any longitudinal compounded by the fact that we also needed to use Aβ biomarkers and APOE genotypes in this ADNI cohort led us to this realistic cross-sectional study that in our view still provided interesting findings.
Conclusion
In this study we have shown that regions most prone to AD pathology, such as ERC, parahippocampal, and temporal pole, had the greatest degree of cortical thinning related to AD and the greatest baseline cortical thickness in the CN stage. Incidentally, these regions have shown the least Aβ load. However, AD vulnerable regions with the greatest Aβ burden, such as the posterior cingulate, precuneus, inferior parietal, and isthmus cingulate had on the other hand less severe atrophy. Moreover, there is evidence for a strong positive association between rCThCN and the severity of neurodegeneration (% CThDiff) in all brain regions. While we do not have an explanation for greater selective vulnerability for neurodegeneration of brain regions having the greatest CTh in the CN stage, we propose that, among other factors, greater CTh is associated with higher synaptic density, greater connectivity and complexity of function, which are factors that have been associated with a greater propensity to neurodegeneration. Other factors, such as disturbance in axonal transport, or inflammatory processes, in the presence of plaques and neurofibrillary tangles may also play a role in mediating the interaction between greater CTh, greater connectivity and complexity of function and propensity for neurodegeneration.
Footnotes
ACKNOWLEDGMENTS
This work was supported by the National Science Foundation (NSF) grants CNS-1532061, CNS-1429345, CNS-1551221, CNS 1338922. The research has also been supported through the Florida Department of Health, Ed and Ethel Moore Alzheimer’s Disease Research Program, and the 1Florida Alzheimer’s Disease Research Center (ADRC) (1P50AG047266-01A1) and R01 AG047649-01A1. Support from the Ware Foundation and the FIU UGS Dissertation Year Fellowship for Ms. Chunfei Li are also appreciated.
Data collection and sharing for this project was funded by the Alzheimer’s Disease Neuroimaging Initiative (ADNI) (National Institutes of Health Grant U01 AG024904) and DOD ADNI (Department of Defense award number W81XWH-12-2-0012). ADNI is funded by the National Institute on Aging, the National Institute of Biomedical Imaging and Bioengineering, and through generous contributions from the following: AbbVie, Alzheimer’s Association; Alzheimer’s Drug Discovery Foundation; Araclon Biotech; BioClinica, Inc.; Biogen; Bristol-Myers Squibb Company; CereSpir, Inc.; Cogstate; Eisai Inc.; Elan Pharmaceuticals, Inc.; Eli Lilly and Company; EuroImmun; F. Hoffmann-La Roche Ltd and its affiliated company Genentech, Inc.; Fujirebio; GE Healthcare; IXICO Ltd.; Janssen Alzheimer Immunotherapy Research & Development, LLC.; Johnson & Johnson Pharmaceutical Research & Development LLC.; Lumosity; Lundbeck; Merck & Co., Inc.; Meso Scale Diagnostics, LLC.; NeuroRx Research; Neurotrack Technologies; Novartis Pharmaceuticals Corporation; Pfizer Inc.; Piramal Imaging; Servier; Takeda Pharmaceutical Company; and Transition Therapeutics. The Canadian Institutes of Health Research is providing funds to support ADNI clinical sites in Canada. Private sector contributions are facilitated by the Foundation for the National Institutes of Health (![]() ). The grantee organization is the Northern California Institute for Research and Education, and the study is coordinated by the Alzheimer’s Therapeutic Research Institute at the University of Southern California. ADNI data are disseminated by the Laboratory for Neuro Imaging at the University of Southern California.
). The grantee organization is the Northern California Institute for Research and Education, and the study is coordinated by the Alzheimer’s Therapeutic Research Institute at the University of Southern California. ADNI data are disseminated by the Laboratory for Neuro Imaging at the University of Southern California.
The authors have no conflict of interest to report.