
Abstract
Alzheimer’s disease (AD) is a neurodegenerative disease characterized by the deposition of amyloid-β peptides (Aβ). Aβ accumulation leads to the formation of neurofibrillary tangles, inflammation, axonal injury, synapse loss, and neuronal apoptosis. Thus, reducing Aβ levels should exert a neuroprotective effect against AD. Ginsenoside Rf, an extract from Panax notoginseng, has potent anti-fatigue, anti-nociception, anti-oxidation, and anti-inflammation properties. However, it is unclear whether ginsenoside Rf is effective in the treatment of AD. Here, we reported that ginsenoside Rf could significantly attenuate Aβ-induced apoptosis in N2A cells, as reflected by a dramatic increase in mitochondrial membrane potential and decrease in Ca2 + concentration, reactive oxygen species, and active caspase-3 expression. Meanwhile, ginsenoside Rf could alleviate the Aβ-induced inflammation reaction, such as the decrease of interferon-gamma (IFN-γ) and active caspase-1 expression and the increase of interleukin-13. Furthermore, we also found that Rf is able to accelerate Aβ clearance and subsequently reduces Aβ level in N2A cells stably transfected with human Swedish mutant APP695 (N2A-APP). More importantly, daily Rf treatment (20 mg/kg, i.p.) throughout the experiment dramatically improved spatial learning and memory in Aβ42-induced mouse model of AD. Taken together, these results indicate that ginsenoside Rf may decrease Aβ-induced neurotoxicity and memory decline via anti-inflammatory response during AD development, suggesting that Rf may be a potential therapeutic agent for treating AD.
INTRODUCTION
Alzheimer’s disease (AD) is one of the most common cause of dementia in the elderly, which is pathologically characterized by extracellular accumulation and deposition of amyloid-β peptides (Aβ), intracellular neurofibrillary tangles, and neuronal death [1, 2]. Although the pathogenesis of AD remains largely unclear, a growing body of evidence supports that AD can be caused by neuroinflammation [3], oxidative stress [4], mitochondrial dysfunction [5], and so on. In turn, Aβ accumulation can accelerate neuronal apoptosis [6], neuroinflammation [7], neurofibrillary tangles [8], axonal injury, and synapse loss [9]. Despite the fact that all of the drugs targeting Aβ, to date, have failed to reach their primary efficacy end-points in clinical trials, numerous researches from laboratories and clinics have indicated that an imbalance between production and clearance of Aβ peptides is an initiating factor in AD [10–12]. Thus, reducing Aβ level should be a primary therapeutic approach to AD.
Ginseng root, a traditional Chinese medicine for over 2000 years, contains more than a dozen biologically active components called ginsenosides, including Rb, Rd, Re, Rf, Rg, Rh, etc. Interestingly, a number of studies have revealed that ginsenosides and their metabolites/derivatives exert anti-inflammatory activities in inflammatory responses. For example, Rb1 inhibits lipopolysaccharide (LPS)-stimulated tumor necrosis factor-alpha (TNF-α) production and nuclear transcription factor κB (NF-κB) activation in RAW264.7 cells [13, 14]. Rd also can suppress LPS-induced NF-κB activation and TNF-α expression in N9 cells [15]. Rf significantly inhibits TNF-α that was induced in HT-29 cells or LPS-induced RAW264.7 cells by inhibiting NF-κB via the p-38 MAPK pathway [16]. Rg1 suppresses the NF-κB signal pathway both in vivo and in vitro [17, 18]. Since neuroinflammation may accelerate the process of AD, it is reasonable to propose that ginsenosides may a potential therapeutic agent for AD via suppressing the production of proinflammatory cytokines and regulating the activities of inflammatory signaling pathways. Indeed, previous reports have shown that Rb1 [19], Rd [20], Re [21], Rg1 [22], Rg2 [23], and many other kinds of ginsenosids are able to decrease the deposition of Aβ peptides and reduce the phosphorylation of tau protein. However, it remains unknown whether ginsenosid Rf could ameliorate the neuropathology of AD by inhibiting neuroinflammation. In this study, we examined the neuroprotective effects of Rf on Aβ-induced neurotoxicity both in vitro and in vivo.
MATERIALS AND METHODS
Cell culture and treatment
Mouse neuroblastoma cell line N2A was cultured in 47% Dulbecco’s modified Eagle’s medium (DMEM) (Gibco) and 47% Opti-MEM (Gibco), supplemented with 5% fetal bovine serum (FBS) as previously described [24]. The N2A-APP cells were obtained from Professor Chunjiu Zhong (Fudan University, Shanghai, China), and maintained in 90% DMEM and 10% FBS with 100μg/ml of G418. All cells were maintained at 37°C in 5% CO2 atmosphere.
Aβ42 peptide (GL Biochem Ltd, Shanghai, China) was dissolved in PBS, and shaken at 37°C for 36 h to enhance oligomer formation. Rf was purchased from MUST company (Chengdu, China). Caspase-1 selective inhibitor AC-YVAD-CMK was purchased from Sigma (St. Louis, MO, USA). Both Rf and AC-YVAD-CMK were dissolved in PBS at required concentration.
Cell viability assay
N2A cells were seeded in 96-well plates (1×10⁴ cells per well) in the presence of the ginsenoside Rf at the increasing doses (0, 1, 5, 10, 20, 50, and 100μM). After 24 h, cell viability was measured using the 3-(4,5-dimethyl-2-thiazolyl)-2,5-diphenyl-2-H-tetrazolium bromide (MTT) assay. The plate was incubated at 37°C for 4 h with 0.5 mg/ml MTT and added 150μl of dimethyl sulfoxide (DMSO) to dissolve the dark blue formazan crystals. The absorbance was measured by a microplate reader at 490 nm.
Quantitative Real-Time PCR
Total RNA was extracted from the cell using Trizol reagent (Takara, Otsu, Shiga, Japan) and detected the concentration and purity of total RNA with a spectrophotometer NanoDrop 2000 (Nanodrop Technologies, Wilmington, DE, USA) as previously described [25]. One microgram of total RNA was used to perform synthesis of the first-strand complementary DNA (cDNA) with Prime Script RT reagent Kit with gDNA Eraser (Takara) reverse transcriptase (Takara) and RNAsin (Takara). Quantitative real-time PCR analysis of the cDNA was performed using SYBR ® Premix Ex Taqtrademark II (Takara) with CFX Managertrademark software detection system (Bio-Rad). Primer sequences were as follows: Interferon-γ (IFN-γ) (forward: 5′-CTCAAGTGGCATAGATGT-3′, reverse: 5′-GAGATAATCTGGCTCTGCAGGATT-3′); IL-13 (forward: 5′-AGCATGGTATGGAGTGTGGACCTG-3′, reverse: 5′-CAGTTGCTTTGTGTAGCTGAGCAG-3′); β-actin (forward: 5′-GCACCACACCTTCTACAATGAGC-3′, reverse: 5′-GGATAGCAGCCTGGATAGCAAC-3′).
Western blot assay
The cells were washed with ice-cold PBS and then lysed in RIPA lysis buffer containing a cocktail of complete protease inhibitors (Roche), and centrifuged (4°C, 10 000 rpm, 15 min) to collect the supernatants. The protein concentrations were determined with a BCA protein assay reagent (Thermo Fisher Scientific, Waltham, MA, USA) according to manufacturer’s instructions. The same amount of protein samples (30μg) from each tube was boiled in 5×loading buffer for 10 min at 95°C. The samples were then separated on 10% tris-glycine SDS-PAGE gels and transferred onto immobilon-PTM polyvinylidene fluoride (PVDF) membranes. To block nonspecific background, the membranes were incubated in 5% non-fat milk in Tris-buffered saline containing 0.1% Tween-20 (TBST) at 37°C for 1 h.
The target proteins were immunoblotted with primary antibody overnight at 4 °C to APP (1:1000, obtained from professor Weihong Song in the University of British Columbia, Vancouver, Canada), caspase-1 (1:1000, Abcam), caspase-3 (1:1000, CST), p-caspase-3 (1:1000, CST), p-tau396 (1:1000, Abcam), PS1(1:1000, Abcam), and BACE1 (1:1000, CST), followed by incubation with secondary antibody (1:3000; Abcam) at 37°C for 1 h. The blots were imaged by the Bio-Rad Imager using ECL Western blotting substrate (Pierce). The relative level of target protein is expressed as the percentage between intensity of target protein and that of marker protein, β-actin (1:3000, Sigma). The band intensity of each protein was quantified by the Bio-Rad Quantity One software.
Measurement of mitochondrial membrane potential (MMP)
The cells were made into 1×10⁷/L monoplast suspension digested with the 0.25% trypsin. MMP was estimated by a fluorescence assay with fluorescent dye Rhodamine123 (Rh123, aladdin, China). Monoplast suspension of cell was incubated for 30 min at 37°C with PBS containing 10 mM Rh123. After being washed with 1×PBS, it was centrifuged at 1000 r/min for 10 min. Then the cells were suspended into PBS. The fluorescence intensity was measured by flow cytometry (FACS) using a Coulter Flow Cytometer (BD, FACS Vantage, SE) with excitation and emission wave-lengths of 488 nm and 520 nm, respectively. For each sample, 10,000 cells were taken to detect MMP by using Cell Quest Software. The data was exported with the mean fluorescence intensity (MFI).
Measurement of calcium concentration
The concentration of Ca2 + was measured by FACS using the Ca2 +-sensitive dyes, fluo-3/AM (Beyotime, China). Monoplast suspension of cell was incubated with 5 mM fluo-3/AM solution for 30 min at 37°C. After being washed twice with 1×PBS, it was centrifuged at 1000 r/min for 10 min. Then the cells were suspended in PBS buffer. The fluorescence intensity was analyzed by FACS.
Measurement of reactive oxygen species (ROS)
The reactive oxygen species was assayed by DCFH-DA (Nanjing Jiancheng Bioengineering, China). Briefly, the cells were grown on a 6-well plate to ∼90 density, and then incubated with 10μM DCFH-DA in culture mediums for 30 min. The cells were made into 1×10⁷/L monoplast suspension digested with the 0.25% trypsin. After being washed twice with 1×PBS, it was centrifuged at 1000 r/min for 10 min. Then cells were suspended into PBS. The fluorescence intensity was measured by FACS.
Aβ ELISA assay
After treatment, cell lysates were collected to detect Aβ40 and Aβ42. The Aβ40 and Aβ42 concentrations were quantified by ELISA kits following the manufacturer’s protocol. Briefly, the plate was washed twice with wash buffer prior to use, then added samples per well and incubated for 2 h at 4°C, and each well was washed four times with washing buffer. Then the conjugate antibody solution was added and incubated at 4°C for 2 h. After washing 4 times, substrate solution was added into each well, and incubated for 30 min at room temperature in the dark. Following adding stop solution, the samples were measured at 450 nm by a microplate reader (Bio Tek SynergyTM H1, USA).
Behavioral tests
Male C57Bl/6 mice (22–25 g body weight at the beginning of the experiment) were obtained from Charles River (Beijing Office, China) and maintained at Children’s Hospital of Chongqing Medical University Animal Care Centre. Mice were housed under 12 h light and 12 h dark cycle (lights on from 7:00 a.m. to 7:00 p.m.) with free access to food and water in a temperature and humidity controlled room. All procedures were performed in accordance with Chongqing Science and Technology Commission guidelines for animal research and approved by the Chongqing Medical University Animal Care Committee, and every effort was made to minimize both the animal suffering and the number of animals used.
Mice were deeply anesthetized with sodium pentobarbital at a dose of 60 mg/kg (i.p.) within its home cage. Scalp skin was shaved with clippers and disinfected using iodine before the mouse was mounted on a stereotaxic instrument (Stoelting Co., USA). The core temperature was monitored and kept at 36.5±0.5°C. After opening the scalp skin and exposing the skull, the incubated Aβ42 peptides (100μM, 2.5μl/mouse)or PBS were injected in left lateral ventricle (0.6 mm posterior, 1.1 mm lateral, and 2 mm ventral from bregma) with a 10μl syringe at a rate of 1μl/min as described previously [26]. Then mice were randomly divided into four subgroups: PBS+PBS (control), PBS+Rf (Rf), Aβ+PBS (Aβ) and Aβ+Rf. For the control and Aβ group, animals received vehicle (5 ml/kg, i.p.) treatment daily. Mice in Rf and Aβ+Rf group were subjected to Rf (20 mg/kg, i.p.) treatment from two weeks before to the end of behavioral tests.
Two weeks after Aβ treatment, novel object recognition test was performed as our previous report with some modifications [26, 27]. Briefly, mice were placed into the 40×40 cm2 open box for 5 min adaption before the test. On the next day, mice were placed in the box to explore two identical objects for 5 min, and then returned to their home cage. Two hours later, one of the equal objects was replaced by a novel, unfamiliar object. Animals were placed back in the arena to freely explore for 5 min. To eliminate olfactory cues, the arena and objects were cleaned thoroughly with 70% ethanol. The occurrence of head dips to the objects was manually scored and the recognition index (RI) was calculated. The RI was calculated by using the equation: RI = the number of head dips to novel object/total number of head dips to both objects×100%.
Two days after novel object recognition test, the animals were performed the Morris water maze test in a circular stainless steel pool (150 cm in diameter) filled with water (25±1°C) made opaque with nontoxic white paint as previously described [26, 28]. The pool was surrounded by light blue curtains, and 3 distal visual cues were fixed to the curtains. A CCD camera suspended above the pool center recorded the swim paths of the animals, and video output was digitized by an Any-maze tracking system (Stoelting). Twenty-four hours before spatial training, the animals were allowed to adapt to the maze for a 120-s free swim. The animals were then trained in the spatial learning task for 4 trials per day for 5 consecutive days. Twenty-four hours after the final training trial, a probe test was conducted with the hidden platform absent for 120 s, and their swim path was recorded.
Statistical analysis
All data are presented as the mean±SEM, analyzed with one-way ANOVAs followed by post hoc Turkey’s tests where appropriate with drug treatment as the between-subjects factor. The significance level was set at p < 0.05.
RESULTS
Effects of ginsenoside Rf on cell survival in Aβ-treated N2A cells
To examine the influence of Rf on cell survival, we treated the N2A cells with Rf at different concentrations from 0 to100μM for 24 h, and then determined cell viability by the MTT assay. The results showed that Rf had no effect on cell viability at all different concentrations (1μM: 102.6±3.1% relative to 0μM, p > 0.05 versus 0μM; 5μM: 94.8±4.1% relative to 0μM, p > 0.05 versus 0μM; 10μM: 99.1±12.4% relative to 0μM, p > 0.05 versus 0μM; 20μM: 105.1±11.3% relative to 0μM, p > 0.05 versus 0μM; 50μM: 104.5±12.7% relative to 0μM, p > 0.05 versus 0μM; 100μM: 107.0±16.3% relative to 0μM, p > 0.05 versus 0μM; Fig. 1A). We next further investigated the effect of Rf on Aβ-induced cell death. After pretreatment of Aβ (10μM) for 4 h, N2A cells were treated with Rf (0–100μM) for 20 h in the presence of Aβ. The results showed that Aβ treatment markedly decreased cell viability (Aβ+0μM: 71.3±7.9% relative to control, p < 0.05 versus control; Fig. 1B). Treatment with 20μM or higher concentration of Rf significantly reduced Aβ-induced the decrease of cell viability (Aβ+1μM: 80.5±7.7% relative to control, p < 0.05 versus control, p > 0.05 versus Aβ+0μM; Aβ+5μM: 87.7±7.3% relative to control, p < 0.05 versus control, p > 0.05 versus Aβ+0μM; Aβ+10μM: 88.9±3.3% relative to control, p < 0.05 versus control, p > 0.05 versus Aβ+0μM; Aβ+20μM: 100.8±4.4% relative to control, p > 0.05 versus control, p < 0.05 versus Aβ+0μM; Aβ+50μM: 101.1±8.6% relative to control, p > 0.05 versus control, p < 0.05 versus Aβ+0μM; Aβ+100μM: 102.1±2.3% relative to control, p > 0.05 versus control, p < 0.05 versus Aβ+0μM; Fig. 1B). These results indicate that Rf itself has no effect on cell survival, but treatment with Rf at the concentration of 20μM or higher for 24 h exhibits a neuroprotective role against Aβ-induced cell death.

Effects of ginsenoside Rf on the cell viability. A) Rf treatment had no effect on cell viability in N2A cells (n = 3; one way ANOVA: F (6,14) = 0.171, p = 0.98). The cell viability is normalized by non-treatment with Rf (0μM). B) Rf increased cell viability in a dose-dependent manner in Aβ-treated N2A cells (n = 3; one way ANOVA: F (7,16) = 3.675, p = 0.015). Data are expressed as mean±SEM, *p < 0.05, **p < 0.01.
Effects of ginsenoside Rf on MMP, intracellular Ca2 + concentration and ROS in Aβ-treated N2A cells
Mitochondrial dysfunction has been documented as a central event in neuronal cell death in neurodegenerative disease [29–31]. To assess the effect of Rf treatment on Aβ-induced mitochondrial dysfunction, flow cytometry was performed to measure MMP, which was indicated by mean fluorescence intensity (MFI). The results showed that Aβ dramatically reduced MMP in N2A cells (control: 864.3±26.3; Aβ: 726.0±32.8, p < 0.05 versus control; Fig. 2A). Importantly, the reduction of MMP was fully restored by Rf treatment in Aβ-treated N2A cells (Aβ+Rf: 978.3±63.6, p > 0.05 versus control, p < 0.05 versus Aβ; Fig. 2A).
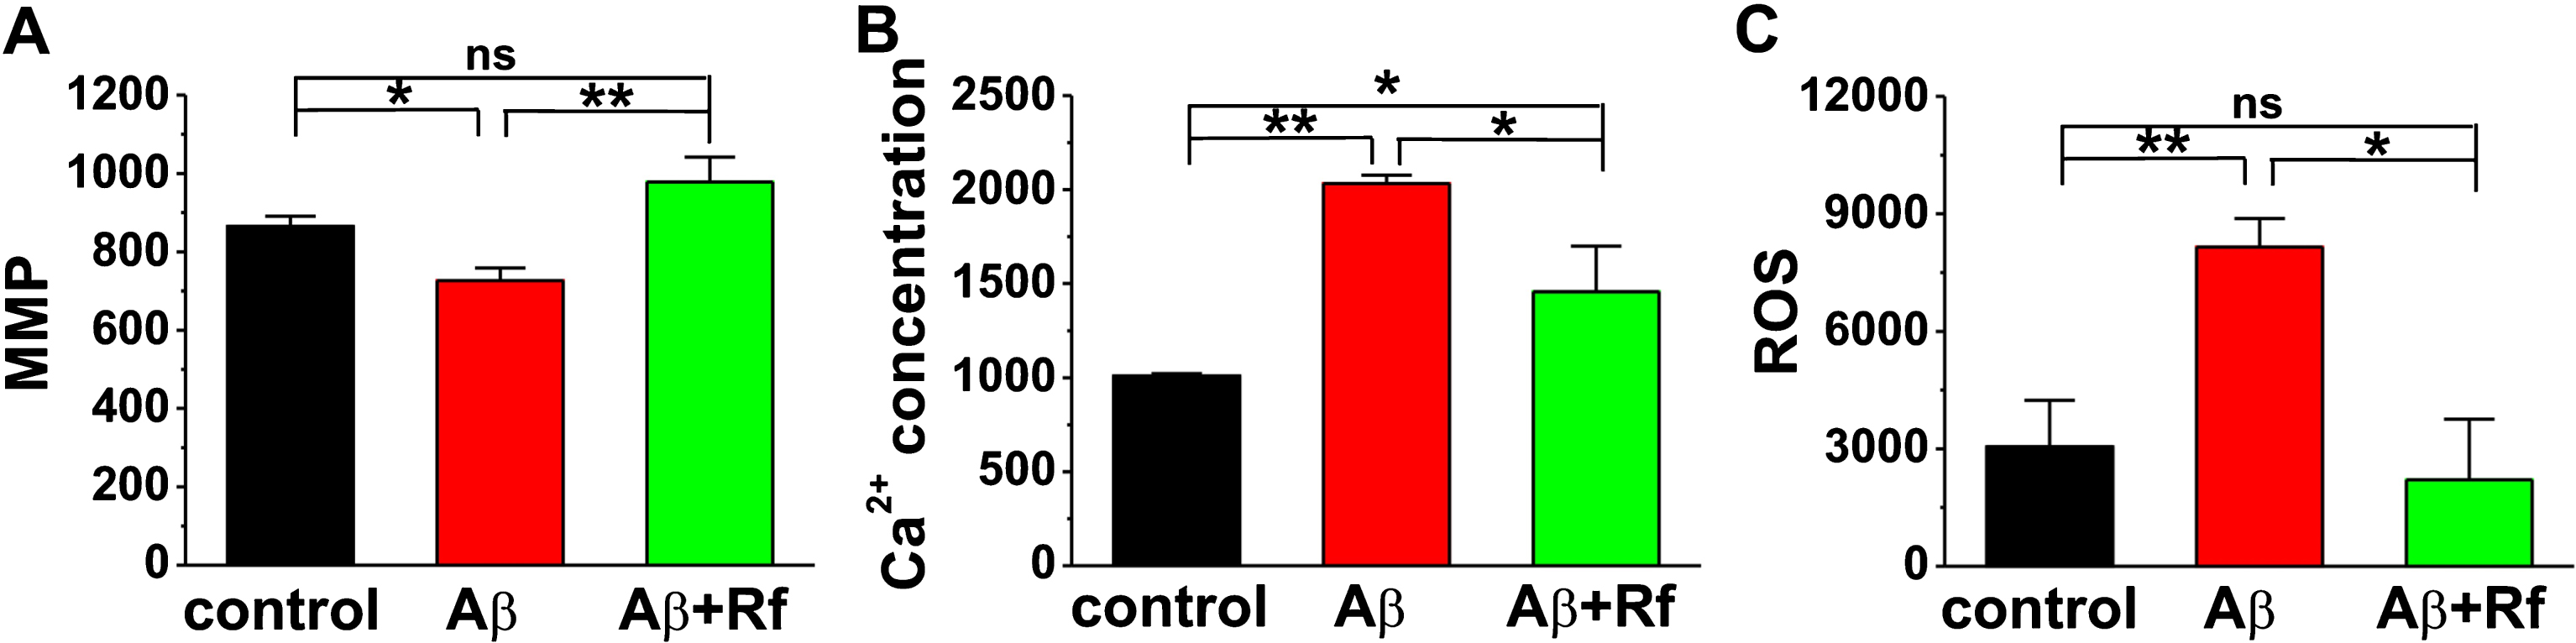
Effects of ginsenoside Rf on oxidative stress in Aβ-treated N2A cells. MMP (A), Ca2 + concentration (B), and ROS (C) were measured by flow cytometry (n = 3 in each group). One way ANOVA: F (2,7) = 16.903, p = 0.002 for MMP; F (2,7) = 10.156, p = 0.009 for Ca2 + concentration; F (2,7) = 5.784, p = 0.033 for ROS. Data are expressed as mean±SEM, *p < 0.05, **p < 0.01.
Because mitochondria plays a complex role in the regulation of homeostasis of intracellular Ca2 + [32, 33] and free radical production [34, 35], which play critical roles in the pathogenesis of AD, we therefore examined the effect of Rf treatment on intracellular Ca2 + concentration and ROS in Aβ-treated N2A cells. The results showed that Aβ treatment significantly increased intracellular Ca2 + concentration (control: 1297.0±299.5; Aβ: 2033.3±43.8, p < 0.05 versus control; Fig. 2B) and ROS production (control: 3050.0±1191.4; Aβ: 8155.3±726.3, p < 0.05 versus control; Fig. 2C). As expected, treatment with Rf was able to restore intracellular Ca2 + (Aβ+Rf: 1456.7±243.8, p > 0.05 versus control, p < 0.05 versus Aβ; Fig. 2B) and ROS (Aβ+Rf: 2210.3±1546.2, p > 0.05 versus control, p < 0.05 versus Aβ; Fig. 2C) to physiological level in Aβ-treated N2A cells.
Effects of ginsenoside Rf on cytokines in Aβ-treated N2A cells
An excess of ROS species causes oxidative stress, which is part of the pathogenesis of inflammation [36], whereas neuroinflammation is recognized as a fundamental response of the central nerve system to AD [3]. Therefore, we next evaluated the effects of Rf on Th1 and Th2 immunities. In the present study, the expression of IFN-γ and IL-13 mRNAs was measured by q-PCR assay in Aβ-treated N2A cells. The results showed that Aβ treatment dramatically increased IFN-γ mRNA (Aβ: 163.6±14.3% relative to control, p < 0.05 versus control; Fig. 3A) and decreased IL-13 mRNA (Aβ: 32.7±10.2% relative to control, p < 0.05 versus control; Fig. 3B) in N2A cells. More importantly, treatment with Rf fully suppressed the Aβ-induced increase of IFN-γ (Aβ+Rf: 58.2±13.6, p > 0.05 versus control, p < 0.05 versus Aβ; Fig. 3A) and decrease of IL-13 (Aβ+Rf: 61.3±6.8, p < 0.05 versus control, p < 0.05 versus Aβ; Fig. 3B).

Effects of ginsenoside Rf on the expression of cytokines in Aβ-treated N2A cells. IFN-γ (A, n = 3–5) and IL-13 (B, n = 4–5) mRNA were determined by real-time PCR. One way ANOVA: F (2,8) = 15.668, p = 0.02 for IFN-γ; F (2,10) = 21.172, p < 0.001 for IL-13. Data are expressed as mean±SEM, *p < 0.05, **p < 0.01.
Effects of ginsenoside Rf on caspase-1 and caspase-3 in Aβ-treated N2A cells
To further investigate the effects of Rf on inflammation reaction, we tested the expression of caspase-1. The results showed that Aβ treatment significantly increased the expression of active caspase-1 (Aβ: 326.3±82.2% relative to control, p < 0.05 versus control; Fig. 4A, C), and treatment with Rf restored the expression of active caspase-1 to control level (Aβ+Rf: 141.2±25.9% relative to control, p > 0.05 versus control, p < 0.05 versus Aβ; Fig. 4A, C). It has been well documented that caspase-1 is able to result in the increase of caspase-3, a key enzyme that regulates cell apoptosis [37, 38]. We then examined the expression of caspase-3 and found that Aβ treatment significantly increased active caspase-3 (Aβ: 310.8±48.9% relative to control, p < 0.05 versus control; Fig. 4D, F) in N2A cells. With treatment of Rf inhibited the upregulation of activated caspase-3 (Aβ+Rf: 133.7±54.5% relative to control, p > 0.05 versus control, p < 0.05 versus Aβ; Fig. 4D, F). Notably, Neither Aβ nor Rf affected the total expression of caspase-1 (Aβ: 92.5±9.5% relative to control, p > 0.05 versus control; Aβ+Rf: 89.5±8.8% relative to control, p > 0.05 versus control, p > 0.05 versus Aβ; Fig. 4A, B) and caspase-3 (Aβ: 132.2±16.8% relative to control, p > 0.05 versus control; Aβ+Rf: 125.3±212.8% relative to control, p > 0.05 versus control, p > 0.05 versus Aβ; Fig. 4D, E).

Effects of ginsenoside Rf on apoptosis-related proteins in Aβ-treated N2A cells. The relative protein levels of caspase-1 (A and B), active caspase-1 (A and C), caspase-3 (D and E), p-caspase-3 (D and F), and p-tau (G and H) are normalized by N2A cells non-treated with Aβ (n = 4–8 in each group). One way ANOVA: F (2,18) = 0.605, p = 0.558 for caspase-1; F (2,21) = 5.863, p = 0.009 for active caspase-1; F (2,15) = 1.937, p = 0.179 for caspase-3; F (2,18) = 7.185, p = 0.005 for p-casapse-3; F (2,9) = 19.838, p = 0.001 for p-tau. Data are expressed as mean±SEM, *p < 0.05, **p < 0.01.
Aβ accumulation accelerates Tau phosphorylation (p-tau) during AD development. Therefore, we next examined the effect of Rf on p-tau in Aβ-treated N2A cells. The results showed that treatment with Aβ dramatically increased the expression of p-tau (Ser396) (Aβ: 500.7±54.6% relative to control, p < 0.05 versus control; Fig. 4G, H), whereas treatment with Rf restored the expression of p-tau to control level (Aβ+ Rf: 157.0±64.2% relative to control, p > 0.05 versus control, p < 0.05 versus Aβ; Fig. 4G, H).
Next, to determine whether the inhibited effect of Rf on Aβ-induced neurotoxicity was due to caspase-1 activation, we pharmacologically treated N2A cells with caspase-1 inhibitor AC-YVAD-CMK (AC) in the presence or absence of Rf. The results showed that AC suppressed the expression of active caspase-1 (Aβ: 189.6±30.4% relative to control, p < 0.05 versus control, Aβ+Rf: 117.5±9.2% relative to control, p > 0.05 versus control, p < 0.05 versus Aβ; Aβ+AC: 106.2±12.3% relative to control, p > 0.05 versus control, p < 0.05 versus Aβ, p > 0.05 versus Aβ+Rf; Aβ+AC+Rf: 101.8±9.6% relative to control, p > 0.05 versus control, p < 0.05 versus Aβ, p > 0.05 versus Aβ+Rf, p > 0.05 versus Aβ+AC; Fig. 5A, C) and active caspase-3 (Aβ: 292.3±49.9% relative to control, p < 0.05 versus control, Aβ+Rf: 101.3±35.1% relative to control, p > 0.05 versus control, p < 0.05 versus Aβ; Aβ+AC: 77.7±19.3% relative to control, p > 0.05 versus control, p < 0.05 versus Aβ, p > 0.05 versus Aβ+Rf; Aβ+AC+Rf: 96.2±10.0% relative to control, p > 0.05 versus control, p < 0.05 versus Aβ, p > 0.05 versus Aβ+Rf, p > 0.05 versus Aβ+AC; Fig. 5D, F) in Aβ-treated N2A cells. Both total caspase-1 (Fig. 5A, B) and caspase-3 (Fig. 5D, E) were not affected by caspase-1 inhibitor.

Effects of caspase-1 inhibitor on apoptosis-related proteins in Aβ-treated N2A cells. The relative protein levels of caspase-1 (A and B), active caspase-1 (A and C), caspase-3 (D and E) and p-caspase-3 (D and F) are normalized by N2A cells non-treated with Aβ (n = 4–6 in each group). One way ANOVA: F (2,15) = 0.486, p = 0.746 for caspase-1; F (2,25) = 5.733, p = 0.002 for active caspase-1; F (2,15) = 1.165, p = 0.350 for caspase-3; F (2,15) = 9.492, p < 0.001 for p-caspase-3. Data are expressed as mean±SEM, *p < 0.05, **p < 0.01.
Effects of ginsenoside Rf on APP metabolism in N2A-APP cells
As aforementioned, the imbalance between production and clearance of Aβ peptides is an initiating factor in AD [10–12], we next wanted to detect the levels of Aβ40 and Aβ42, the main metabolites in the brain, in N2A-APP cells with or without Rf treatment. We found that the Aβ42 level was significantly increased in N2A-APP cells (N2A: 27.7±10.3; N2A-APP: 174.1±8.7, p < 0.05 versus N2A; Fig. 6B), compared to N2A cells. Importantly, Rf treatment significantly reduced Aβ42 level in N2A-APP cells (N2A-APP+Rf: 125.1±16.0, p > 0.05 versus N2A, p < 0.05 versus N2A-APP; Fig. 6B). Notably, there was no significant difference in Aβ40 level among these groups (N2A: 802.6±14.6; N2A-APP: 843.6±27.3, p > 0.05 versus N2A; N2A-APP+Rf: 859.2±34.4, p > 0.05 versus N2A, p > 0.05 versus N2A-APP; Fig. 6A).

Effects of ginsenoside Rf on Aβ levels in N2A-APP cells. The levels of Aβ40 (A) and Aβ42 (B) are measured by ELISA assay (n = 5–8 in each group). One way ANOVA: F (2,17) = 1.15, p = 0.34 for Aβ40; F (2,17) = 48.07, p < 0.001 for Aβ42. Data are expressed as mean±SEM, *p < 0.05, **p < 0.01.
To further determine the increase of Aβ42 level is due to its production or degradation, we examined APP-processing secretases and Aβ-degrading enzymes in N2A-APP cells in the presence or absence of Rf. The results showed that APP (N2A-APP: 521.5±84.0% relative to N2A, p < 0.05 versus N2A; Fig. 7A), BACE1, the β-secretase essential for cleaving APP to generate Aβ (N2A-APP: 214.7±27.2% relative to N2A, p < 0.05 versus N2A; Fig. 7B), and PS1, a core component of γ-secretase complex (N2A-APP: 470.1±77.1% relative to N2A, p < 0.05 versus N2A; Fig. 7C), were significantly increased in N2A-APP cells, compared to N2A cells. However, Rf treatment had no effect on the expressions of APP (N2A-APP+Rf: 497.7±83.7% relative to N2A, p < 0.05 versus N2A, p > 0.05 versus N2A-APP; Fig. 7A), BACE1 (N2A-APP+Rf: 223.0±46.9% relative to N2A, p < 0.05 versus N2A, p > 0.05 versus N2A-APP; Fig. 7B) and PS1 (N2A-APP+Rf: 447.7±60.2% relative to N2A, p < 0.05 versus N2A, p > 0.05 versus N2A-APP; Fig. 7C). It had been reported that Aβ peptides are proteolytically degraded in the brain, mainly by neprilysin (NEP) and insulin degrading enzyme (IDE) [39]. We here found that NEP (N2A-APP: 66.3±13.6% relative to N2A, p < 0.05 versus N2A; Fig. 7D) and IDE (N2A-APP: 74.8±15.4% relative to N2A, p > 0.05 versus N2A; Fig. 7E) were significantly reduced in N2A-APP cells, compared to N2A cells. Rf treatment restored NEP (N2A-APP+Rf: 125.9±9.4% relative to N2A, p > 0.05 versus N2A, p < 0.05 versus N2A-APP; Fig. 7D) and IDE (N2A-APP+Rf: 117.5±13.6% relative to N2A, p > 0.05 versus N2A, p < 0.05 versus N2A-APP; Fig. 7E) to control levels, suggesting that decreased Aβ deposition after Rf treatment may be due to the enhancement of Aβ degradation, but not the reduction of Aβ production.

Effects of ginsenoside Rf on AβPP-processing secretases and Aβ-degrading enzymes in N2A-APP cells. The relative protein levels of AβPP (A), BACE1 (B), PS1 (C), NEP (D), and IDE (E) are normalized by N2A cells (n = 3–4 in each group). One way ANOVA: F (2,6) = 11.964, p = 0.008 for AβPP; F (2,6) = 7.419, p = 0.024 for BACE1; F (2,9) = 18.014, p = 0.001for PS1; F (2,6) = 8.848, p = 0.016 for NEP; F (2,6) = 7.633, p = 0.022 for IDE. Data are expressed as mean±SEM, *p < 0.05, **p < 0.01.
Effects of ginsenoside Rf on learning and memory in Aβ-treated mice
To examine the effects of Rf on learning and memory in Aβ-induced mouse model of AD, we next introduced hippocampus-dependent spatial memory tasks, the novel object recognition and the Morris water maze. In novel object recognition test, mice subjected to Aβ treatment failed to distinguish familiar and novel objects, as reflected by similar exploration number to both objects (control: RI = 61.3±2.6%; Aβ: 49.6±4.8%, p < 0.05 versus control; Fig. 8A). Rf significantly increased the number to exploring novel object (Aβ+Rf: RI = 62.2±3.8%, p > 0.05 versus control, p < 0.05 versus Aβ; Fig. 8A), whereas Rf treatment had no influence on novel object recognition in control group (Rf£ºRI = 71.1±5.9%, p > 0.05 versus control; Fig. 8A).

Effects of ginsenoside Rf on spatial learning and memory in Aβ42-induced mouse model of AD. A) The recognition index (RI) of exploration number in novel object recognition test (n = 11–15). One way ANOVA: F (3,51) = 4.155, p = 0.011. B) The escape latency to the hidden platform during spatial learning during the Morris water maze test. Repeated measures ANOVA: F (3,51) = 24.765, p < 0.001. C) During the probe test with absence of the hidden platform, the time spent in the hidden platform-located quadrant. One way ANOVA: F (3,51) = 3.779, p = 0.017. D) The number of entries into the platform zone. One way ANOVA: F (3,51) = 4.776, p = 0.006. Data are expressed as mean±SEM, *p < 0.05, **p < 0.01.
To further evaluate the effects of Rf on learning and memory in Aβ-induced mouse model of AD, the Morris water maze task was used. The results showed that the escape latency in the Aβ-treated group was much longer than control group (day1:89.8±7.8 s for control, 91.4±8.4 s for Aβ; day 2:73.4±9.3 s for control, 80.3±9.4 s for Aβ; day 3:45.2±9.8 s for control, 79.0±10.8 s for Aβ; day 4:37.6±6.3 s for control, 70.9±13.8 s for Aβ; day 5:32.7±7.4 s for control, 69.2±13.7 s for Aβ; p < 0.05 versus control; Fig. 8B). Rf treatment significantly shortened escape latency for searching for the hidden platform (Aβ+Rf: 67.6±12.1 s for day 1; 49.2±9.7 s for day 2; 33.8±7.1 s for day 3; 20.6±5.7 s for day 4; 18.8±4.1 s for day 5; p < 0.05 versus Aβ, p > 0.05 versus control; Fig. 8B), compared to those in the Aβ group. The probe test revealed that mice in Aβ treatment group spent much less time in the target quadrant where hidden platform located during learning period (control: 45.7±4.2 s; Aβ: 32.0±4.4 s, p < 0.05 versus control; Fig. 8C) and reduced the number of entries into the platform zone (control: 3.7±0.5; Aβ: 1.3±0.4, p < 0.05 versus control; Fig. 8D). Rf treatment significantly increased the time spend in target quadrant (Aβ+Rf: 53.7±4.4s, p > 0.05 versus control, p < 0.01 versus Aβ; Fig. 8C) and the number of entries into the platform zone (Aβ+Rf: 5.4±0.8 s, p > 0.05 versus control, p < 0.01 versus Aβ; Fig. 8D). Taken together, these results indicate that Rf significantly alleviates the memory decline in Aβ-treated mice.
DISCUSSION
In the present study, we confirm that Rf significantly suppresses neuroinflammation and demonstrate that Rf is able to alleviate Aβ-induced neuronal death in N2A cells. We also report that Rf can reduce Aβ level via enhancing Aβ degradation in N2A-APP cells and alleviate memory deficits in Aβ-treated mice. These data indicate that Rf plays an important role in anti-inflammation and inhibition of neuronal apoptosis, suggesting that Rf may be used as a neuroprotective drug against Aβ-induced neurotoxicity.
Alzheimer’s disease (AD) is the most common cause of dementia that affects the elderly [40]. Preclinical studies have suggested that Aβ deposit is the main pathogenesis in AD, because Aβ accumulation can lead to the formation of neurofibrillary tangles, inflammation, synaptic deficits and neuronal apoptosis. Thus, reducing the amount of Aβ might be a potential therapeutic strategy for AD [41]. Ginsenoside Rf is a glycoside of protopanaxatriol from P. ginseng roots. Our present study revealed that Rf treatment obviously reduced the number of apoptotic cells in Aβ-treated N2A cells (Fig. 1). We also found that the decrease of Aβ-induced cell death may attribute to its anti-oxidative (Fig. 2) stress and anti-inflammatory activity (Fig. 3), as ROS, Ca2 + concentration and IFN-γ were decreased while MMP and IL-13 were increased in N2A cells co-treated with Aβ and Rf. These findings are supported by recent report that Rf suppresses inflammatory cytokine production through downregulation of the MAPKs/NF-κB signaling pathway in HT-29 cells and RAW264.7 cells [16].
It has been well documented that Aβ derives from the amyloid-β protein precursor (AβPP), which is cleaved by β-secretase (BACE1) and γ-secretase [42–44]. We here report that Rf is able to reduce the level of Aβ42 (Fig. 6), the main component of senile plaques in AD, in N2A-APP cells, a widely used in vitro model of Aβ generation by amyloidogenesis pathway. We further find that the enhancement of Aβ degradation rather than the reduction of Aβ production, may contribute to the reduction of Aβ42 in the present study, because AβPP-processing secretases BACE1 and PS1 remain unchanged whereas Aβ-degrading enzymes NEP and IDE are significantly increased after Rf treatment (Fig. 7). More importantly, we here confirmed that direct Aβ42 treatment led to significant memory decline in both the Morris water maze and novel object recognition tests (Fig. 8), and further found that Rf treatment succeeded in attenuating the deficits of learning and memory in both tasks. Taken together, our results clearly indicate that ginsenoside Rf is able to exert neuroprotective effects against Aβ-induced neurotoxicity through antioxidative stress and anti-inflammatory response, suggesting that Rf may serve as a promising novel therapeutic agent for the prevention and treatment of AD. However, the beneficial effects of Rf on cognitive functions in different animal model of AD such as transgenic mice, need to be further investigated in the future.