
Abstract
Background:
Early intervention to prevent, or delay, the transition from healthy cognition to cognitive impairment in older adults is an important goal. In this way, it is critical to find sensitive, reproducible, and early markers to use low cost methods for the detection of that transition. One of those early markers for symptomatic manifestation of AD is subjective cognitive decline (SCD).
Objective:
To examine the internal consistency of the concept of SCD and to evaluate its clinical significance on the progression through the continuum of AD.
Methods:
1,091 cognitively healthy individuals from the Vallecas Project cohort were followed for three years. Cognitive complaints were systematically collected and analyzed along with clinical data. All participants were classified in three groups at every visit based on specific features of their complaints.
Results:
Concordance analyses showed a good agreement in longitudinal classification of SCD. The Multi-state Markov Model highlighted a unidirectional transition from the status of no cognitive complaints to SCD. Interestingly, a more severe condition of SCD, namely SCD Plus, showed the highest risk of progression to mild cognitive impairment.
Conclusions:
The concept of SCD is stable over time when it is operationally defined and consistently assessed. It provides not only a fast identification of individuals at higher risk of future mild cognitive impairment, but also it allows us to track longitudinal trajectories.
Keywords
INTRODUCTION
The investigation using biomarkers has pointed out that the first physiopathological changes associated with amyloid-β deposition might be observed several decades before the clinical diagnosis of Alzheimer’s disease (AD), even in absence of symptoms [1]. As a result, the progression of AD is currently conceived as a continuum starting 20 years before the onset of clearly noticeable symptoms [2]. The National Institute on Aging-Alzheimer Association (NIA-AA) established three different stages of AD as progression occurs over time. First, there is a preclinical phase which is defined by the incipient presence of amyloid plaques, but objective cognitive function remains normal. At the end of this preclinical phase the individual might experience some kind of subjective cognitive decline (SCD) that increases the risk of future dementia [3]. A second stage called prodromal mild cognitive impairment (MCI) due to AD refers to a cognitive impairment that is not severe enough to significantly affect everyday activities. Finally, there is a third phase in which cognitive impairment worsens progressively leading to a functional impairment that defines an AD dementia syndrome. Since the publication of these guidelines in 2011, data have continued confirming that changes of biomarker measures represent a continuous process. Following this model, positive biomarkers can antecede the clinical symptoms by 15–20 years, and that fact changed the assumption of three clinical defined entities to a conception of disease continuum. In practical terms, the detection of the clinical and biological AD hallmarks of people who will convert from a cognitively healthy state to a latter MCI phase is a challenge of great interest, conceptualized as a research framework to investigate AD continuum [4].
Early intervention to prevent, or delay, the transition from healthy cognition to cognitive impairment in older adults is an important goal. In this way, it is critical to find sensitive, reproducible and early markers to use low cost methods for the detection of that transition. One of those early markers for symptomatic manifestation of AD is SCD [5]. This condition has been proved to precede MCI due to AD and it may serve for an early intervention in the onset of AD [6]. Indeed, a recent meta-analysis has shown that almost 25% of older adults who report SCD will develop prodromal AD four years later [7]. In addition, the rate of progression to dementia among those individuals who report SCD is twofold during a 5-year following period.
SCD during preclinical phase of AD refers to a self-experienced persistent decline in cognitive abilities in comparison with a previously normal status and independently of the objective performance on neuropsychological tests. To increase the potential usefulness of SCD the international working group called Subjective Cognitive Decline Initiative (SCD-I) agreed to a common framework and research procedures to study the role of SCD as a preclinical marker of AD [8]. As a result of these indications, cognitively healthy individuals who accomplish certain conditions of SCD, namely SCD-Plus, have been proved to have a four times higher risk for progressing to prodromal AD in just one-year compared to those subjects without complaints [9]. Despite its outstanding clinical value, the identification and measurement of SCD is not an easy task because of some limitations pointed out by the SCD-I [5, 6]. These limitations could be summarized in three different blocks: 1) terminology has not been homogeneous across studies; 2) methodology and tools to assess SCD are also heterogeneous; and 3) operational criteria and cutoffs to consider who is truly reporting SCD have been totally different across studies. Thus, for instances, the previous limitations are probably the reason whereby the prevalence of SCD in older adults may range from 10 to 80% depending on the studies [10–13]. Additionally, another issue which is pending to be solved is the stability over time of SCD [14].
In this work, we will test the internal consistency of SCD across time. As the stability is demonstrated, SCD could become a reliable, low-cost preclinical marker for AD. We therefore hypothesize that in a series of longitudinal evaluations the self-report of cognitive impairment would be stable across time. Additionally, we will analyze the validity of the SCD as a very early marker of AD examining the dynamic transition from the preclinical to prodromal AD stages.
MATERIALS AND METHODS
Participants
The participants of this study comprised 1,091 cognitively healthy community-dwelling individuals aged 70 years and over at baseline. All of them were part of the Vallecas Project cohort, a community-based longitudinal investigation for early detection of AD [15]. The participants were volunteers that were recruited through radio and TV campaigns, leaflet distribution, and visits of the research team to social centers for the elderly. The study was approved by the Research Ethics Committee of the Carlos III Institute of Health, Madrid, Spain. Informed written consent was obtained from all participants enrolled in this study.
The participants underwent a detailed assessment protocol annually for three years. The protocol included past medical history, neurological and neuropsychological examination, as well as biochemical and genetic blood test. The complete visit was usually carried out within four hours with convenient breaks. The neuropsychological battery included complete information about all cognitive domains that covered the whole spectrum of cognition. For the purposes of this work we only analyzed the performance in the following tests: Free and Cued Selective Reminding Test (FCSRT) [16], Digit-Symbol Coding [17], and Clinical Dementia Rating (CDR) [18]. In addition, the Geriatric Depression Scale (GDS) [19] and the State-Trait Anxiety Inventory (STAI) [20] were also administered as part of the neuropsychological battery to quickly estimate mood and anxiety symptoms.
Clinical diagnoses were always agreed between neurologists and neuropsychologists at consensus meetings; all diagnoses were always blind to previous diagnosis. MRIs were done to rule out the presence of macroscopic lesions or significant vascular damage which could interfere with cognitive performance. Then, every individual was independently diagnosed after each visit according to his/her age, gender, cognitive reserve, functional information, and cognitive scores. Nevertheless, rather than psychometrically invariable cut-offs, diagnosis were based on clinical impression. NIA-AA’s criteria [21] were applied to diagnose core MCI and mild dementia. Cognitively healthy subjects were given a score of 0 in the global CDR while MCI and mild dementia must score 0.5 and 1, respectively. All participants were diagnosed as cognitively healthy at baseline.
SCD assessment
SCD was assessed twice and independently within the same visit at the Vallecas Project. First, during the neurological examination participants were asked the following nine questions regarding specific cognitive domains: 1) Attention (“Are you easily distracted?”); 2) Spatial orientation (“Do you get lost in familiar surroundings?”); 3) Episodic memory (“Do you often forget recent information or events?”); 4) Autobiographical memory (“Do you often forget autobiographical information?”); 5) Visual recognition (“Do you have trouble recognizing objects or faces?”); 6) Speech (“Do you have word-finding difficulties for people’s names or common words?”); 7) Language comprehension (“Do you understand verbal and written instructions?”); 8) Executive functions (“Do you have difficulty driving, managing finances or planning daily activities?”); and 9) Praxis (“Do you have difficulty sequencing movements (e.g., taking the necessary steps to prepare a bath)?”). The previous questions were coded in a dichotomic way (yes/no).
Second, during the neuropsychological assessment individuals also completed an ordinal scale of memory complaints composed of four items with four points each (ranged 0–3): 1) “How do you perceive your memory in comparison with that of others of your age?” (“3-bad”; “2-somewhat worse”; “1-somewhat better”; “0-excellent”); 2) “How do you perceive your memory today compared with your young adulthood?” (“0-better”; “1-equal”; “2-somewhat worse”; “3-much worse”); 3) “Do you perceive your memory today is worse than compared with ten years ago?” (“0-no”; “1-a little worse”; “2-somewhat worse”; “3-much worse”); and 4) “Do you perceive your memory today is worse than compared with one year ago?” (“0-no”; “1-a little worse”; “2-somewhat worse”; “3-much worse”). The sum of these items resulted in a total score of cognitive concerns (SCD scale) which ranged from 0 (no complaints at all) to 12 (maximum complaints). Furthermore, five more open-ended questions were also collected: 5) Age at onset of cognitive complaints (“How old were you when your cognitive performance began to decline?"); 6) Years of SCD progression (“How long do you believe you are experiencing cognitive complaints?”); 7) Worries associated with self-perceived complaints (“Are you worried about your cognitive decline?”); 8) Type of onset of cognitive complaints (“How did you perceive the beginning of the cognitive decline? (e.g., suddenly, progressive, etc.)”); and 9) Self-experienced functional impairment associated with SCD (“Do you believe your cognitive failures are impeding your daily life activities?”).
Classification of individuals in SCD groups
We followed the guidelines proposed by the SCD-I [8] to examine the implication of specific SCD features as early signs of AD. According to these guidelines, individuals were grouped in three different categories pursuant to the extent of SCD reported in both clinical interviews: 1) No complaints group (NCg); 2) Subjective cognitive decline group (SCDg); and 3) Subjective cognitive decline plus (SCD-Pg). We decided to adopt a conservative criterion in order to ensure the most stable categorization possible of SCD groups. First, our primary measure for SCD was the SCD scale because it was composed of items that delve into the self-perception of complaints over time compared to others and oneself. Therefore, scores 0-1 on the SCD scale was considered as non-indicative of SCD while scores ranging 4–12 were conceived as a strong signal of SCD. Intermediate 2-3 scores were thought to be at borderline and in those cases, the information from the 9 yes/no-type questions was taken into account as a secondary measure to classify the participants. Only if the response was affirmative in at least one of those questions was the individual considered as SCDg. Otherwise, the individual was included in NCg. Specifically, the three SCD groups were operationally defined as follows: 1) NCg: scores 0-1 on the SCD scale administered in the neuropsychological assessment OR scores 2-3 on the SCD scale, but none positive response to any of the 9 yes/no-type question from the neurological interview; 2) SCDg: scores 4–12 on the SCD scale administered in the neuropsychological assessment OR scores 2-3 on the same scale plus at least a positive response to any cognitive domain from the neurological interview; and 3) SCD-Pg: only for cases categorized as SCDg specific features were considered such as: age at onset of SCD beyond 60 years, turning up of complaints within the last 5 years, worry associated with SCD, and feeling of worse performance than others of the same age group. When all these conditions accompany the self-experience of decline then an individual was classified as SCD-Pg.
APOE genotyping
APOE gene polymorphism status was studied with total DNA isolated from peripheral blood following standard procedures. Genotyping of APOE polymorphisms (rs429358 and rs7412) was performed by Real-Time PCR [22]. APOE was coded 1 for the APOE ɛ4 carriers, and 0 for non-carriers.
Statistical analyses
Analyses were conducted using R version 3.1.1. [23], specifically packages mice [24] for multiple imputation and msm [25] for multi-state modeling. We used 2-sided significance tests for all analyses, with statistical significance set at p-value <0.05.
We performed a preliminary analysis of demographic, cognitive, and clinical variables at baseline to find out their distribution and explore the nature and distribution of missing values. Nearly 10% of data were missed, but no profiles of missingness were identified (i.e., the missingness spread over many individuals, variables, and study visits). We therefore conducted a multiple imputation procedure under a fully conditional specification method in order to impute values as closer as possible to ideal predicted observations. Those imputed values were generated on the basis of existing variables through four different databases, one for each study visit; a total of four imputation procedures were thereby conducted. In this sense, it should be noted that those individuals who did not attend to any visit were excluded from the corresponding databases. The imputation procedure replaced each missing observation with a set of plausible values representing uncertainty about the appropriate value to impute. The procedure was repeated five times and generated the corresponding five data sets whose coefficients varied from one set to another. The imputed data sets were analyzed using the usual procedure for complete data. Finally, the results of these analyses were combined to produce valid statistical inferences of data.
We then applied the SCD operational criteria to classify the whole cohort in every visit. SCD groups were treated as independent variables with three levels (NCg, SCDg, and SCD-Pg) whereas demographic, cognitive, and neuropsychiatric data were used as dependent variables. Associations between categorical variables were analyzed with the Pearson’s χ2 test when appropriate. In addition, due to differences of sample size among SCD groups, analyses of variance and post-hoc analyses were based on non-parametric Kruskal-Wallis tests with Bonferroni corrections when necessary. As estimates of the effect size partial eta squared (
In order to test the hypothesis related to the temporal stability of the self-experienced cognitive decline, we first calculated the Intraclass Correlation Coefficient (ICC) among the scores of the SCD scale over time insofar as this is a quantitative variable. Then the percentage of incongruent classifications over time was obtained. Since SCD groups were categorical, we used the Pearson’s χ2 for analyzing the association among them and also obtained squared weighted Cohen’s kappa and Fleiss’ kappa concordance coefficients for two or multiple observations respectively. For a variety of reasons weighted Cohen’s kappa has been considered a good statistic for that because it provides an estimate of the percentage agreement between ratings corrected for chance (i.e., target values are random). Indeed, the weighted kappa with squared function is identical to the Concordance Correlation Coefficient (CCC) for continuous data [26]. According to the values of kappa, it was considered: <0.20 as poor agreement; 0.21–0.40 as fair agreement; 0.41–0.60 as moderate agreement; 0.61–0.80; as good agreement; and 0.81–1.00 very good agreement [27].
Then, we conducted a preliminary analysis of the conversion rate among groups by SCD only with consistently cases identified through the follow-up. Irrespective of MCI diagnosis, those consistent cases were defined as follows: 1) individuals who remained stable in the same group during follow-up (“Stable NCg”; “Stable SCDg”; “Stable SCD-Pg”); and 2) subjects who showed a forward transition in the preclinical spectrum from left to right during follow-up (“Transition from NCg to SCDg”; “Transition from SCDg to SCD-Pg”). Otherwise, when backward transitions were detected (i.e., transitions from SCD-Pg to SCDg or from SCDg to NCg) individuals were removed from the analyses. Then, for each group we examined the percentage of individuals who developed or not MCI during follow-up.
Multi-state markov model
As this study focused on the temporal dynamics of the preclinical stage of AD, we performed a Multi-state Markov Model in continuous time to better characterize transitions among the following four states: No SCD, SCD, SCD-P, and MCI. Here it is important to note that all MCI statuses considered were confirmed during follow-up. Analyses based on this approach are appropriate for modeling the course of health processes in continuous time because they are able to accurately capture the transition of individuals in forward and backward directions across discrete stages [28]. Then, considering the assumption of the AD continuum, Multi-state Markov Model enables us to describe the process in which individuals move through the preclinical AD stages in continuous time.
In our study, we examined the stage-sequential dynamic of preclinical AD using Multi-state Markov Model in continuous time. The Markov assumption claims that the rate of transition from one state to another depends only on the current state. Although this assumption seems to be restrictive, it is necessary to compute the likelihood for intermittently observed data like ours. An alternative to deal with this assumption is to include time in the current state as an additional predictor in the model. However, since with intermittently observed states it is not possible to know how long a participant has been in a given state, the apparent restrictiveness of the Markov assumption was ameliorated somehow by introducing age in the model. Thus, the transition matrix was calculated between any two unrounded ages and therefore accommodates variation in the time between participant visits [29].
We modeled therefore a Multi-state Markov Model with forward-backward algorithm to maximize likelihood estimation. Since we only observe states at a finite series of time and time interval between two consecutive visits in our longitudinal study varied across participants, a time-homogeneous model was preferred instead of a discrete one [30]. We then specified a multi-state model with four different states (No SCD, SCD, SCD-P, MCI) as well as the initial values for the transition intensity matrix that corresponded to [(0,0.5,0,0.01), (0.1,0,0.15,0.05), (0.05,0.5,0,0.2), (0,0,0,0)]. This matrix, which is really important because governs the whole model, represents the theoretical probabilities of transition from one state to another independently of the real data. Our model therefore assumed that individuals could move or recover from consecutive states, as well as convert from any state to MCI, which was conceived as the absorbing state. All transitions were interval-censored because we could not know the exact time in which individuals had transitioned. Multi-state Markov Model provided the estimated transition probability matrix and its 95% confidence intervals to evaluate the probability of a change of SCD status membership over time conditional on previous status. The analysis of this matrix allowed us to better understand the temporal dynamics of preclinical AD over time and to test the hypothesis of SCD and SCD-Plus as two different statuses that increase the risk of future MCI.
RESULTS
The participants were followed-up for a mean of 2.9 years (SD 0.8; median 3.2; range 1.0–4.2). During this time, 84 (7.7%) individuals developed MCI and 16 (1.5%) progressed to dementia. Based on the cognitive trajectories of these 16 participants (marked memory impairment as a primary symptom during follow-up and MRIs excluding significant vascular damage) we could assume that there is a high probability of AD dementia type, but there is no available biomarker confirmation.
Regarding cognitive concerns, 78% of participants reported some type of SCD at baseline; that is, they were classified as SCDg or SCD-Pg. The single measure ICC value for the scores of the SCD scale during the whole follow-up showed a positive correlation of 0.522 (p <0.001). On the other hand, the average measure ICC was 0.814.
Table 1 summarizes the descriptive statistics of the total sample and the three SCD groups at baseline. No differences in age, gender and ApoE among groups were found. Nevertheless, there was a trend for significance concerning education, having less years of education SCD-Pg than NCg. Differences in depression (GDS) and anxiety (STAI) were also found among all three groups. These results highlighted that neuropsychiatric symptoms were more frequent in both SCD groups compared to NCg; and these symptoms were especially marked for SCD-Pg. Regarding cognitive assessment, statistical differences between groups were found for instrumental activities of everyday (FAQ), verbal episodic memory (FCSRT), speed processing (Digit Symbol Coding) and clinical rating (CDR sum of boxes). Interestingly, the SCD-Pg showed the worst cognitive performance, while only two indices of FCSRT differed significantly between NCg and SCDg.
Baseline demographic and clinical characteristics of the sample by subjective cognitive decline groups
ApoE, Apolipoprotein E; CDR, Clinical Dementia Rating; FAQ, Functional Activities Questionnaire; FCSRT, Free and Cued Selective Reminding Test; GDS, Geriatric Depression Scale; NCg, no complaints group; SCD, subjective cognitive decline; SCDg, subjective cognitive decline group; SCD-Pg, subjective cognitive decline plus group; SD, standard deviation; STAI, State-Trait Anxiety Inventory. p-values indicate the values assessed with non-parametric Kruskal-Wallis tests for each variable except sex and ApoE ɛ4, where contingency χ2 tests were performed. Non-parametric post-hoc: a, NCg versus SCDg; b, NCg versus SCD-Pg; c, SCDg versus SCD-Pg.
Table 2 shows the percentage of concordance and discrepancies related to the classification of individuals in SCD groups. Since SCDg and SCD-Pg are both referred to a self-perception of complaints and that the boundaries between them are permeable, we collapsed them in a single level. Based on the assumption about the linear transition upon the AD spectrum, the agreements were defined according to two parameters: 1) individuals who converted from NCg to SCDg; and 2) subjects who remained stable as SCDg over time. Discrepancies were then defined as those cases in which a reversal from SCDg to NCg occurs. As expected, the percentages of discrepancy increased with the duration of follow-up from around 5% at one-year follow-up, to 17% at three-year follow-up. We also conducted some concordance analyses involving Cohen’s and Fleiss’ kappa indices. All values of kappa resulted significant (p <0.0001) and over 0.40, ranging from 0.46 for the three-year follow-up to 0.76 for the one-year period. These outcomes indicated that there was a good agreement in the longitudinal classification of SCD groups.
Concordance among subjective cognitive decline groups over time
*Discrepancy is only referred to those cases in which transition from SCDg or SCD-Pg to NCg is observed. †All p-values <0.0001. Annual mean discrepancy related to SCDg to NCg = 7.7%. Annual mean discrepancy related to SCD-Pg to NCg = 4.7%. v0: baseline visit; v1: one-year follow-up visit; v2: two-year follow-up visit; v2: three-year follow-up visit.
Regarding the association between SCD and conversion rate to MCI, in a preliminary analysis we classified all individuals according to the evolution of their complaints through the follow-up. Considering only consistent cases (i.e., those who remained stable or those who moved forward in the preclinical spectrum from left to right) and irrespective of MCI diagnosis, five new groups were thereby built as shown in Table 3. It should be noted that since backward transitions were removed from this analysis, only 591 participants were finally considered. The column “n over time” in Table 3 reflects the number of individuals who were retained in each group (for example, 117 participants transitioned from NCg to SCDg at any point of the follow-up). The column “% conversion to MCI” means the percentage of the participants of each category who developed MCI (as in our previous example, 4 out 117 of the participants in the “Transition from NCg to SCDg” group developed MCI what represents 3.6% versus the 96.4% who remained cognitively intact). The outcomes showed that the percentages of conversion to MCI were increasing as it was observed a theoretical transition from left to right in the continuum: from 0% in “Stable NCg” to 42.9% in “Stable SCD-Pg”. Therefore, the rate of conversion to MCI showed a strong relationship to SCD-P.
Cumulative conversion rate to mild cognitive impairment by transition among subjective cognitive decline groups
MCI, mild cognitive impairment; NCg, no complaints group; SCDg: subjective cognitive decline group; SCD-Pg: subjective cognitive decline plus group.
However, transition among states in this preliminary test seemed to be partially biased because of two reasons: the loss of nearly half of the sample after removing backward cases as well as the extensive contingency tables necessary to explore individual trends on the SCD transition. To solve those issues a more sophisticated statistical approach was applied for studying the temporal dynamics of SCD with all cases. We performed a Multi-state Markov Model to better understand the temporal dynamic of preclinical AD stages (–2 log-likelihood = 3,972.06; AIC = 3,986.06). Table 4 shows the transition probability matrix across SCD statuses. These transition probabilities express the incidence of transitioning during the follow-up conditional on earlier membership in any specific the SCD status. Participants who did not report SCD at baseline had 50% of probabilities of remaining as no SCD during the three-year follow-up. In case of transition, they were most likely to transition to the SCD status, but not to SCD-Plus or MCI. Those in SCD status at baseline had 78% of probabilities of remaining there at follow-up and their most likely transition was to SCD-Plus status. Indeed, probability of progression to SCD-Plus was approximately twice than reversion to No SCD status. Individuals in the SCD-Plus status at baseline were the least stable group remaining only 33% of individuals in the same status during the follow-up. Their more likely transition was backward towards SCD status (52% of them) and the probability of reversion to No SCD was very unlikely. Most importantly, these outcomes pointed out that the SCD-Plus was the status in which the likelihood of progression to the following prodromal AD stage, MCI, was higher (12%) followed by SCD (3%) and No SCD (less than 1%). Figure 1 shows graphically the fitted survival probability of conversion to MCI over time for No SCD, SCD and SCD-Plus statuses.
Status prevalence of subjective cognitive decline by visit and transition probability matrix for preclinical stages
MCI, mild cognitive impairment; SCD, subjective cognitive decline.
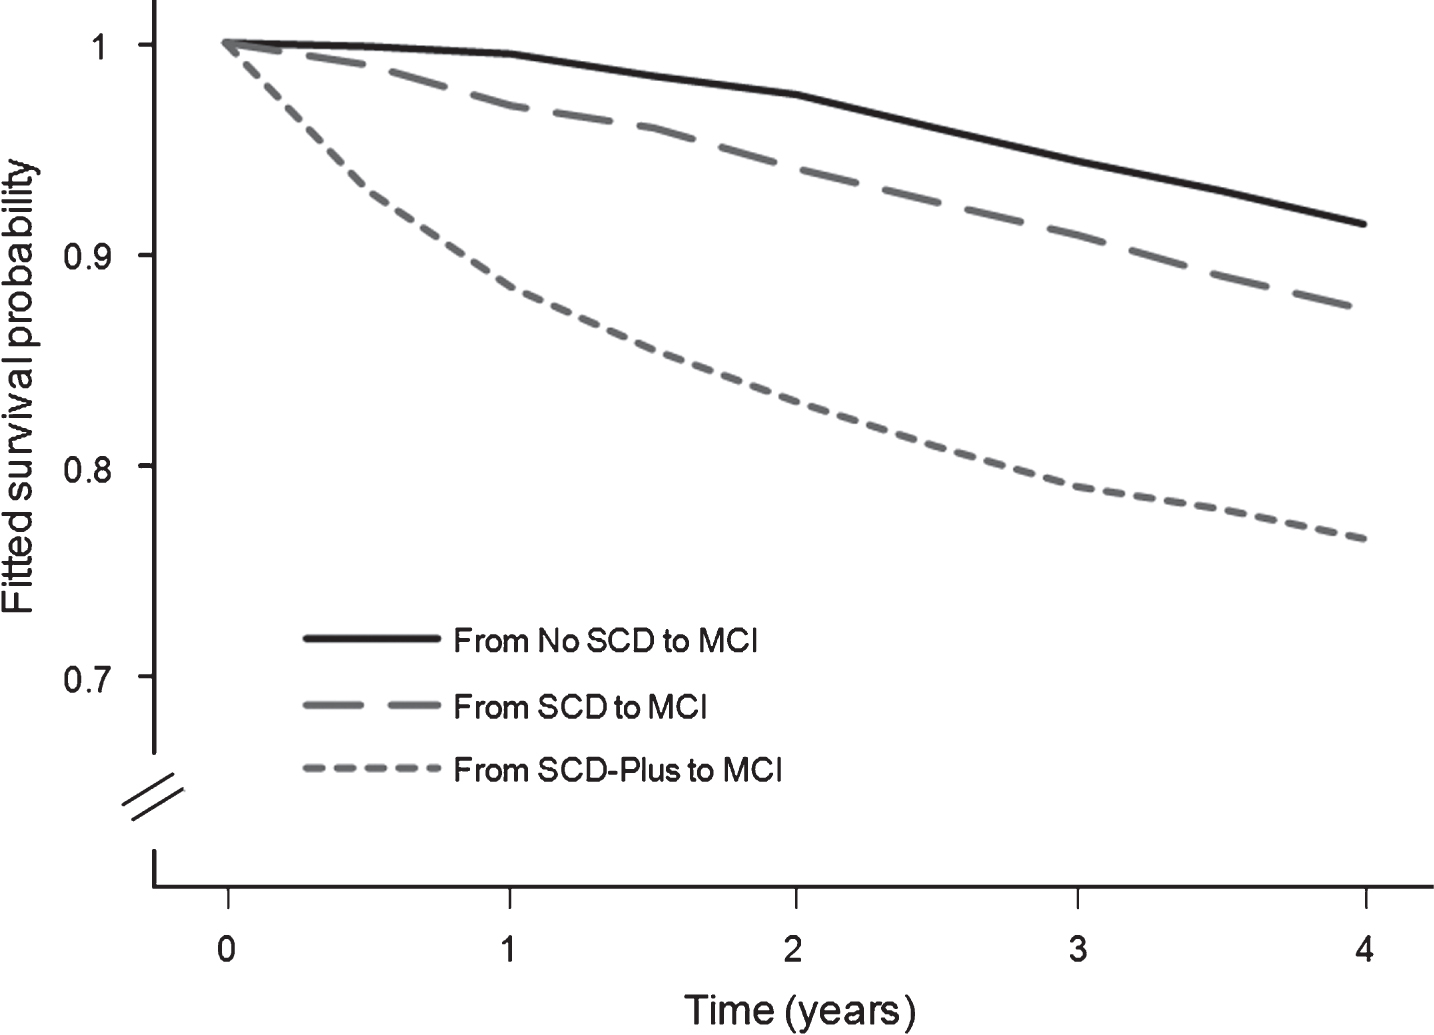
Kaplan-Meier survival curves for rates of conversion to MCI by SCD statuses. SCD-Plus shows the highest risk of conversion to MCI over time. MCI, mild cognitive impairment; SCD, subjective cognitive decline.
DISCUSSION
The purpose of this study was to determine whether SCD may be a suitable very early marker for AD in a large cohort composed of 1,091 participants aged 70 years and over with uniform ascertainment of risk factor and disease. All participants were cognitively healthy at baseline and during three years of follow-up we examined the appearance of SCD, its longitudinal internal consistency and the transition from normal cognition to MCI stage over time.
Since the study and definition of SCD have been heterogeneously treated in the literature [6], and this is probably the reason whereby the prevalence of SCD in older adults may range from 10 to 80% depending on the studies [10–13], we decided to base our study on the guidelines provided by the SCD-I [8]. We operationally defined a robust procedure to measure and characterize SCD. Cognitive complaints were assessed twice and independently within the same visit; first during the neurological examination and then during the neuropsychological evaluation. The combination of all these data at baseline showed that 78% of individuals reported SCD. Although this prevalence is slightly higher than that of other similar studies [31], this fact could be explained due our cohort is a little older. Interestingly, during the follow-up we found that about half of individuals who did not report complaints at baseline did manifest cognitive concerns in the following years. We interpret this finding as an expected consequence of aging. Although the transition from non complaints status to SCD status have been previously described [32], to our knowledge our study is the first in which the assessment of SCD has been collected annually with a very strict and well-defined operational criteria as well as including two subgroups of complaints, namely SCDg and SCD-Pg, according to the guidelines given by the SCD-I [8].
The preliminary cross-sectional analyses among SCD groups at baseline did not find differences in age, gender and ApoE. Nevertheless, as expected the results did highlight that depressive and anxiety symptoms were more frequent in both SCD groups, especially for SCD-Pg, compared to NCg. Regarding neuropsychological assessment, SCD-Pg showed the worst cognitive performance compared to the other two groups though the scores in tests were in the range of normal cognition.
To test our first aim about proving the stability of the SCD construct over time, we focused on analyzing longitudinally the percentage of concordance and discrepancies related to the classification of individuals in SCD groups. As expected, the number of discrepancies increased with the duration of follow-up what may be explained by the greater number of options to group subjects. The concordance analyses with Cohen’s and Fleiss’ kappa indices showed a good agreement in the classification of SCD groups what confirmed that the concept of SCD has a considerable internal consistency over time when it is operationally defined and consistently assessed. Our hypothesis was therefore confirmed and SCD fulfils one of the requirements to be considered as a potential marker for early detection of AD [14].
For our second goal, to examine the association between SCD and conversion rate to MCI, in a preliminary analysis we obtained that the rate of conversion to MCI was directly related to the presence of SCD-P and dramatically increased up to almost 43% when SCD-P remains stable over time. This result is according to previous findings [33]. However, since the boundaries between the SCD groups may be permeable due to the intrinsic criteria used for classifying individuals, we performed a Multi-state Markov Model to test the AD continuum hypothesis in its preclinical stage and to better identify the underlying trajectory of SCD over time. The results showed a clear sequential trend transitioning from cognitively healthy individuals with No SCD to SCD/SCD-Plus and, finally, MCI. In the three-year follow-up of this study, 50% of participants with No SCD at baseline progressed to a SCD stage characterized by the presence of a self-perception of cognitive failures. From this stage, almost 80% remained as SCD through the whole follow-up and 12% did progress to a SCD-Plus phase which might be conceived as the previous stage of MCI. Interestingly, the possibility of reversion from SCD to No SCD during the follow-up was very unlikely (7%). Finally, we found that the greatest probability to convert to MCI was up to 12 times higher for individuals at SCD-Plus status. Overall, these results about change show a parsimonious and detailed scenario of how individuals move into and out of the different SCD categories. Most importantly, beyond biomarkers this is the empirical demonstration of the existence of a continuum in the preclinical phase of AD with three well-defined statuses that have different probabilities to develop future MCI.
There are some limitations in this work that we want to address. First, the follow-up time may be not large enough to appreciate the expected changes that must appear in a disease so insidious like AD in which progression may happen in a wider period of time. Since Vallecas Project is still in progress we will minimize this limitation through the longitudinal follow-up of our cohort by further analyzing whether transition probabilities of developing MCI increase for SCD-Plus against SCD and No SCD. Second, in our study we do not have available information on CSF/PET biomarkers to confirm that SCD and MCI are due to underlying AD pathology and thus we cannot rule out other ulterior neurological and psychiatric conditions which are well-known to lead to SCD and MCI. Nevertheless, in the context of this project, we do rely on complete clinical and cognitive profiles of every participant so we can obtain confirmation of the diagnosis in the follow-up, as well as the clinical trajectories that mostly match with AD.
Our study has a powerful strength regarding the analytic approach to examine the role of SCD on cognitive decline. Unlike the majority of studies that follow a static, traditional, and cross-sectional methodology -that is, grouping individuals based on SCD features just once at baseline and analyzing their risks ratios of progression through the AD spectrum-, our research implements a novel, comprehensive, and longitudinal approach to further investigate the temporal dynamics of SCD as well as transitions through preclinical stages during the whole follow-up. Thus, to our knowledge this is the first time that it has been observed the existence of a real transition within the preclinical AD stage until prodromal MCI (Fig. 2). Additionally, we would like to point out another remarkable strength of our study: the proposal of a methodological, systematic, and reproducible way of recording SCD. This provides a consistent, robust and well operationally defined construct that allows monitoring preclinical AD stages.

Hypothetical dynamic transition through AD continuum. This graphic represents the hypothetical dynamic of preclinical AD phases according to a major risk of developing future MCI. Overall, two main stages can be identified, namely No SCD and SCD, as well as a sub-stage called SCD-Plus within SCD. Based on our results, progression may occur from No SCD to SCD, but oposite transitions from SCD to No SCD are very unlikely. Once an individual is at the SCD phase there may be a progression to a severe form of cognitive concerns, the sub-stage SCD-Plus, in which the hazard of MCI is the highest compared to No SCD and SCD. Nevertheless, since the criteria for classifying SCD-Plus are very restrictive, permeability is possible between SCD and SCD-Plus and thus individuals might be gone through or back over time. AD, Alzheimer’s disease; MCI, mild cognitive impairment; SCD, subjective cognitive decline.
To summarize, self-report of subtle cognitive decline appears at the end of the preclinical phase of AD even in the absence of significant objective impairment detectable on standardized neuropsychological assessment. As a novel marker, SCD must address some challenges before being considered as a real predictor of future MCI and dementia. The most crucial challenge, internal consistency over time, has been now proved by our pioneer study, which is the first one as far as we know that analyzes the temporal dynamics of SCD. It has been also highlighted that there is a progressive transition from No SCD to SCD and SCD-Plus statuses. Thus every successive preclinical status indicates higher risk of future MCI, focusing on SCD-Plus as the one that requires special attention in terms of early preventive intervention. The strength of SCD measurements is that is a non-invasive, easy, and low-cost method for screening both patients attending to memory units and general population. This marker could facilitate not only a fast and easy identification of individuals at higher risk for a premature cognitive impairment, but it allows us to better track the longitudinal trajectory of individuals. SCD therefore could become extremely useful in coming years to measure the effectiveness of new clinical trials with AD modifying therapies at preclinical phases which are supposed to be still recoverable.