
Abstract
Given the heterogeneous nature of frontotemporal dementia (FTD), sensitive biomarkers are greatly needed for the accurate diagnosis of this neurodegenerative disorder. Circulating miRNAs have been reported as promising biomarkers for neurodegenerative disorders and processes affecting the central nervous system, especially in aging. The objective of the study was to evaluate if some circulating miRNAs linked with apoptosis (miR-29b-3p, miR-34a-5p, miR-16-5p, miR-17-5p, miR-107, miR-19b-3p, let-7b-5p, miR-26b-5p, and 127-3p) were able to distinguish between FTD patients and healthy controls. For this study, we enrolled 127 subjects, including 54 patients with FTD, 20 patients with Alzheimer’s disease (AD), and 53 healthy controls. The qRT-PCR analysis showed a downregulation of miR-127-3p in FTD compared to controls, while the levels of other miRNAs remained unchanged. Then, miR-127-3p expression was also analyzed in AD patients, finding a different expression between two patient groups. A receiver operating characteristic curve was then created for miR-127-3p to discriminate FTD versus AD (AUC: 0.8986), and versus healthy controls (AUC: 0.8057). In conclusion, miR-127-3p could help to diagnose FTD and to distinguish it from AD.
INTRODUCTION
Frontotemporal lobar degeneration (FTLD) is a neurodegenerative syndrome characterized by atrophy in the frontal and temporal lobes of the brain [1, 2]. The disorder is the third most common dementia subtype with a prevalence ranging from 3% to 26% [3]. Clinically, patients present with either changes in behavior and personality (behavioral variant frontotemporal dementia, bvFTD), or language impairment (primary progressive aphasia, PPA). PPA can be further divided into two main subtypes, semantic variant (svPPA) and non-fluent variant (nfvPPA) [4]. Moreover, different mutations have been found in genes such as those encoding Microtubule Associated Protein Tau (MAPT), Progranulin (GRN), Chromosome 9 open reading frame 72 (C9ORF72), TAR DNA-binding protein 43 (TDP-43), Fused in Sarcoma binding protein (FUS), Valosin-Containing Protein (VCP), Charged Multivesicular Body Protein 2B (CHMP2B) [5], and, recently, TANK-binding kinase 1 [6].
The diagnosis of the FTD spectrum of diseases is based on clinical symptoms. This hampers the differentiation of the diseases among each other and with other disorders that show a similar clinical appearance resulting in a high rate of misdiagnoses, so that a total of 10–30% of patients presenting with an FTD clinical syndrome are found to have Alzheimer’s disease (AD) on autopsy [7].
Accurate diagnosis is important for early and correct treatment of the diseases and for drug development. Great efforts have been made in the past to identify biomarkers especially in the cerebrospinal fluid (CSF) to improve differential diagnosis of FTD [8], but only a few potential biomarker candidates have been described in recent years. In this scenario, new biomarkers for FTD are needed to improve differential diagnosis within the disease spectrum and for related neurodegenerative diseases such as AD.
Notably, circulating miRNAs have been reported as promising biomarkers for neurodegenerative disorders and processes affecting the central nervous system, especially in aging [9, 10].
Different studies showed that miRNAs are playing an important role in FTD pathology [11, 12]. For example, several reports have evaluated miRNAs regulation of the progranulin gene, suggesting that it is under their control, as described for miR-29b, miR-107, and miR-659 [13–15].
Apoptosis appears to play a key role in the progression of several neurologic disorders as demonstrated by studies on animal models and cell lines [16, 17]. Brains of patients with neurodegenerative diseases are usually associated with significant cell loss accompanied by typical morphological features of apoptosis such as chromatin condensation, DNA fragmentation, and activation of cysteine-proteases [18]. To date, we know from literature that miR-29b-3p, miR-34a-3p, miR-16-5p, miR-17-5p, mir-107, miR-19b-3p, let-7b-5p, and miR-127-3p mediate apoptosis induced by hypoxic/ischemic or spinal cord injury. Moreover, miR-26b causes activation of cyclin-dependent kinase 5 and increase tau phosphorylation, followed by apoptosis and neurodegeneration. Therefore, we wondered whether the levels of these miRNAs were abnormal in the plasma of patients with FTD [19–41]. To search for novel plasma miRNA signatures that can distinguish patients from healthy individuals, we selected nine miRNAs (miR-29b-3p, miR-34a-5p, miR-16-5p, miR-17-5p, miR-107, miR-19b-3p, let-7b-5p, miR-26b-5p, and miR-127-3p), which have been reported to be closely correlated with apoptosis and/or dementia.
MATERIALS AND METHODS
Patient recruitment and clinical evaluation
Subjects were recruited consecutively at the Memory Clinic of University “Sapienza” (Rome, Italy), and at the Alzheimer’s Unit of IRCCS Neuromed (Pozzilli, Italy).
The study was approved by the Institutional Review Board of all centers and a written informed consent approved by the ethics committees was obtained from all participants involved in this study. The clinical diagnosis of probable FTD was defined according to current consensus criteria [42, 43]. The clinical diagnosis of probable AD was defined according to the DSM-IV and Alzheimer’s disease and Related Disorders Association (NINCDS-ADRDA) criteria [44] in a consensus diagnostic conference by a panel of neurologists and neuropsychologists. The healthy control groups (Ctrl) were enrolled among healthy volunteers: family members or caregivers unrelated to the patients, all undergoing a clinical interview with a neurologist with a completely normal cognitive and functional assessment. Moreover, all patients underwent standard evaluations that included 1) a detailed clinical history recorded from the patients and/or caregivers; 2) an extensive physical exam; 3) neurological examination; 4) an extensive neuropsychological testing including the Mini-Mental State Examination (MMSE); 5) laboratory tests to exclude secondary causes of dementia; 6) brain imaging (magnetic resonance imaging or computerized tomography); and 7) in most cases, 99mTc-HMPAO SPECT or FDG PET scan. Healthy subjects underwent clinical and neurological assessment including the administration of MMSE. All FTD patients were screened for possible mutations in MAPT, GRN, and C9ORF72 genes.
RNA isolation from plasma
Whole blood was recovered in tubes treated with EDTA and centrifuged for 15 min at 2500 rpm at 4°C. Plasma layer was carefully collected without shaking the buffy coat. Total RNA was extracted from 250μL of plasma using a miRNeasy mini kit (Qiagen), following the manufacturer’s recommendations. 1μg of MS2 bacteriophage RNA (Roche Diagnostics) was added to each sample to improve endogenous RNA recovery. Qubit RNA HS Assay Kit (Thermo Fisher Scientific) was used with the Qubit Fluorometer, to provide an accurate method for the quantification of low-abundance RNA samples. Evaluation of possible hemolysis contamination was carried out by comparing the level of a miRNA highly expressed in red blood cells (hsa-miR-451a), with a miRNA unaffected by hemolysis (hsa-miR-23a-3p) [45]. ΔCt (miR-23a-3p - miR- 451a) gives a measure of hemolysis degree: ΔCt values of more than five indicate a possible erythrocyte miRNA contamination, and values of 7–8 or more a high risk of hemolysis.
miRNA reverse transcription and quantitative real time PCR (qRT-PCR)
80 ng of extracted RNA were retro-transcribed using Universal cDNA Synthesis kit (Exiqon) according to the manufacturer’s protocol. cDNA template was then diluted 50X in nuclease free water and mixed 1:1 with 2X PCR Master Mix (Exiqon). For miRNA quantitative PCR assays, samples were analyzed in triplicates using miRCURY LNATM PCR primers set (Exiqon): hsa-miR-127-3p, hsa-miR-29b-3p, hsa-miR-191-5p, hsa-let-7d-5p, hsa-miR-107, hsa-miR-132, and endogenous control hsa-miR-93-5p. qRT-PCR reactions were performed using ExiLENT SYBR® Green master mix (Exiqon) in a CFX384 Real-Time PCR Detection System (Bio-Rad Laboratories). 10μl PCR reaction contained 2μl of the 1:80 diluted cDNA template, 5μl of SYBR® Green master mix, and 1μl of PCR primer mix. The reaction protocol was as follows: 95°C for 10 min, followed by 40 amplification cycles of 95°C for 10 s and 60°C for 1 min. Raw Ct values were normalized using the ΔCt method with respect to the endogenous control. In order to select the endogenous control, we tested five miRNAs as reference genes (hsa-miR-93-5p, hsa-miR-103, hsa-miR-191, hsa-miR-423-3p, and hsa-miR-425-5p) checking their expression levels and stability in our samples by using Normfinder and Genorm software [46, 47].
Statistical analysis
Continuous data are summarized by mean and standard error, or median and interquartile range. Categorical variables are described by frequency and percentage distributions. Comparisons between experimental groups were assessed by the t-test or Mann-Whitney test for continuous variables, and by Fisher’s exact probability test and Pearson’s chi-square test for categorical variables. Spearman’s rank correlation coefficient was used to investigate association between continuous variables.
The effectiveness of ΔCt in discriminating between groups was assessed by the Receiver Operating Characteristic (ROC) curve analyses. Non-parametric ROC curves were obtained for FTD versus Ctrl and FTD versus AD. The area under the ROC curve (AUC) and its 95% confidence interval (95% CI) were calculated as a measure of diagnostic accuracy. Cut-points for ΔCt with fixed sensitivity and specificity were obtained from analysis of the ROC curve. The level of significance was 0.05 and Bonferroni’s correction was adopted to control for type I error in multiple comparisons. All statistical analyses were carried out by the software STATA 13 (StataCorpLP).
RESULTS
127 subjects were enrolled in our study, including 54 probable FTD patients (31 bvFTD and 23 PPA), 20 AD patients, and 53 Ctrl. Patient and Ctrl characteristics are summarized in Table 1. All patients had a MMSE ranging from 10 to 24.
Demographic and clinical features of subjects in the study
1Fisher’s exact probability test;
2t-test.
All patients were sporadic and no mutations were found in the genes most involved in FTD: MAPT, GRN, and C9ORF72. Before the qRT-PCR, we verified possible cellular and hemolysis contamination and to minimize the carry-over of inhibitors into the RNA samples monitoring sample quality, in order to successfully analyze miRNAs expression. Then, we selected and tested five miRNAs as reference genes (hsa-miR-93-5p, hsa-miR-103, hsa-miR-191, hsa-miR-423-3p, and hsa-miR-425-5p). We checked their expression levels and stability in our samples by using Normfinder and Genorm software, showing that miR-93-5p is the most highly expressed and stable among the five selected miRNAs (Supplementary Figure 1).
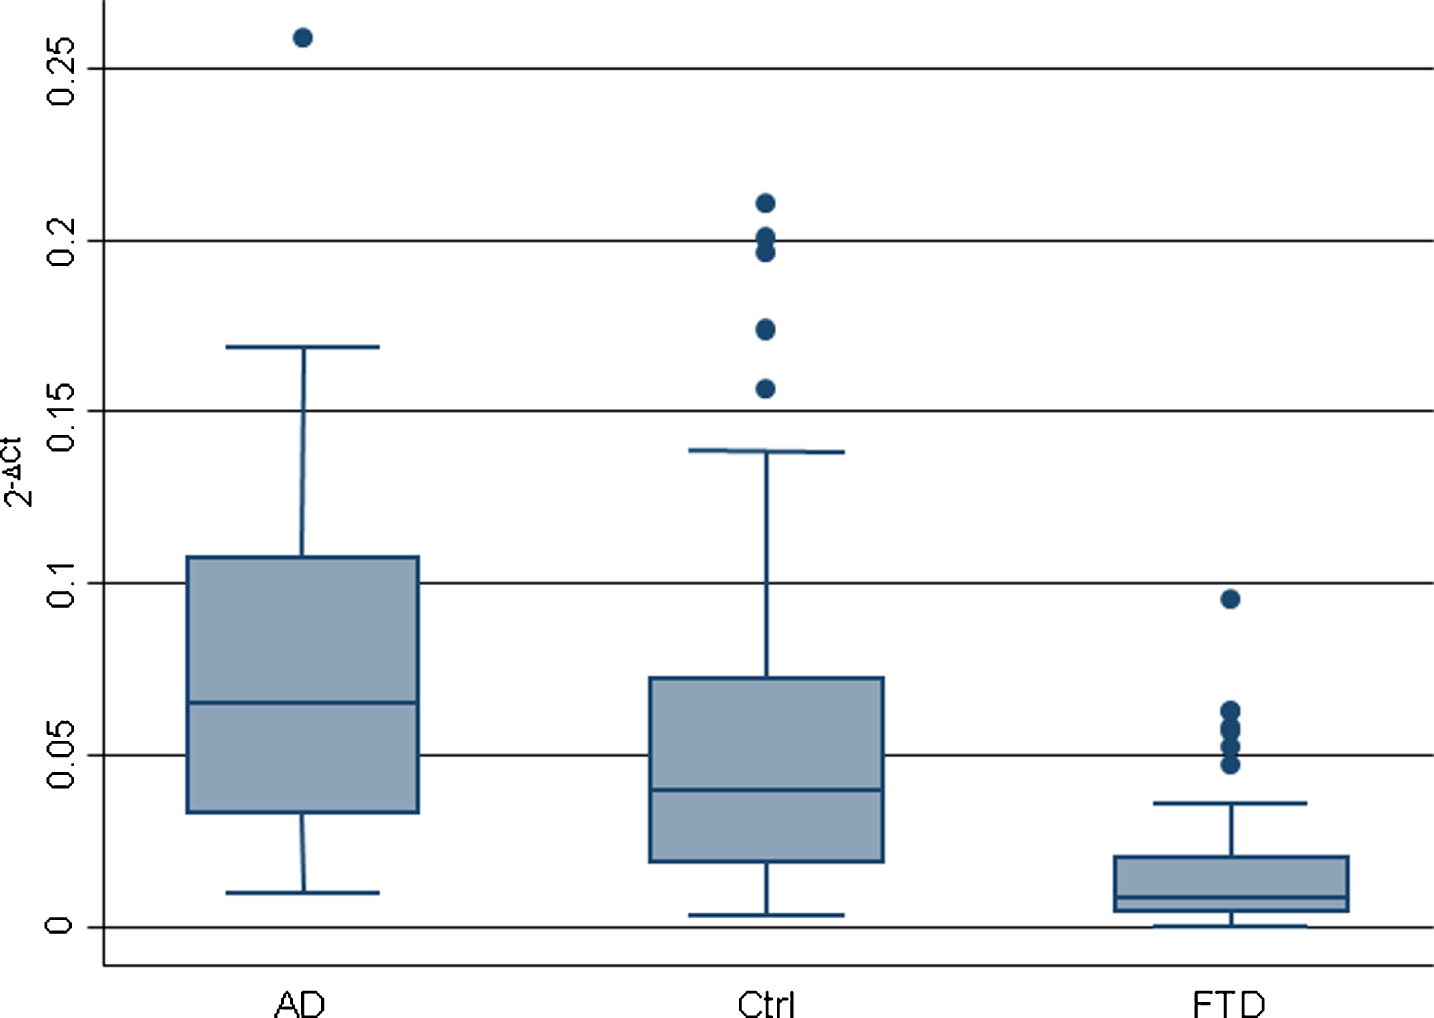
Box plots show the distribution of miR-127-3p values in AD (n = 20), Ctrl (n = 53), and FTD (n = 54) subjects. The line in the middle of the box represents the median. The box extends from the 25th percentile (x[25]) to the 75th percentile (x[75]), the so-called interquartile range (IQ). The lines emerging from the box extend to the upper and lower adjacent values. The upper adjacent value is defined as the largest data point less than or equal to x[75] + 1.5 IQ. The lower adjacent value is the smallest data point greater than or equal to x[25] –1.5 IQ. Dots indicate observed data points more extreme than the adjacent values (referred to as outliers).
miR-29b, miR-34a, miR-16-5p, miR-17-5p, miR-107, miR-19, let-7b, miR-26b, and miR-127-3p were screened by qRT-PCR, as possible candidate miRNAs able to discriminate FTD from cognitively healthy controls. The analysis showed the downregulation of miR-127-3p in FTD respect to Ctrl (0.017±0.003 versus 0.058±0.007 p < 0.0001) (Fig. 1 and Table 2). The other analyzed miRNAs did not show significant difference in FTD with respect to Ctrl (Supplementary Figure 2).
Comparisons among groups (Ctrl, AD and FTD) of miR-127-3p levels
The table shows the number of subjects in each group, the average raw 2–ΔCt and standard error of miR-127-3p levels, and p value for each comparison.
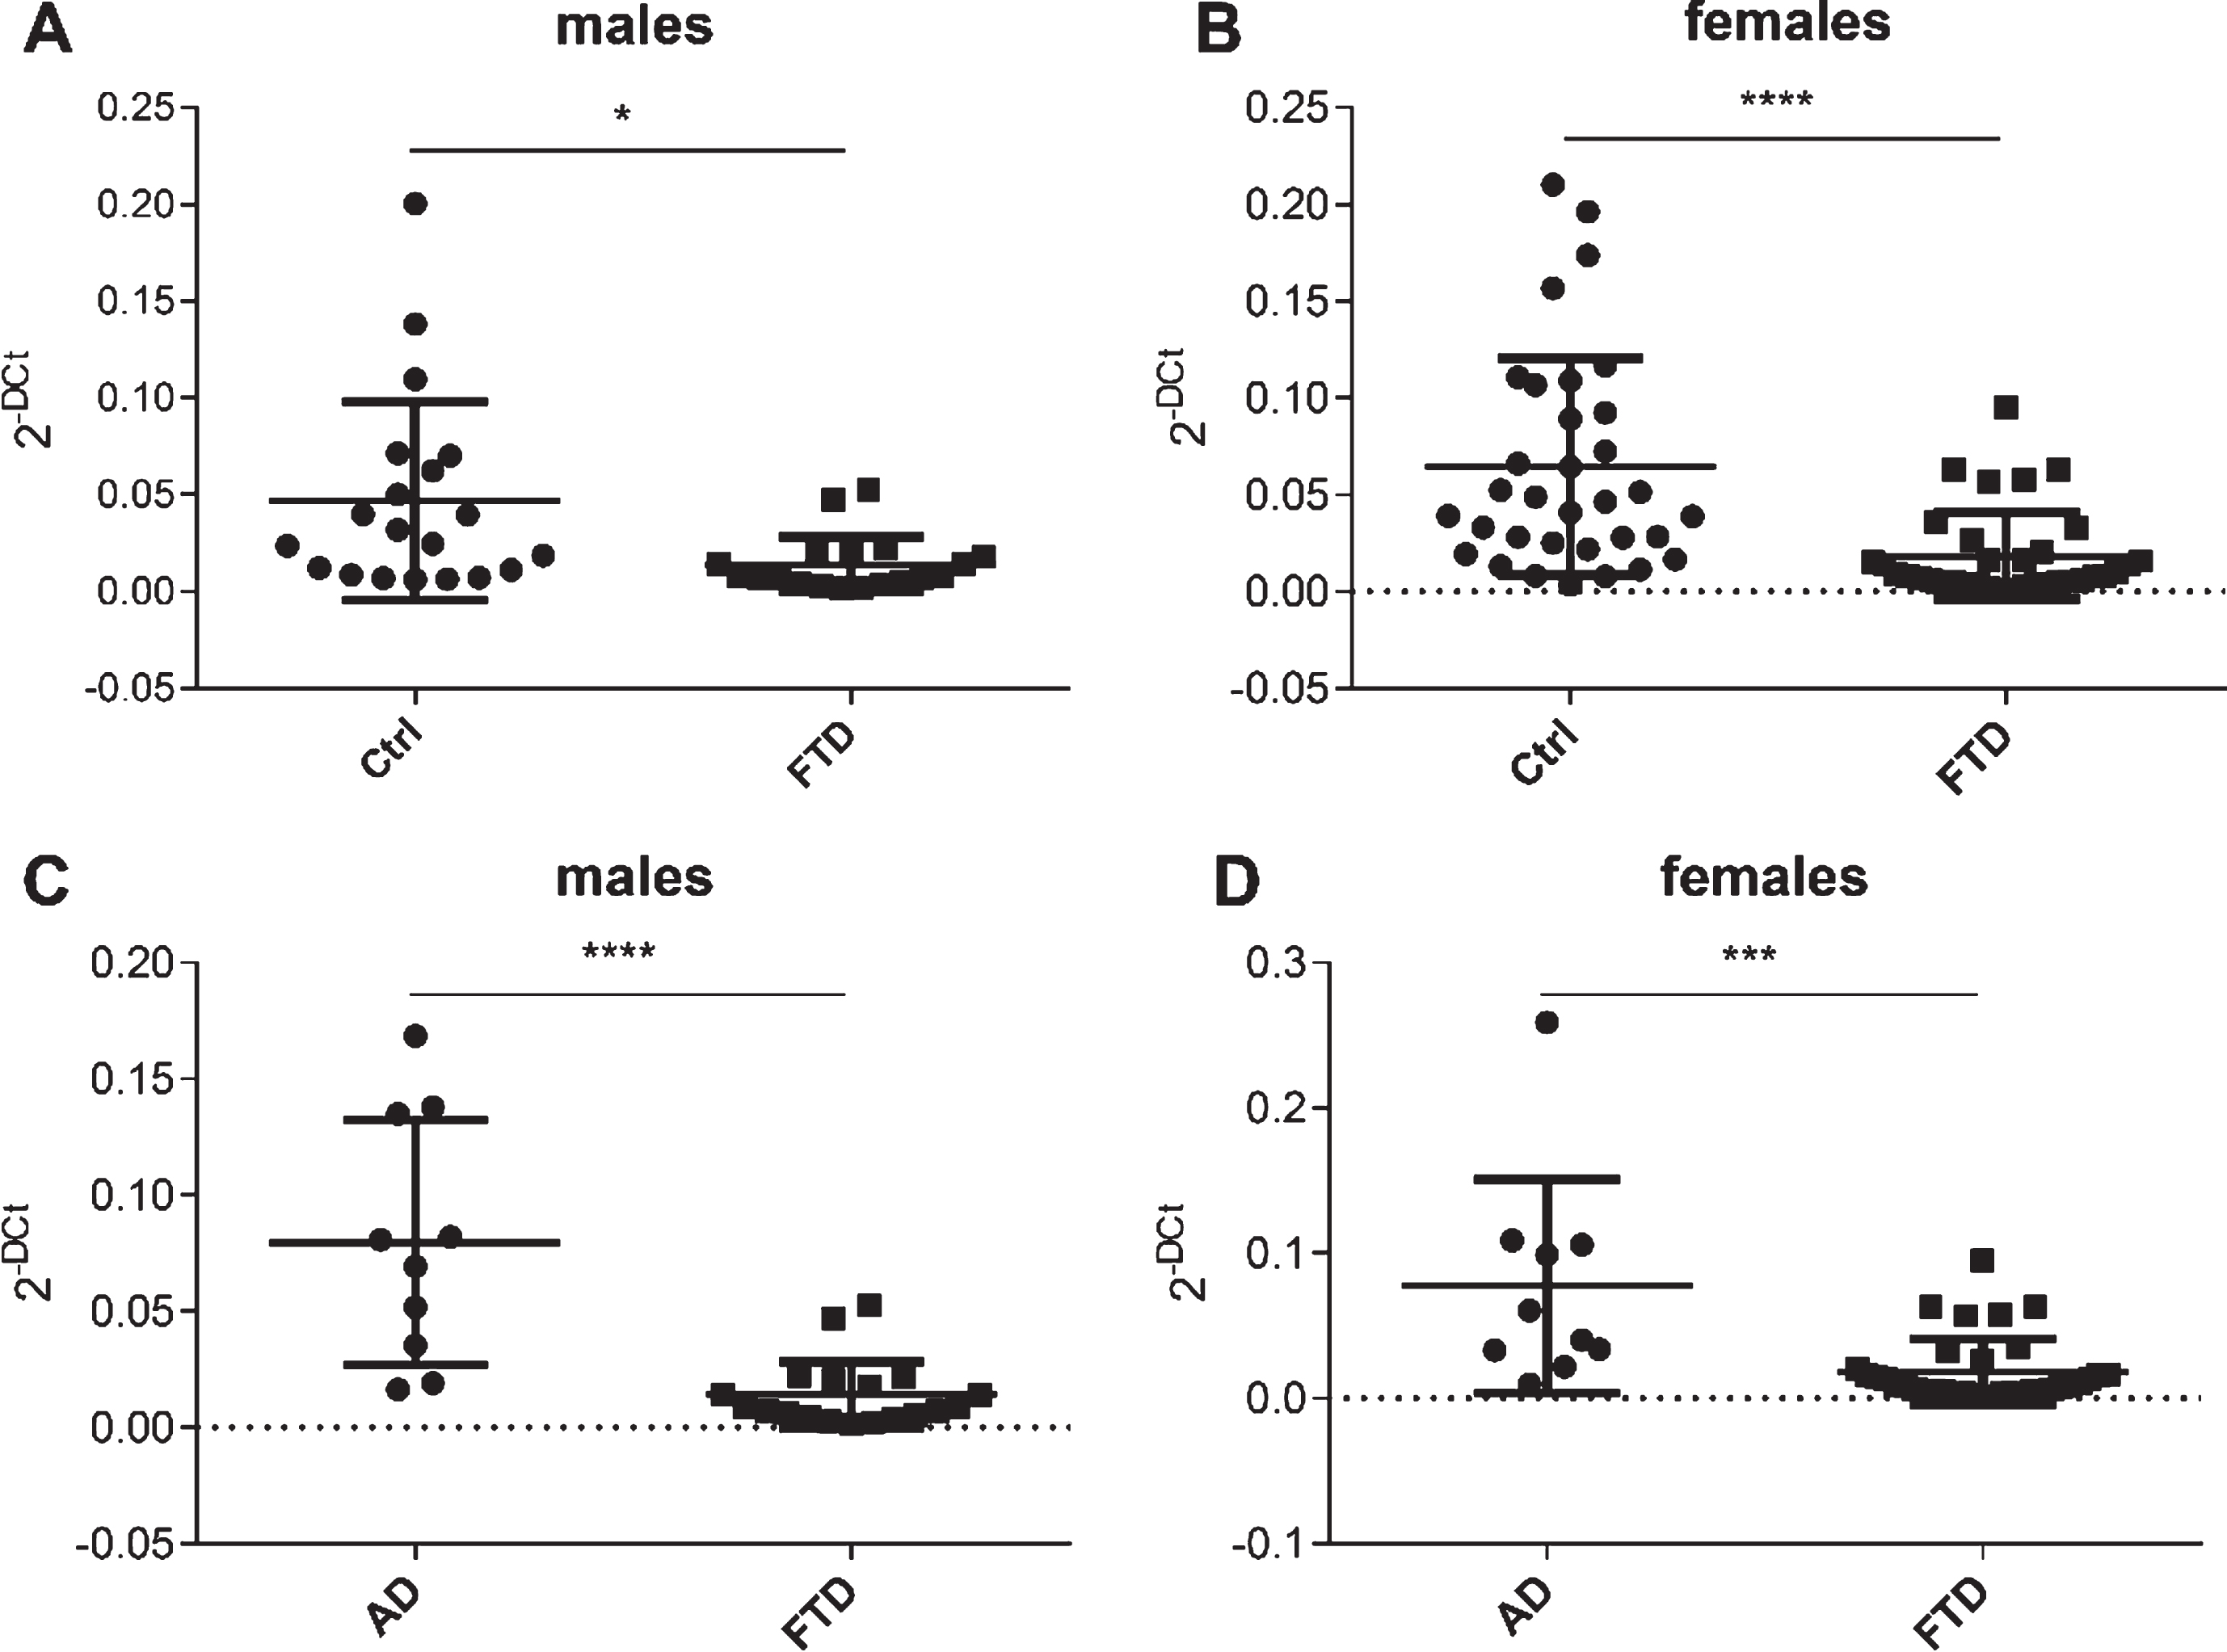
Scatter plots of miR-127-3p expression levels in FTD versus Ctrl and in FTD versus AD in males (A, C) and females (B, D).
miR-127-3p expression was also analyzed in patients with AD, finding a different expression between them (FTD 0.017±0.003 versus AD 0.078±0.014 p < 0.0001). Moreover, an upregulation of miR-127-3p was observed in AD subjects with respect to Ctrl, close to significance (AD 0.078±0.014 versus Ctrl 0.058±0.007 p = 0.18) (Fig. 1 and Table 2).
When all subjects were stratified on subgroups by gender, we found that significant differences of miR-127-3p levels between FTD and Ctrl, and between FTD and AD were observed both in males and in females (Fig. 2).
Diagnostic accuracy of miR-127-3p expression levels was measured by AUC (95% CI) of ROC curves. AUC to discriminate FTD was 0.8057 (0.7242–0.8872) versus Ctrl (Fig. 3A) and 0.8986 (0.8275–0.9697) versus AD (Fig. 3B). The optimal cut-off values for detecting FTD versus Ctrl were selected. When the relative miR-127-3p value is under ΔCt 5.5, the sensitivity was 81.48% and the specificity was 69.81%. Moreover, the optimal cut-off values for detecting FTD versus AD were selected, as well. When the relative miR-127-3p value is under ΔCt 5.5, the sensitivity was 81.48% and the specificity was 80.00% (Table 3). As the box-plot in Fig. 1 shows some outliers, we tried to analyze diagnostic accuracy of miR-127-3p excluding them. We observed an AUC of 0.8382 (0.7602–0.9163) for FTD versus Ctrl and 0.9361 (0.8788–0.9934) for FTD versus AD (Supplementary Figure 3).
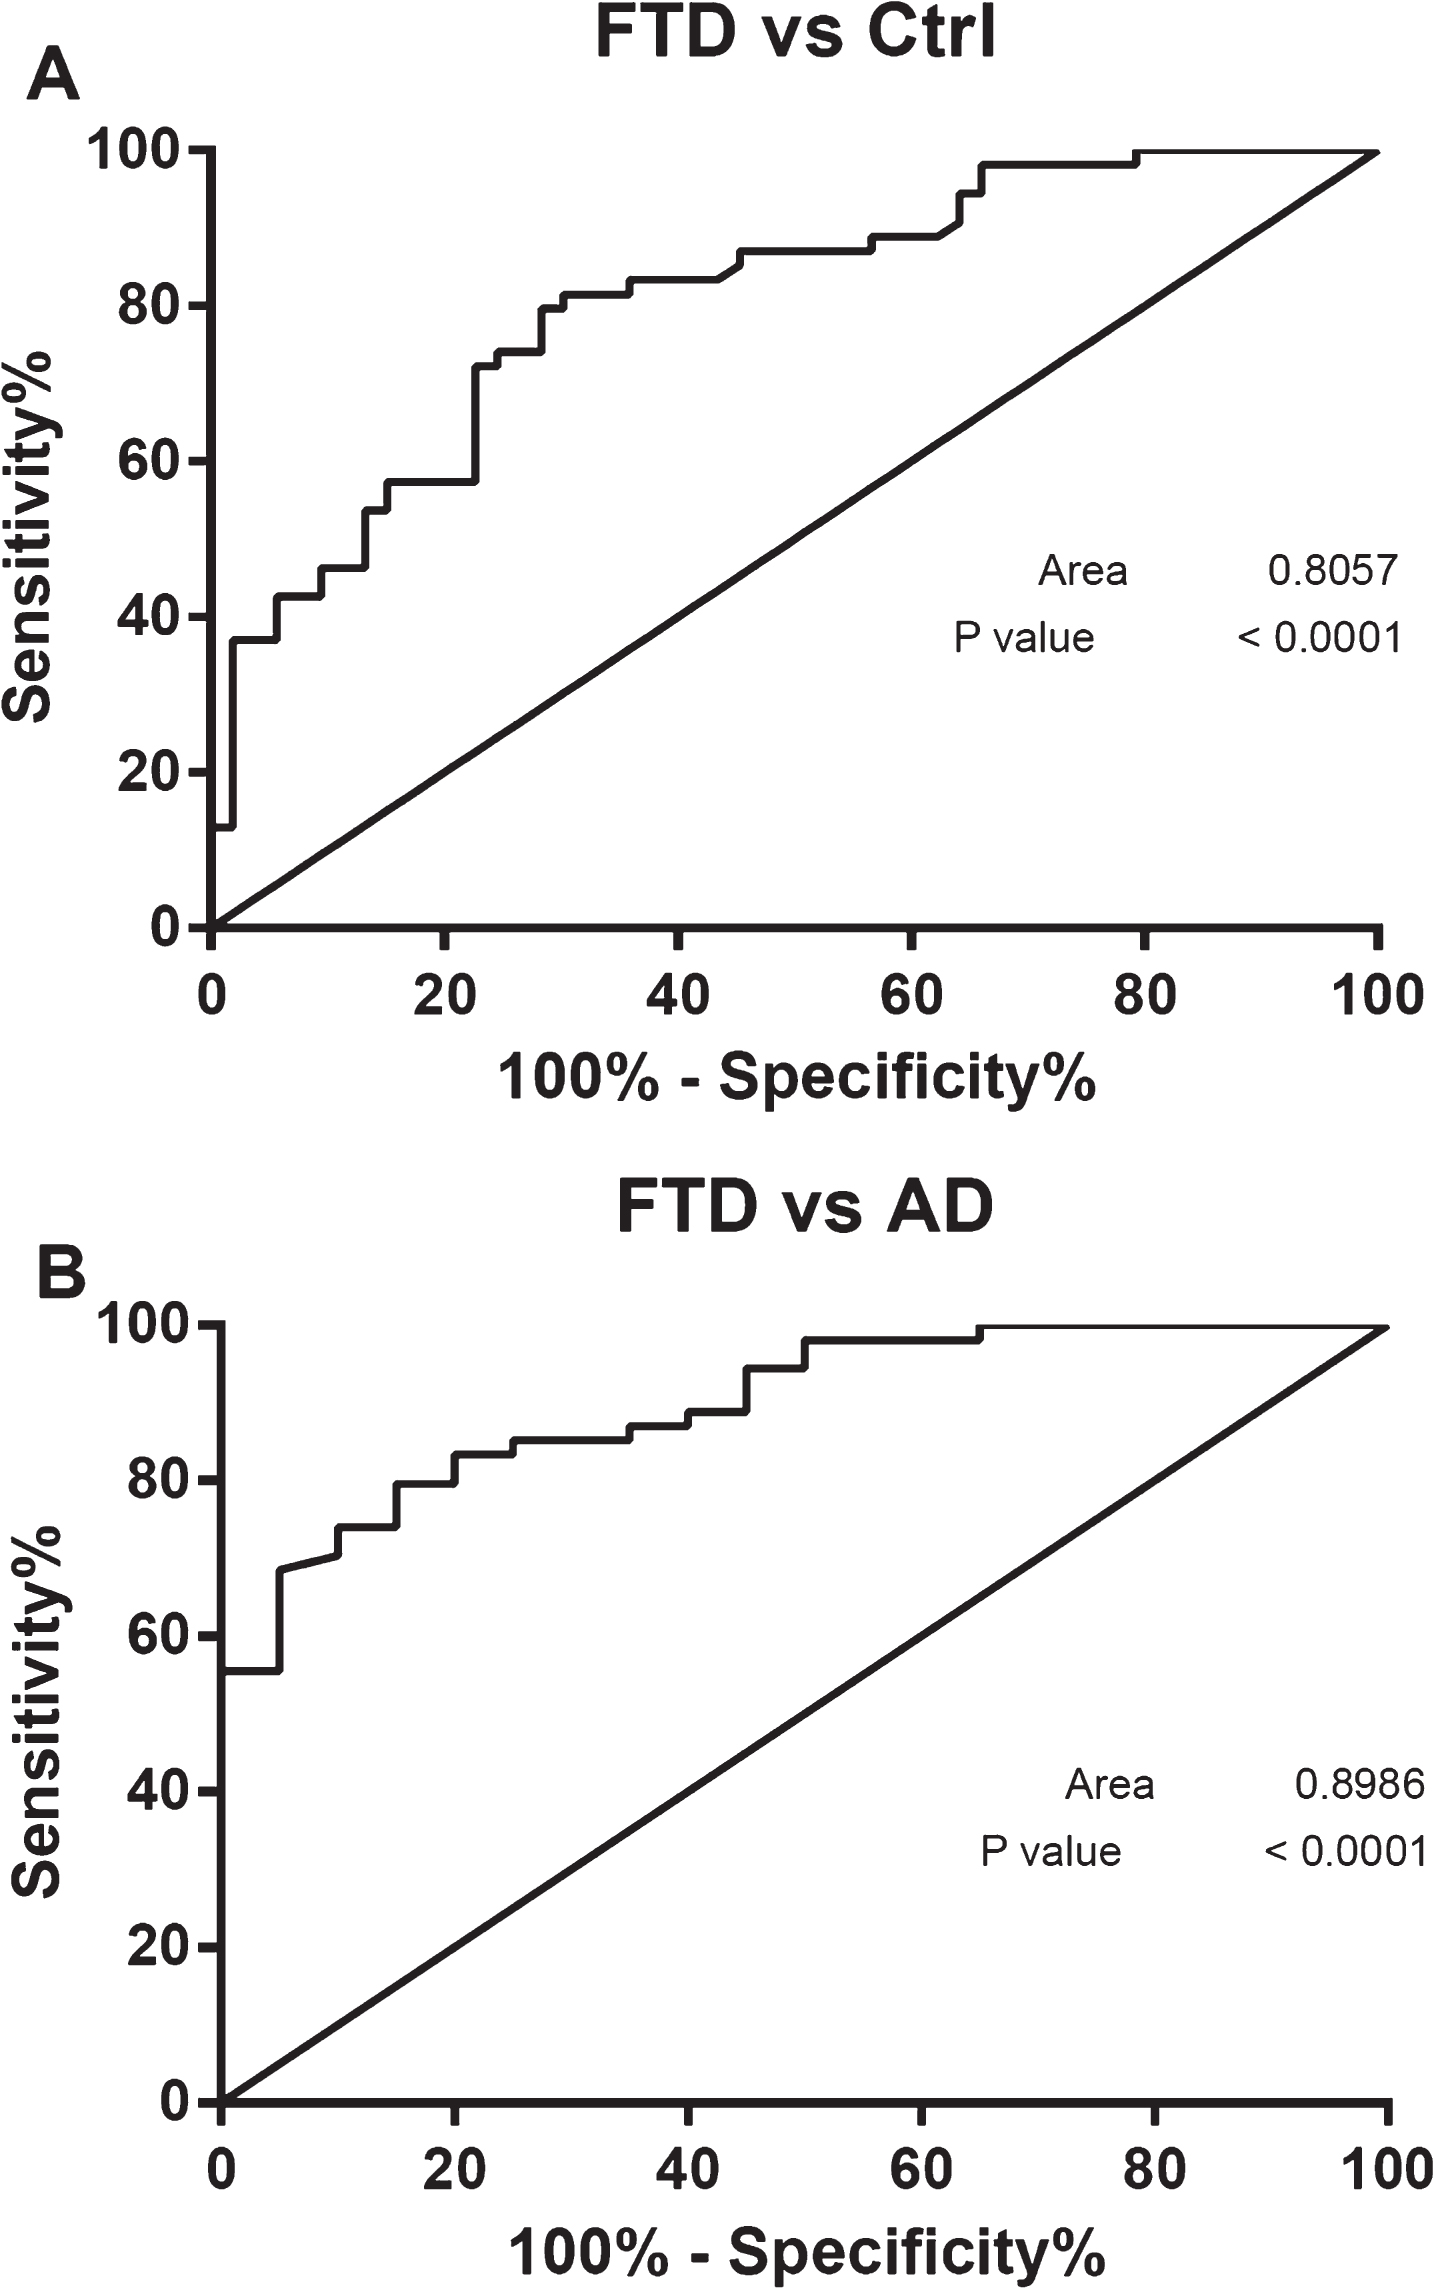
ROC curves of miR-127-3p. Receiver operating characteristic curve of differentially expressed miR-127-3p in A) FTD versus Ctrl and B) FTD versus AD.
Accuracy of ΔCT criteria by study population
When distinguished by gender, AUCs of miR-127-3p value to discriminate FTD versus Ctrl was 0.7684 in male (Fig. 4A) and 0.8264 in female (Fig. 4B) and to discriminate FTD versus AD was 0.9263 in males (Fig. 4C) and 0.8714 in females (Fig. 4D).
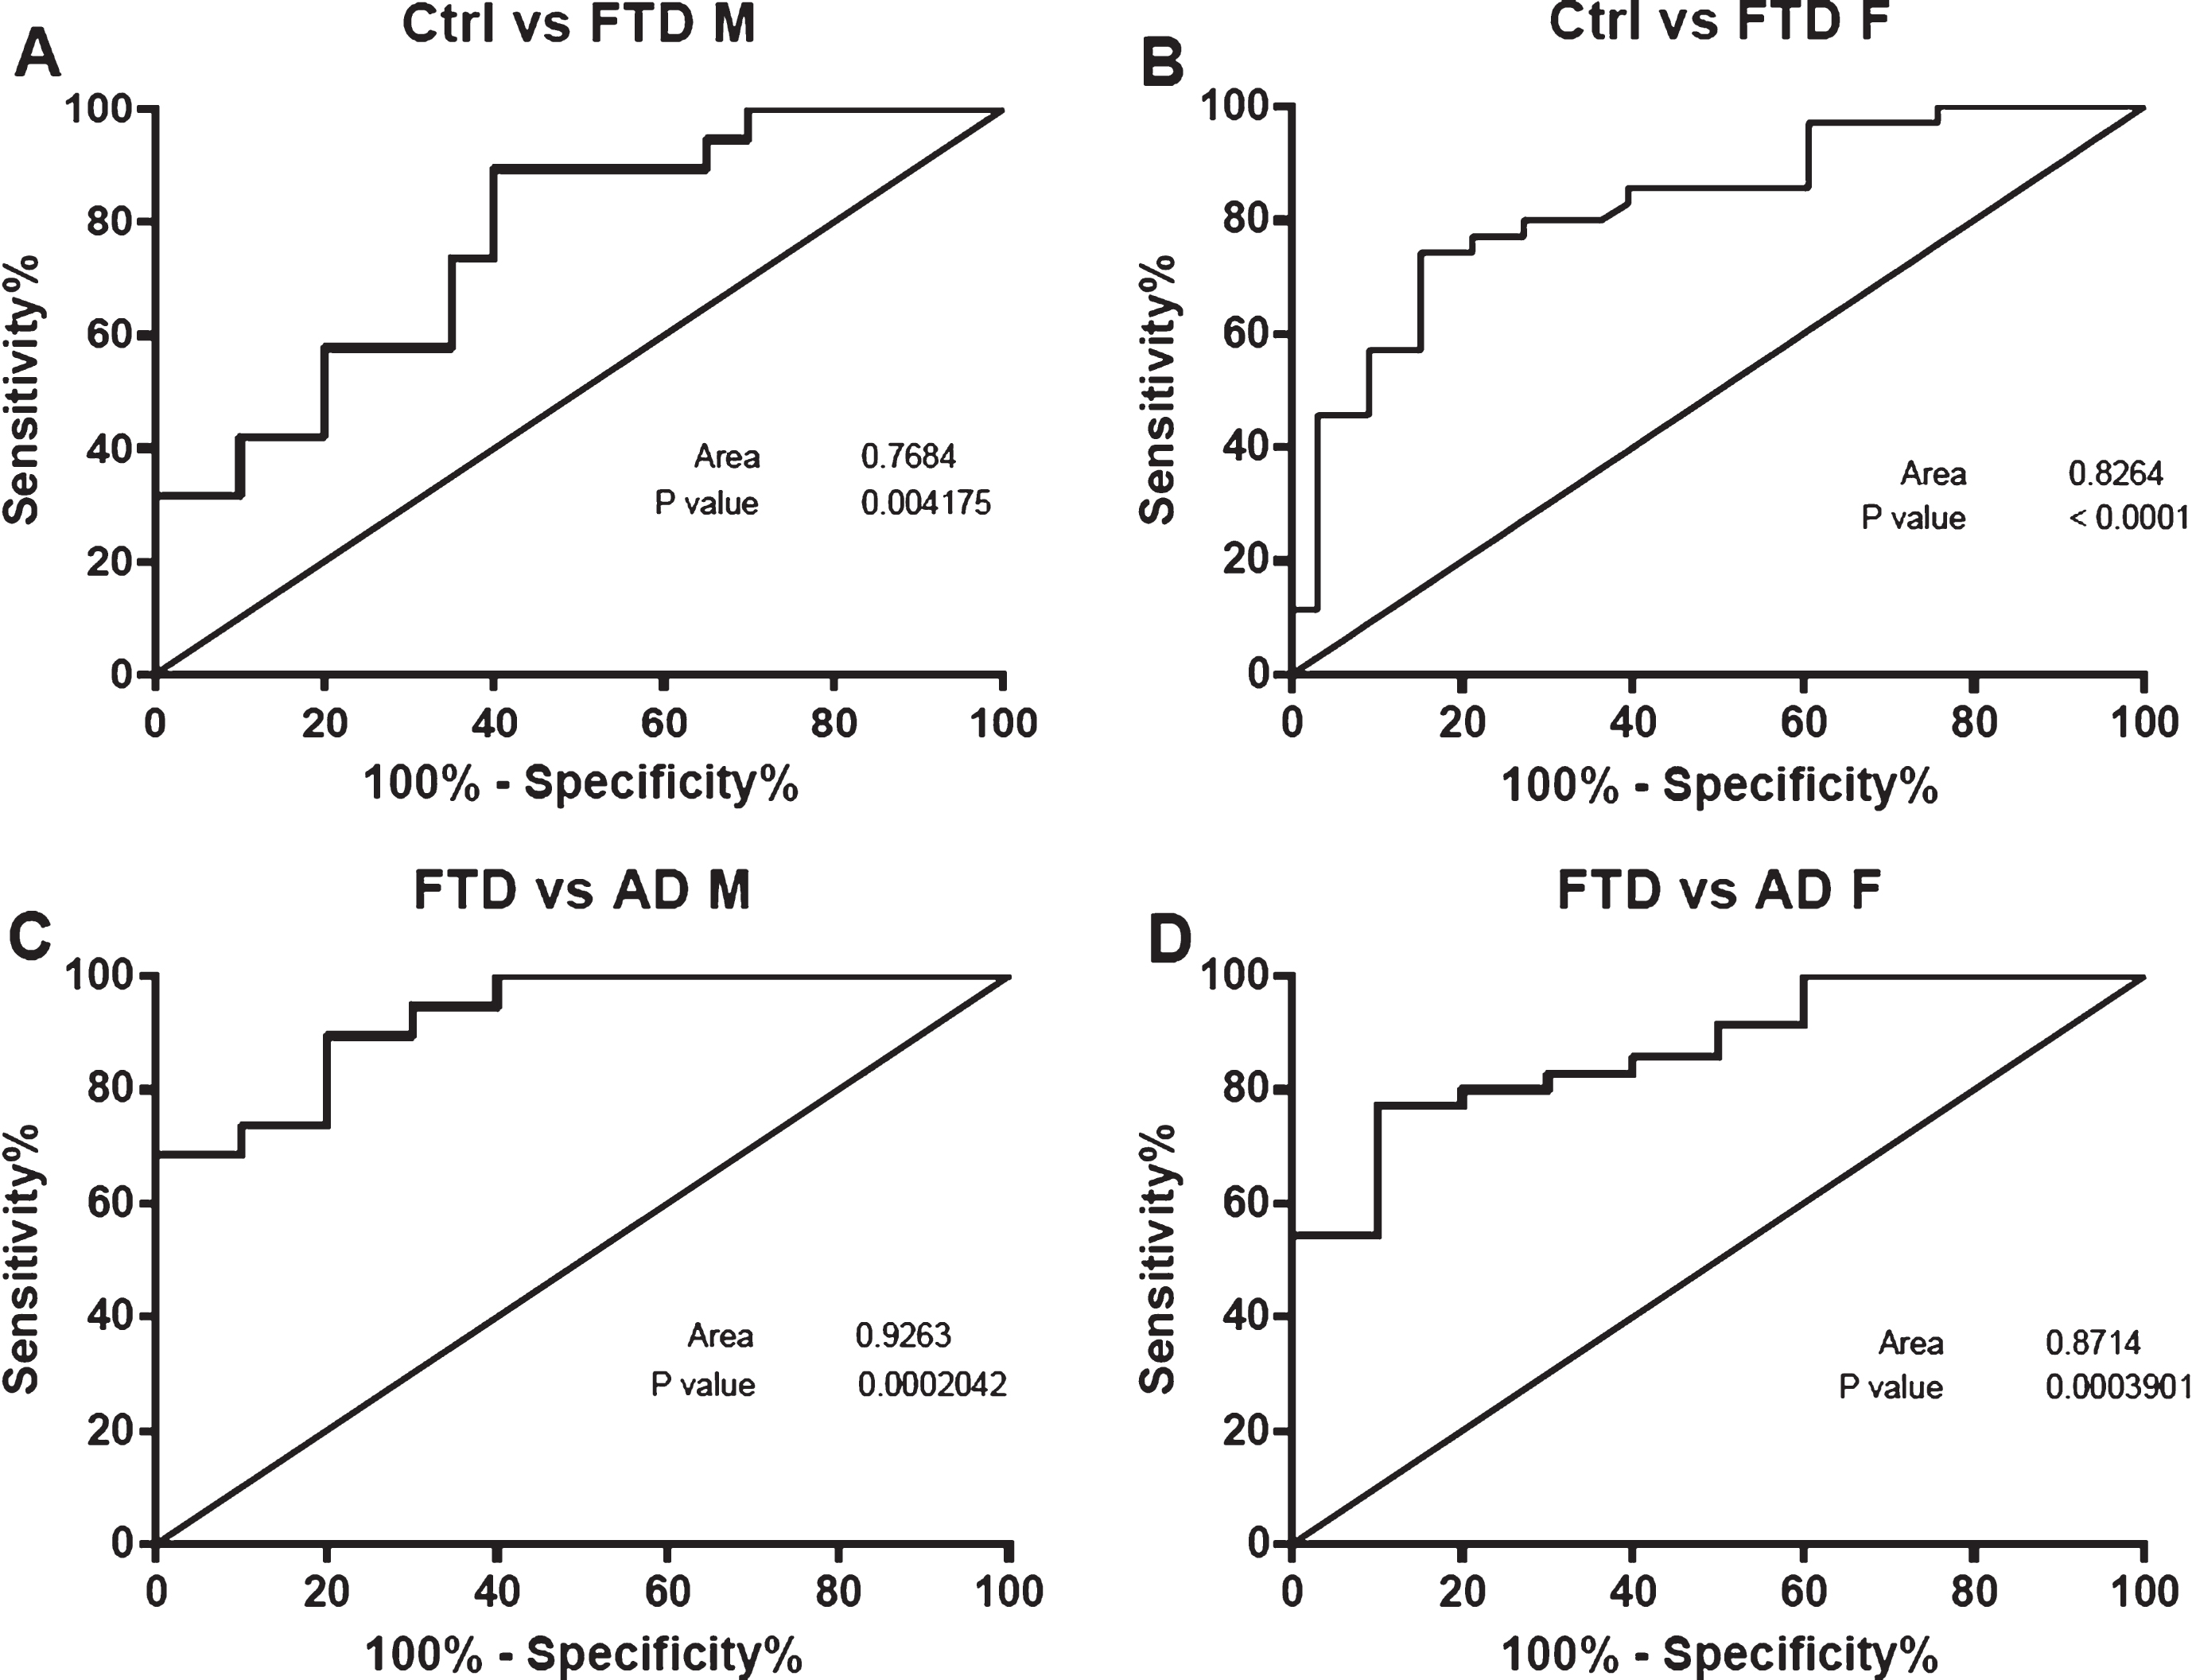
ROC curves of miR-127-3p analysed by gender. Receiver operating characteristic curve of differentially expressed miR-127-3p in males (A) FTD vs Ctrl (C) FTD vs AD and in females (B) FTD vs Ctrl (D) FTD vs AD.
Other authors have shown that the downregulation of miR-127 in rat liver cells promotes cell proliferation, while its upregulation inhibits proliferation [52].
Correlation of miR-127-3p level with clinical scores
The lag from disease onset to evaluation [median (IQR): 4.5 (4) and 4 (4), for FTD and AD respectively] did not differ among FTD and AD patients (Mann Whitney test, p = 0.9363). Moreover, there was no correlation between age at onset and lag from disease onset to evaluation (spearman’s rank correlation coefficient (p-value): –0.2243 (p = 0.1030) and –0.16 (p = 0.4939) in FTD and AD, respectively. Furthermore, miR-127-3p levels were not associated to lag from disease onset to evaluation both in FTD and in AD patients [Spearman’s rank correlation coefficient (p-value): –0.0734 (p = 0.5981) and –0.3810 (p = 0.0974), in FTD and AD respectively]. MMSE at evaluation was available for 51 of 54 FTD patients and for all AD patients. It did not differ among FTD and AD patients [median (IQR): 22 (13) and 18.5 (10.5) for FTD and AD respectively; Mann Whitney, p = 0.0920)]. miR-127-3p levels were not associated with MMSE both in FTD and in AD patients (Spearman’s rank correlation coefficient (p-value): –0.0823 (p = 0.5698) and –0.1198 (p = 0.6148).
DISCUSSION
Difficulties in accurate diagnosis of FTD require sensitive biomarkers support given the heterogeneous nature of the disorder. Great efforts to identify these biomarkers have been made over the past two decades, with a predominant focus on fluid biomaterial and neuroimaging features. In FTD, diagnostic biomarkers should discriminate among individuals with FTD, healthy subjects and individuals with other neurodegenerative diseases, and/or should differentiate among clinical, genetic, or pathological subtypes. Staging biomarkers should enable us to assess disease severity and to discriminate between presymptomatic, prodromal, and early or late symptomatic stages of the disease.
In this work, we propose a new biomarker, miR-127-3p, useful to improve the diagnosis of FTD. This is the first study demonstrating the dysregulation of miR-127-3p in plasma of patients with FTD. Although miR-127-3p is mainly known for its role in tumor diseases [48, 49], experimental data show that it affects the induction of neuronal apoptosis by regulating the expression of mitoNEET, an iron-sulfur cluster transfer protein that binds to the mitochondrial outer membrane [38]. In the central nervous system, miR-127-3p has been also described as a neuron-enriched miRNA playing a central role in neuronal differentiation [50, 51].
These observations suggest an important role for this miRNA in cell proliferation, differentiation, and development. Chen and colleagues observed that miR-127 induces senescence in human fibroblasts and inhibits the proliferation of breast cancer cells by targeting the oncogene BCL6; they suggest miR-127 as a novel senescence-associated (SA)-miRNA regulating cellular senescence [53].
Recently, miR-127-3p has also been considered a possible biomarker of different neurodegenerative diseases. Burgos and colleagues, profiling miRNAs content in CSF and serum by Next Generation Sequencing (NGS), found miR-127-3p upregulated in AD serum and downregulated in AD CSF when compared to neurologically normal age-matched controls. Moreover, miR-127-3p was also found downregulated in CSF of Parkinson’s disease (PD) patients compared with control subjects [54]. In our study on plasma, we observed a similar trend to Burgos’ serum data, but the statistical analysis resulted not significant (p = 0.18). Other authors have detected miR-127 involvement in other neurodegenerative diseases, such as multiple sclerosis (MS). Small RNA NGS was performed to profile exosome-associated miRNAs in serum samples from MS patients and healthy controls. They identified differentially expressed exosomal miRNAs in both relapsing-remitting MS and progressive MS patient sera in relation to controls. miR-127-3p was found upregulated in progressive MS patients with respect to controls [55].
In our study, we show that expression levels of miR-127-3p were lower in plasma from FTD patients compared to subjects with AD. Several works attempted to identify miRNAs, as useful candidates in the clinical differential diagnosis of dementia particularly for AD. A recent study investigated miRNAs expression patterns in patients diagnosed with AD and patients diagnosed with either vascular dementia, frontotemporal dementia, or dementia with Lewy bodies. They found that miR-29c-3p and miR-15a-5p had the highest classification accuracies separately, and by combing them in a simple ratio model (RELmiR-29c-3p/RELmiR-15a-5p), they found that AD patients could be distinguished from patients with other types of dementia (cut-off value 0.92) with a sensitivity of 90% and a specificity of 100% [56]. In another work investigating the assessment of circulating brain-enriched miRNAs as potential biomarkers for AD, FTD, PD, and amyotrophic lateral sclerosis, the authors revealed miRNA classifiers capable of differentiating neurodegenerative diseases from each other with accuracy ranging from 0.77 (AUC, 0.87) for AD versus FTD to 0.93 (AUC, 0.98) for AD versus amyotrophic lateral sclerosis [57]. Moreover, Vallelunga and colleagues identified three upregulated miRNAs in serum of MSA patients (miR-24, miR-34b, miR-148b) in comparison to PD patients [58].
By analyzing all subjects on subgroups characterized by gender, we found that miR-127-3p is differential expressed in FTD in both males and females. We chose to extend the analysis by gender considering that miR-127-3p is regulated by estrogen related receptor gamma [59]. Actually, recent studies suggest that the regulation of miRNA expression levels might be influenced by hormonal and genetic background [60]. Ziats and colleagues evaluated the gender-dependent miRNA expression in the prefrontal cortex of human brain. They discovered 40 miRNAs with significant expression differences between the prefrontal cortex of males and females. Strikingly, 93% were more highly expressed in females [61]. Several studies showed sex differences in miRNAs expression in patients with neurological diseases. Sheinerman and colleagues revealed sex dependence of certain brain-enriched miRNAs, which distinguished neurodegenerative diseases from HC in sex-specific subsets with a significantly higher accuracy than in the total (female and male) population [57]. In another study, Denk and colleagues described gender specific differences concerning miR-106a, miR-17, miR-320, miR-19a, miR-221, miR-532, and miR-95 in CSF of AD patients [62]. Moreover, miR-30b, regulated by estrogens, was observed to be significantly downregulated in female schizophrenic brains with respect to males [63]. Then, not considering possible differences between males and females in miRNA and, in general, in biomarker analysis could introduce a gender-bias in the study [64].
Few literatures exist on role of miR-127 in brain, so that speculating about a disease-specific pathogenic mechanism that could explain differences between AD and FTD is not possible. Additional studies exploring a potential biological function of this miRNA circulating in body fluids are required.
A limit of the study is the lack of a mild cognitive impairment (MCI) population to investigate miR-127 as biomarker for early diagnosis in a longitudinal study. The cohort Studies of Memory in an International Consortium (COSMIC) estimated MCI prevalence to be 5.9% in people 60 years and older [65]. The annual rate in which MCI progresses to dementia was 9.6% [66], even if an overall 18% reversion rate from MCI to normal control was calculated as well [67]. In those MCI cases destined to develop a dementia, biomarkers are emerging to help identify etiology and predict progression. In fact, subjects with MCI could benefit from early diagnosis and consequently potential treatment options, thus delaying their evolution and improving their quality of life and that of their relatives [68].
In conclusion, we show that expression levels of miR-127-3p were decreased in plasma from FTD patients compared to healthy subjects and patients with AD, suggesting that miR-127-3p could help to diagnose FTD and to distinguish it from AD.