
Abstract
Background:
Electroencephalography (EEG) power has previously been used to compare mild cognitive impairment (MCI) patients who progress to Alzheimer’s disease (pMCI) with patients with MCI who remain stable (sMCI) by using beta power. However, the beta band is very broad and smaller frequency bands may improve accuracy.
Objective:
In the present study, we wanted to investigate whether it was possible to find any differences between pMCI and sMCI using relative power and whether these differences were correlated to cognitive function or neuropathology markers.
Methods:
17 patients with AD, 27 patients with MCI, and 38 older healthy controls were recruited from two memory clinics and followed for three years. EEGs were recorded at baseline for all participants and relative power was calculated. All participants underwent adjusted batteries of standardized cognitive tests and lumbar puncture.
Results:
We found that pMCI showed decreased baseline relative power in the parietal electrodes in the beta1 band (13–17.99 Hz). At 2-year follow-up, we found changes in all baseline beta bands but most pronounced in the beta1 band. In addition, we found that qEEG parietal power was correlated with amyloid-β42 and anterograde memory.
Conclusion:
These findings suggests that relative power in the parietal electrodes in the beta1 band may be a better way to discriminate between pMCI and sMCI at the time of diagnosis than the broad beta band. Similar findings have also been found with resting state fMRI. In addition, we found that anterograde memory was correlated to qEEG parietal beta1 power.
INTRODUCTION
Studies have shown that not all patients with mild cognitive impairment (MCI) convert to Alzheimer’s disease (AD) [1]. For timely administration of pharmacological and therapeutic interventions, it is important to determine which patients with MCI will convert to AD. Currently, the strongest predictors of conversion from MCI to AD are neuropsychological tests [2–5]. The studies have found that patients with MCI are at a higher risk of conversion to AD if they are amnestic [3] or had memory plus other cognitive domain deficits [5]. Another study has found that a combination of scores from multiple memory scores showed an accuracy >90% [4]. However, the highest accuracy was found for memory measures together with a small set of other cognitive domains when predicting conversion from MCI to AD [6]. Another approach, which is not as well understood, could be quantitative electroencephalography (qEEG) since it is objective, widely available, and inexpensive.
Spectral power from qEEG has been extensively used in both patients suffering from AD and MCI. Studies investigating the power in patients with AD have generally found an increase in the slower frequency bands (delta and theta) and a decrease in the faster frequency bands (alpha and beta) compared with healthy controls (HC) [7–18]. Furthermore, it has been shown that the earliest power changes in AD are increased theta with decreased beta power and an increase in delta power in the later stages of the disease [7, 8]. For patients with MCI, it has been shown that these patients share the same EEG characteristics as AD with increased low frequency and decreased high frequency power but less pronounced [9, 19]. This may in large part be due to the underlying AD pathology in some patients with MCI.
In addition, power has been used to compare MCI patients who progress to AD (pMCI) and patients with MCI who remain stable (sMCI). One study has found that pMCI compared to sMCI at 21 months follow-up had significantly higher theta relative power and lower beta relative power [19]. Other studies have found that alpha3/alpha2 ratio (alpha2: 8.9–10.9 Hz and alpha3 10.9–12.9 Hz) could be a potential marker for pMCI [20], while another study has found that the beta band in particular can predict conversion from MCI to AD [21]. However, beta is a very broad frequency band and subdivision of the frequency band may increase the diagnostic accuracy of the classifier.
Only a few studies have investigated the relationship between cerebrospinal fluid (CSF) biomarkers and EEG power [22–25]. A study found a correlation between tau protein and slowing of EEG global field power in AD [22], which included a positive correlation between CSF tau levels and ratio of alpha/delta global field power. In healthy and cognitively normal elderly individuals, the combination of high T-tau and low amyloid-β42 (Aβ42) was correlated with an increase in theta power in the EEG especially in the posterior regions [24], which indicates that the underlying neuropathological mechanisms are related to EEG. Furthermore, one study has found a lower CSF Aβ42/phospho-tau protein (p-tau) ratio and higher T-tau were associated with slower background activity using EEG [25]. In addition, a recent study found that decreased Aβ42 significantly correlated with increased theta and delta global field power, which is a global score across electrodes [23]. This may further our understanding of qEEG changes in the event of neuronal loss. In addition, studies have found a correlation between working memory with both theta, alpha, and beta [7–9, 26], which may explain the pathophysiological role of beta power as marker of progression in patients with MCI.
In the present exploratory study, we aimed to examine the differences in qEEG power between patients with AD and MCI compared to HC. In addition, we wanted to investigate differences in baseline relative power between pMCI and sMCI based on one year and two years of follow-up. We expected a decrease in the relative beta power and an increase in the alpha3/alpha2 ratio for pMCI compared to sMCI. Furthermore, we wanted to investigate if there were any differences in cognitive screening instruments between pMCI and sMCI at baseline based on division after one and two years follow-up and if it showed any correlation with qEEG power. Lastly, we investigated whether the temporal or parietal electrodes that showed significant changes between pMCI, and sMCI were correlated with CSF biomarkers.
METHODS
Study power calculation
We assumed it was possible for the clinician to predict clinical progression in 10% of patients with MCI [27] using the work-up as described below and increase to 50% if we added qEEG. With an alpha at 5% and a beta at 80%, we found that we needed 16.7 MCI patients that converted using the following formula: N> (Z2 α +Z β )2×(P1(1-P1)+P2(1-P2)) / (P1-P2)2. With an estimated annual conversion rate of at least 15% [28, 29] and around four diagnosed with MCI at the clinic every month with about half wanting to participate in the study, we estimated that we could reach 17 patients with MCI that progressed to AD within the study period. In addition, we decided to include 20 patients with AD and 20 HC. However, we were not able to recruit 20 patients with AD but were able to recruit 38 HC.
Recruitment and subjects
The included patients have also participated in another study [30] and some of the EEGs recorded for this study was also used in another study [31]. The study was a prospective cohort study, conducted at two memory clinics at the Regional Dementia Research Centre, Department of Neurology, Zealand University Hospital and the Copenhagen Memory Clinic, Department of Neurology, University Hospital Copenhagen, Rigshospitalet. Patients consecutively referred for cognitive evaluation and diagnosed with either MCI or mild AD and at least a baseline Mini-Mental State Examination (MMSE) score of ≥22 from June 2012 to December 2014 were eligible for inclusion. The selection of patients was defined on preexisting exclusion criteria: If they had no close relatives who wished to participate, if they were participating in other intervention studies or if they were suffering from other neurological, psychiatric, or other severe disease. In addition, patients receiving sedative medication were excluded due to a potential sedative effect.
At the time of referral all patients underwent a standardized diagnostic assessment including a full physical and neurological examination, routine blood analysis, brain CT or MRI scan as well as cognitive screening, i.e., MMSE and Addenbrooke's Cognitive Examination (ACE). All the CT and MRI scans were examined by an experienced neuro-radiologist. The majority also had a lumbar puncture performed with subsequent determination of CSF AD biomarkers, i.e., Aβ42, T-tau, and p-tau, and routine parameter analysis. If it was considered diagnostically relevant, the patients also had a full neuropsychological evaluation undertaken by a clinical neuropsychologist but these were individualized for each patient with varying overlap and therefore not included in the current study. Diagnoses were settled by consensus of an experienced multidisciplinary team based on all available examination results. Patients with MCI were diagnosed according to the Winblad consensus criteria [32]. Patients with AD were diagnosed according to the NIA-AA criteria [33].
The HC were all volunteers recruited for scientific research trough public advertisements at the memory clinics, at local associations for elders and through an online recruitment site for trial subjects. Inclusion criteria were age between 50–90 years, MMSE score ≥26, ACE ≥85, normal neurological and clinical examination, normal or age-related atrophy measured on a computed tomography (CT) scan of the brain, no pathological findings on the EEG, and normal routine blood tests. Exclusion criteria were an inability to participate (including impaired vision or hearing) or presence of memory complaints or other cognitive symptoms as well as signs of major neurological, psychiatric or other severe disease, which potentially could elicit cognitive impairments including any signs of major depression and/or a geriatric depression scale score >7. Furthermore, they could not be pregnant, have undergone general anesthesia or received electroconvulsive therapy in the past 3 months, receive sedatives, or have any past or current addictions to alcohol or pills. All HC underwent the standardized diagnostic assessment, which included ACE, MMSE, Major Depression Inventory (MDI), and Digit Symbol Substitution Test, in one of the memory clinics at inclusion and lumbar puncture and analysis of CSF was performed on all HC. At the baseline visit all HC were referred for a standardized EEG. The EEG recordings were not used in the diagnostic assessment.
In total, we included 17 patients with AD, 27 patients with MCI, and 38 HC.
The study was reported to and approved by the Danish Data Protection Agency and by the Regional Ethical Committee according to Danish legislation.
Study design
As part of the diagnostic assessment patients and relatives underwent Neuropsychiatric Inventory (NPI), MDI, Activities of Daily Living Inventory (ADCS-ADL), and an assessment of the global functions, which included Clinical Dementia Rating (CDR), MMSE, and ACE. All tests, including CDR were repeated at inclusion and included sub-scores for ACE. Recruiting of patients happened within 6 months after diagnosis. Afterwards, follow-up visits were carried out on a yearly basis, with serial cognitive tests, i.e., MMSE and ACE together with the previously described scales, which include the NPI, MDI, ADCS-ADL, and CDR. Conversion of MCI to AD was determined based on whether the patient clinically progressed to fulfilled the NIA-AA criteria [33].
During the study period, the primary investigator performing the tests was blinded for the results of the EEG, imaging, and CSF analysis, and thereby blinded for the potential presence of underlying AD pathology.
Electroencephalography recording
All EEG recordings were performed at the two participating centers who beforehand had agreed on a common approach to record EEGs. EEG recordings were performed using NicoletOne EEG Systems (Natus®). Nineteen electrodes were positioned according to the International 10–20 system. The IS 10–20 system describes the location of the scalp electrodes during an EEG recording and has been developed to ensure standardized reproducibility. The majority of EEGs were recorded with alternating eyes closed and eyes open periods for three minutes each. The participants were alerted if they became visibly drowsy, since drowsiness influences recording.
Collection and analysis of cerebrospinal fluid
CSF was obtained by lumbar puncture between the L3/L4 or L4/L5 intervertebral space and collected in polypropylene tubes. CSF analyses included routine parameters (white cell count, erythrocytes, total protein, glucose, albumin, IgG-index and oligoclonal bands) and the core AD biomarkers, i.e., Aβ42, T-tau, and P-tau. CSF Aβ42, T-tau, and P-tau were quantified with sandwich ELISAs (INNOTEST amyloid-β42, hTau, and Phospho-Tau [181P], respectively; Fujirebio Europe, Ghent, Belgium). AD biomarkers analyses from both clinics were all carried out at one central laboratory.
Preprocessing of EEG
Some of the EEGs have in part been used in a previous publication [31]. The EEG data were imported to MATLAB (Mathworks, v2016a) using the EEGLAB toolbox [34]. Segments with eyes closed (EC) were selected either using markers placed doing recording or from the first 10 minutes of recording if markers were not present. The electrodes were computationally located on the scalp using the dipfit toolbox [35] using the standard 10–20 electrode model. The excessive channels were removed and the data were bandpass filtered from 1–70 Hz using the pop_firws function in MATLAB with a filter order of 2 and the Kaiser window parameter beta was estimated using a maximum passband ripple of 0.001. Furthermore, the data were bandstop filtered from 45–55 Hz using the same settings as described previously. Afterwards, the data were down sampled to 200 Hz. Then, the data were divided into one second epochs and the EEGs were visually inspected and epochs with excessive noise or artifacts were removed. Channels with excessive noise, drift, or bad connection were interpolated using spherical interpolation. The EEG had to have≤three electrodes with excessive artifact, otherwise the EEG was excluded from the analysis. Afterwards, the EEGs were re-referenced to average and independent component analysis (ICA) was performed using the extended infomax algorithm [36] for each file and components that contained eye blinks, eye movement, or specific line noise artifacts were removed manually. Lastly, the EEGs were inspected visually again and epoch with excessive noise or artifacts were removed. The investigator who performed the preprocessing was blinded to the diagnosis. Due to excessive artifacts, we excluded the following number of EEGs: two from patients with AD, two from patients with MCI, and one from HC. When comparing pMCI and sMCI, one EEG from MCI was excluded due to conversion to vascular dementia.
Relative power calculations
For calculating power, we used resting state EEG after preprocessing and calculated power across epochs using the in-built function spectopo from the EEGLAB toolbox. Here, the window length was one second epoch having the down sampled sampling rate of 200 Hz. The relative power was calculated in each of the following frequency bands: delta (1–3.99 Hz), theta (4–7.99 Hz), alpha (8–12.99 Hz), beta1 (13–17.99 Hz), beta2 (18–23.99 Hz), beta3 (24–29.99 Hz), and beta (13–29.99 Hz) by dividing each of the frequency bands with the sum of the following frequency bands: delta, theta, alpha, and beta. In addition, we also calculated the alpha3 (10.9–12.9 Hz)/alpha2 (8.9–10.9 Hz) ratio. Absolute power was not included in the current analysis due to the large variability between subjects.∥
Statistics
All statistics were performed in MATLAB (vR2016a). When comparing demographics and cognitive scores for AD, MCI, and HC, we performed one-way ANOVAs. T-tests were used when comparing baseline cognitive screening instruments for pMCI and sMCI determined on both 1st year and 2nd year follow-up. Furthermore, we also investigated any significant difference between sub scores of the ACE between pMCI and sMCI due to significant difference between the total score. For comparing relative power across all three groups, we performed a MANCOVA with age, gender, education, and current medication (antidepressants, anti-dementia medication and pain killers) as covariates and if we found a significant difference, we performed t-tests between AD versus HC, MCI versus HC, and AD versus MCI. For pMCI versus sMCI we used a MANCOVA with the same covariate as mentioned above and divided the baseline EEG from the patients with MCI into two groups (pMCI and sMCI) based on 1st year follow-up and 2nd year follow-up. T-values were used for visualization of significant differences. Due to the exploratory nature of the study, we did not perform correction for multiple comparisons.
Correlations
We chose to correlate the CSF markers (Aβ42, T-tau, and P-tau) to the areas where we found changes in between pMCI and sMCI (parietal and temporal electrodes) for all beta bands. A mean value was calculated for right temporal (T4 and T6), left temporal (T3 and T5), and parietal (P3, Pz, and P4) for each participant included in the study. These values were then correlated to each of the CSF markers using Spearman’s correlation. If it was not possible to measure the value for Aβ42 or T-tau due to a value that was too high to measure the values were excluded from the analysis. A correlation was significant if the p-values was below 0.05.
In addition, we performed a correlation between the mean of parietal power for patients with MCI and the anterograde memory from the ACE.
RESULTS
Demographics and cognitive scores
See Table 1 for characterization of the patients included in the analysis and comparisons between groups. For a flow diagram of the included patients and healthy controls and yearly drop-out, see Fig. 1. The reason for the drop-out of the study was mostly that they were recruited later and therefore could not complete all three years (AD: 6, MCI: 8), or were not able to be tested in a proper way in a follow-up session (AD: 3, MCI: 1), wanted to drop-out (AD: 1, MCI: 2, HC: 3), or died (AD: 1, MCI: 2). The performance on cognitive screening instruments for each visit with comparison between the four scores can be seen in Table 2. When comparing the scores at baseline between pMCI and sMCI, we found that only ACE was significantly different (based on 1st year follow up: p = 0.002, based on 2nd year follow up: p-value = 0.010), see Table 3.

Flow diagram showing the number of participants recruited for the study and the number of participants included in the study with the number of patients for follow-up over 3 years. We do not have a record of how many participants reclined participation.
The characteristics of the participants included in the analysis
AD, Alzheimer’s disease; CSF, cerebrospinal fluid; HC, healthy controls; MCI, mild cognitive impairment; MMSE, Mini-Mental State Examination; NR, not relevant; SD, standard deviation.
The cognitive scores, number of participants that dropped out, and number of patients with MCI that progressed doing follow-up
In addition, the percentage of missing values for the cognitive scores can be seen. All cognitive scores have been compared over time using a one-way ANOVA.
*indicates significant p-value (<0.05). ACE, Addenbrooke’s Cognitive Examination; AD, Alzheimer’s disease; ADL, Activities of Daily Living; CDR, Clinical Dementia Rating; DSST, Digit Symbol Substitution Test; HC, healthy controls; MCI, mild cognitive impairment; MDI, Major Depression Inventory; MMSE, Mini-Mental State Examination; NPI, Neuropsychiatric Inventory; NR, not relevant; SD, standard deviation.
The baseline cognitive scores for sMCI and pMCI for the patients that progressed after one year and two years
T-tests were performed to compare the two groups for each cognitive score separately.
*indicates significant (p-value <0.05) difference. One patient with MCI showed up to be vascular dementia at 1-year follow-up and was not included in the comparison between pMCI and sMCI. ACE, Addenbrooke’s Cognitive Examination; ADL, Activities of Daily Living; CDR, Clinical Dementia Rating; MCI, mild cognitive impairment; MDI, Major Depression Inventory; MMSE, Mini-Mental State Examination; NPI, Neuropsychiatric Inventory; pMCI, patients with MCI who progress to Alzheimer’s disease; sMCI, patients with MCI who remain stable.
When looking at the baseline ACE sub scores for pMCI versus sMCI at 1st year follow-up, we found significant difference between anterograde memory (mean pMCI (SD) = 14.71 (7.23), mean sMCI (SD) = 22.13 (4.03), p = 0.005, t-stat = –3.175) and retrograde memory (mean pMCI (SD) = 2.29 (1.11), mean sMCI (SD) = 3.31 (0.79), p = 0.020, t-stat = –2.528). At 2nd year follow-up, we found that the ACE sub score comprehension was significantly different between the two groups (mean pMCI (SD) = 3.57 (0.79), mean sMCI (SD) = 4 (0), p = 0.035, t-stat = –2.249) and a trend for anterograde memory (mean pMCI (SD) = 16.14 (7.71), mean sMCI (SD) = 21.50 (4.68), p = 0.051, t-stat = –2.070). The rest of the sub scores were not significantly different between pMCI and sMCI (p > 0.05).
Relative power for AD, MCI, and HC
We found an increase in relative theta power when comparing the AD group to the HC for the left temporal, central, parietal, and occipital electrodes. In addition, we found increases in frontal electrodes and T4. These changes were more pronounced from AD versus HC than for MCI versus HC. In the beta bands, we found decreases in the temporal and frontal electrodes (T3, F7, T4, and F8) for both AD versus HC and MCI versus HC. No significant differences were found between alpha3/alpha2 ratio between the three groups. We did not find any significant changes between AD and MCI. See Fig. 2. For all p-values and F-values, see Supplementary Tables 1 and 2.

Figure showing the relative power difference between groups (AD-HC, MCI-HC, and AD-MCI) for the theta and beta bands. The difference was visualized if the MANCOVA was significant (p < 0.05) and the post-hoc t-test was significant. The values used for plotting the differences were the post-hoc t-test values. Red values show increased relative power in the first group mentioned, blue values show decreased relative power in the first group mentioned. The color bar shows the t-value for the comparison between AD versus HC, MCI versus HC, and AD versus MCI. HC, healthy controls; AD, Alzheimer’s disease; MCI, mild cognitive impairment.
Comparing pMCI with sMCI
The baseline qEEG showed decreased beta1 in the parietal electrodes and in the right temporal and frontal electrodes based on the 1st year follow-up between pMCI and sMCI. Here, we also found a few decreases in the beta band with decreases in Pz and F8, see Fig. 3. For all p-values and t-values, see Supplementary Tables 3 and 4.
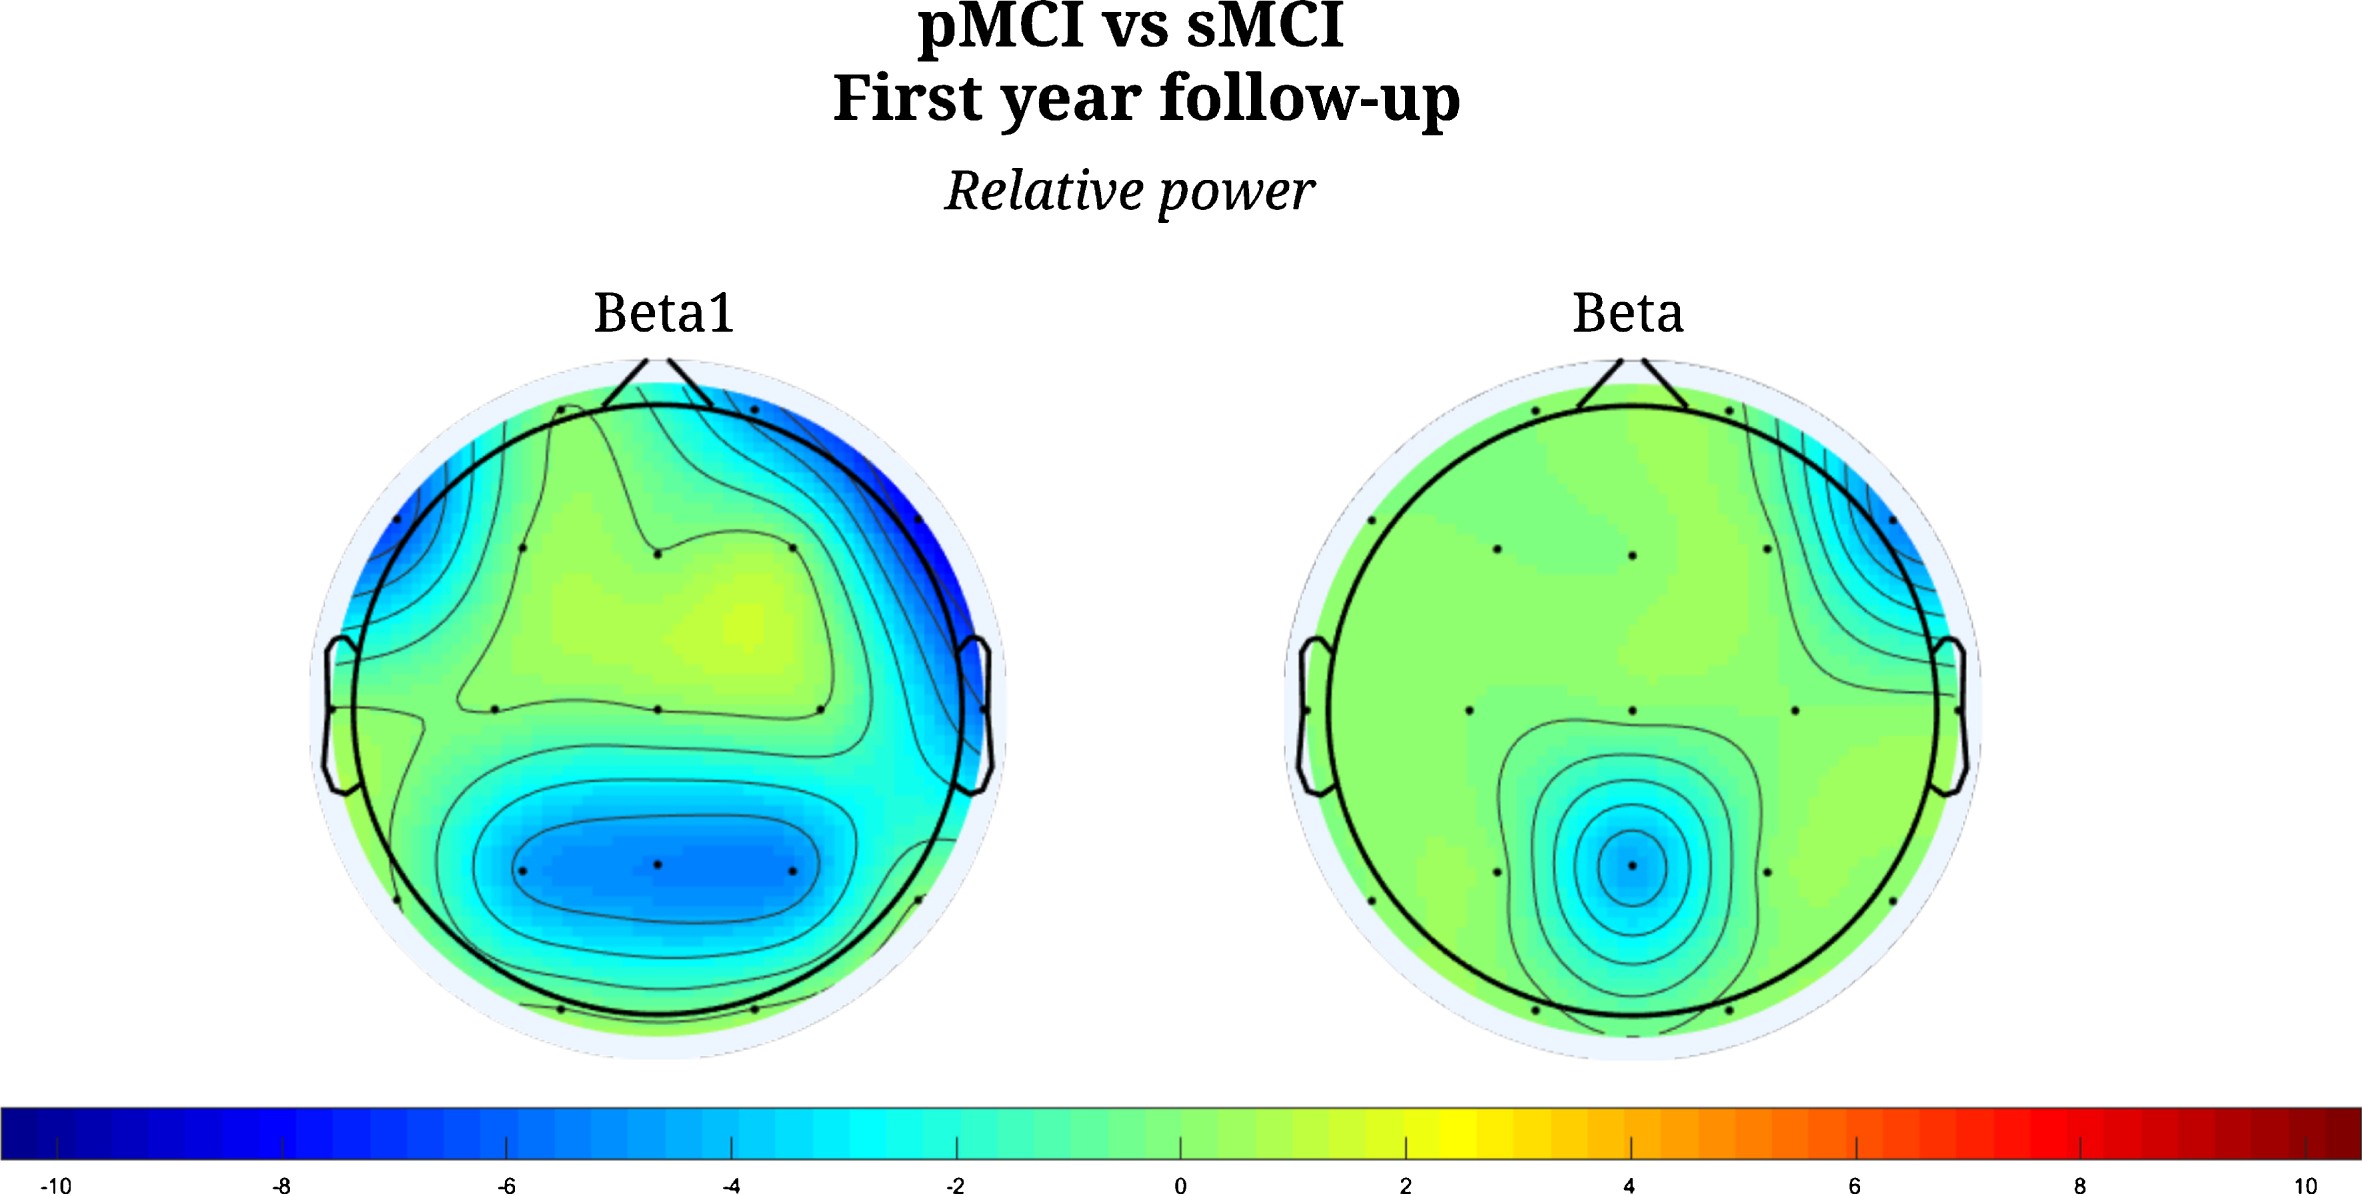
Figure showing the relative power difference between progressed MCI and stable MCI at follow-up at the first-year follow-up. The difference was visualized if the MANCOVA was significant (p < 0.05) using the t-value. Blue values show decreased relative power in the progressed MCI compared to stable MCI. The color bar shows the t-value for the comparison between pMCI and sMCI.
When dividing the baseline qEEG results based on the 2nd year follow-up of whether the patients with MCI progressed, we found decreases in the parietal, temporal, and central (C3 and C4) for all beta bands. In addition, we found decreases in the outermost frontal electrodes (Fp1 and Fp2) in beta1, beta2 and beta, see Fig. 4. In addition, we found decreases in T3, T4, and T6 in the theta band. For all p-values and t-values, see Supplementary Tables 5 and 6.
No significant differences were found between alpha3/alpha2 ratio between the sMCI and pMCI at both 1st year follow-up and 2nd year follow-up using the baseline EEG.
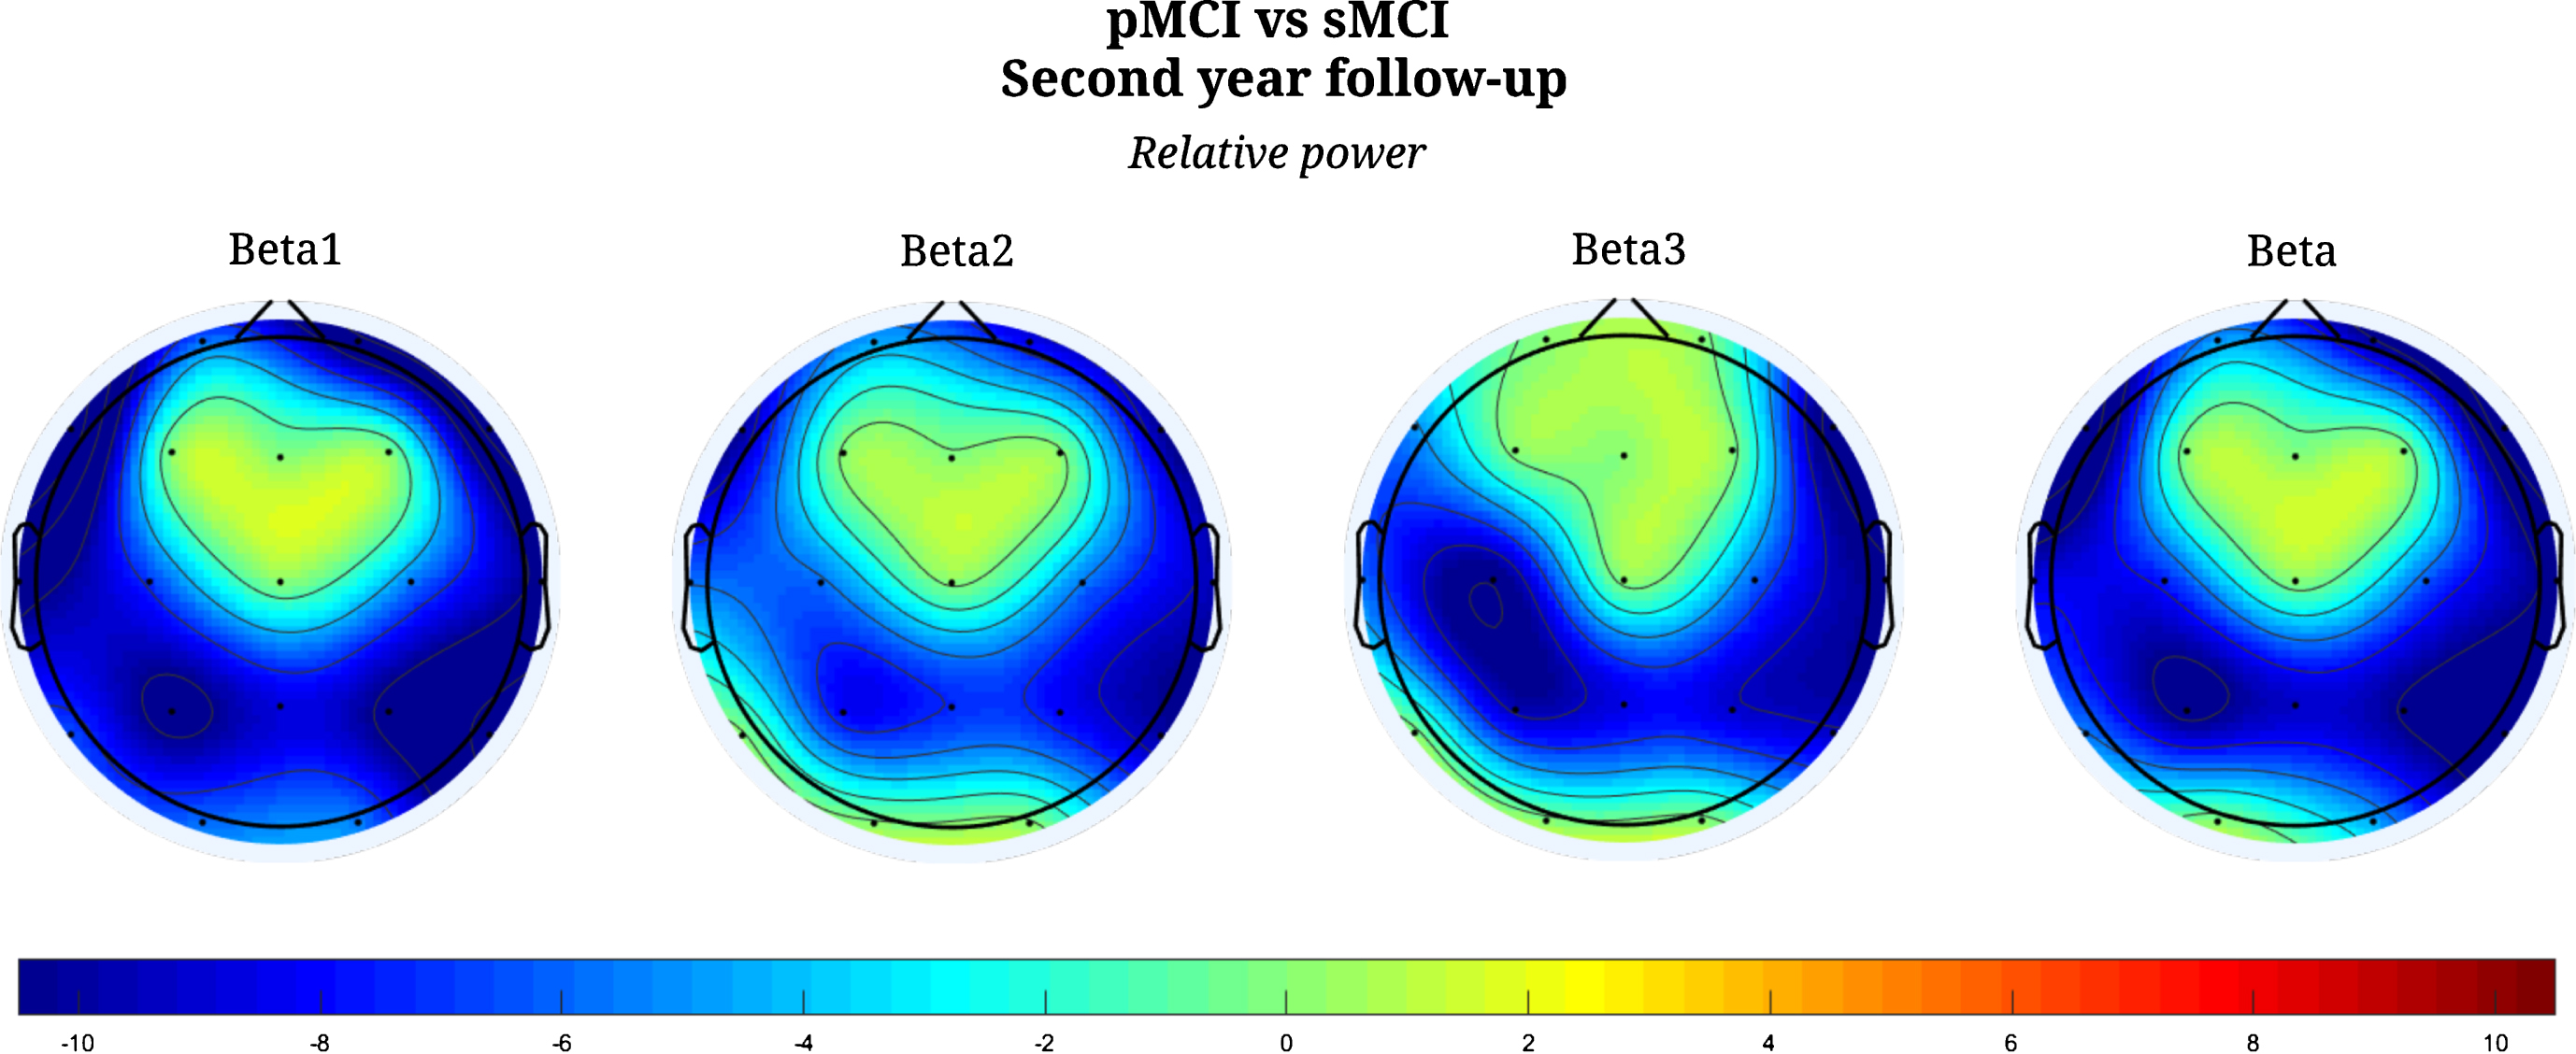
Figure showing the relative power difference between progressed MCI and stable MCI at follow-up at the second-year follow-up. The difference was visualized if the MANCOVA was significant (p < 0.05) using the t-value. Blue values show decreased relative power in the progressed MCI compared to stable MCI. The color bar shows the t-value for the comparison between pMCI and sMCI.
EEG correlations
The correlation for the beta bands and CSF AD biomarkers showed significant correlation between right temporal electrodes (T4 and T6) and Aβ42 in the beta2 band (p = 0.028, rho = –0.266) and between right temporal electrodes and in the beta band and Aβ42 (p = 0.032, rho = –0.261). All other correlations were not significant (p > 0.05). For a full overview of the p- and rho-values, see Supplementary Table 7.
We also performed correlations between parietal power and the baseline anterograde sub score from the ACE, which was significant (p = 0.048, rho = 0.416).
DISCUSSION
In the current exploratory study, we investigated whether there were any qEEG relative power differences between pMCI and sMCI (see Figs. 3 and 4 and Supplementary Tables 3–6). Indeed, we found decreases in the beta band (see Figs. 3 and 4), which is in line with a study showing that mainly the beta band has been shown to be a good classifier between pMCI and sMCI at 2-year follow-up [21]. In addition, in part in agreement with another study which found that pMCI after the follow-up had lower relative beta power and higher relative theta power [19]. However, in our study, we found that decreases based on the 1st year follow-up were more pronounced in the beta1 (13–17.99 Hz) than in the beta band and was mostly centered at the parietal electrodes. At 2nd year follow-up, we found decreases in all beta bands, which were prominent in the parietal and temporal electrodes and especially in beta1 band. The parietal changes found at both 1st and 2nd year follow-up may reflect the early changes in the posterior cingulate cortex [37, 38] and therefore be a sign of decreased neuronal function. Furthermore, changes in beta have been shown to be associated with changes in the default mode network in the resting brain [39], and changes in the posterior cingulate cortex and parietal areas in resting state fMRI have been associated with progression from MCI to AD [40]. The relative beta1 band may therefore be the best sign of progression in patients with MCI and may be related to resting state fMRI network changes. We were not able to find any difference between pMCI and sMCI for alpha3/alpha2 ratio, which has previously been shown to be a risk to develop AD in patients with MCI [20]. In addition, we did not find any significant differences in the theta or alpha band as suggested in a previous study [19]. We also found that right temporal beta2 and beta power was significantly negative correlated with Aβ42 (see Supplementary Table 7). Aβ42 depositions have been found in mesial temporal lobe in patients with MCI [41], hence this may indicate that the changes in the beta band is related to neuronal loss due to Aβ42 depositions in this region. This finding of a correlation between relative beta power and Aβ42 has not been shown before. Previous studies have shown that Aβ42 is correlated with an increase in theta power in healthy controls [24] and another study has found that lower CSF Aβ42/phospho-tau protein (p-tau) ratio and higher T-tau were associated with slower background activity using EEG [25]. However, in the current study the correlations performed was based on findings between pMCI and sMCI and no significant differences were found in the other frequency bands.
The EEG changes between the AD, MCI, and HC mostly showed significant increase in left relative theta power, which was most pronounced for AD versus HC, and to a lesser extent for MCI versus HC (see Fig. 2 and Supplementary Tables 1 and 2). This increase has previously been described [7–18], and together with a decrease in beta been described as the early changes in patients with AD [7, 8] with changes in the delta and alpha bands when the disease progress. The theta activity has been shown to be generated in the hippocampus in rodents [42, 43] and recently in humans [44], which may indicate that the increased theta activity is the sign of hippocampal dysfunction. In addition, a study has found that an increase in theta activity is correlated with Aβ42 in healthy participants [24] and CSF markers have been associated with memory and attention tasks [45]. Our results also suggest that the changes are mostly pronounced in the left side, which has not previously been reported in EEG but atrophy has been shown to be more pronounced on the left side [46, 47]. The changes in beta are almost exclusively centered around temporal and frontal electrodes (T3, T4, F7, and F8), which may be due to muscle activity. The reason for not finding more pronounced changes in the AD group may be due to low sample size.
Cognitive screening instruments showed significant differences between pMCI and sMCI for baseline ACE when dividing the score according to both 1st (p = 0.002) and 2nd (p = 0.010) year. We found a significant difference for anterograde memory at 1st year follow-up (p = 0.005, t-stat = –3.175) and a trend for the 2nd year (p = 0.051, t-stat = –2.070). Furthermore, anterograde memory was significantly correlated to relative parietal beta1 power (p = 0.048, rho = 0.416), which supports our theory that beta1 parietal power may be a suitable marker for progression in patients with MCI since anterograde memory function is predictive for conversion from MCI to AD [6]. Lastly, we found that the baseline retrograde memory score at the 1st year follow-up (p = 0.020, t-stat = –2.528) and comprehension was significant at 2nd year follow-up (p = 0.035, t-stat = –2.249). However, this may be due to ceiling effects since the maximum points of both tests were four.
When looking at changes over time (see Table 2), we found significant increases in CDR and NPI (that is, worsened general function and worsened neuropsychiatric features), which are both based on caregiver questionnaires and no significant differences for MMSE and ACE over time. This may be due to multiple factors including patients that dropped out of the study or worsening of the patients in domains not tested in the ACE or MMSE, but observed by the family or care-givers. We believe the increase in MMSE and ACE at 3rd year follow-up was due to patients who progressed faster dropped out of the study.
The study indicates several potential markers of clinical progression in MCI. However, it has some limitations. Firstly, we acknowledge the small sample size, and therefore did not attempt to use any prediction model. We also did not reach the number of expected patients with MCI that converted to AD, which is due to not being able to recruit enough patients. Furthermore, we did not correct for multiple comparisons when looking at pMCI and sMCI due to the exploratory nature of the study. Nevertheless, our findings in this small pilot with the aim to explore the predictive ability of EEG markers of clinical progression in patients with MCI, may guide future studies. The issue will be further investigated in an ongoing Nordic multicenter trial (“The Nord-MCI trial”), which was initiated in 2017 and is planned to be completed in 2019.
Conclusion
When comparing pMCI and sMCI, we found that baseline parietal relative beta1 band power was significantly different at both 1st year and 2nd year follow-up. Beta1 and especially parietal electrodes may therefore be a better marker for progression of MCI than the broad beta band. In general, beta has been found to be related to resting state fMRI and the finding of decreased parietal beta power may correspond the posterior cingulate cortex, which has been shown to be able to predict conversion from MCI to AD. In addition, beta and beta2 was significantly negative correlated with Aβ42 and positively correlated with anterograde memory. This indicates that the beta bands may be related to known neuropathological findings in AD and the memory impairment related to dementia due to AD.