
Abstract
Background:
Current research diagnostic criteria for Alzheimer’s disease (AD) and mild cognitive impairment (MCI) due to AD include biomarkers to supplement clinical testing. Recently, we demonstrated that dual time-point [18F]FBB PET is able to deliver both blood flow and amyloid-β (Aβ) load surrogates.
Objective:
The aim of this study was to investigate whether these surrogates can be utilized as AD biomarkers.
Methods:
112 subjects (41 with MCI, 50 with probable/possible AD, 21 with other dementias) underwent dual time-point [18F]FBB PET. Data were visually and relative quantitatively (Herholz scores for the early and composite SUVRs for the late PET data) analyzed.
Results:
In the early images AD-typical patterns were present in 42% /27% /33% of probable/possible AD/MCI/other dementia cases. In late [18F]FBB PET, 42% /29% /38% of probable/possible AD/ MCI/other dementia cases were Aβ-positive. 17% of the MCIs were categorized as “MCI due to AD-high likelihood”, 44% of the probable ADs as “probable AD with high evidence of AD pathophysiological process” and 28% of the possible ADs as “possible AD with evidence of AD pathophysiological process”. 27% of all subjects showed a positive diagnostic and progression biomarker. Herholz scores were lower (0.85±0.05 versus 0.88±0.04, p = 0.015) for probable/possible AD versus MCI. Composite late phase SUVRs were significantly higher (1.65±0.23 versus 1.15±0.17, p < 0.005) in Aβ-positive versus Aβ-negative patients. Herholz and MMSE scores were positively correlated (R = 0.30 p = 0.006).
Conclusion:
Dual time-point [18F]FBB PET provides dual biomarker information which enables to categorize MCI and AD dementia patients according to established diagnostic criteria. Thus, dual time-point [18F]FBB PET has great potential to supplement diagnostic dementia workups.
Keywords
INTRODUCTION
Alzheimer’s disease (AD) is a progressive chronic neurodegenerative disease which is clinically characterized by short-term memory loss and cognitive decline. Pathologically, this disease is characterized by brain accumulation of amyloid-β (Aβ) plaques, neurofibrillary tangles, synaptic loss, and neurodegeneration [1].
The National Institute on Aging and the Alzheimer’s Association (NIA-AA) published revised research diagnostic criteria of MCI due to AD and dementia due to AD which differ from traditional criteria by implementing biomarker information. Here, [18F]Fluorodeoxyglucose (FDG) PET imaging together with cerebrospinal fluid (CSF) tau measurement and mesial temporal lobe structural magnetic resonance imaging (MRI) are considered as biomarker techniques to detect neuronal injury, while Aβ PET imaging and CSF Aβ values are considered as biomarker techniques for amyloid-β (Aβ) pathology detection [2, 3]. The International Working Group 2 (IWG-2) published an alternative concept categorizing AD biomarkers into diagnostic and progression markers, where Aβ PET imaging falls into the first category, and [18F]FDG PET into the second category [4].
The use of [18F]FDG PET imaging as AD biomarker relies on its ability to determine synaptic/neuronal activity. As brain synaptic/neuronal activity is tightly coupled to blood flow, blood flow imaging should, in principle, be able to reveal similar information as compared to [18F]FDG PET. This hypothesis is supported by comprehensive imaging meta-analyses showing a regional match between glucose hypometabolism and hypoperfusion in AD and MCI [5, 6].
[18F]FBB is a recently approved PET tracer with high diagnostic accuracy to detect cortical Aβ aggregates [7, 8]. Because of the tracer’s high extraction fraction, early after [18F]FBB administration brain PET images reflect cerebral blood flow. We recently showed that these early [18F]FBB PET images are closely correlated with [18F]FDG PET images on an individual basis [9]. These results were confirmed by Daerr et al. [10]. The use of early after administration Aβ PET images to assess neuronal injury is not limited to [18F]FBB. Several study groups demonstrated a strong correlation between early after administration [11C]Pittsburgh Compound B (PiB) and [18F]FDG PET data using quantitative, relative quantitative and visual approaches and Hisao et al. found similar results also for early after administration [18F]florbetapir PET data [9–21].
Regardless which of the above AD biomarker categorization system is used, so far it was not possible to derive information on both biomarker categories out of one imaging session. Delivery of dual AD biomarkers by the single administration of a solitary PET tracer would be of considerable clinical interest as it might allow for an earlier, less costly and more convenient diagnosis. It was the aim of this feasibility study to investigate the potential of dual time-point [18F]FBB PET to provide dual AD biomarker information.
MATERIAL AND METHODS
Study population
This was a retrospective observational study in 112 subjects (age 72±10 years, female: 53) imaged in a clinical routine setting between September 2013 and September 2015. Patients were diagnosed clinically using a standardized interview and neuropsychological testing. Based on the results, 41 subjects were classified as MCI, 32 patients as dementia possibly due to AD, 18 patients as dementia probably due to AD and 21 patients as dementia due to other diseases (i.e., seven patients with behavior variant frontotemporal dementia (FTD), two patients with primary progressive aphasia (PPA), two patients with dementia of Lewy-bodies (DLB), 4 patients with atypical AD, and 5 patients with mixed dementia). Table 1 shows the demographic data of our study population. All subjects provided written informed consent for scientific processing of the PET data.
Study population demographics
AD, Alzheimer’s disease; MCI, mild cognitive impairment; MMSE, Mini-Mental State Examination; data for age and MMSE scores are mean values±standard deviations.
All procedures performed in studies involving human participants were in accordance with the ethical standards of the institutional and/or national research committee and with the 1964 Helsinki Declaration and its later amendments or comparable ethical standards. This study was approved by the local ethics committee.
Imaging data acquisition and analysis
Brain imaging was carried out on a hybrid PET/MRI system (Biograph mMR, Siemens Healthcare, Erlangen, Germany). [18F]FBB PET data were acquired 0–10 min and 90–110 min after i.v. administration of approximately 300 MBq. PET data was reconstructed into a 256×256 matrix (voxel size: 2.32×2.32×2.03 mm3) using the built-in 3D ordered subset expectation maximization algorithm with 8 iterations, 21 subsets, and a 3 mm Gaussian filter. Standard corrections for decay, scatter, dead time and attenuation were performed. For attenuation correction, a two-point MRI Dixon VIBE sequence (TR = 3.6 ms, TE = 1.23 ms, slice thickness = 3.12 mm, matrix = 256×256, FOV = 500×300 mm) was obtained in parallel to the PET acquisition, resulting in segmented (air, soft tissue, fat) attenuation coefficient maps. Both the early and late after tracer administration PET data was analyzed visually and relatively quantitatively. The visual analysis was performed by three experienced nuclear physicians and a majority read approach was used. For visual analysis, the PET data were spatially normalized. The data were presented as transversal image series in a continuous hot-metal scale for the early and as black-and-white scale for the late after tracer administration PET data. Furthermore, z-score maps of the early after tracer administration PET data provided by the “semi-quantitative brain FDG PET” tool (reference region: cerebellum) of the Hermes BRASS software (Hermes Medical Solutions, Stockholm, Sweden) were used for visual analysis. Since early after tracer administration and [18F]FDG PET data showed a high correlation in our previous work [22] the use of the normal FDG PET data base of the BRASS software in a relative quantitative manner seems acceptable as supplementary tool of the visual data analysis. Because of severe brain atrophy in two cases which did not allow for a reliable quantification relative quantitative analysis was carried out only in 110 of the 112 cases. For the early [18F]FBB PET data, the presence of the following uptake patterns were visually scored: AD pattern (temporal and/or parietal deficit), FTD pattern (frontal±temporal deficit), DLB pattern (occipital and parieto-temporal deficits), atypical Parkinson’s syndrome (APS) pattern according to [23], primary progressive aphasia (PPA) pattern according to [22], posterior cortical atrophy (PCA) pattern (occipital deficit), unspecific pattern, normal uptake. The scores of the three experts were aggregated into final scores based on the majority decision. For the relative quantitative analysis of the early [18F]FBB PET images, the Herholz score was calculated for each case using the region map of the Hermes BRASS software (brain tool). This score is the ratio of the regional radiotracer uptake of brain regions typically affected (i.e., supramarginal, angular, middle temporal and middle frontal gyri) / typically unaffected (i.e., cerebellum, brain stem, precentral, postcentral and paracentral as well as medial and lateral occipital gyri) in AD [24]. The visual assessment of the late PET data was carried out using a common [7] three-point scoring system to categorize the PET images as Aβ-negative, Aβ-positive with minor Aβ deposits and Aβ-positive with major Aβ deposits (Fig. 1). We further converted the assessment into a binary scoring system (Aβ-negative versus Aβ-positive; 7). Further, established composite neocortical standardized uptake value ratios were calculated using the cerebellar cortex as reference region and by averaging the SUVRs of the bilateral frontal, parietal, lateral temporal, occipital and cingulate cortices (cSUVR) [7, 26].
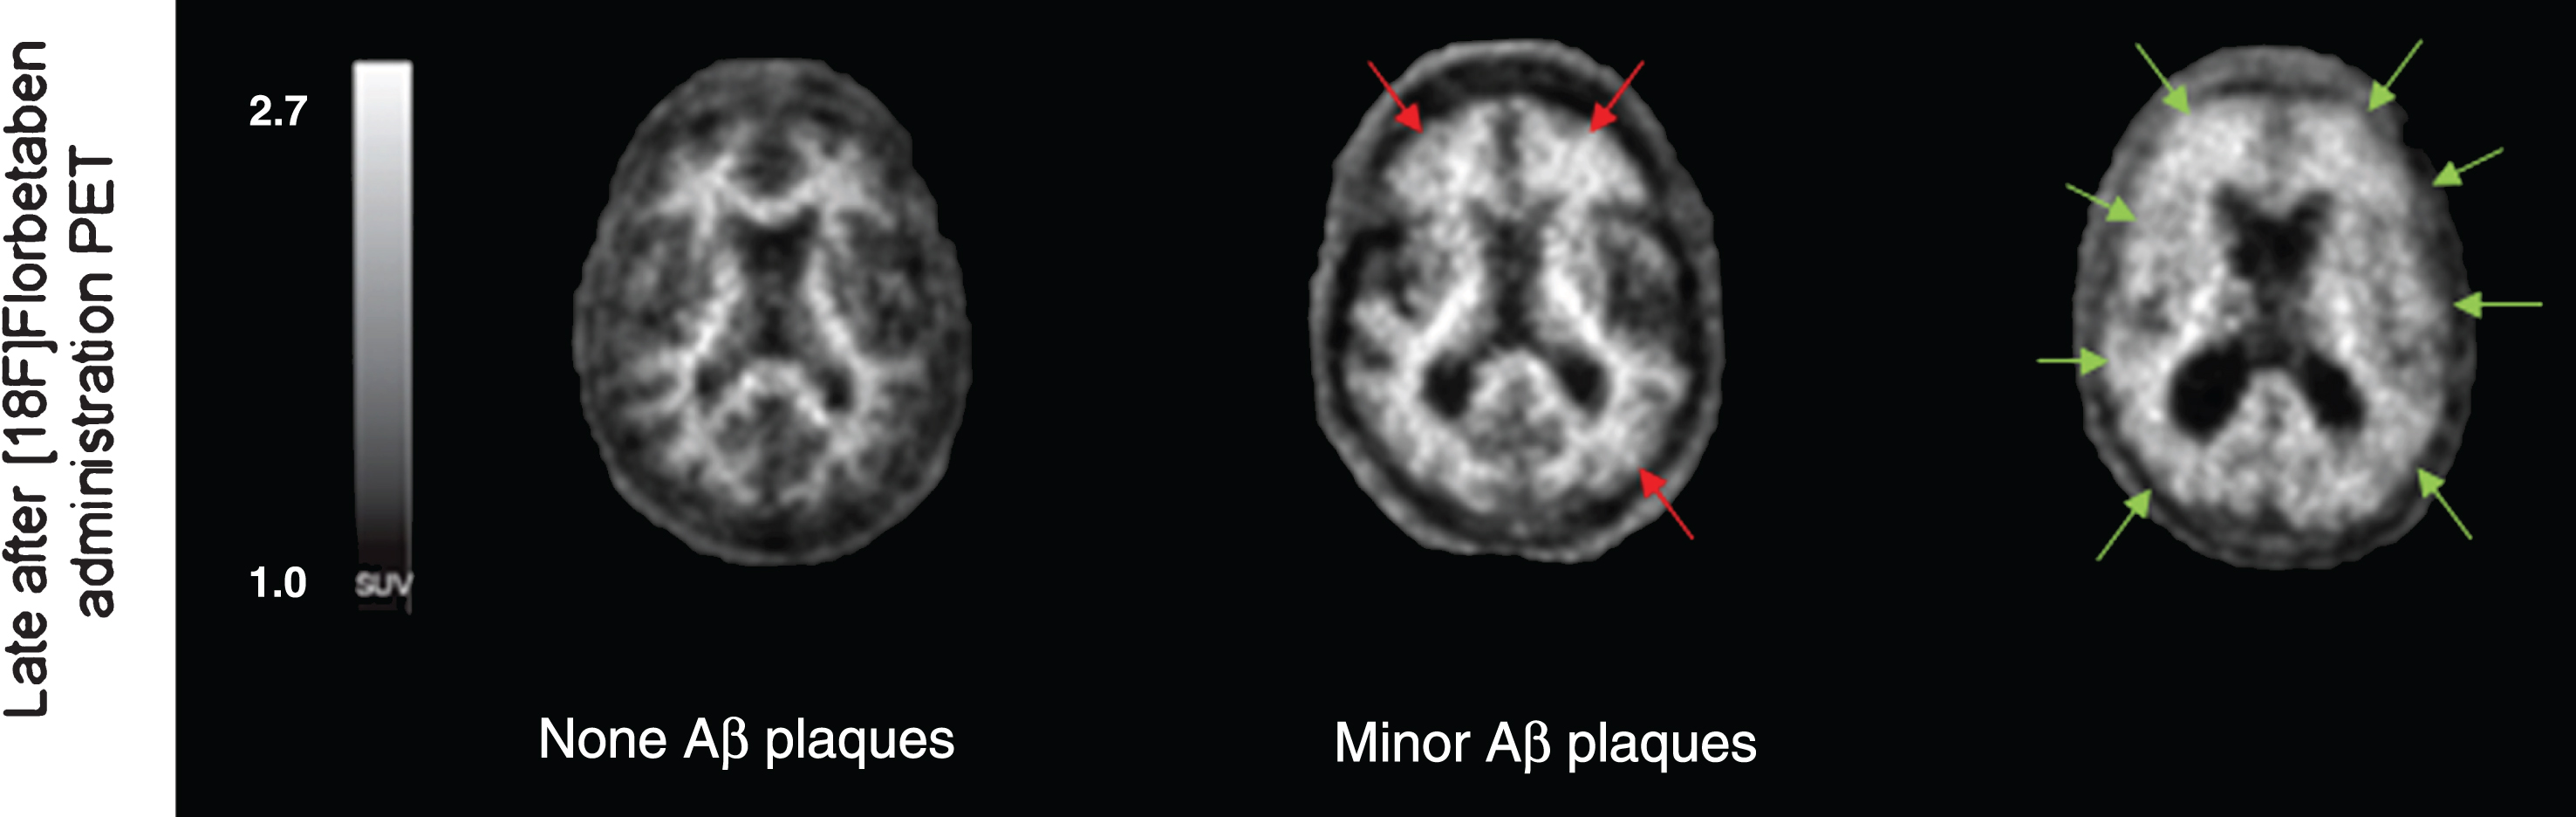
Typical late after [18F]Florbetaben administration PET images of a patient without Aβ plaques, with minor Aβ plaques (red arrows) and with major Aβ deposits (green arrows), the both latter cases rendering amyloid-positive in binary visual evaluation.
Statistics
Statistical analysis was performed using the SPSS statistic software (version 23.0, IBM, Armonk, NY, USA) and the SigmaPlot software (version 13.0, Systat Software, Erkrath, Germany). Normal distribution was tested using the Kolmogorov-Smirnoff test. Group differences of the Herholz scores were analyzed by using the Tamhane-T2 test. Group differences of the composite late phase SUVRs were evaluated with the Mann-Whitney U test. Correlation analysis was calculated using the Spearman’s test or linear regression analysis. Two- tailed p values of < 0.05 were considered significant.
RESULTS
Visual analysis of the early [18F]FBB PET images
The results of the visual categorization of the early [18F]FBB PET images are shown in Table 2. Of the 50 patients with clinically defined possible/probable AD dementia, 21 (42%) were scored with AD-typical uptake patterns, 2 (4%) with FTD-typical patterns, 2 (4%) with DLB-typical pattern, 5 (10%) with PPA-typical pattern, 12 (24%) with APS/unspecific pattern, and 8 (16%) with normal tracer uptake. Of the 41 MCI subjects, 11 (27%) were scored with AD-typical uptake patterns, one (2%) with DLB-typical pattern, one (2%) with PPA-typical pattern, 12 (29%) with unspecific pattern, and 16 (39%) with normal tracer uptake. Of the 21 patients with other dementia, 7 (33%) were scored with AD-typical uptake patterns, 2 (10%) with FTD-typical patterns, one (5%) with DLB-typical pattern, 3 (14%) with PPA-typical pattern, one (5%) with posterior cortical atrophy pattern, 3 (14%) with unspecific pattern, and 4 (19%) with normal tracer uptake.
Visual pattern analysis of early [18F]Florbetaben PET images
AD, Alzheimer’s disease; MCI, mild cognitive impairment; FTD, frontotemporal dementia; DLB, dementia with Lewy bodies; PPA, primary progressive aphasia; APS, atypical Parkinson’s syndrome; PCA, posterior cortical atrophy.
Visual analysis of the late [18F]FBB PET images
According to the visual analysis of the late [18F]FBB PET images, 41 cases (37%) were scored as Aβ-positive, and 71 cases (63%) as Aβ-negative. The group of Aβ-positive subjects consisted of 21 patients (51%) with clinically defined probable/possible AD dementia, 12 subjects (29%) with clinically defined MCI and 8 patients (20%) with dementia due to other diseases. The group of Aβ-negative subjects consisted of 29 patients (41%) with clinically defined probable/possible AD dementia, 29 subjects (41%) with clinically defined MCI, and 13 patients (18%) with other diagnoses of dementia. Figure 2 depicts different imaging pattern of early after and late after [18F]FBB administration PET images of our study cohort.
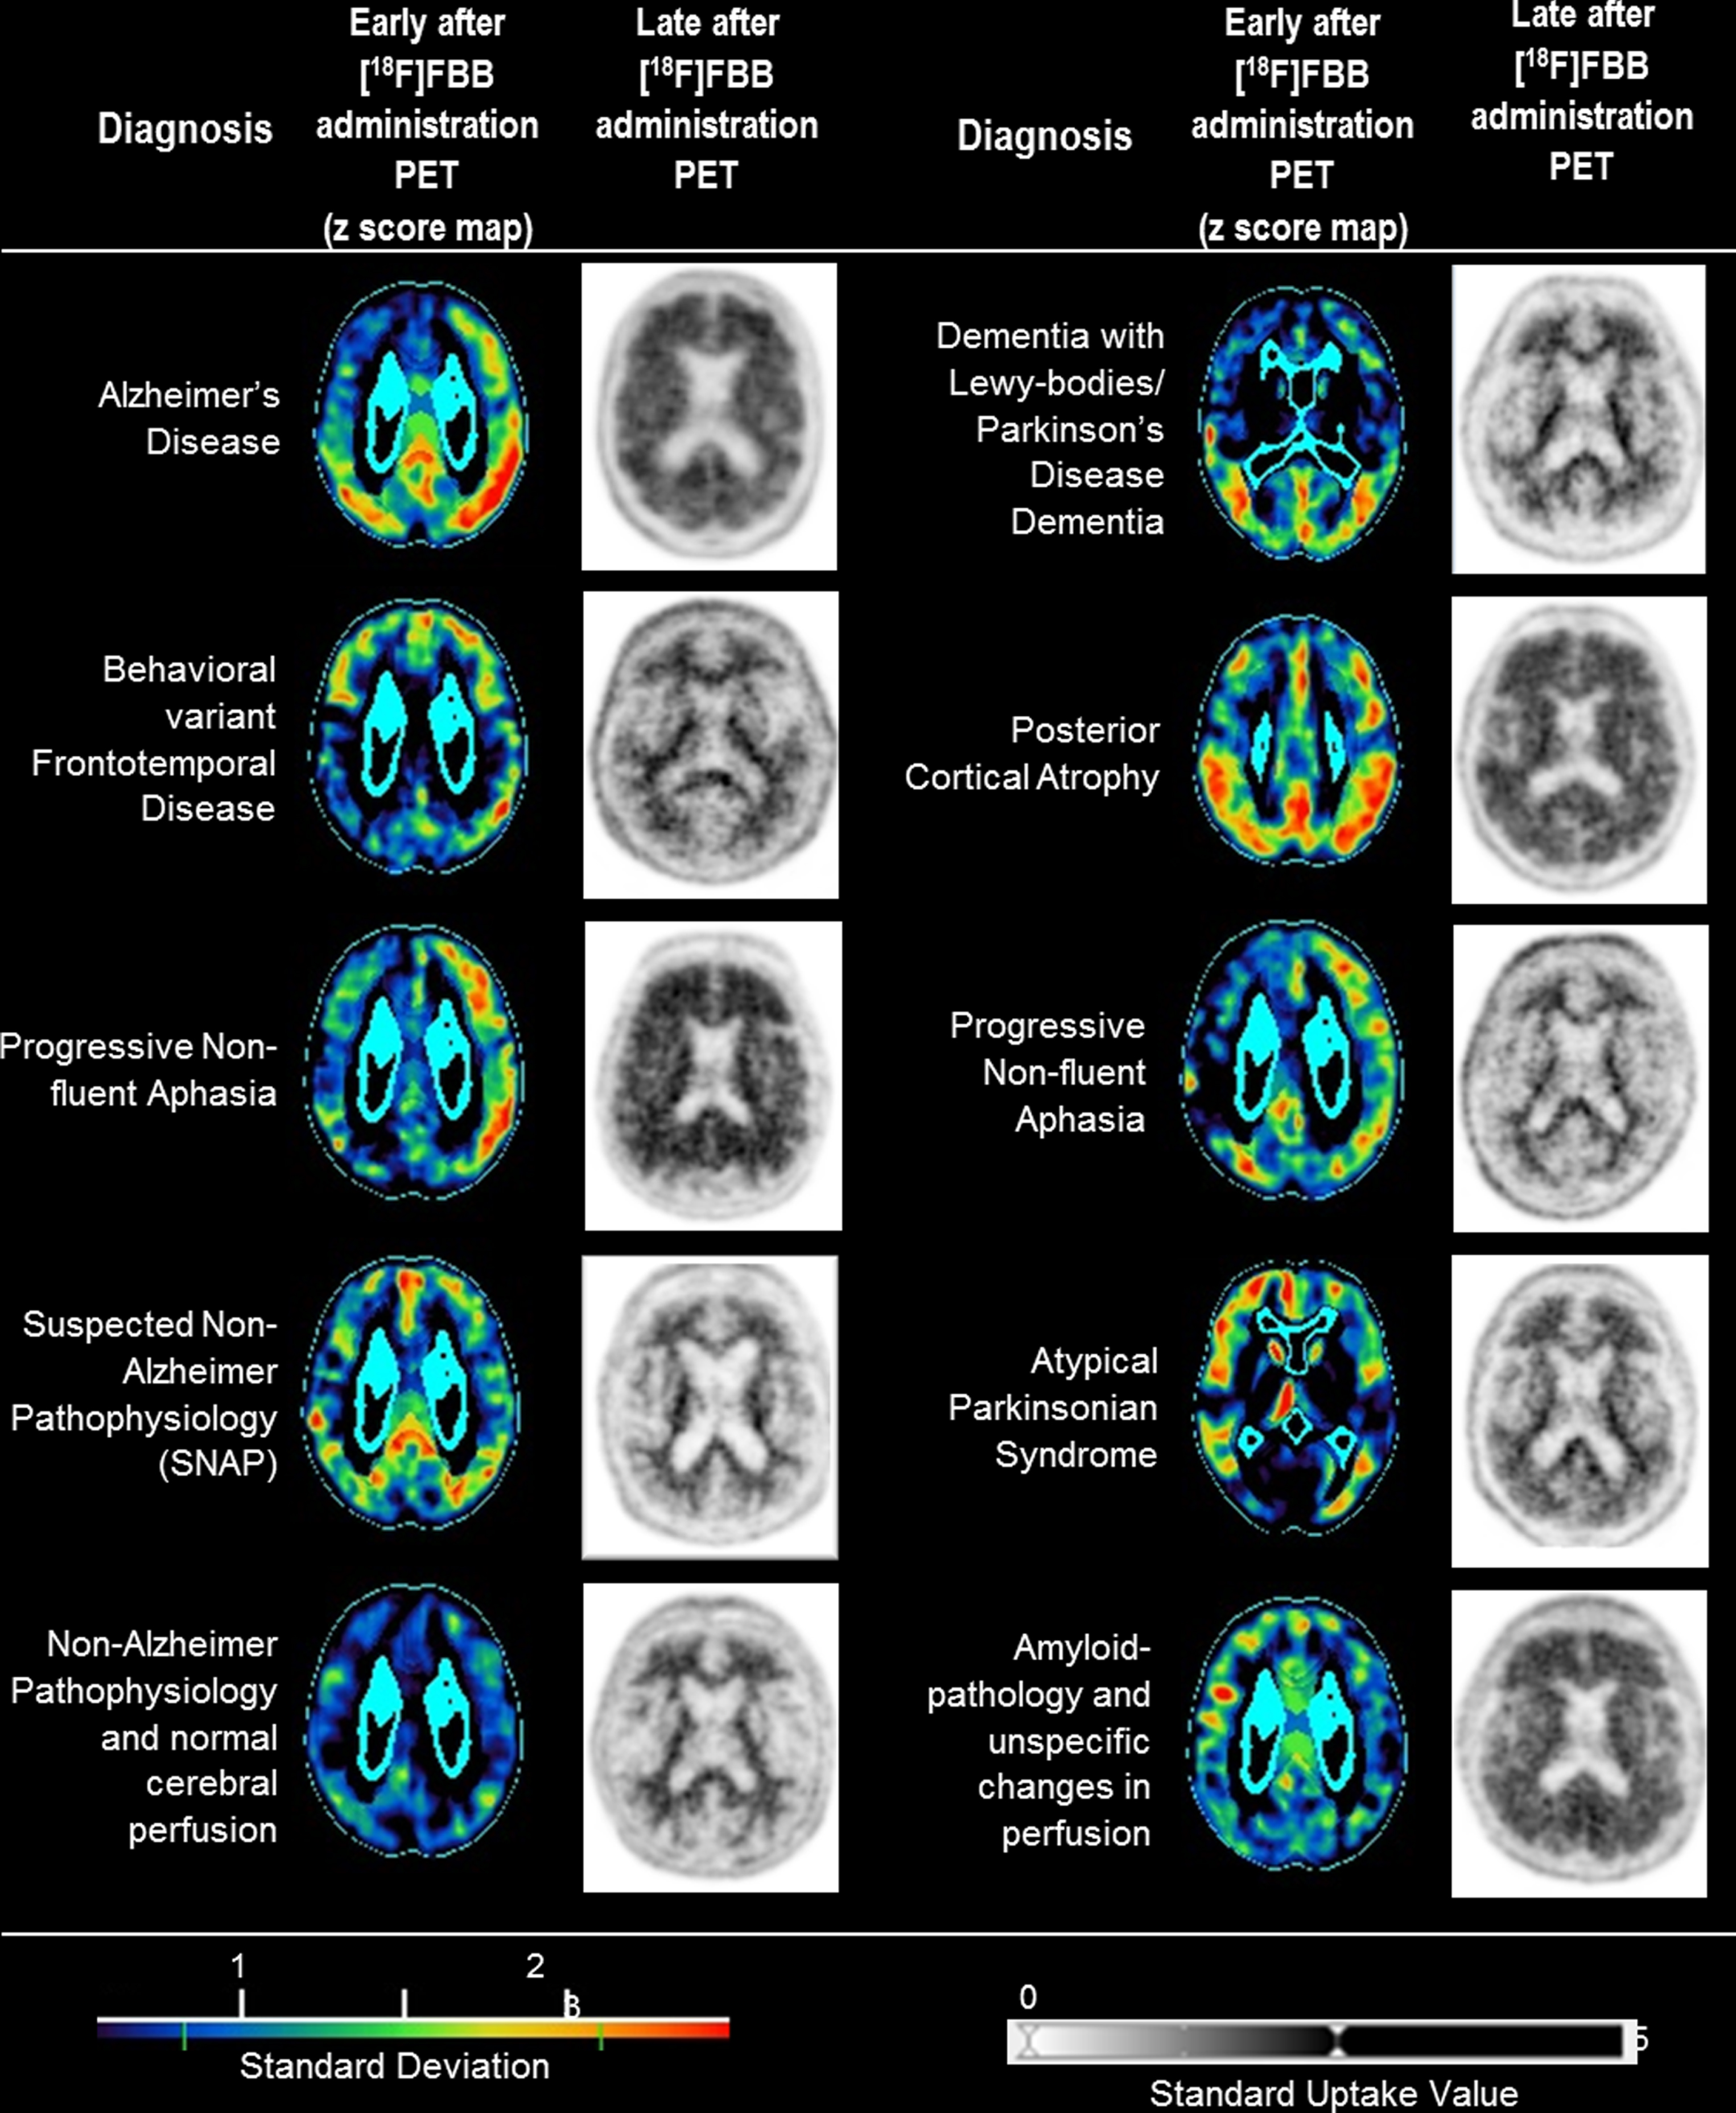
Different imaging pattern of early after [18F]Florbetaben (FBB) administration PET z score maps (Hermes Brass software) and late after [18F]FBB administration PET images of our patients with dementia and the diagnosis according to clinical features and/or [18F]FBB PET data.
Relative quantitative and correlation analyses
The Herholz scores of the early [18F]FBB PET images differed significantly between the MCI subjects (0.88±0.04) and the patients with probable AD dementia (0.84±0.06, p = 0.024), as well as between the MCI subjects and possible AD dementia patients (0.85±0.05, p = 0.005), but not between the probable AD and possible AD dementia patients (p = 0.899). For the late [18F]FBB PET images, cases which were visually assessed as Aβ-positive had significantly higher composite late phase SUVRs and significantly lower MMSE values compared to the Aβ-negative subjects (Table 4). The early [18F]FBB PET image-derived Herholz scores were significantly correlated with the MMSE scores (R = 0.30, p = 0.006). This was not the case for the composite late phase SUVRs (R = 0.20, p = 0.066) (Fig. 3).
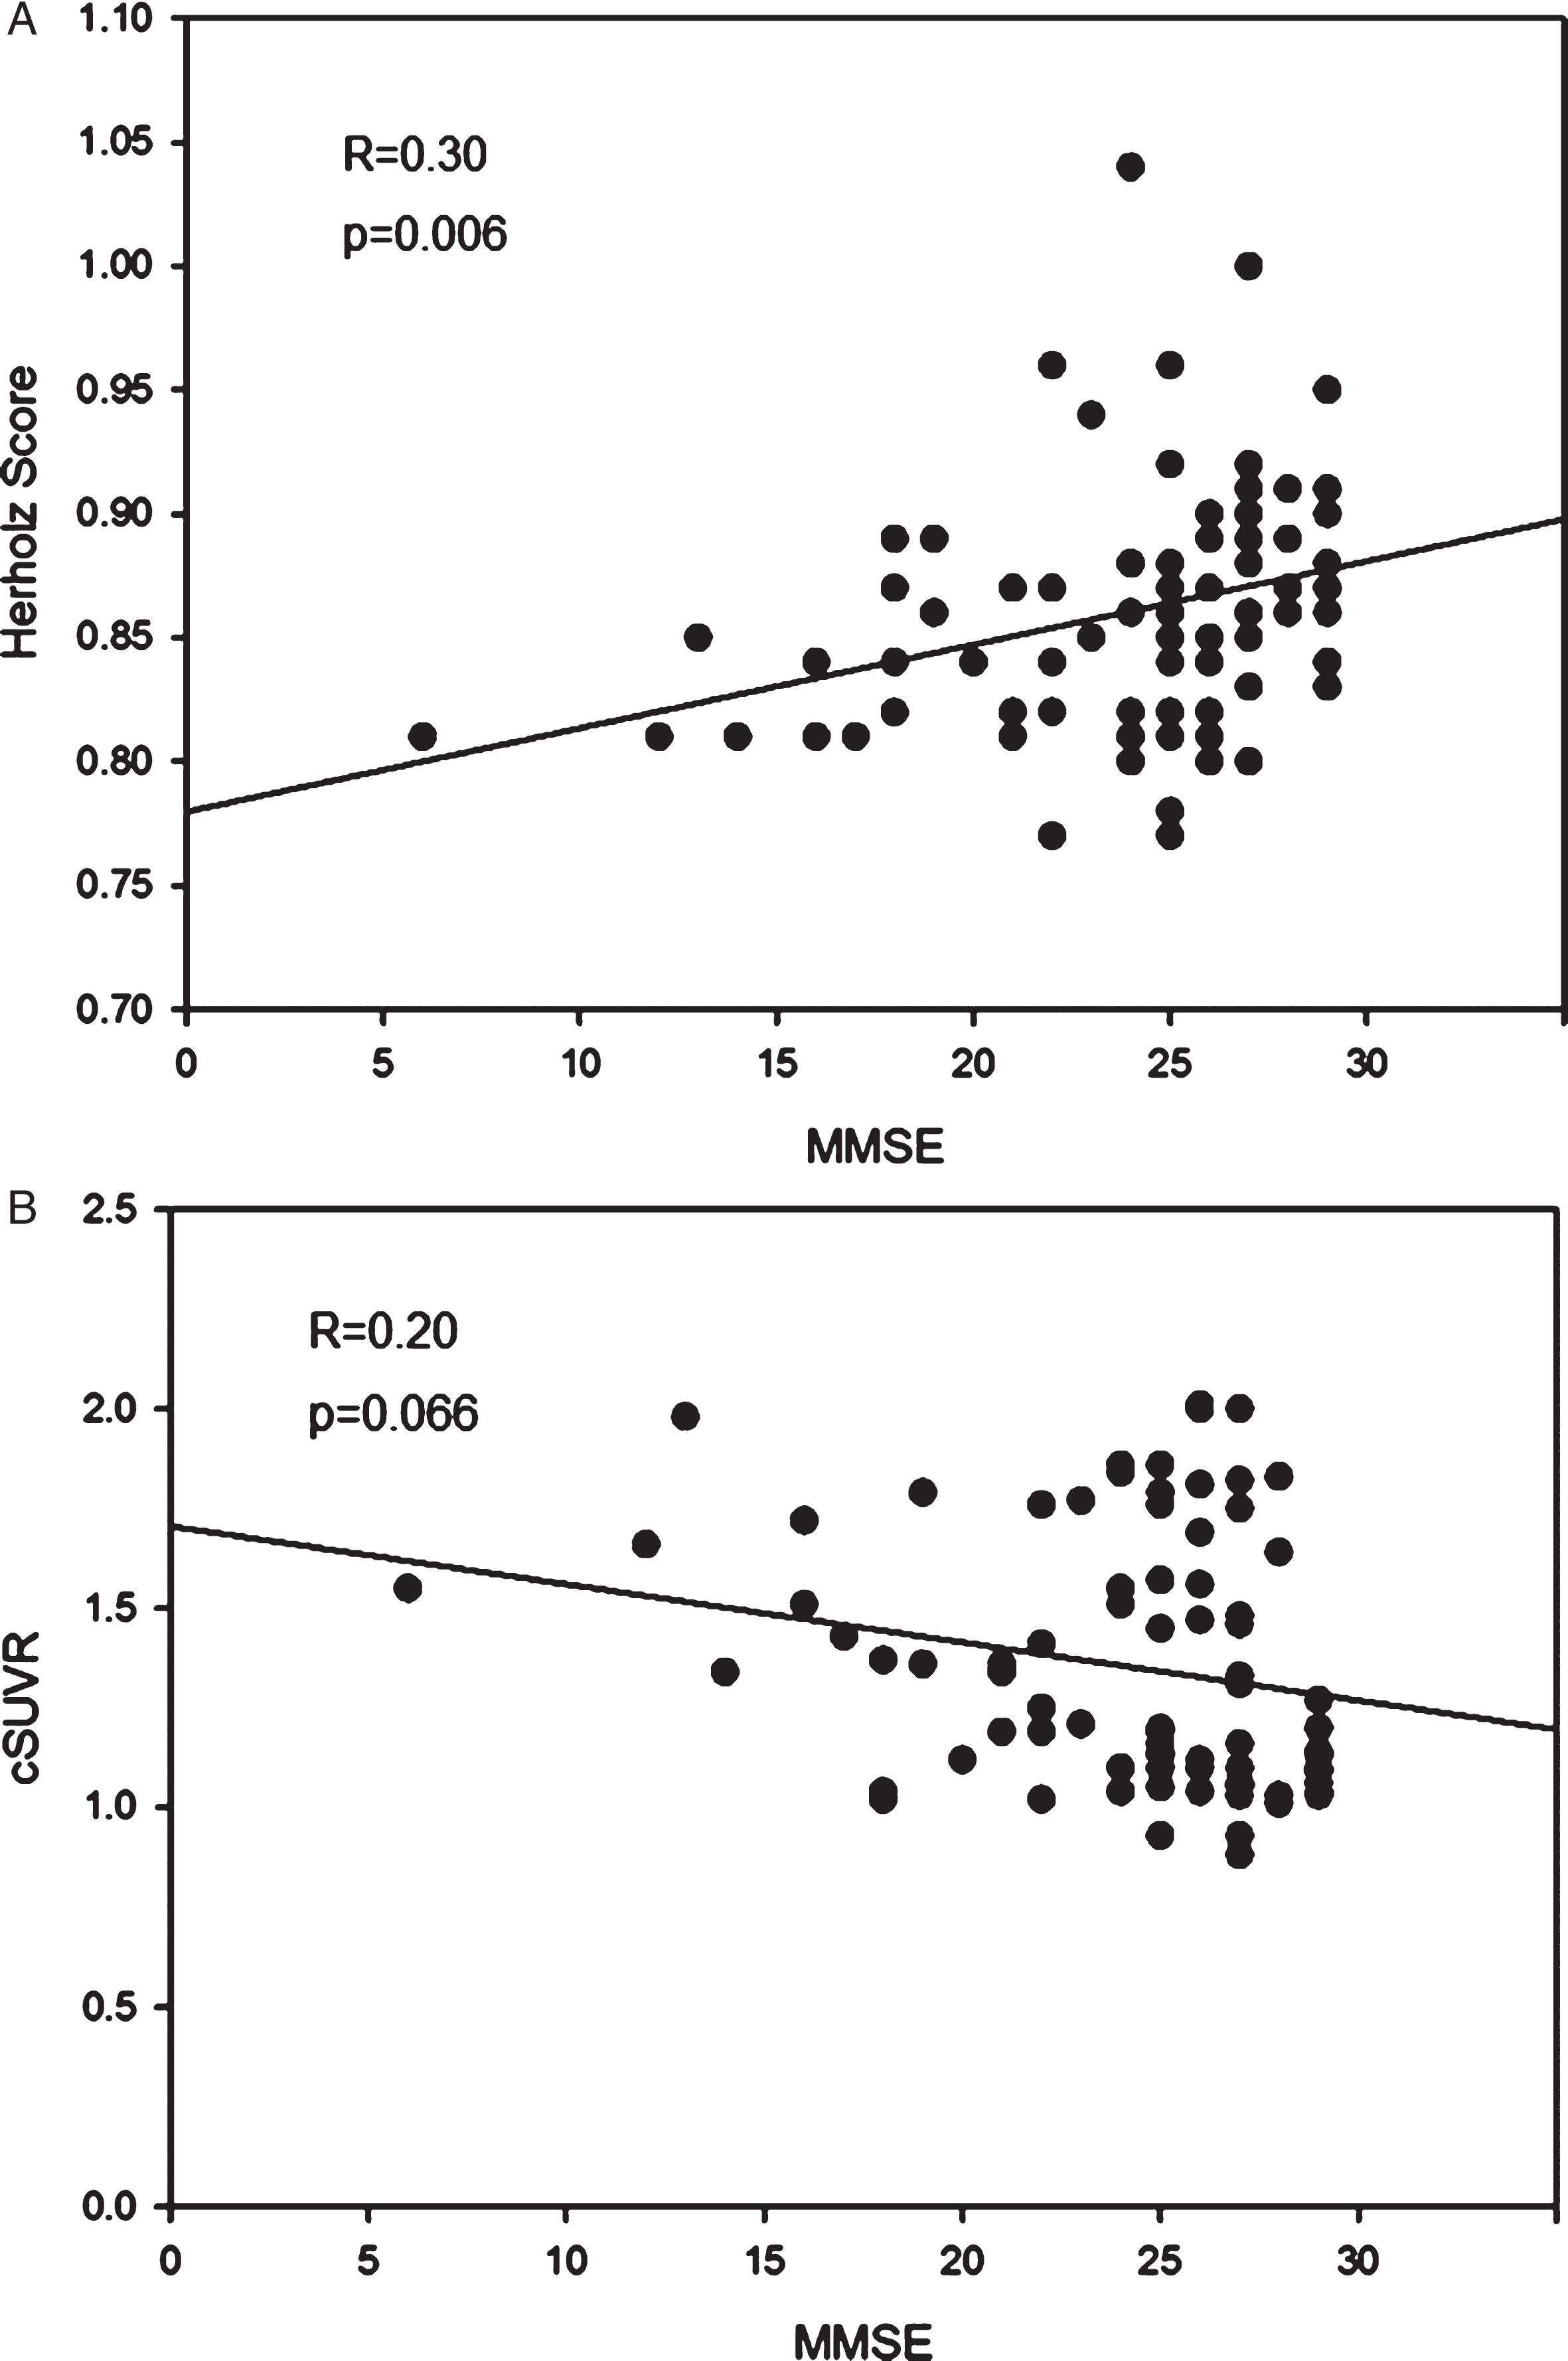
A) Scatter plot showing positive linear correlation between mini mental state examination (MMSE) scores and Herholz scores, a quantitative measure of neuronal injury in AD-typical regions, calculated from the early after [18F]Florbetaben administration PET images. B) Scatter plot showing a trend towards negative linear correlation between mini mental state examination (MMSE) scores and composite standardized uptake value ratios (cSUVRs), a quantitative measurement of Aβ plaque deposits in AD-typical regions, calculated from late after [18F]Florbetaben administration PET images.
Categorization according to the NIA-AA criteria
Employing the visual scores of the early [18F]FBB PET data as neurodegeneration biomarkers, and those of the late [18F]FBB PET data as amyloid pathology biomarkers resulted in the following categorization of the MCI subjects according to the NIA-AA criteria: “MCI - Unlikely due to AD” (n = 1, 2%), “MCI - Core clinical criteria” (n = 24, 59%), “MCI due to AD - Intermediate likelihood” (n = 9, 22%), and “MCI due to AD - High likelihood” (n = 7, 17%). For the patients with probable AD dementia according to the NIA-AA criteria: “Dementia unlikely due to AD” (n = 1, 6%), “Probable AD dementia based on clinical criteria” (n = 4, 22%), “Probable AD dementia with intermediate evidence of AD pathophysiological process” (n = 5, 28%), “Probable AD dementia with high evidence of AD pathophysiological process” (n = 8, 44%). In case of the patients with possible AD dementia: “Dementia unlikely due to AD” (n = 6, 19%), “Possible AD dementia based on clinical criteria” (n = 17, 53%), “Possible AD dementia with evidence of pathophysiological process” (n = 9, 28%).
Categorization according to the IWG-2 criteria
The categorization of all subjects according to the IWG-2 AD biomarker classes depending on the results of the early and late [18F]FBB PET imaging is shown in Table 3. Of the 62 subjects categorized as negative for both biomarkers, 5 (8%) were patients with probable AD dementia, 20 (32%) patients with possible AD dementia, 25 (40%) subjects with MCI, and 12 (20%) patients with dementia due to other diseases. 20 subjects (n = 5 (25%) patients with probable AD dementia, n = 3 (15%) patients with possible AD dementia, n = 9 (45%) subjects with MCI, and n = 3 (15%) patients with dementia due to other diseases were positive for only one of the biomarkers. 30 cases were scored as double-positive, including 8 (27%) patients with probable AD, 9 (30%) patients with possible AD, 7 (23%) subjects with MCI, and 6 (20%) patients with other dementia.
Subject categorization according to the IWG–2 biomarker criteria
The late images of the FBB PET scan were used as diagnostic biomarker, and the early images of the FBB PET scan as progression biomarker. IWG–2, International Working Group 2; FBB, [18F]Florbetaben; PET, positron emission tomography; AD, Alzheimer’s disease; MCI, mild cognitive impairment.
Relative quantitative PET data and cognitive scores depending on visual amyloid PET image read
Herholz scores were obtained from the early [18F]Florbetaben PET images, and composite late phase SUVRs from the late [18F]Florbetaben PET images; PET, positron emission tomography; Aβ, amyloid-β; SUVR, standard uptake value ratios; MMSE, Mini-Mental State Examination; data are mean values±standard deviations.
DISCUSSION
The present study investigated the utility of dual time-point [18F]FBB PET to provide dual AD biomarker information in a close to clinical routine scenario.
The concept of employing early after amyloid tracer administration PET images as a substitute of [18F]FDG PET images, by that delivering dual AD biomarker information from one amyloid tracer use, is based on the well-established utility of [18F]FDG as neuronal injury surrogate. For example, Mosconi et al. demonstrated the feasibility of using [18F]FDG PET in the differential diagnosis of AD against MCI and other neurodegenerative disorders (e.g., frontotemporal lobar degeneration (FTLD), DLB) with an overall accuracy of 96% [27]. Dukart et al. showed that classification accuracy was higher for [18F]FDG PET than MRI in separating AD from controls or other neurodegenerative diseases, namely FTLD [28]. Furthermore, Teipel et al. proposed that [18F]FDG PET might be useful as a predictor for disease progression while amyloid PET is highly sensitive in early stages of AD [29]. However, we recently demonstrated that early after [18F]FBB administration PET images closely correlate with [18F]FDG PET images [9], a finding which motivated for this present biomarker-focussed study.
In this study, early [18F]FBB PET images were employed as biomarker for neuronal injury and late [18F]FBB PET images as biomarker for amyloid pathology. The visual analysis of all subjects revealed an AD-typical pattern in 35% while the results for the group of patients with dementia due to AD and MCI due to AD were 42% and 27%, respectively. For the MCI subjects, the result on the frequency of AD-typical patterns in the early [18F]FBB images are in line with the work from Mosconi et al. [27] on 114 MCI subjects who revealed an AD-typical pattern in 25%. The study from Lowe et al. [30] with 211 AD dementia subjects from the Alzheimer’s Disease Neuroimaging Initiative (ADNI) reported an AD-typical pattern in [18F]FDG PET in 67% of all subjects. Furthermore, 95% of these subjects were amyloid-positive, compared to 77% in our investigation. The higher percentage of amyloid-positive subjects in the study of Lowe et al. [27] is probably due to the requirement of at least one biomarker for amyloid pathology (PET or CSF) being positive as inclusion criterion for this study. More stringent inclusion criteria might also be the reason for the relatively higher percentage of subjects with an AD-typical pattern in the above ADNI study compared to our clinical routine group.
The evaluation of the late [18F]FBB PET images showed a positive amyloid load in 37% of all subjects, with 42% and 29% Aβ-positivity for the AD dementia and MCI subgroups. Other studies with cognitively normal individuals published a positive amyloid load in 24% [31] and 31% [32] of all subjects. In the study of Burnham et al., three different radiotracers ([11C] PIB, [18F]Flutemetamol, [18F]Florbetapir) with different SUVR cut points were used to measure Aβ deposition while Jack et al. used PIB PET scan with different cut-point criteria [31, 32]. The [11C]PIB PET work from Hatashita et al. [33] with 68 MCI patients, all fulfilling the core clinical criteria for MCI from the NIA-AA, revealed a positive amyloid load of 75% cases visually assessed by two readers. Patients with other diseases causing cognitive decline were excluded from this study. The heterogeneous composition of our MCI group could explain the lower percentage of amyloid positivity in comparison to the investigations mentioned above. For the patients with AD dementia, Ossenkoppele et al. [34] reported a mean prevalence of amyloid positivity of 88% from a meta-analysis of 1359 clinically diagnosed AD patients.
According to the diagnostic criteria from the NIA-AA for the diagnosis of MCI due to AD, 39% of the subjects were categorized as “MCI due to AD with intermediate/high likelihood” depending on whether only one or both of the examined biomarkers were positive. In comparison, results from the Mayo Clinic Study of Aging (MCSA, 154 subjects) and the Alzheimer's Disease Neuroimaging Initiative 1 (ADNI–1, 58 amnestic MCI subjects) reported by Petersen et al. [35] showed at least one positive biomarker in 57% and 67% of the subjects. The utilization of both [18F]FDG PET as well as MRI atrophy as biomarker for neuronal injury could explain the higher rates of positivity. Also, while Petersen et al. [35] included only patients with amnestic MCI, in our clinical pathway, MCI patients are more often transferred to Aβ PET MRI with unspecific (amnestic and/or non-amnestic) clinical symptoms. According to the diagnostic criteria for the diagnosis of dementia due to AD from the NIA-AA, 44% of our patients with probable AD revealed positivity in both biomarkers, while 28% were positive for one of them. These results are in good accordance with 50% positivity for both biomarkers recently reported by our group from an analysis of 100 subjects composed of 51 subjects with MCI, 44 AD dementia subjects, and 5 patients with FTLD, imaged with simultaneous Aβ PET/MRI [36]. Furthermore, similar results were showed in the study of Lowe et al. [30] with positivity in both biomarkers of 48% for all AD dementia patients.
In consideration of the NIA-AA criteria, patients with possible AD have to reach positivity in both biomarkers to support the clinical diagnosis of AD. This constellation was found in 28% of our patients. This percentage is lower than 54% as reported in our previous work on combined amyloid PET/MRI using MTLA as marker for neuronal injury. Reasons for this difference could be higher rates of Aβ-positivity (52% versus 37%) and pathological neurodegeneration marker results (59% versus 35%) in the study of Schütz et al. [36] compared to our investigation.
According to the biomarker classification of the IWG–2, 27% of all subjects were positive for both diagnostic and progression biomarkers, while 18% revealed positivity in at least one of both. Our group recently also investigated the congruence of biomarkers in a prospective cross-observational study with 54 MCI subjects or dementia due to AD patients. Medial lobe atrophy, MRI and tau concentration were utilized as biomarkers for neuronal injury, while CSF Aβ1–42 and Aβ PET were employed as biomarkers of amyloid pathology. Here, 75% of the patients with the clinical diagnosis of AD fulfilled the IWG–2 criteria [37]. Reasons for the discrepancy between this present dual time-point amyloid PET study and the above work might be the application of two different neuronal injury as well as amyloid pathology biomarkers and, therefore, a higher probability of a double positive biomarker constellation for the latter trial.
In line with other studies, we observed some patients with a tracer uptake pattern suggestive of neurodegeneration marker typical for AD together with normal biomarker assessment for amyloid pathology. This so called “suspected non-Alzheimer’s pathology” (SNAP) constellation was registered in 9 of 112 subjects (8%). Comparable results were found by Lowe et al. [30] with an SNAP incidence in the ADNI AD group of 6%. In our study, 4 of 41 MCI subjects (10%) fulfilled the SNAP constellation. This number is lower than the overall SNAP rate of 25% reported by Jack et al. [38] from an aggregation of four different studies with 277 amnestic MCI subjects. Of note, the study by Caroli et al. [39] showed a greater risk of progressive cognitive decline in MCI patients with SNAP compared to MCI patients without positive biomarkers. However, dual time-point Aβ PET was shown in this present study to be able to detect SNAP subjects, with potential consequences for the subject’s prognosis.
The outcomes of the relative quantitative dual time-point [18F]FBB PET data analysis were in good agreement with the data collected by visual analysis. The Herholz scores of the early [18F]FBB images which served as a quantitative surrogate of neuronal injury were significantly higher for the probable/possible AD cases vs. the MCI subjects and showed a linear positive correlation with the MMSE scores. As also expected, the cSUVRs of the late FBB images serving as quantitative surrogate parameter of Aβ plaque load were significantly higher in the subjects visually evaluated as Aβ-positive versus Aβ-negative. The later results correspond to previous phase II and other [18F]FBB study results by our group [7, 26].
According to our data it can be assumed that dual time-point [18F]FBB PET enhances accuracy in diagnosing MCI subjects and AD patients according to the recommended diagnostic criteria of the NIA-AA and IWG–2 workgroups. As proposed by Burnham et al. [31], brain Aβ deposits act as risk factor for cognitive decline and for progression to symptomatic stages of AD with neurodegeneration working as a compounding factor. In 2014, Mormino et al. [40] showed that the co-occurrence of neuroimaging markers of Aβ and neurodegeneration in cognitively normal individuals leads to accelerated cognitive decline. Therefore, the combination of neuroimaging biomarkers as provided by dual time-point [18F]FBB PET might in the future also help to detect early stages of disease and identify asymptomatic individuals at elevated risk for disease progression. A recent initiative proposed a five-phase roadmap for an early diagnosis of AD based on biomarkers [41]. While sufficient evidence of analytical validity exists for all biomarkers, data on clinical validity and utility are incomplete. Using this roadmap our data provide information on phase 3, i.e., assessing the capacity of dual time-point [18F]FBB PET to detect early disease and combine biomarker to reliably classify cognitive impairment subjects. Moreover, dual time-point [18F]FBB PET could be important to target patients at risk for upcoming prevention trials, and the biomarkers might be employed as surrogate measures to assess drugs treatment efficacy [40, 42]. The individual participant meta-analysis from Jansen et al. [43] with 2914 non-demented patients to estimate the prevalence of amyloid pathology in persons without dementia suggested a 20- to 30-year interval between amyloid positivity and dementia. Furthermore, Aisen et al. [44] proposed that anti-Aβ therapy and other disease-modifying interventions may have the greatest clinical impact if started at early stages of disease.
The limitations of this study were the retrospective observational character of our trial. A follow-up project is envisaged to investigate whether the obtained biomarker information of the dual time-point [18F]FBB PET data have predictive potential, for instance with regard to conversion from MCI to AD dementia. Furthermore, the comparably low patient numbers for the “other dementia” subgroup is a limitation of our study. Overall, more work— also in a prospective fashion— is, thus, necessary to determine a suitable diagnostic scheme in case of conflicting biomarker constellations.
Conclusion
Dual time-point [18F]FBB amyloid PET provides information on AD pathology and neuronal injury within one PET session. It, therefore, has great potential to support and simplify the diagnosis of MCI due to AD and AD dementia, as well as to improve differential dementia diagnosis.
DISCLOSURE STATEMENT
Authors’ disclosures available online (https://www.j-alz.com/manuscript-disclosures/18-0522r1).