
Abstract
Recent investigations have demonstrated an important role of gut microbiota (GM) in the pathogenesis of Alzheimer’s disease (AD). GM modulates a host’s health and disease by production of several substances, including lipopolysaccharides (LPS) and short-chain fatty acids (SCFAs), among others. Diet can modify the composition and diversity of GM, and ingestion of a healthy diet has been suggested to lower the risk to develop AD. We have previously shown that bioactive food (BF) ingestion can abate neuroinflammation and oxidative stress and improve cognition in obese rats, effects associated with GM composition. Therefore, BF can impact the gut-brain axis and improved behavior. In this study, we aim to explore if inclusion of BF in the diet may impact central pathological markers of AD by modulation of the GM. Triple transgenic 3xTg-AD (TG) female mice were fed a combination of dried nopal, soy, chia oil, and turmeric for 7 months. We found that BF ingestion improved cognition and reduced Aβ aggregates and tau hyperphosphorylation. In addition, BF decreased MDA levels, astrocyte and microglial activation, PSD-95, synaptophysin, GluR1 and ARC protein levels in TG mice. Furthermore, TG mice fed BF showed increased levels of pGSK-3β. GM analysis revealed that pro-inflammatory bacteria were more abundant in TG mice compared to wild-type, while BF ingestion was able to restore the GM’s composition, LPS, and propionate levels to control values. Therefore, the neuroprotective effects of BF may be mediated, in part, by modulation of GM and the release of neurotoxic substances that alter brain function.
INTRODUCTION
Alzheimer’s disease (AD) is a degenerative brain disease and the most common cause of dementia. In AD, aggregation of amyloid-β (Aβ) protein and hyperphosphorylation of tau represents the major pathological hallmarks [1, 2]. On the one hand, misfolded and aggregated proteins are recognized by astroglia and microglia cells and trigger an innate immune response, characterized by the release of inflammatory cytokines and neuroinflammation, which contribute to disease progression and severity [3, 4]. On the other hand, it has been postulated that soluble Aβ may cause neuronal membrane damage, producing reactive oxygen and nitrogen species [5]. This oxidative damage would alter synaptic membrane structure, causing alterations in dendritic spines with a subsequent cognitive decline [6]. In addition, data obtained from clinical and preclinical AD studies have observed the presence of non-convulsive epileptic patterns, as well as cerebral hyperactivity long before amyloid plaques are detected [7–10]. Thus, AD pathogenesis is a multifactorial disease that conveys different mechanistic pathways. This may explain the fact that currently, there are no effective pharmacological therapies to cure or stop the progression of this devastating disease.
Gut microbiota (GM) consists of all the microorganisms living in our intestine and its composition is associated with host-health and disease [11, 12]. GM dysbiosis is functionally linked to host immune system. Lipopolysaccharides (LPS), components of the outer membrane of gram-negative bacteria [13], are increased in dysbiosis [14, 15] along with systemic [16] and central [15] inflammation. LPS administration to mice results in memory impairment, Aβ aggregation, and astrocyte activation [17]. Notably, LPS can be detected in parenchyma and blood vessels of non-demented aged and AD brain samples, but LPS levels were greater in diseased subjects [18–20]. Moreover, recent reports indicate that AD patients [21, 22] and transgenic (TG) mice [23–25] present different GM composition compared to controls.
The composition of GM depends on various factors, diet being one of its main modulators [26]. It is particularly interesting to note that some risk factors linked to the development of AD are ingestion of high-fat diets [27–29], metabolic disorders [30], and systemic infections [31–34], all related to alterations of GM composition. On the contrary, ingestion of a healthy diet can decrease the risk of developing dementia and brain atrophy [35–39]. Moreover, direct administration of probiotics in TG mice decreases amyloid aggregation and neuroinflammation [23], while improving cognitive functions in AD patients [40].
Recent studies illustrated the role of GM in amyloid aggregation, as GM depletion by a germ-free condition [41], or by antibiotic treatment [42, 43] reduced the amyloid burden and microglia activation in TG mice. However, it is unclear which factors may be linked to the gut-brain axis in AD. Short-chain fatty acids (SCFAs) are produced by the GM after the degradation of non-digestible polysaccharides, with butyrate, acetate, and propionate the most abundant fermentation products [44]. TG mice present different concentrations of SCFAs in feces [23, 25], and in brain tissue [25] compared to control mice, while probiotics administration to TG mice improves cognitive performance, restores SCFAs concentration in feces, and reduced pro-inflammatory cytokines in plasma [23]. We have previously demonstrated that the ingestion of bioactive food (BF), food that besides its nutritional value offers additional benefits against a disease condition [45], was able to modify GM, restoring glucose levels, oxidative stress in liver and brain, reducing LPS plasma levels, neuroinflammation, and causing improved cognitive abilities in obese rats [14, 15]. In this study, we aimed to elucidated whether diet-induced GM modifications in TG mice can impact not only the amyloid aggregation, but also synaptic and metabolic alterations, both events observed in early stages of AD. We found two bacterial associated-products that can be related to AD pathogenesis in 9-month-old female TG mice, and we describe the positive effect of BF ingestion on several pathological markers of AD.
MATERIALS AND METHODS
Experimental design
Female 3×Tg-AD transgenic mouse (TG) (RRID: MMRRC_034830-JAX) harboring the APPSWE and TauP301L transgenes on a PS1M146V knock-in background (homozygous mutant APPSWE, PS1M146V, and TauP301L), and female wild-type (WT) B6129SF1/J (RRID:IMSR JAX:101043) from same genetic background as PS1M146V knock-in mice, but harboring the endogenous wild-type mouse PS1) (both Jackson Laboratory, Bar Harbor, ME, USA) were used for the study. All mice were housed with access to food (Purina RodentChow5001) and water ad libitum, and under optimal vivarium conditions (12 h/12 h light–dark cycle, 20°C, and 40–50% relative humidity). Animal management was supervised by a licensed veterinarian in accordance with the principles set forth in the NIH guide for the care and use of laboratory animals, and was approved by the Bioethics Committee of the Instituto de Neurobiología, UNAM. This work was carried out in accordance with the EU Directive 2010/63/EU for animal experiments and the ICMJE Uniform Requirements for manuscripts submitted to biomedical journals. Once animals reached two months of age, they were housed individually and feed with two types of diet: 1)
Composition of experimental diets (g/kg diet)
The data for anti-oxidant activity was analyzed by an unpaired t-test. Data represents mean±S.EM. ***p < 0.001.
Cognitive assessment
Three days before finalizing dietary intervention, behavioral testing was performed. Spatial and short-term working memory was evaluated by the T-maze [47]. It is an ideal test to examine differences in the cognitive outcome of behavioral tasks without stress components (i.e., water maze) even in early stages of AD pathology [48]. This is an appropriate test to evaluate hippocampal and prefrontal cortex (PFC) functions [49], both regions heavily affected in AD. In order to habituate the animals for the behavioral test, animals were placed in the behavioral room during 1 h, one day before testing. When animals are faced with T-maze apparatus, they display a tendency to alternate into the maze arm that was previously ignored. Briefly, a T-shaped maze Plexiglas apparatus with starting arm (8.5×10.5×33.0 cm), and the two choice arms (8.5×10.5×30.0 cm) was used as previously described [47]. T-maze consisted of two phases: 1) Sample phase: animals were placed at the start arm, and allowed to choose between one of the two choice arms. A central divider was inserted into the start arm to create a start box. Once animals have chosen an arm, they were confined there for 30 s, thereafter the door was reopened and allow mice to return to the start arm. Animals were finally removed and returned to their cage. 2) Choice phase: Two minutes later, animals were placed again in the start arm, but without the central divider, and allowed them to choose an arm. If the animal chooses two different arms in both phases, this is counted as spontaneous alteration. Two hours later the procedure was repeated. Three trials were given on each day, during two days, with a total of 6 trials per animal. Percentages of spontaneous alternations were calculated from total of correct arm entries. Experiments were recorded with a Sony DCR TRV280 camera, which was connected to a computer equipped with in-house develop software to track animal’s trajectory.
Tissue preparation
One day after behavioral testing mice were sacrificed by cervical decapitation, plasma and brain were immediately collected for further analysis. Brain was divided into two halves. Right hemisphere was dissected out and PFC and cortex (CX) were separated. Tissues were snap frozen in liquid nitrogen and stored at –70°C until processing for western blot and SCFAs analysis. Left hemisphere was post fixed in 4% paraformaldehyde for 48 h at 4°C for immunohistochemistry and immunofluorescence analysis. For this, brain tissue was cryoprotected by immersion in 30% sucrose/PBS for 4 days. Coronal brain slices (40μm thickness, from Bregma –2.18 mm to Bregma –2.54 mm) were obtained with a sliding microtome (Leica Jung histoslide 2000 R). All sections were immersed in cryoprotectant solutions for light microscopy and immunofluorescence, as described previously [50], and stored at –20°C until use.
Immunohistochemistry
Detection of hyperphosphorylated tau was achieved by use of AT100 antibody (1:250), and Iba-1 antibody (1:100) for microglia detection. Briefly, sections were thoroughly washed with PBS, and permeabilized with 0.2% Triton in PBS (0.2% PBS-triton) for 20 min. Endogenous peroxidases were inhibited by incubation in 0.3% H2O2 in PBS for 10 min. Tissue sections were washed three times for 10 min each, in 0.2% PBS-triton. Non-specific binding was blocked by incubation in 5% bovine serum albumin (BSA, Sigma) in PBS for 5 min. Subsequently, sections were incubated with primary antibodies, all diluted in 0.2% PBS-triton, washed and incubated with respectively secondary peroxidase-conjugated antibodies (Table 2) in 0.2% PBS-triton for 2 h at room temperature. Hydrogen peroxide (0.01%) and 3,30-diaminobenzidine (DAB) (0.06%) in 0.2% PBS-triton was used to develop the horseradish peroxidase enzymatic reaction. The enzymatic reaction was stopped with 0.2% PBS-triton and then sections were mounted on glass slides and left to dry overnight. Dry sections were cover slipped with mounting medium Entellan (Merck).
List of Primary antibodies and secondary antibodies used in the current study
To evaluate the presence of amyloid aggregates, we used BAM-10 antibody that recognized Aβ1 - 40 peptide. Briefly, coronal sections were washed three times in PBS during 5 min, then incubated in formic acid (89.8%) for 10 min, followed by three times washing in PBS for 5 min each. Sections were incubated in solution of H2O2 (30%)+Methanol (10%) for 30 min followed by washing in PBS and then incubated in 0.1% PBS-tween for 15 min, followed by incubation in 5% goat serum (Vector) in PBS-triton for 30 min. Thereafter, sections were incubated with BAM-10 (1:1500) in 5% goat serum in PBS-triton for 18 h at 4°C. After washing in PBS, sections were incubated with secondary antibody (Table 2) in 0.2% PBS-triton for 2 h at room temperature. Subsequently, sections were washed and incubated with the avidin-biotin complex (ABC Kit; Vector Laboratories) in 0.2% PBS-triton for 2 h according to the manufacturer’s instructions. Finally, antibody binding was visualized with the chromogen DAB (DAB Peroxidase Substrate Kit; Vector Laboratories) 0.025%, with 0.01% H2O2 as a catalytic agent. Sections were washed with PBS, dehydrated by serial dilution in ethanol, and mounted with Eukit (Fluka). Control sections for all antibodies were processed without the primary antibody.
Immunofluorescence
For immunofluorescence staining, sections were washed in PBS and pre-treated with citrate buffer 20X (Sigma), at 94°C for 10 min, and then permeabilized with 0.2% PBS-triton for 20 min. Thereafter, sections were treated with 5% BSA for 5 min, and incubated with primary antibodies (Table 2): anti-Glial Fibrillary Acidic Protein (GFAP, 1:500), anti-Sirtun-1 (SIRT1, 1:500) (Table 2), all diluted in 5% horse serum (Vector Laboratories, S-2000) during 48 h at 4°C. Then, tissue was washed with 0.2% PBS-triton, and incubated with respective secondary antibodies (Table 2) in 0.2% PBS-triton. All sections were co-incubated with DAPI (4’, 6-Diamidino-2-Phenylindole, Dihydrochloride, Invitrogen) in 0.2% PBS-triton for 30 min, washed and mounted on glass slides. They were cover slipped with mounting medium Vecta shield (Vector Laboratories). Control sections were processed without the primary antibody.
Image acquisition and analysis
Leica DMI6000 inverse microscope was used to acquire bright-field images under 40xobjective for BAM-10, AT100, and iba-1. For fluorescent labeling, a laser scanning microscope (Leica TCS-SP8) with argon (488 nm), and helium/neon (543 nm) lasers and with optimized pinhole diameter was used. For GFAP and SIRT1, we used a 20X objective (SIRT zoom 4), whereas for double labeling of SIRT1 and GFAP, a 40X objective was used. Images were obtained by using system optimized z-stacks parameter (10 stacks, each stack 1.385μm) in Z axis, projected and analyzed in a two-dimensional plane. Stacks were superimposed as a single image by using the Leica LAS AF 2.6.0 build 7268 software.
Iba-1 + cells located in the striatum (st.) radiatum from CA1 hippocampal region were quantified based on their morphological characteristics, according to previous reports [50–52]. Microglia cells were classified as: inactive (displaying a slight ramified morphology and small rounded soma), or active (hypertrophic soma and with extensively thick and branched processes). Number of astrocytes labeled with GFAP were quantified in st. radiatum, st. oriens of CA1 hippocampal region, and layers I-V from entorhinal cortex (Ent. cx). We have differentiated in sub-areas of CA1 region because previous reports indicate stratum-specific alterations in hippocampus of TG mice [53].
Brightfield images were acquired at the same exposure light, and tissue background staining was subtracted from optical density values from fiber tracts within the same section, e.g., corpus callosum [53]. Threshold was determined by identifying best signal-to-noise ratio from at least 4–5 images, and averaging threshold values from those images. All images were analyzed with that averaged threshold [54]. Immunoreactive signal was evaluated by using the plugin “measure” in Image J 1.49v (NIH, open access) as previously reported [50].
Immunoreactivity against BAM-10 showed scarce amyloid aggregates (i.e., plaques) in subiculum (Fig. 2). BAM-10 staining was mainly as intracellular aggregates (Fig. 2). Thus, images obtained from subiculum were used to quantify number of plaques, while st. pryramidale of CA1 region of the hippocampus, and Ent. cx (layers III–V) were used for quantification of intracellular aggregates.

Effect of bioactive food on body weight and spatial memory. A) Body weight (g) in TG-AIN, TG-AIN, and TG-BF mice. TG mice gained more body weight compared to WT-AIN mice starting from the 17th experimental week (black asterisk: WT-AIN versus TG-AIN; grey asterisk: WT-AIN versus TG-BF). At the end of experiment, WT-AIN mice gained less body weight (9.66±0.66 g), compared to TG-AIN (16.25±1.03 g) (p < 0.001) and TG-BF mice (16.16±2.71 g) (p < 0.01), but there were no differences in final weight gain among TG mice. B) Working memory and spatial learning. Spontaneous alterations were recorded during 2 days-test on the T-maze. TG-AIN mice alternated less than WT-AIN mice (p > 0.05), while TG-BF showed same values as control mice (p < 0.05 versus TG-AIN). Data in A are expressed as the mean±S.E.M., in B as mean±S.D. WT-AIN, n = 9; TG-AIN, n = 7; TG-BF, n = 10. *p < 0.05, **p < 0.01, ***p < 0.001.
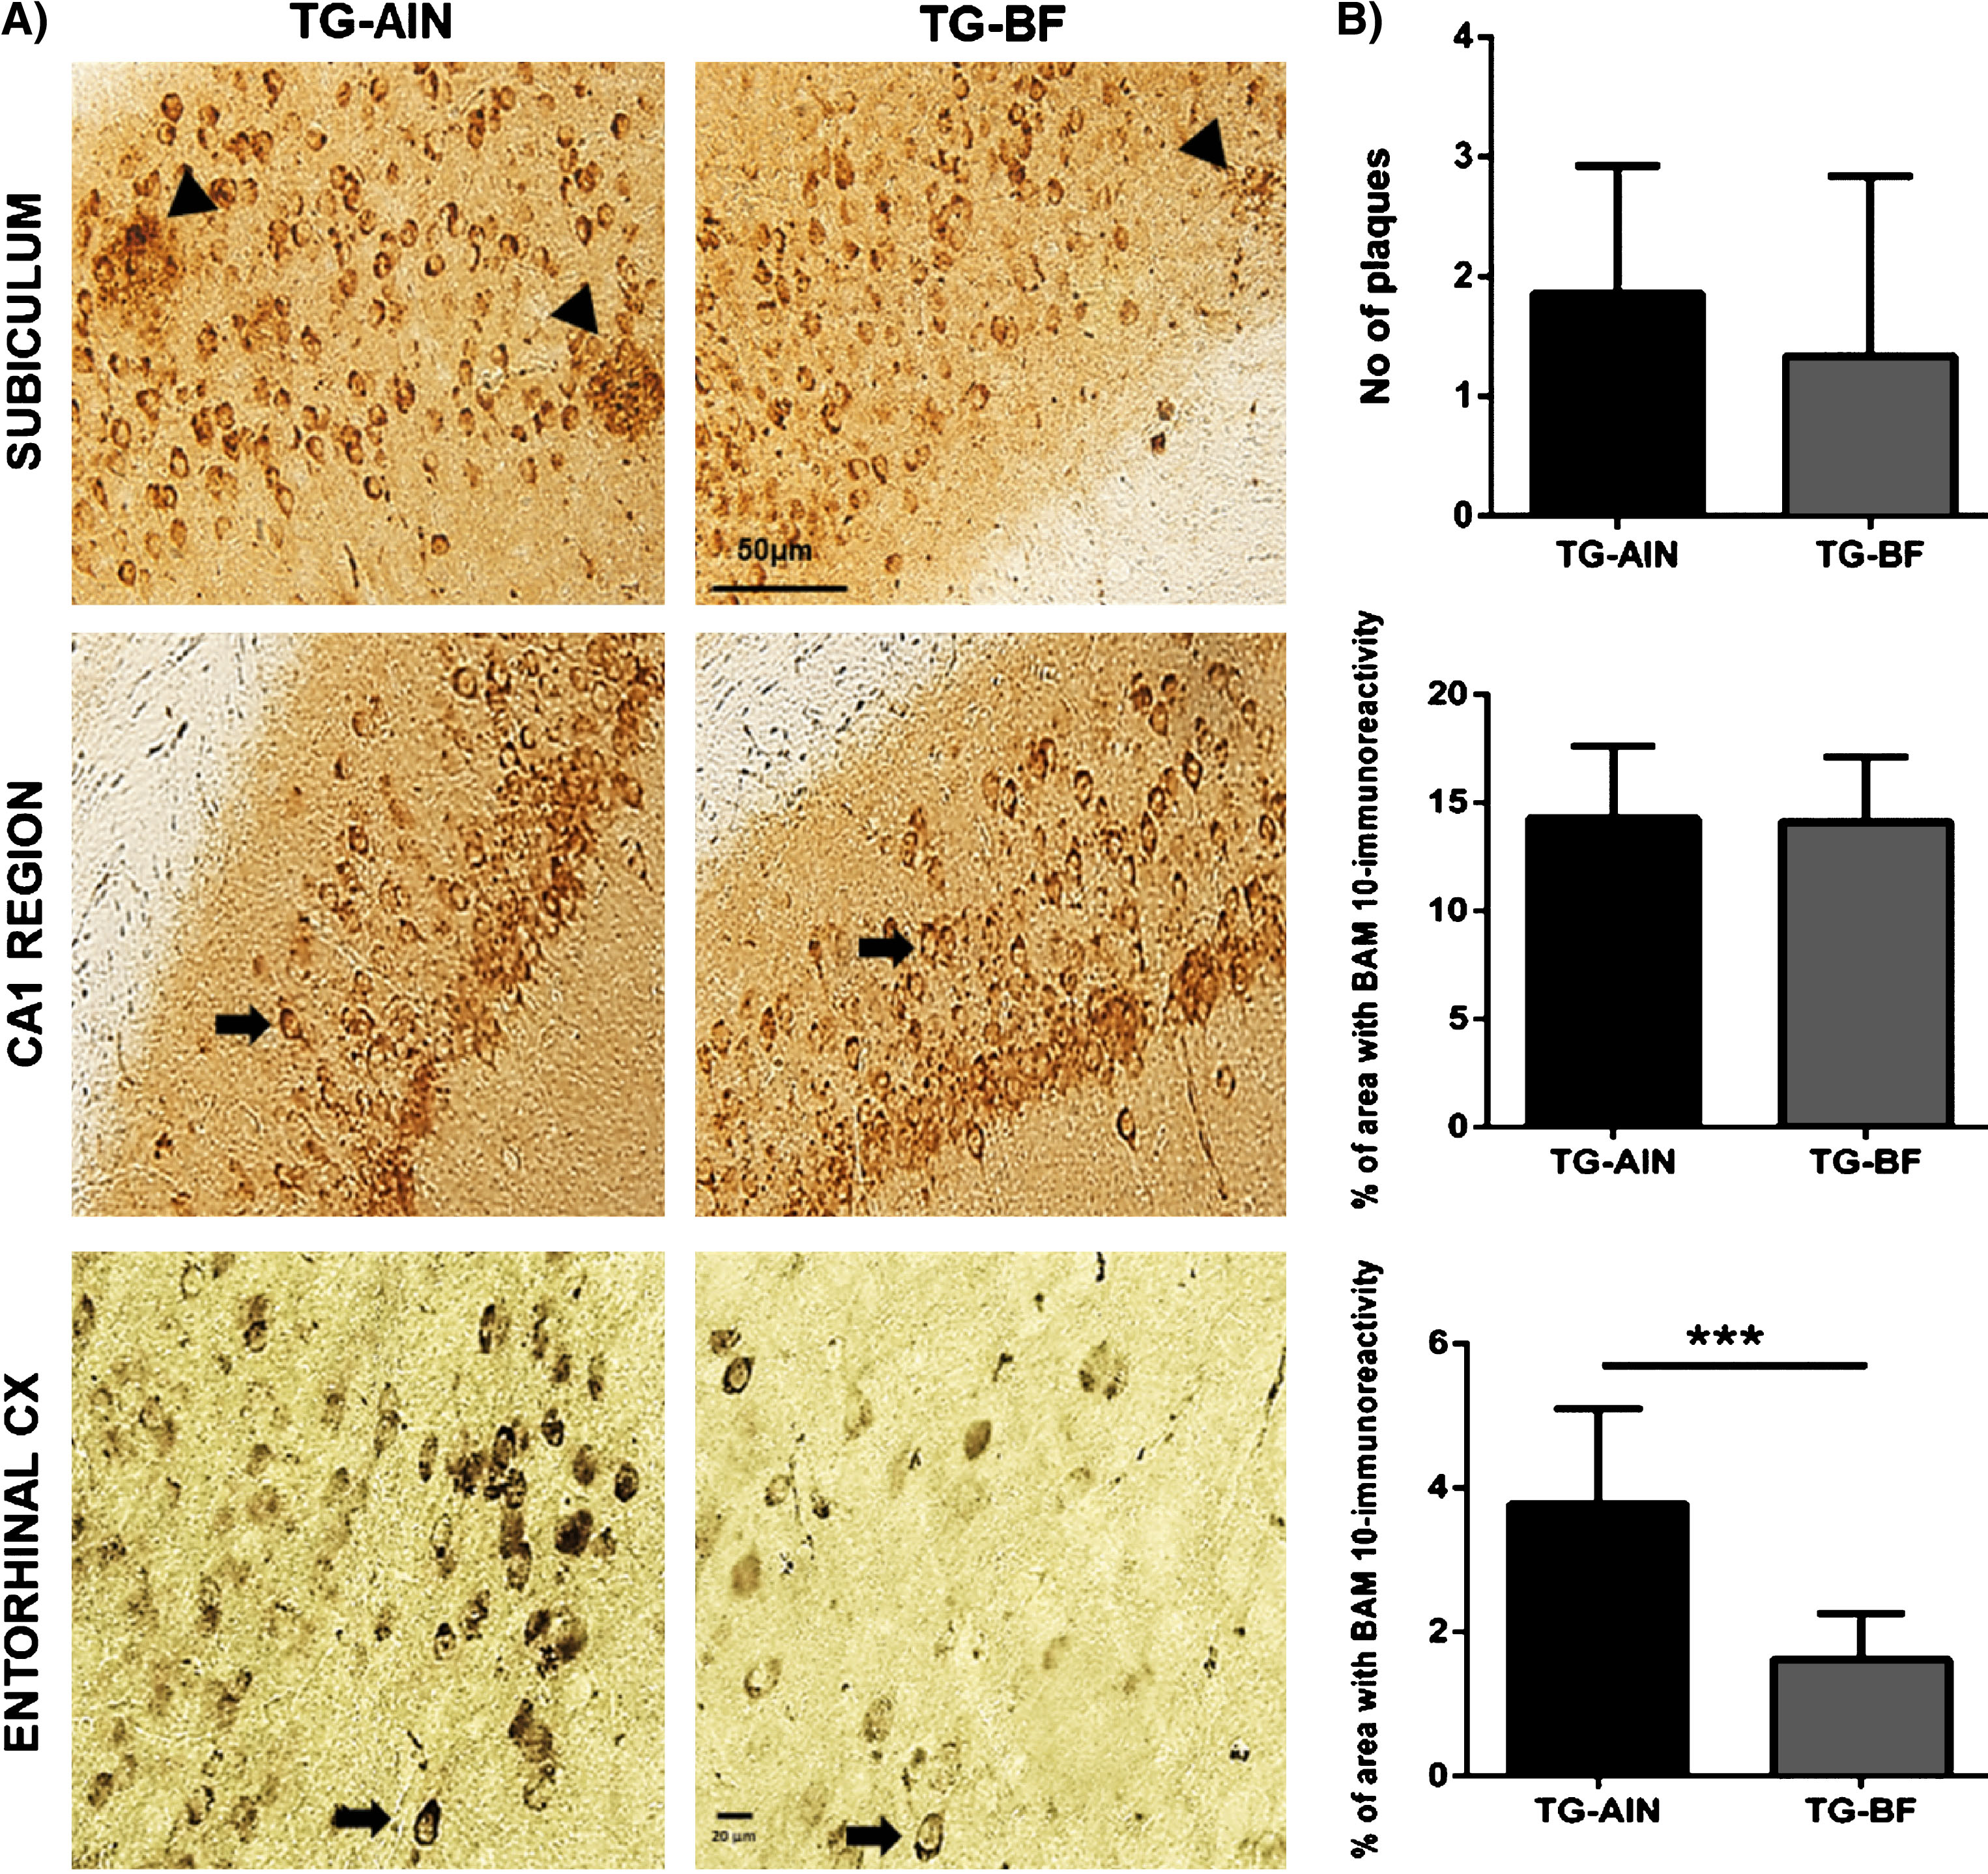
Evaluation of amyloid pathology. A) Representative images of BAM-10 staining in hippocampus and Ent. cx. Scale bar 50μm (hippocampus) and 20μm (cortex). B) Quantification of BAM-10 staining: Upper panel, in subiculum there were few large aggregates with no differences between groups. Middle panel, in CA1 region there were no differences between groups. Lower panel, in Ent. cx. TG mice treated with BF showed a decreased BAM-10 staining compared to TG-AIN mice (p < 0.001). N = 5 for each group. Data are expressed as the mean ± SD. ***p < 0.001.
For BAM-10 and AT100, percentage of area stained was calculated in a determined area (BAM-10:0.00614357142 mm2 in CA1, and 0.0933945 mm2 in cortex; AT100:0.001314 mm2). The percentage of area stained was calculated as the sum of areas with aggregates divided by the total area analyzed, and multiplied by 100.
For quantification of microglia cells and astrocytes, the total number of iba1 + and GFAP + cells were measured as number of cells / number of images×single image area (Iba1:0.089355 mm2; GFAP: 0.0338578125 mm2).
SIRT1 immunofluorescence was evaluated in hippocampal region. We used the plug-in “Analyse particles” of Image J 1.49v (NIH, open access) adjusting size and circularity of particles immunereactive to SIRT1. We summed the total number of particles quantified per area (st. radiatum: SIRT; 0.00185165 mm2; st. oriens: SIRT:0.0015mm2) in at least 3 images per animal. For detection of SIRT1 in GFAP+ cells, we first located SIRT1 immunoreactivity in the nucleus of GFAP + cells labeled with DAPI in st. radiatum of CA1 hippocampal region. Then, SIRT1 signal intensity was analyzed by Image J plugin “measure” only in the nucleus, as described above. In all staining, one image (with 20x objective) or two images (with 40x objective) per slice, 3 slices per animal, and at least 5 animals per group were analyzed, yielding 5 values for statistical analysis.
Western blot
Cortex was homogenized in RIPA buffer (150 mM sodium chloride, 1.0% NP-40 or Triton X-100, 0.5% sodium deoxycholate, 0.1% sodium dodecyl sulphate, 50 mM Tris, pH 8.0) (10% weight/volume). Homogenates were centrifuged at 13000 rpm for 15 min at 4°C. The purified total protein was quantified by the Lowry assay (Bio-Rad DC Protein Assay Kit) method. Samples (40μg proteins) were separated on SDS-PAGE (10–12%) and then transferred onto a polyvinylidene difluoride (PVDF) membrane. Blots were blocked with 5% blotting grade non-fat dry milk (Bio-Rad, Hercules CA, USA) or with 1% casein (C3400, Sigma) for p-AMP, p-GSK 3β, p-Tau231, for 1 h at room temperature and incubated overnight at 4°C with the primary antibodies as described in Table 2: ARC (1:250), GLUR1 (1:500), PSD 95 (1:1000), Synaptophysin (1:1000), AMPK (1:1000), p-AMPK (1:1000), Gsk3-β (1:250), p-Gsk3-β (1:500), FFAR 3 (1:250), Human Tau (1:250), Tau 231/AT180 (1:250), Malondialdehyde (MDA) (1:1000). Membranes were washed with TBS-T (TBS+0.05% Tween20), and then incubated with a horseradish peroxidase linked to secondary antibody (Table 2). As loading control, we used α-Actin (1:1000). Immunoreactive bands were visualized by enhanced chemiluminescence ECL for routine immunoblotting [55] using Chemidoc (Bio rad XRS+SYSTEM). The western blots were performed at least 3 times using independent blots. Densitometry analysis was performed using NIH image J software. Values were normalized with actin and expressed as fold increase.
Fecal microbiota analysis
DNA isolation and sequencing
Fecal samples were collected for each animal during the habituation day (three days before sacrifice). Animals were placed during 20 min in a Plexiglas arena (50 cm×50 cm) previously cleaned and disinfected. At least 100 gm of feces pellets were collected per animal, immediately frozen and stored at –70°C until use. Bacterial DNA was extracted using the QIAamp DNA Mini Kit (Qiagen, Valencia, CA, USA) according to the manufacturer’s instructions. MiSeq platform was used for the sequencing of the samples and then genomic libraries of the regions V3 and V4 of the 16 S gene were generated, using primers for those regions that also contained an overhang adapter specified by Illumina (F: 5′-TCGTCGGCAGCGTCAGATGTGTATAA GAGACAGCCTACGGGNGGCWGCAG-3′ and R: 5′-GTCTCGTGGGCTCGGAGA TGTGTATAAGAGACAGGACTACH VGGGTATCTAATCC-3′). The amplicons of the V3 and V4 regions were generated by PCR reactions containing genomic DNA (5 ng/μL in 10 mM Tris pH 8.5), high Fidelity DNA polymerase 2×KAPA HiFi HotStart ReadyMix and primers (1μM). This mixture was placed into the thermal cycler and run through the following program: 3 min at 95°C, followed by 25 amplification cycles consisting of denaturation (30 s at 95°C), alignment (30 s at 55°C) and elongation (30 s at 72°C). The final elongation consisted of 5 min at 72°C. The amplicons were purified using AMPure XP beads and their size was verified on capillary electrophoresis in the Agilent 2100 Bioanalyzer (Agilent Technologies, Santa Clara, California, USA), with an approximate size of 550 bp. Once passed the quality control, the samples were indexed using the Illumina Nextera XT Index Kit (v.2, Set A). For this process 5μL of the first PCR product, High Fidelity DNA polymerase 2×KAPA HiFi HotStart ReadyMix and primers (Index) were mixed and returned to the thermocycler, using the following program: 3 min at 95°C, followed by 8 amplification cycles which consisted of denaturation (30 s at 95°C), alignment (30 s at 55°C) and extension (30 s at 72°C). The final extension consisted of 5 min at 72°C. This product was purified and the integrity was analyzed. The amplicons had an approximate size of 610 bp. The concentration of double-stranded DNA was determined by fluorometry (Qubit fluorometer 3.0, high sensitive kit). The final library was mixed equimolarly and sequenced on the Illumina MiSeq platform (MiSeq Reagent Kit V.3, 600 cycles) following the supplier’s instructions. Sequence Analysis: For taxonomic composition analysis, Custom C# and python scripts, as well as python scripts in the Quantitative Insights into Microbial Ecology (QIIME) software pipeline 1.9 were used to process the sequencing files. The sequence outputs were filtered for low-quality sequences (defined as any sequences that are 620 bp, sequences with any nucleotide mismatches to either the barcode or the primer, sequences with an average quality score of 0). Sequences were chimera checked with Gold.fa, and chimeric sequences were filtered out. Analysis started by clustering sequences within a percent sequence similarity into Operational taxonomic units (OTUs). 91% of the sequences passes filtering, resulting in 83,906 sequences/sample with a 97% similarity threshold. Operational taxonomic units (OTUs) picking was performed using tool set Qiime-tools, using Usearch method. OTUs were picked against the Green Genes 13.9. 97% OTUs reference database. After the resulting OTU results files were merged into one overall table, taxonomy was assigned based upon the gg v13.9 reference taxonomy. Thus, 99.76%, 99.69%, 99.64%, 86.8%, 50.48%, and 10.86% of the reads were assigned to the phylum, class, order, family, genus, and specie level, respectively. Species richness (Observed, Chao1) and alpha diversity measurements (Shannon) were calculated, and we estimated the within-sample diversity at a rarefaction depth of >17351 reads per sample. Weighted and unweighted UniFrac distances were used to perform the principal coordinate analysis (PCoA). Microbial sequence data were pooled for OTUs comparison and taxonomic abundance analysis but separated by batch in PCoA to have clear PCoA figures. For even sampling, a depth of 17,351 sequences/sample was used. PCoAs were produced using Emperor. Community diversity was determined by the number of OTUs and beta diversity, measured by UniFrac unweighted and weighted distance matrices in QIIME. ANOSIM, a permutational multivariate analysis of variance was used to determine statistically significant clustering of groups based upon microbiota structure distances.
Lipopolysaccharide analysis
LPS content in plasma was determined by ELISA kit (CEB526Ge, Cloud-Clone Corp) according to manufacture instructions.
Short chain fatty acids
Short-chain-fatty acids (SCFA) content in feces and brain samples were analyzed by gas chromatography (GC). We collected fecal samples from WT-AIN, TG-AIN one day before finalizing the experiment, and from WT and TG mice of 3-, 6-, and 11-months of age (WT, n = 3 each age; TG, n = 4 each age) for the ontogeny study. Feces samples were immediately frozen and stored at –70°C until analysis. Fifty mg of feces was suspended in 5 mL of water and homogenized to get fecal suspension. The pH of the suspension was adjusted to 2–3 by adding 5M HCl, and then kept at room temperature for 10 min with occasional shaking. The suspension was centrifuged for 20 min at 5000 rpm and the supernatant was collected. The internal standard, 2-Ethylbutyric acid solution (1 mM in formic acid), was spiked into the supernatant. Supernatant was injected in GC (Agilent technologies-6850 series 11, Agilent, Santa Clara, CA, USA) with flame ionization detection (Agilent), by using Agilent J&W DB-225 ms column as previously described [56].
To evaluate the levels of propionic acid in brain we used GC-Mass Spectrophotometry (MS) using an Agilent Intuvo 9000 gas chromatography system coupled to an Agilent 5977B mass spectrometric detector (MSD, Agilent Technologies, Santa Clara, CA). No sample preparation was required as Thermal separation Probe accessory (5990-8715EN Thermo Sep Probe.indd - Agilent) was used for introduction of the sample into GC-MS. Briefly, samples were weighed and loaded into the vial for propionic acid extraction at the inlet, followed by the standard GC analysis. Propionic acid was separated using an Agilent Column (part number 122-7033UI-INT: Serial number US16460202), phase DB-WAX_UI (Dimensions 30 m×250μm×0.5μm). 0.4μl of derivatives was injected in split mode with a ratio of 20:1, and the solvent delay time was set to 6 min. Helium was used as a carrier gas at a constant flow rate of 1 mL/min. The initial oven temperature was held at 60°C for 0.05 min, ramped to 250°C at a rate of 900°C/min, and finally held at this temperature for 3 min. Data analysis was performed using MassHunter Quantitative software. (Agilent Technologies, Santa Clara, CA, USA).
Statistical analysis
Data are expressed as the mean±S.E.M. for body weight and microbiota analysis at species and genus level, otherwise we expressed data as mean±S.D. For analyzing BAM-10, AT100 TAU231, and propionate concentration in feces we used an un-paired t-test. To assess body weight changes we used a two-way repeated measures analysis of variance (ANOVA) followed by Bonferroni’s post-hoc test. One-way ANOVA followed by Holm-Sidak post-hoc test was used for T-maze data, and Tukey’s test for the rest of the analysis (GFAP, iba1, SIRT1, SIRT1 in GFAP, GluR-1, PSD-95, Arc, synaptophysin, pGSK-3β/GSK-3β, pAMPK/AMPK, microbiota, propionate level and FFAR3 in brain and LPS levels) as recommended by the Software (GraphPad v.6). All results were considered statistically significant at p < 0.05.
RESULTS
Body weight and behavior
We observed that TG groups had significantly higher body weight compared to WT mice (Fig. 1A). However, BF ingestion by TG mice did not modify food intake, nor weight gain with respect to the control group. Body weight changes in TG mice have been associated with glucose intolerance [57, 58].
Spatial and working memory were assessed using a T-maze test (Fig. 1B). Percentage of spontaneous alterations decreased in TG-AIN compared to WT-AIN mice, but BF ingestion for 7 months significantly improved cognition in TG-BF mice (Fig. 1B).
Amyloid-β
We analyzed Aβ load using BAM-10 antibody. At 9 months of age, only a few amyloid plaques were observed in the subiculum of 3xTg-AD mice. We did not detect a significant effect of BF on the number of plaques in TG mice (Fig. 2A, B). However, intracellular Aβ was readily identified in neurons from the hippocampal region and Ent.cx. No significant differences in the degree of intracellular Aβ aggregation were detected in the CA1 subfield of the hippocampus as a function of diet. In Ent. cx, however, TG-BF mice had fewer aggregates than the TG-AIN group (p < 0.001) (Fig. 2A, B).
Tau phosphorylation
Tau pathology was analyzed by immunohistochemistry (AT100) and immunoblot (TAUp231). AT100 staining in the pyramidal layer of the CA1 region decreased in TG-BF compared to TG-AIN mice (Fig. 3A, B). Moreover, protein levels of p-TAU231/TAU in the cortex correlated to those changes as p-TAU231 decreased significantly in TG-BF compared to TG-AIN mice, resulting in a lower p-TAU231/TAU ratio in TG-BF mice (Fig. 3C).
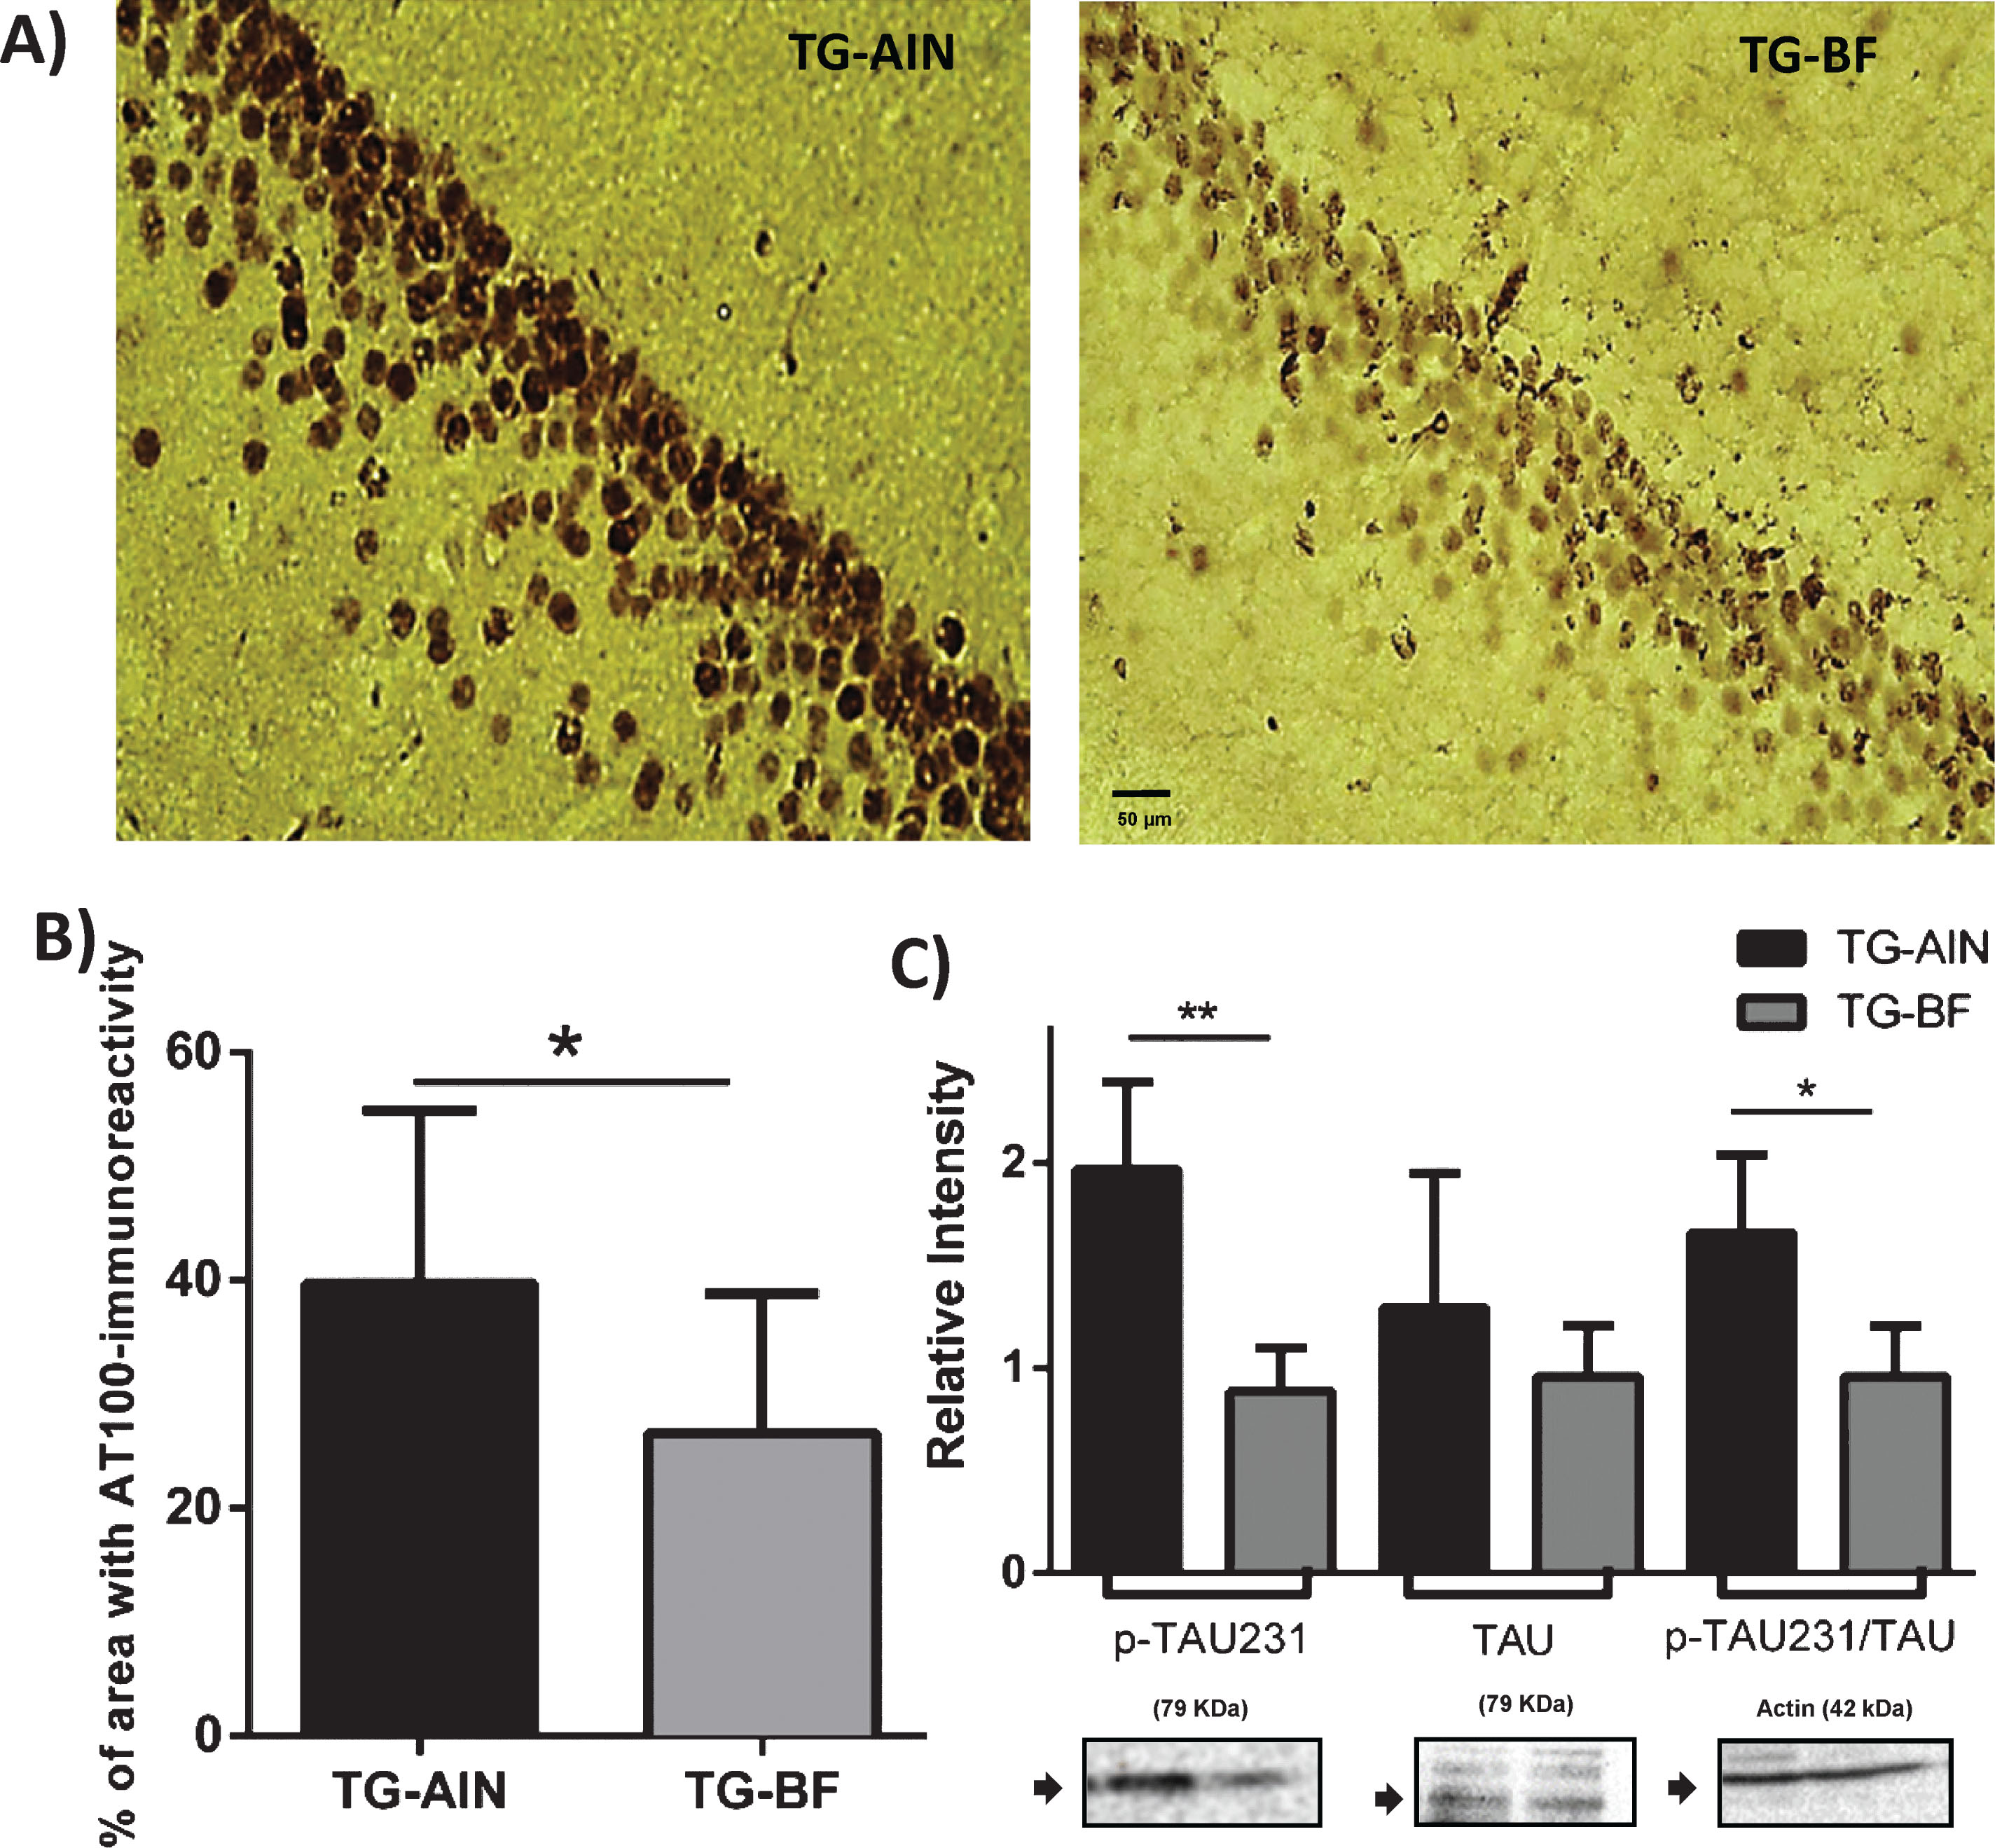
Tau hyperphosphorylation in TG mice. A) Representative photomicrographs of AT100 staining in CA1 hippocampal region. B) Quantification of AT100 indicates a reduction in the percentage of area occupied by tau aggregates in TG-BF mice compared to TG-AIN (p < 0.05). C) Western blot analysis of brain cortex corroborates that tau hyperphosphorylation (p-TAU231) decreased in TG-BF mice compared to TG-AIN (p < 0.01). Blot were normalized with α-actin. Images below graphs are representative blots for each protein done by quadruplicate in pool samples. Scale bar 50μm. N = 5 for each group. Data represents mean±S.D. *p < 0.05, **p < 0.01.
Inflammation
Glial cells were labeled with iba1 and GFAP antibodies. We classified the microglia phenotype as inactive or active, according to previous reports [50, 51]. Representative images of the microglia are shown in Fig. 4A. The quantification of microglia in st. radiatum showed more activated cells in TG-AIN compared to WT-AIN mice, while the inclusion of BF abated those increases. The number of inactive microglia did not differ between any of the three groups (Fig. 4B, left panel). Astrocytes labeled with GFAP were quantified in hippocampus (st. radiatum and st. oriens) and in Ent.cx; representative images are shown in Fig. 4A. We observed that TG-AIN mice had more GFAP + astrocytes in both strata and Ent. cx compared to WT-AIN mice. Contrastingly, the ingestion of BF resulted in a lower number of astrocytes in both strata from hippocampus, but there was not a significant recovery in Ent. cx in TG-BF mice (Fig. 4B, right panel).
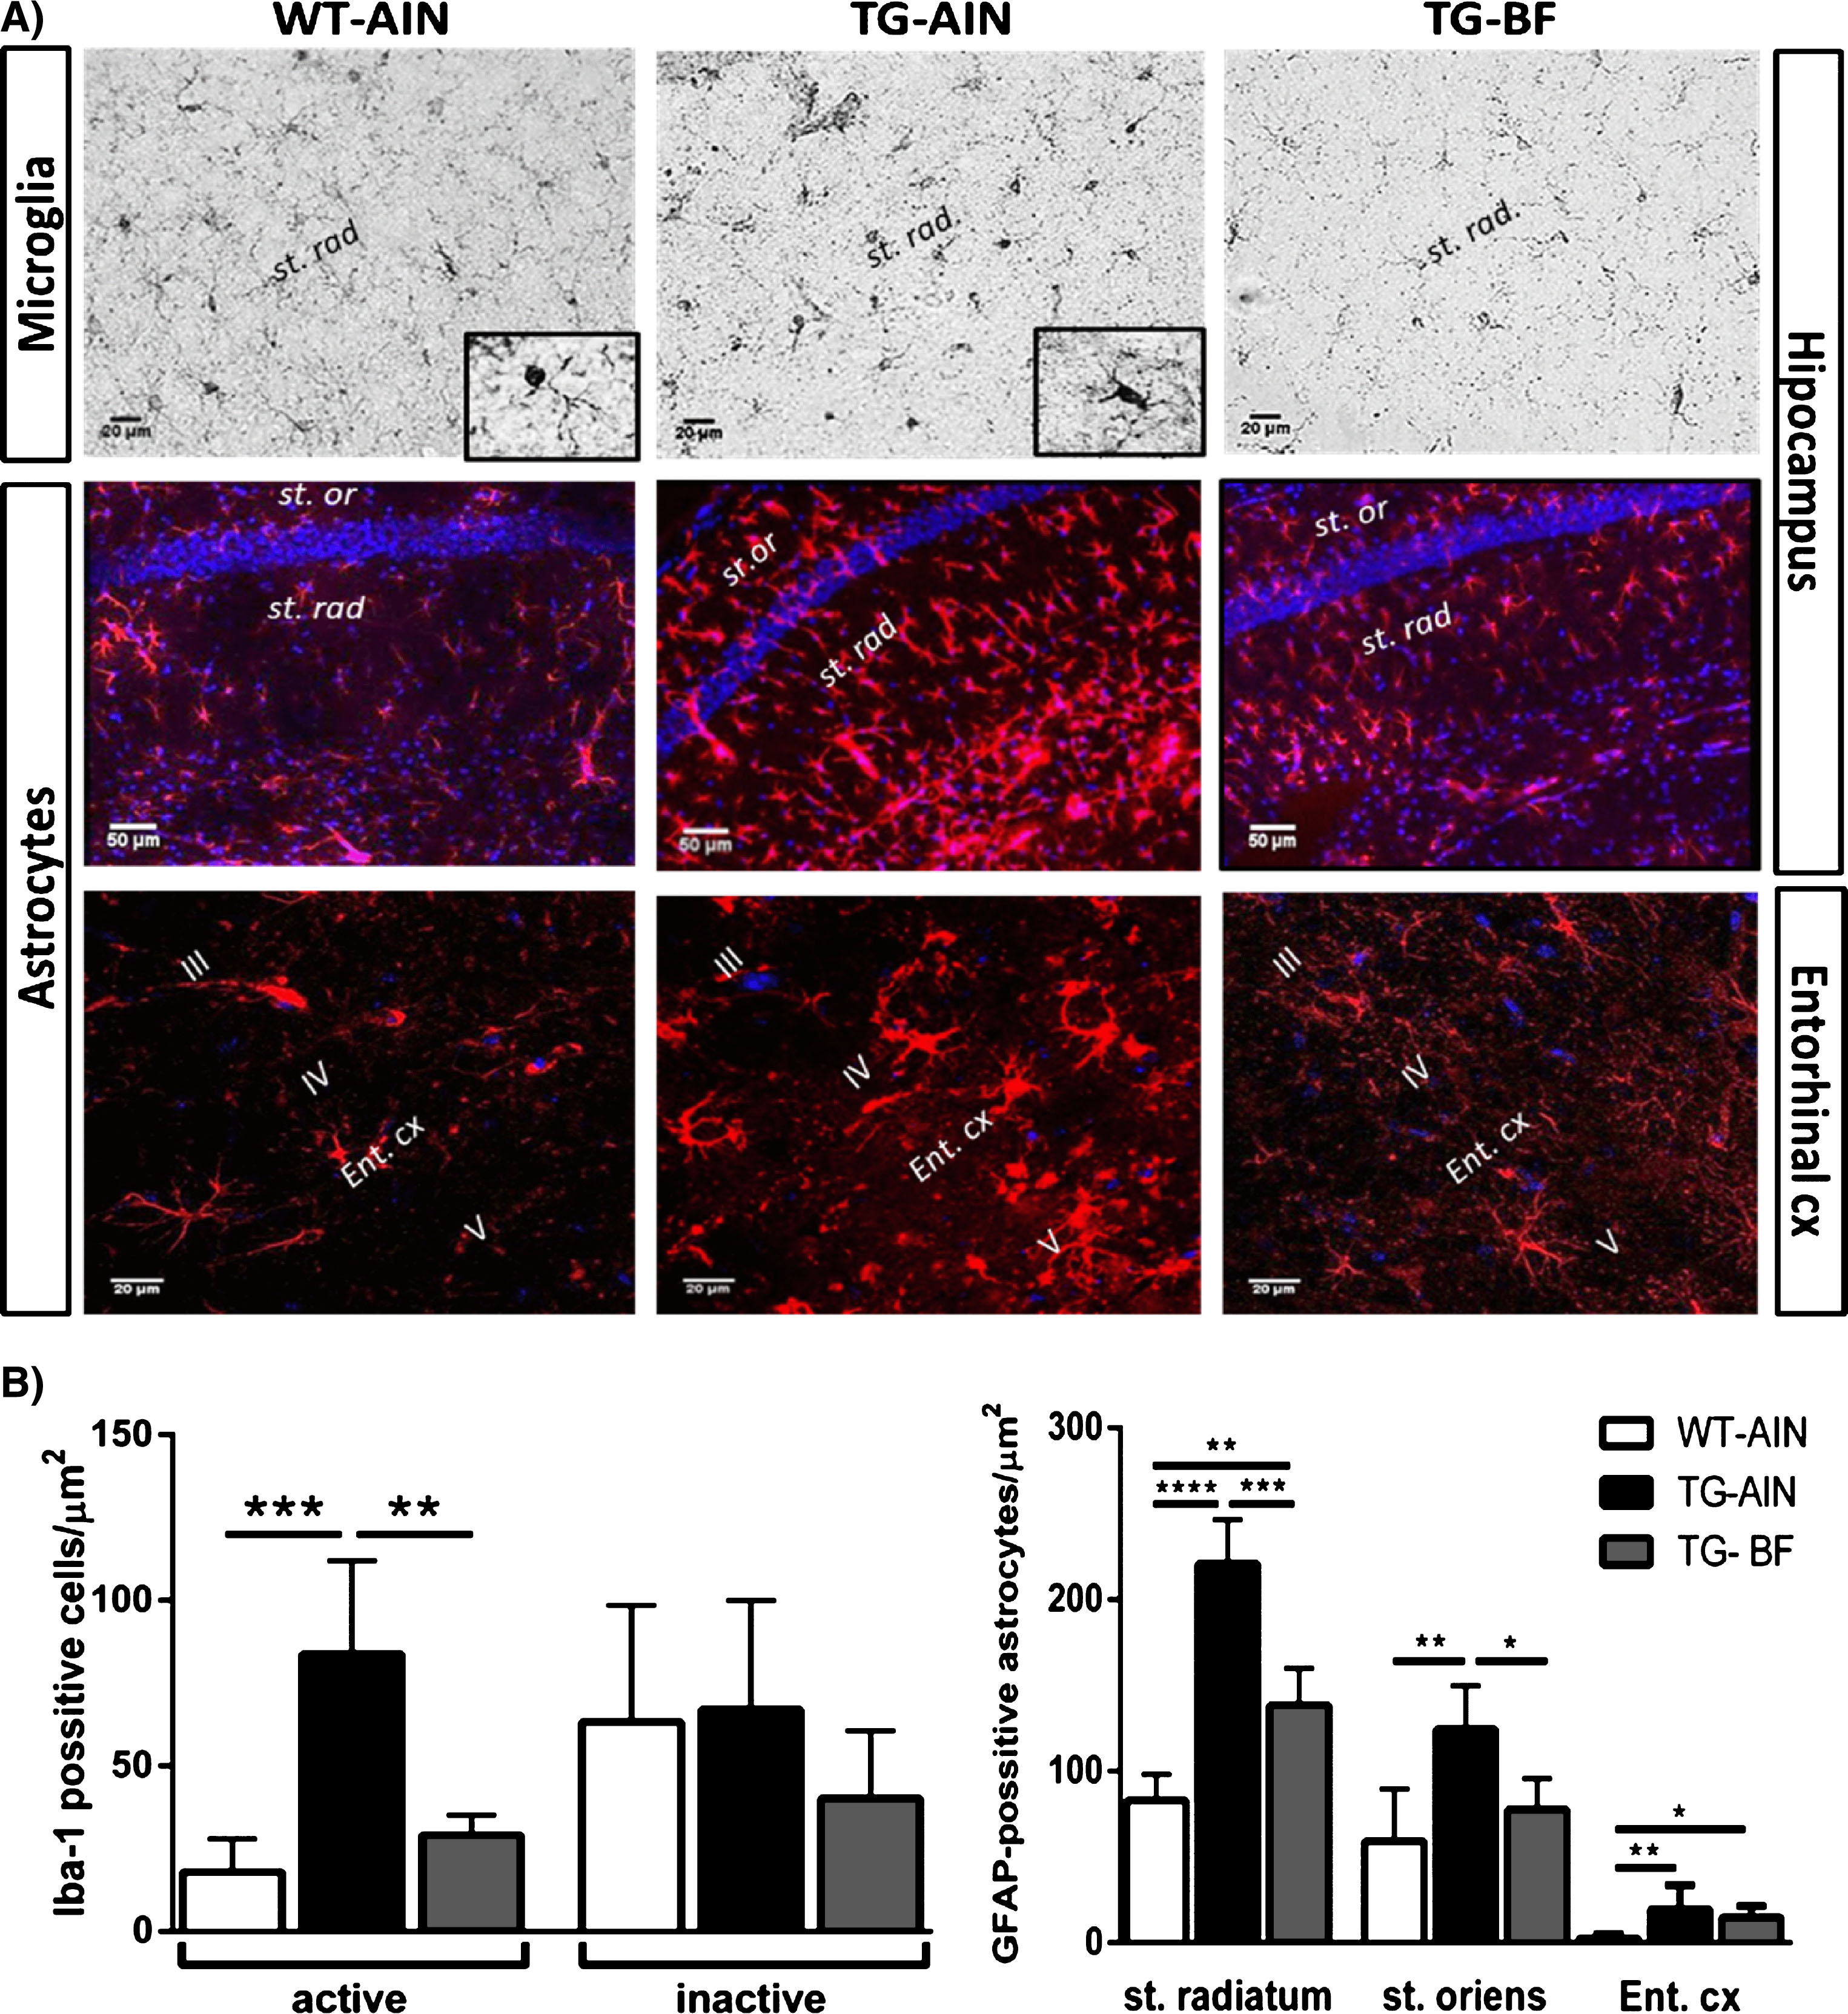
Effect of BF on neuroinflammation in 3xTg-AD mice. A) Representative images of microglia labeled with iba1 in st. radiatum of CA1 hippocampal region (scale bar 20μl), and reactive astrocytes labeled with GFAP in st. radiatum, st. oriens (scale bar 50μl) and Ent. cx (scale bar 20μm). Iba+cells in WT-AIN mice presented mainly an inactive phenotype (insert, WT-AIN), while in TG-AIN mice, abundant activated microglia was detected (insert, TG-AIN). B) Left panel: Quantification of microglia cells in st. radiatum showed an increased number of activated microglia in TG-AIN compared to WT-AIN mice, while TG-BF mice showed similar values as controls (p < 0.001 and p < 0.01, respectively). Number of inactive microglia did not showed differences between groups. Right panel: GFAP + astrocytes increased in st. radiatum, st. oriens and Ent. cx in TG-AIN compared to WT-AIN mice (p < 0.0001, p < 0.01, p < 0.01, respectively), while TG-BF mice had a reduced number of astrocytes in st. radiatum and st. oriens (p < 0.001 and p < 0.05). Note that more active astrocytes were observed in st. radiatum compared to st. oriens in TG-AIN mice. In Ent cx there was a slight recovery in TG-BF compared to TG-AIN as number of astrocytes was not so abundant compared to WT-AIN (p < 0.05), but it did not reach significance. Data represents mean ± SD. N = 5 for each group. *p < 0.05, **p < 0.01, ***p < 0.001, ****p < 0.0001.
Metabolic and synaptic proteins
To evaluate if the anti-inflammatory effect of BF could be associated with changes in cellular metabolism, we analyzed SIRT1, GSK-3β, and AMPK proteins in brain tissue. We evaluated the immunoreactivity against SIRT1 in st. radiatum and st. oriens (Fig. 5). In st. radiatum, a layer with an increased number astrocytes and microglia cells, SIRT1 was higher in TG-AIN mice compared to WT-AIN mice, while the TG-BF group showed decreased values compared to TG-AIN (Fig. 5B, right panel). No differences were observed in st. oriens (Fig. 5B, right panel). To evaluate whether the SIRT1 levels in st. radiatum were associated with the increased number of astrocytes in the same layer, double immunofluorescence (SIRT1 and GFAP) was applied. We observed that nucleus of GFAP+astrocytes had increased SIRT1 labeling in TG-AIN mice compared to WT-AIN and TG-BF mice. SIRT1 in the nucleus of GFAP + cells decreased in TG-BF compared to TG-AIN mice, but it did not reach WT values (Fig. 6).

Effect of bioactive food on hippocampal SIRT1 were region specific. A) Representative images of SIRT1 labeling in st. radiatum and st. oriens. Scale bar 20μm. B) Quantification of SIRT labeling in both strata. In st. radiatum, TG-AIN mice had a greater number of SIRT1 particles compared to WT-AIN (p < 0.01) and TG-BF (p < 0.05). No differences between groups were observed in st. oriens. Data are expressed as the mean±S.D. N = 5 per group. *p < 0.05, **p < 0.01

Effect of bioactive food on SIRT1 in GFAP+ astrocytes. A) Representative images of GFAP+ astrocytes (red) located in str. radiatum of CA1 hippocampal region co-labeled with SIRT1 (green), and counterstained with DAPI (blue). Scale bar 20μm. B) Magnification of an astrocyte where nucleus was selected to analyze SIRT1 particle intensity. Scale bar 5μm. C) Quantification of SIRT1 in nucleus of astrocytes indicates that TG-AIN mice had more SIRT1 than WT-AIN (p < 0.0001) and TG-BF mice (p < 0.05). Moreover, TG-BF mice showed increase SIRT1 compared to WT-AIN (p < 0.05). Data are expressed as the mean ± SD. N = 5 per group. *p < 0.05, ****p < 0.0001.
We analyzed GluR-1 (an integral membrane protein belonging to the glutamate-gated ion channel family), PSD-95 (Post-synaptic density protein 95), Arc (Activity-regulated cytoskeleton-associated protein), and pre-synaptic synaptophysin protein levels in brain cortex. We observed that TG-AIN mice had more GluR-1, PSD-95, and Arc when compared to WT-AIN mice, indicating synaptic hyperactivity. Synaptophysin levels were lower in TG-BF compared to WT-AIN and TG-AIN mice (p < 0.01, both). TG-BF mice showed significant decreases in all those synaptic proteins (GluR-1, PSD-95, Arc and synaptophysin) compared to TG-AIN mice (Fig. 7A, B).
We also evaluated GSK-3β and p-GSK-3β protein content in the brain cortex by western blot. We observed that BF ingestion induced a significant increase in p-GSK-3β compared to WT-AIN and TG-AIN, with no changes in total GSK-3β. Therefore, the ratio p-GSK-3β/GSK-3β increased in TG-BF mice compared to the other groups (Fig. 8A). We also observed a decrease in p-AMPK in TG-BF compared to WT-AIN and TG-AIN, while the total AMPK increased in TG-AIN compared to WT-AIN. Therefore, the ratio pAMPK/AMPK decreased in TG-AIN and TG-BF compared to WT-AIN (Fig. 8B).

Immunoblots of synaptic proteins. PSD95, synaptophysin, GluR-1, and Arc protein levels were evaluated in brain cortex. A) PSD95 levels were higher in TG-AIN compared to WT-AIN and TG-BF mice (p < 0.05 and p < 0.0001, respectively), while in TG-BF mice PSD95 levels were even lower than WT-AIN (p < 0.01). Synaptophysin levels were lower in TG-BF compared to WT-AIN and TG-AIN mice (p < 0.01, both). B) GluR-1 levels were higher in TG-AIN compared to WT-AIN and TG-BF (p < 0.001, both), while content of Arc protein was higher in TG-AIN mice compared to WT-AIN (p < 0.01) and TG-BF (p < 0.0001), but in TG-BF there were lower values compared to WT-AIN (p < 0.0001). Images below graphs are representative blots for each protein done eight (PSD95), four (Arc and GluR-1) or five (synaptophysin) times, in pool samples. Data represents mean±S.D. *p < 0.05; **p < 0.01, ***p < 0.001; ****p < 0.0001.
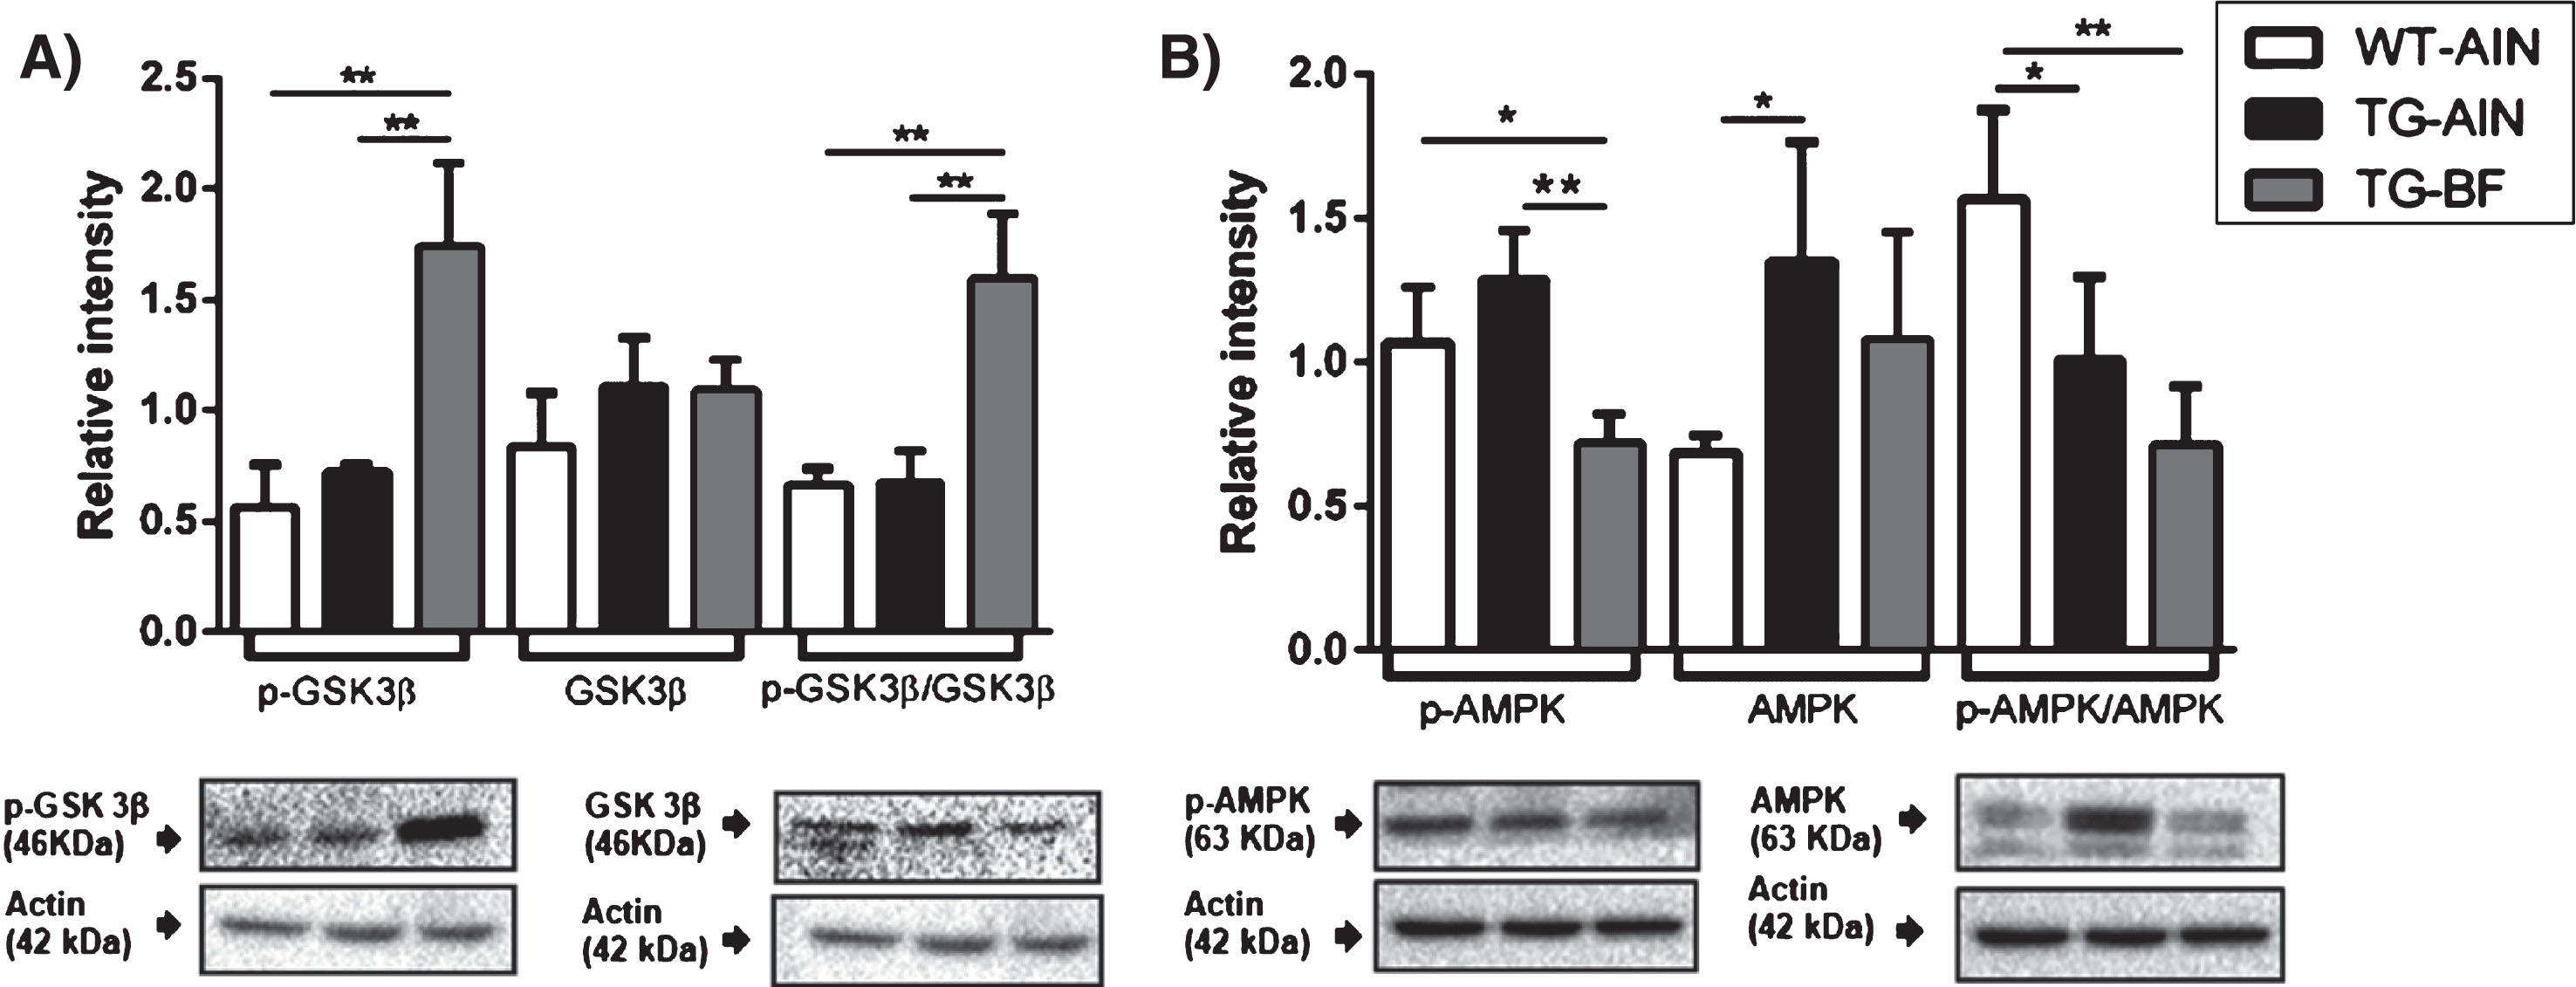
Protein levels of pGSK-3β/GSK-3β and pAMPK/AMPK in
Gut microbiota
We analyzed the microbiota composition and diversity in feces of TG and WT mice. The alpha diversity was estimated by observed Shannon indexes. The WT-AIN group showed the highest diversity followed by TG-BF, whereas the TG-AIN group had the lowest bacterial diversity (Fig. 9A). Clustering the bacterial communities using principal component analysis (PCoA) revealed that GM in TG-AIN and TG-BF was different from WT-AIN (Fig. 9B).

Gut microbiota modifications. A) Alpha diversity by Shannon Index in the three groups studied showed statistical differences between WT-AIN and TG-AIN mice, and between TG-AIN and TG-BF mice (all, p < 0.0001). B) Principal components analysis (PCoA) of unweighted (left) and weighted variables (right) by ANOSIM: unweighted: R = 0.8836, p < 0.001; weighted: R = 0.8326, p = 0.001. WT-AIN, n = 6; TG-AIN n = 7; TG-BF, n = 7.
At the phylum level, TG-AIN showed increased abundance of Bacteroidedetes (p < 0.01) and Firmicutes (p < 0.01), but a decreased abundance of Cyanobacteria (p < 0.0001), Deferibacteres (p < 0.0001), Proteobacteria (p < 0.01), TM7(p< 0.0001), Tenericutes (p < 0.0001), Verrucomicrobia (p < 0.0001) compared to WT-AIN mice (Fig. 10A).
After ingestion of BF, TG mice presented an increased relative abundance of Actinobacteria (p < 0.05), Bacteroidedetes (p < 0.01), but decreased abundance of Cyanobacteria (p < 0.0001), Deferibacteres (p < 0.0001), Proteobacteria (p < 0.001), TM7 (p < 0.0001), Tenericutes (p < 0.0001), Verrucomicrobia (p < 0.0001) compared to WT-AIN mice (Fig. 10A), and increase abundance of Tenericutes (p < 0.05) and Verrucomicrobia (p < 0.0001) compared to TG-AIN mice (Fig. 10A). Accordingly, there were microbial alterations at the class, order, family, and genus level (Supplementary Figures 2–5, Supplementary Table 1). At species level, there were important phenotype differences as TG-AIN presented more relative abundance of Prevotella copri, Lactobacillus ruminis, Streptococcus anginosus, Actinobacillus parahaemolyticus, and Haemophilus parainfluenzae compared to WT-AIN mice. Ingestion of BF reduced the abundance of all those bacteria in TG mice. Furthermore, BF ingestion increased the relative abundance of Bacteroides uniformis, Faecalibacterium prausnitzii, and Akkermansia miciniphila in TG mice compared to TG-AIN group (see Fig. 10B and Table 3).
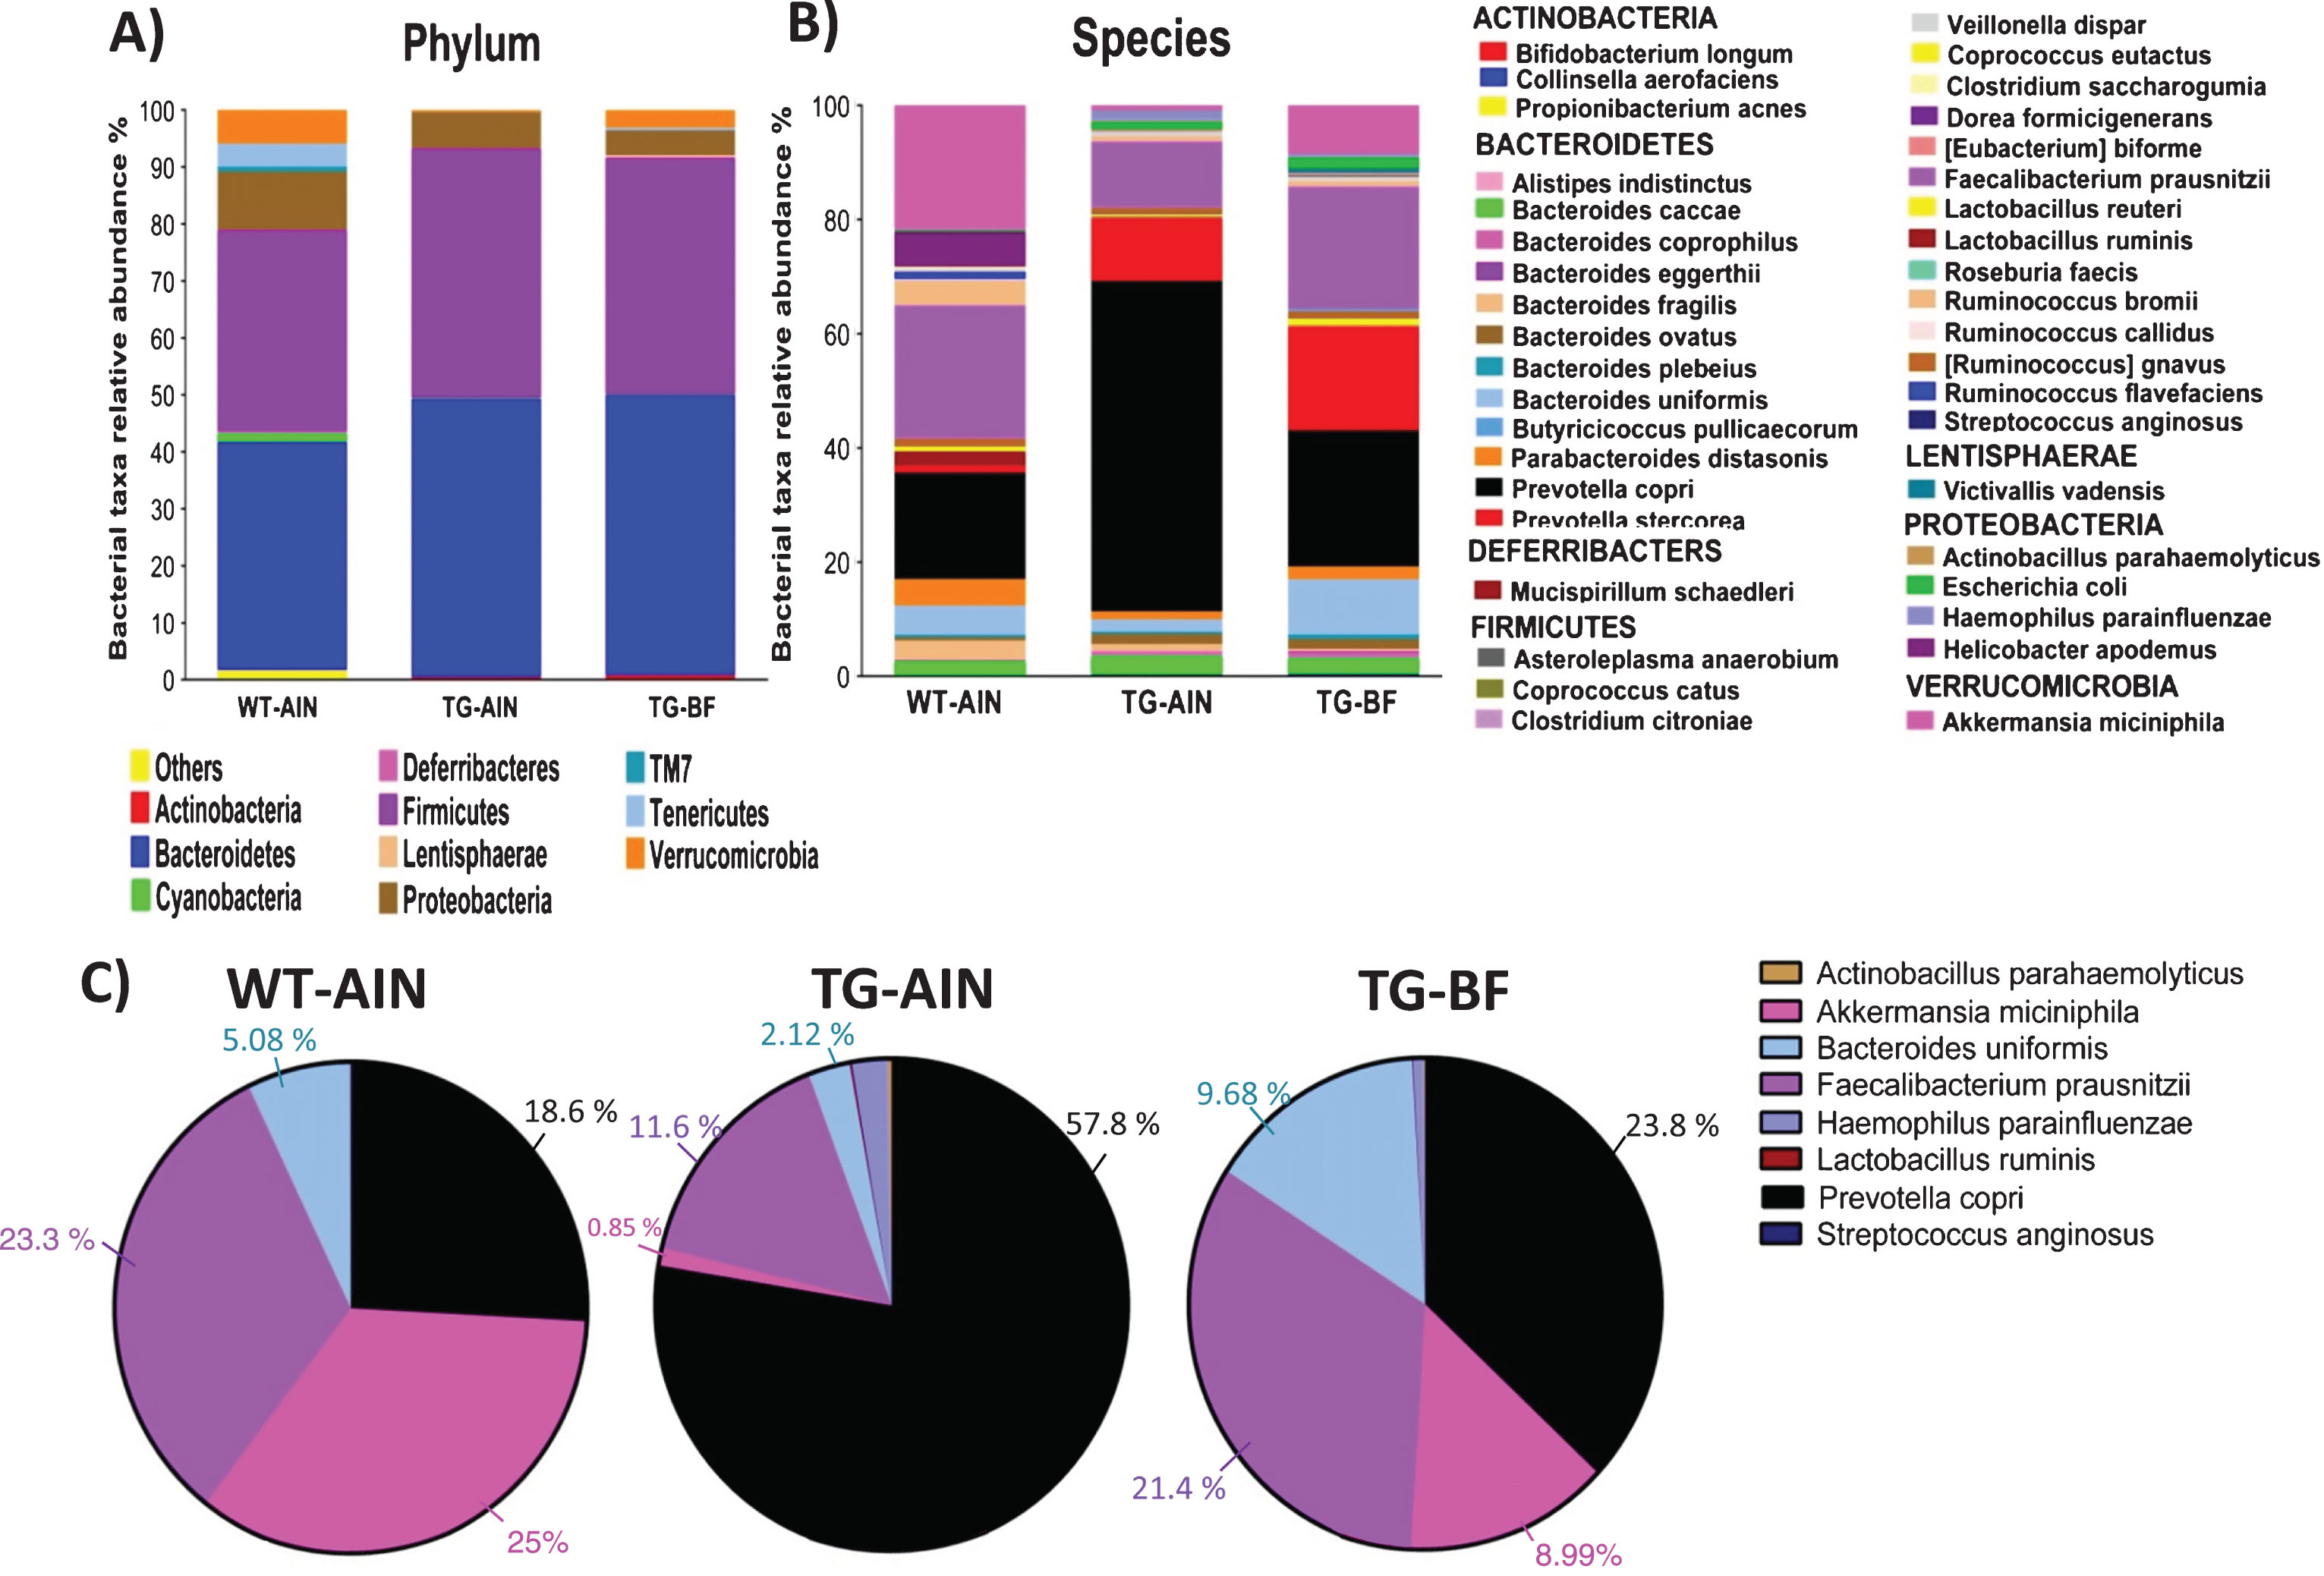
Gut microbiota modifications in transgenic mice, and its restoration by BF ingestion. (A) Relative abundance of bacteria at the phylum level in all the groups (significant differences are described in the main text). (B) Relative abundance of bacteria at the species levels. C) Pie chart of main bacterial species that showed significant changes between WT-AIN and TG-AIN compared to TG-BF mice. Relative abundances (%) are represented in the figure according to the color code of each species. Statistical differences can be found in Table 3. WT-AIN, n = 6; TG-AIN n = 7; TG-BF, n = 7.
Taxonomic classification of pyrosequences from bacterial communities at the species level
Significances between WT-AIN vs TG-AIN are reported with hashes (#); WT-AIN vs TG-BF are reported with crosses (+), TG-AIN vs TG-BF are reported asterisks (*). Data represents mean ± S.E.M. one symbol, p < 0.05; two symbols, p < 0.01; three symbols, p < 0.001; four symbols, p <0.0001. WT-AIN, n = 6; TG-AIN n = 7; TG-BF, n = 7.
Those GM alterations in TG-mice, prompted us to evaluate the levels of LPS in plasma samples. In addition, due to the dramatic increase in Prevotella copri in TG-AIN mice, bacteria known as propionate producers, were evaluated propionate content and its SCFA receptor (FFAR3) in brain tissue.
Propionate level and FFAR3 in brain
The PFC is an area related to T-maze working memory performance, and we have observed working memory impairment in TG mice. Therefore, we evaluated the levels of propionate in this brain region. Propionate content was larger in TG-AIN mice compared to WT-AIN and TG-BF mice in PFC (Fig. 11A). We also quantified SCFA receptor FFAR3/GPR41 in the cortex. FFAR3 has a high affinity for propionate and was more abundant in TG-AIN mice compared to WT-AIN mice, whereas BF ingestion decreased those values in TG mice (Fig. 11B).
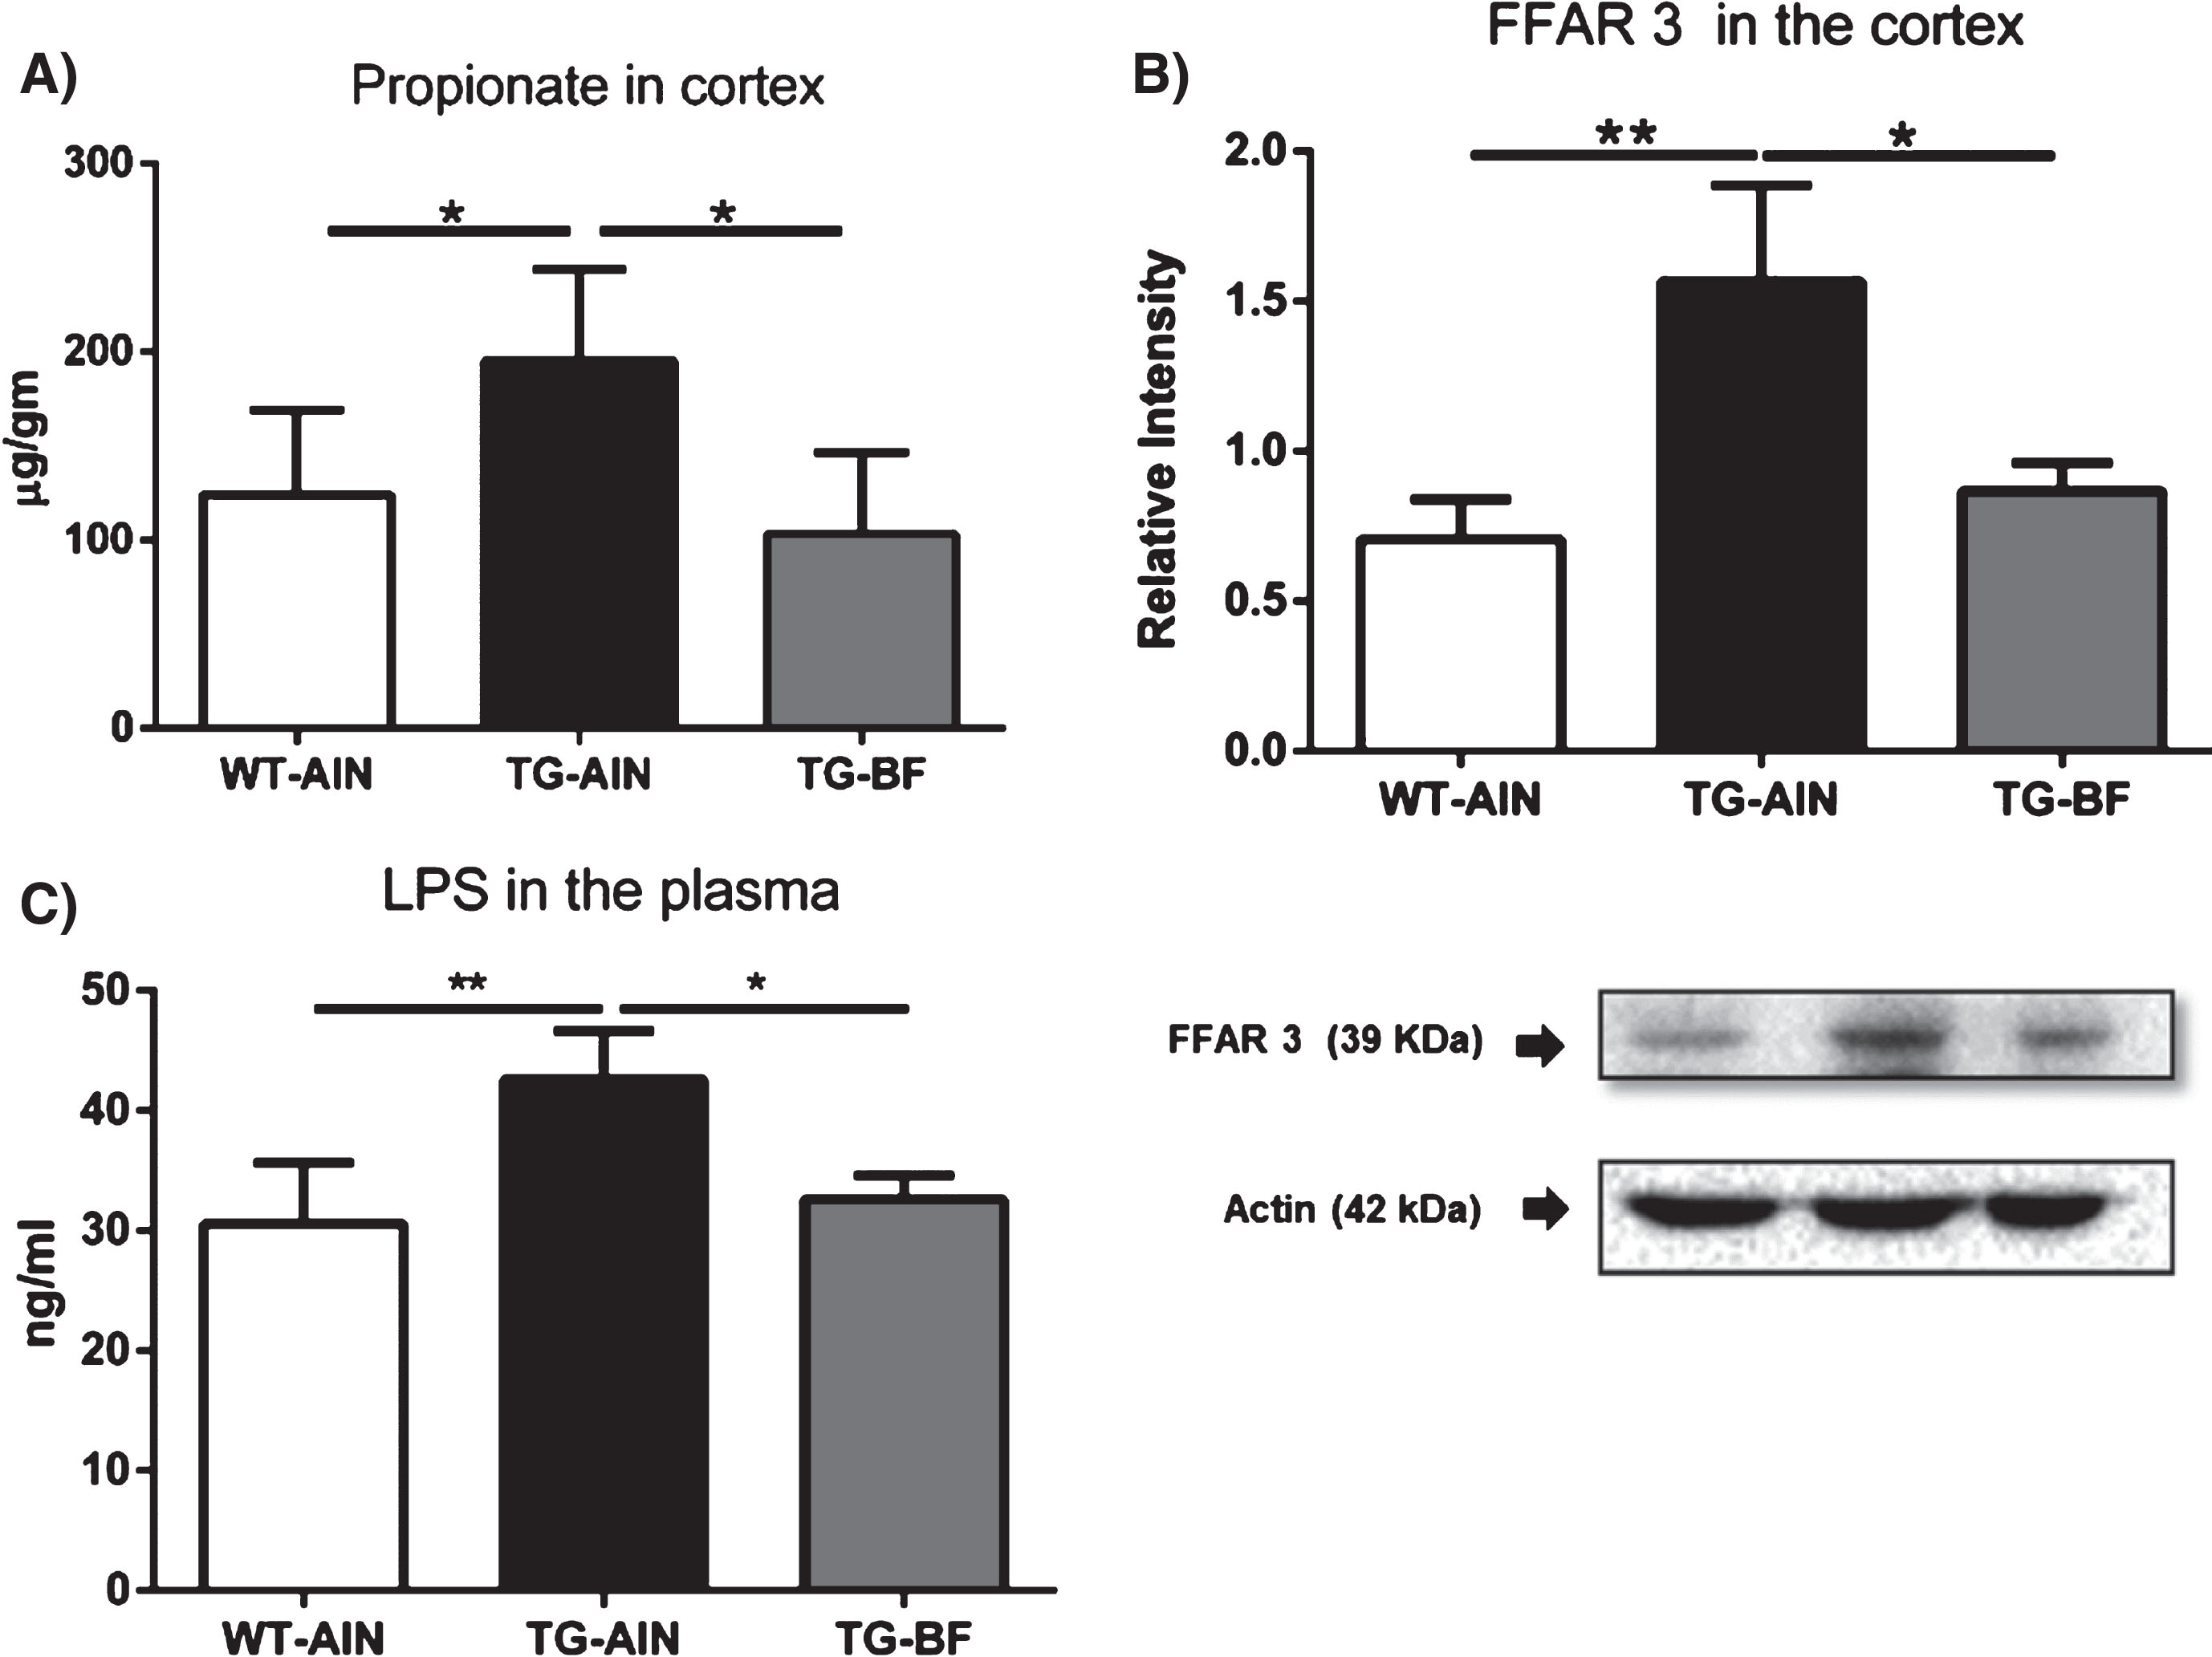
Bacterial products in brain and plasma samples. A) Propionate levels in PFC were higher in TG-AIN compared to WT-AIN mice (p < 0.05) and ingestion of BF reduced those levels (p < 0.05). WT-AIN, n = 7; TG-AIN, n = 6; TG-BF, n = 7. B) FFAR3 receptor levels were higher in TG-AIN mice compared to WT-AIN and TG-BF mice (p < 0.01 and p < 0.05, respectively). C) LPS plasma levels were higher in TG-AIN compared to WT-AIN and TG-BF mice (p < 0.01 and p < 0.05, respectively). WT-AIN, n = 4; TG-AIN, n = 3; TG-BF, n = 5. Images below graphs are representative blots for each protein done by quadruplicated in pool samples. Data represents mean±S.D. *p < 0.05; **p < 0.01.
Lipopolysaccharide levels in plasma
LPS levels in plasma were larger in TG-AIN compared to WT-AIN mice (p < 0.01), while BF ingestion led to a lower LPS concentration in TG mice (p < 0.05) (Fig. 11C).
Levels of short-chain fatty acids in feces of TG at different ages
Acetate, butyrate, and propionate are the most abundant SCFAs produced by GM [59]. We observed an increase in propionate producing bacteria in TG-AIN mice compared to WT-AIN mice, an effect accompanied by increased propionate in brain tissue. Propionate is a potent neurotoxic agent. Then, we sought to evaluate whether propionate levels increased in an age-dependent manner according to the progression of the pathology. SCFAs levels (acetate, butyrate, and propionate) were measured in feces from WT and TG mice along the ontogeny (3-, 6-, and 11-month-old). In WT mice, total SCFA concentration decreased at 6 and 11 months of age in comparison to 3 months of age (both, p < 0.05), whereas in TG mice the total SCFA concentration had a age delay, as it decreased only in 11-month-old mice compared to 3- and 6-month-old mice (both, p < 0.01). Regarding acetate concentration in WT, we observed an increase in 11-month-old mice compared to the 6-month-old group (p < 0.05). No changes in acetate concentration were observed in TG mice. Butyrate in WT mice decreased at 6 and 11 months of age in comparison to 3-month-old animals (p < 0.05 and p < 0.01, respectively). Notably, in TG mice, the decrease in butyrate was not as early as in WT, since differences were observed between 11- and 6-month-old mice versus the 3-month-old group (p < 0.05 and p < 0.01, respectively). Regarding the genotype effect, we observed that propionate concentration increased in TG compared to WT mice at 6 months of age (p < 0.05) (Table 4).
Levels of short-chain fatty acids in feces of TG at different ages
In WT mice, total SCFA concentration decreased at 6 and 11 months of age in comparison to 3 months of age (both a > b, p < 0.05), whereas in TG mice the total SCFA concentration decreased at 11 months of age compared to 3- and 6-month-old mice (both a > b, p < 0.01). Acetate concentration increased in WT mice at 11 months of age compared to 6 months of age (a > b, p < 0.05). Butyrate decreased in WT mice at 6 and 11months in comparison to 3 months (a > b, p < 0.05, and a > c, p < 0.01). In TG mice, butyrate decreased at 11 months in comparison to 3 months and 6 months (a > b, 3 months versus 11 months, by p < 0.05; 6 months versus 11 months, p < 0.01). Regarding genotype effect, we observed that propionate concentration increased in TG compared to WT mice at 6 months of age (*p < 0.05). WT, n = 3 each age; TG, n = 4 each age. Data represents mean±S.EM.
DISCUSSION
In this study, we demonstrated that the ingestion of BF diminished the main pathological markers of AD, amyloid aggregates and hyperphosphorylation of tau, in TG female mice. BF also diminished neuroinflammation and synaptic and metabolic alterations, and improved working memory in TG-BF compared to TG-AIN mice, effects associated with the reduction in pro-inflammatory gut bacteria and their products.
We used female 3xTg-AD mice as recent evidence indicates that women are at greater risk for developing the disease [60], and female TG mice have more severe pathology compared to males [61–63]. Therefore, we aimed to evaluate the effects of BF on the more vulnerable gender. We concluded seven months of dietary treatment when female TG were 9 months old, an age where they show neurogenic and neuroplastic deficits resulting in cognitive decline [63–66]. However, at 9 months of age, the pathological hallmarks and cognitive impairment were moderately present in our 3xTg-AD strain [67]. Therefore, we assessed other markers which appear since early stages of the disease.
Mitochondrial dysfunction and enhanced oxidative stress are factors leading to AD pathology [68, 69]. Increased production of reactive oxygen species is associated with age- and disease-dependent loss of mitochondrial function and reduced antioxidant defense system [70]. Lipid peroxidation refers to the process in which lipids are attacked by reactive oxygen species [68]. The BF used in this study showed a stronger antioxidant activity versus AIN93 as assessed by the ORAC method (Table 1). Furthermore, in TG mouse cortex we detected higher MDA level, a lipid peroxidation product, but BF ingestion reduced MDA levels to WT values (Supplementary Figure 1). Thus, the beneficial effects of BF may be partially mediated by its potent anti-oxidant effect.
Neuroinflammation can both be a cause, and a consequence of chronic oxidative stress, and the abnormal production of pro-inflammatory cytokines and reactive oxygen and nitrogen species by active glia cells can cause synaptic dysfunction [70]. Synaptic hyperexcitability and metabolic alterations have been reported in young 3xTg-AD model [71–73]. Astrocytes and neurons interact actively, with astrocytes supporting neuronal metabolic requirements and clearing the excess glutamate (Glu) from extracellular space to prevent neuronal excitotoxicity [74]. In 3xTg-AD mice there is strong astrogliosis [75] and at 7 months of age they present an impaired astrocytic support system to fulfill the neuronal metabolic demands [76]. Glu is the predominant excitatory neurotransmitter in adult mammalian brain, and in excess it can cause neuronal hyperexcitability [77]. When astrocytes are chronically activated they have impairment in Glu uptake, as the glutamate-glutamine (Glu-Gln) shuttle becomes compromised [78]. This impaired Glu-Gln shuttle results in increased Glu levels in the synaptic cleft [79], related to hyperactivity of neighboring neurons [80, 81]. Different TG mice strains [53, 82], including 3xTg-AD [83], are characterized by pro-convulsive seizures and neuronal circuit hyperexcitability since early stages of the disease. Increased neuronal firing [72, 80], and faster release of Glu into the synaptic cleft [76] is associated with increase in Arc and PSD95 post-synaptic proteins in young TG mice [53, 82]. In our present study, we also observed increased number of active astrocytes, an event accompanied by enhanced Arc and PSD95 levels in cortex of TG-AIN compared to WT-AIN mice. These data may indicate a state of neuronal over-excitation in TG mice, probably caused by impaired astrocytic function. Importantly, ingestion of BF was able to abate those synaptic alterations in hippocampus and cortex.
AD is also characterized by an early hypometabolic brain phenotype, resulting in an impaired brain bioenergetics [84, 85]. SIRT1 is consider a regulator of mitochondria biogenesis [86] by regulating peroxisome proliferator-activated receptor γ co-activator 1α (PGC-1α), that represents an upstream inducer of genes of mitochondrial metabolism [87]. We measured SIRT1 immunoreactivity in different regions of the hippocampus, and observed stratum-specific alteration in TG mice. There was a decreased SIRT1 immunoreactivity in pyramidal layer (data not shown), and an increased SIRT1 immunoreactivity in st. radiatum but not in st. oriens. In the former one, there were a greater number of active astrocytes in TG-AIN compared to WT-AIN mice. We assessed the content of SIRT1 in those astrocytes, and found that in TG-AIN mice active astrocytes present increased SIRT1 levels compared to WT-AIN. SIRT1 has been mostly associated with beneficial effects, as improved cognition and neuronal plasticity [88]; however, less is known about its role in astrocytes. Previous reports indicate that promoting mitochondrial biogenesis—rather than glycolysis—in astrocytes helps to protect them from Aβ1 - 42 toxic effects [89]. Moreover, upregulation of SIRT1 attenuates oxidative stress in astrocytes via upregulation of superoxide dismutase 2 and catalase [90], whereas LPS and interferon-γ induced activation of astrocytes results in increased mitochondrial biogenesis [91]. In our current study we detected significant increases of LPS in plasma of TG-AIN mice, while BF inclusion reduced LPS levels. This body of data may suggest that enhanced SIRT1 reflects a preferential oxidative metabolism in astrocytes in order to protect them from harmful agents (i.e., Aβ, LPS), while BF was able to abate those alterations.
We also measured GSK3β protein levels. GSK3β regulates mitochondrial energy metabolism in neurons and in glia. Activation of GSK3β also promotes tau hyperphosphorylation, neurofibrillary tangles, and amyloid plaques [92, 93]. Whereas, GSK3β inhibition (pGSK3β form) attenuates the production of pro-inflammatory cytokines (IL-1β and TNF-α) and augments the production of anti-inflammatory cytokines (IL-10) in vitro. Here, we observed that p-GSK3β levels were dramatically increased in TG-BF mice after ingestion of BF. This enhanced p-GSK3β could be associated with reduced tau hyperphosphorylation in hippocampus and cortex, reduced neuroinflammation and oxidative damage (MDA) in TG-BF mice.
The BF used in our study was composed of nopal, soy protein, chia seed, and turmeric. We have used a combination of several foods because it has been shown that it offer a better cognitive outcome in AD patients in comparison to individual formulations [95], as they create a synergistic effect [96, 97]. Nopal (Opuntia ficus) is a potent antioxidant food able to increase anti-oxidant activity in plasma of healthy subjects [98]. In addition, nopal cladodes are rich in soluble and insoluble fiber [14], fermentation substrates for GM. We have reported that nopal ingestion not only reduced neuroinflammation but was able to restore GM dysbiosis in obese rats [15]. Thus, nopal can be considered a BF with potent modulatory GM effects. We also included soy (Glycine max). Soy has the ability to reduce homocysteine levels [99], associated with decrease neuroinflammation [100]. Soy also contains polyunsaturated fatty acids and isoflavones with neuroprotective actions, such as genistein [101]. Genistein is isoflavon present in soy, and we have recently demonstrate that genistein supplementation reduces microglia activation and improves cognition in obese mice [102]. BF also contained chia seed (Salvia hispanica), a seed rich in fiber and minerals, and constitutes a source of n-3 fatty acids [103]. It also contains various flavonoids that offer anti-inflammatory actions [104]. Finally, we included turmeric (Curcuma long) whose main components are curcuminoids. Turmeric has shown important beneficial effects in animal models of AD by inhibiting the generation and aggregation of Aβ [105, 106]. Curcumin administration cause an inhibition of GSK3β and reduces Aβ-induced and tau phosphorylation [107], improved mitochondrial metabolism and reduced oxidative stress [108]. Therefore, a combination of these foods may have impact AD hallmarks by its individual components, but also by a synergistic effect under different mechanism.
Several clinical studies have highlighted the impact of a healthy diet against the onset of dementia [109–114]. However, it is not clear how the ingestion of certain foods can damper the onset of brain pathologies. GM composition is highly dependent on diet [15, 115] and recent data demonstrates an important role of GM on AD pathology [23, 42]. GM can influence host health [116] or alter behavior [117]. It is important to highlight the presence of pro-inflammatory bacteria and neurotoxins derived from bacterial membranes as LPS, in AD brains [18, 119]. Remarkably, in this study we also observed an increase in the relative abundance of pro-inflammatory bacteria (H. parainfluenza, L. ruminus, S. anginosus, H. parainfluenza, A. parahaemolyticus, P. copri) and decrease in anti-inflammatory related bacteria (A. muciniphila, B. uniformis, F. prausnitzii) in feces from TG-AIN compared to WT-AIN mice.
L. ruminis has stimulatory effects on the secretion of tumor necrosis factor (TNFα) [120], while S. anginosus cause brain abscesses, meningitis, cerebral venous system thrombophlebitis, intracranial arteritis, and inflammation [121]. Actinobacillus species are Gram-negative bacteria responsible for several disease conditions of animals [122] and H. parainfluenzae is considered as a gut pathogen associated with irritable bowel syndrome [123] and abundantly present in autistic children [124]. Furthermore, H. parainfluenzae has been reported to cause meningitis [125]. P. copri is a well-known propionate producing bacteria [126, 127]. Propionate is considered a potent neurotoxic agent that generates neuroinflammation [128–130]. It is known that genetic diseases that affect the function of the enzyme propionyl-CoA carboxylase (Propionic Acidemia), are characterized by high levels of propionate and high incidence of dementia [131]. Moreover, intraventricular infusions of propionate increased reactive astrogliosis and activate microglia [132], while the incubation of propionate in cultured astrocytes leads to morphological changes and phosphorylation of GFAP [128]. We observed higher propionate concentration in the brain tissue of TG-AIN compared to that of WT-AIN mice. This was consistent with the increase in the level of FFAR3/GPR41 in brain tissue, a receptor with a high affinity for propionate [133, 134]. Due to the dramatic increase in the relative abundance of P. copri in fecal samples and the propionate levels in brain of TG-AIN mice, we decided to determine if propionate was associated with the course of AD pathology. We measured SCFAs levels in fecal samples from 3-, 6-, and 9-month-old TG and WT mice. Overall, the total SCFA concentration decreased with aging in both WT and TG mice; however, this reduction was less pronounced in TG mice. At 6 months of age, propionate levels were higher in TG compared to WT mice. It has been reported that several bacterial fermentation products, such as acetate and propionate were higher in plasma and saliva of AD patients [135, 136], supporting our current results.
The GM analysis also indicated that TG-AIN presented a reduced relative abundance of beneficial bacteria, such as A. muciniphila, B. uniformis, and F. prausnitzii. The role of Akkermansia on the gut barrier has been reported, as its presence is associated with increased mucus layer thickness alleviating metabolic endotoxemia (systemic inflammation caused by bacterial associated components, such as LPS) [137]. Therefore, reductions in A. muciniphila in TG-AIN mice may lead to increased gut barrier leakage and free passage of LPS, whereas A. muciniphila relative abundance increased after BF ingestion, that could help to restore membrane permeability and reducing LPS passage to blood circulation. F. prausnitzii's anti-inflammatory actions has been associated with the expression of a potent Microbial Anti-inflammatory Molecule (MAM) [138, 139]. Therefore, all this data may indicate that TG-AIN mice lives under a predominant pro-inflammatory microbiome, supporting recent hypothesis of an infectious aetiology for AD [32–34, 140]. Remarkably, BF supplementation reduces the relative abundance of pro-inflammatory bacteria while increases the anti-inflammatory ones.
It is important to highlight that SCFAs are recognized metabolic substrates for colonocytes [141, 142], but also for glial cells, specifically astrocytes [143]. In astrocytes, propionate is taken up and metabolized by oxidative phosphorylation [143] increasing mitochondrial function [144]. We can propose that pro-inflammatory bacteria released substances causes on the one hand, LPS-induced immune activation of glia cells. On the other hand, uptake of propionate by astrocytes as energy source induces SIRT1 increase; both events, can be associated with an impaired Glu-Gln shuttle, resulting in synaptic dysfunction and memory impairments in TG mice. All those alterations were restored in TG mice after ingestion of BF during 7 months. Based on the present data, we propose that a dietary intervention at an early stage of AD pathology is an effective strategy to abate GM dysbiosis with pro-inflammatory profile, associated with amyloid pathology, metabolic, and synaptic alteration, resulting in a better cognitive outcome.
Footnotes
ACKNOWLEDGMENTS
We are thankful to Agilent technologies-Mexico for helping us with the GC/MSD system for SCFA analysis in the brain, especially to Q.F.B. Gelasio Pérez Valverde. We are thankful to CONACYT-Mexico for the financial support to Syeda, T (Scholarship no.339473) and Pinedo-Vargas L. (Scolarship no. 621862) and UNAM-PAPIIT- IN203616 project. Thanks to Comercializadora Salani S.A. de C.V. for donation of extra pure chia oil.