
Abstract
Background:
With the exception of APOE, genetic variants associated with increased Alzheimer’s disease (AD) risk are characterized by small effect sizes. Polygenic risk scores (PRS) have shown utility in predicting AD risk; however, their utility for predicting decline in cognition at preclinical stages of AD is poorly understood.
Objective:
To validate associations of a 22-variant AD-risk-weighted PRS with AD risk and related biomarkers and to assess its utility to predict cognitive decline.
Methods:
The PRS was evaluated with respect to brain amyloid-β (Aβ) burden, cerebrospinal fluid (CSF) Aβ42, total-tau, and phospho-tau, and decline in cognition in 643 (570 cognitively normal (CN), 73 AD) PET-imaged participants from the longitudinal Australian Imaging, Biomarkers and Lifestyle (AIBL) Study of Ageing. Cognition was assessed using three composite measures; global cognition, verbal episodic memory, and a Pre-Alzheimer’s Cognitive Composite (PACC).
Results:
PRS, both with and without APOE, were positively correlated with brain Aβ burden, CSF total-tau, and phospho-tau in CN older adults. Further, in CN biomarker positive (Aβ high ) participants, significant associations were observed with baseline and longitudinal cognition. However, this association was not observed after the removal of APOE. Partitioning the PRS into quartiles revealed that the PRS associations with cognitive decline in Aβ high CN older adults is due to a saturating effect of APOE genotype.
Conclusions:
An AD-risk-weighted PRS is associated with cognitive decline in CN older adults. However, this association is absent when APOE genotype is excluded from the PRS, suggesting that associations with cognitive decline in this model of polygenic risk are driven by APOE genotype alone. Further research is needed to define appropriate PRSs with greater utility for predicting preclinical AD cognitive decline.
INTRODUCTION
Alzheimer’s disease (AD) has a strong yet complex genetic component with estimates of heritability ranging from 60–80% [1]. The main genetic risk factor for AD, the ɛ4 allele of apolipoprotein E (APOE), has alone been shown to account for approximately one third of this genetic variance [2]. However, it is established that half of AD cases do not carry APOE ɛ4 (reviewed in [3]). As such, a substantial proportion of genetic hereditability is yet to be explained. Genome wide association studies (GWAS) have been applied with the aim of increasing understanding of genetic risk for AD [4–8]. While GWAS have identified common variants in several genes associated with the clinical diagnosis of AD, no individual common variant that improves risk estimates beyond that associated with the APOE ɛ4 allele has been identified [4–8]. While independently these AD risk variants have low effect sizes, with odds ratios between 1 and 1.5, they have been studied in combination to assess cumulative risk for AD, generally through the calculation of polygenic risk scores (PRSs) (reviewed in [9]).
Though PRSs have previously been calculated by the sum of the risk alleles alone [10, 11], most often risk alleles are weighted according to their influence on disease risk (reviewed in [9, 12]). This is particularly common in AD due to the importance of APOE ɛ4. For example, APOE ɛ4 has been observed to provide odds ratios of progression to disease of more than double that of the next most associated gene [4–8]. A number of published PRS consisting of genes identified in case/control AD GWAS, weighted by their odds ratios [13–28] beta coefficients [29–31] or effect size [32–34], have been associated with AD risk and endophenotypes. Studies have reported PRSs associated with clinical measures including clinical status [16, 33], progression to AD [14, 22], rate of progression to AD [26], and age at onset [13, 35]. In addition, PRSs have been associated with pathological biomarkers including neocortical amyloid-β (Aβ) [14], cerebrospinal fluid (CSF) Aβ42 [13, 27], CSF tau [23], hippocampal volume [19, 30], patterns of AD related brain atrophy [20], and cortical thickness [27, 29].
A number of studies have identified associations between PRSs and measures of cross-sectional and longitudinal cognitive performance in cognitively normal (CN) older adults and those with mild cognitive impairment or dementia. This included global memory [14, 31], episodic memory [15], and executive function [14]. Further, there have been a number of studies that have investigated PRSs and cognition and observed no significant associations [10, 28], or which lose any association after the exclusion of APOE from the score calculation [15, 17]. This discrepancy could be in part due to a lack of knowledge regarding healthy participants’ Aβ burden assessed with positron emission tomography (PET). It has previously been shown that higher levels of brain Aβ in a CN sample is associated with accelerated cognitive decline [36]. Further, an increased risk for cognitive decline is only observed in individuals with an above threshold brain Aβ burden [37], which is compounded by neurodegeneration. However, below threshold brain Aβ burden, even with neurodegeneration, confers no increased risk for cognitive decline [37]. As such, a measure of brain Aβ burden should be included in studies that evaluate models of AD risk as it will provide greater accuracy than when clinical diagnosis alone is used. This would include the assessment of the preclinical efficacy of a PRS where it could also assist in the clarification of previous results.
With a long transitional phase between normal aging and clinical AD, characterized by the accumulation of pathognomonic features up to 20 years prior to clinical diagnosis [38], there is considerable inter-individual variability in the rates of cognitive decline. The ability to identify which individuals will have the fastest rates of cognitive decline during pre-symptomatic disease stages would be of importance to preclinical disease trial design [39]. The study presented here aimed to validate, in a highly characterized longitudinal cohort, previous studies that have calculated PRSs, weighted by AD risk effect-sizes. Specifically, a 22 variant PRS was first evaluated against AD prediction and endophenotypes before its utility for predicting cognitive decline was assessed in CN individuals at risk for AD, based on brain Aβ imaging. Investigation into the feasibility of using PRSs, weighted by AD risk, is important in understanding the influence of genes, previously identified as risk genes for AD, in the early prediction of cognitive decline.
METHODS
Study participants
This study reports on data from 643 participants enrolled in the AIBL Study, a prospective longitudinal study of aging. Ellis et al. previously described the AIBL study design, enrollment process, neuropsychological assessments, and diagnostic criteria [40], including the process of classification into clinical groups. Briefly, participants were classified as CN (n = 570) by a clinical review panel, blinded to Aβ status, when the clinical criteria for diagnosis of mild cognitive impairment [41] or dementia [42] were not met. Likewise, the clinical diagnosis of AD (n = 73) was made when the criteria for dementia [42] was met. Ethics approval for the study was granted by committees from Austin Health, St Vincent’s Health, Hollywood Private Hospital, and Edith Cowan University, and informed written consent was given by all participants.
Cognitive measures
The AIBL neuropsychological test battery consists of the Mini-Mental State Examination (MMSE), Clock Drawing Test, California Verbal Learning Test-Second edition (CVLT-II), Logical Memory I and II (LMI; LMII; Story A only), D-KEFS verbal fluency, a 30-item version of the Boston Naming Test (BNT), Wechsler Test of Adult Reading (WTAR), Digit Span and Digit Symbol-Coding subtests of the Wechsler Adult Intelligence Scale-Third edition (WAIS-III), the Stroop task (Victoria version), and the Rey Complex Figure Test (RCFT) [40]. Previously calculated cognitive composite scores [43, 44], derived from this test battery and the Clinical Dementia Rating (CDR) scale, were used to assess cognitive performance. Three cognitive composites were investigated: verbal episodic memory (CDR sum of boxes (CDRSB), LMII, CVLT-II recognition false positives (CVLT-IIFP), and long delay free recall (CVLT-IILDFR)) [43], a statistically driven global cognition composite (CDRSB, MMSE, LMII, CVLTFP, and Clock) [43], and the Pre-Alzheimer’s Cognitive Composite (PACC (CVLT-IILDFR, LMII, MMSE, Digit Symbol-Coding)) [44]. In the calculation of the verbal episodic memory and global cognition composites there were corrections for age, sex, years of education, premorbid IQ (WTAR-estimated WAIS-III Full Scale Intelligence Quotient (FSIQ)) and depressive symptoms (Geriatric Depression Scale (GDS)) [45]. Cognitive assessment data were utilized from 0, 18, 36, 54, 72, and 90-month time points.
Brain imaging
Positron emission tomography was utilized for Aβ imaging using 11C-Pittsburgh Compound B (PiB), 18F-florbetapir, or 18F-flutemetamol radiolabeled tracers as previously described [46–48]. CapAIBL ®, a freely available web-based magnetic resonance (MR)-less methodology, was used to analyze images and generate PET standardized uptake value (SUV) ratios (SUVR) for all tracers [49]. SUVs were summed and normalized to tracer specific brain regions (PiB (cerebellar cortex), florbetapir (whole cerebellum), flutemetamol (pons)) to generate target-region to reference-region SUVR. For the combined analysis of multiple tracers as a continuous variable, linear regression transformation was applied to 18F-labelled tracers to generate PiB-like SUVR units termed the “Before the Centiloid Kernel Transformation” (BeCKeT) scale [50]. Further, participants were classified as high (Aβ high ) or low (Aβ low ) Aβ burden, based on a PiB/BeCKeT threshold of≥1.4 at any time point [51].
CSF biomarkers
Participants (n = 58) underwent lumbar puncture for CSF collection at the baseline time-point of the study. CSF was collected and Aβ42, total-tau, and phospho-tau quantified as previously described [52]. Briefly, overnight fasting was followed by the collection of 10–14 ml of CSF by routine lumbar puncture directly into one 15 ml polypropylene tube (Greiner Bio-One188271) [53]. Aliquots of all CSF samples were prepared and stored as previously described [52]. Enzyme-linked immunosorbent assays (ELISA): INNOTEST Aβ (1–42; Aβ42), INNOTEST hTAU Ag (total-tau), and INNOTEST Phospho-tau (phospho-tau181P; P-tau181P) (Fujirebio, Belgium), were used to analyze samples as per published standard methods. All samples were analyzed in duplicate and mean intra-assay coefficients of variation for these assays are as previously published [52].
Genotyping
DNA was extracted from 5 mL of whole blood by QIAamp DNA Blood Maxi Kits (Qiagen, Hilden, Germany) following manufacturer’s instructions. APOE genotyping was performed, as previously described [54], using TaqMan ® genotyping assays (rs7412, assay ID: C____904973_10; rs429358, assay ID: C___3084793_20), (Life Technologies, Carlsbad, CA) on a QuantStudio 12K Flex™ Real-Time-PCR system (Applied Biosystems, Foster City, CA), using TaqMan ® GTXpress™ Master Mix (Life Technologies) as per manufacturer instructions. In addition to APOE, 21 SNPs (Table 1) were selected for the construction of the PRS based on their previously identified association with AD risk, identified by GWAS [4–8] and additional association studies [55]. Genotypes were extracted from a genome-wide SNP array conducted on the Illumina OmniExpressHumanExome +BeadChip with subsequent imputation using impute2 ver2.3, with the 1000 genome reference panel (2015 release).
SNP information
Information on the 22 gene variants included in PRS calculation. Minor allele frequencies presented are for cognitively normal (CN) older adults and Alzheimer’s disease (AD) patients in the AIBL cohort. Published OR and AIBL OR (95% CI) are given for the risk allele as per published information [4–8, 55]. SNP, single nucleotide polymorphism; AIBL, Australian Imaging, Biomarkers and Lifestyle Study of Ageing; MAF, minor allele frequency; OR, odds ratio; CI, confidence interval.
PRS calculation
The PRS was calculated by weighting SNPs based on their published association with AD risk. The number (0, 1, or 2) of risk alleles for each SNP was multiplied by the natural logarithm of its respective published odds ratio for the clinical diagnosis of AD (Table 1) [4–8, 55]. The results of these calculations were then summed for each sample giving the individual sample APOE inclusive PRS (PRS
Statistical analysis
All statistical analyses were performed using Rstudio (Rstudio Team 2015) Version 0.98.1103 for Macintosh [56]. Means, standard deviations, and percentages for demographic measures, are given for AD patients, CN older adults and β high CN older adults. ANOVA (age, premorbid IQ, depressive symptoms) and chi-squared tests (gender, years of education, APOE ɛ4 + ve, high Aβ burden) were used to determine the significance of differences between AD patients and CN older adults. Minor allele frequencies (MAF) for all SNPs were calculated in both the CN older adult and AD patient populations. Odds ratios and 95% confidence intervals were calculated in the AIBL cohort, with respect to the clinical diagnosis of AD, using the “epitools” package in R, with reference to the SNP’s risk allele.
To investigate the ability of both PRS to predict AD, the “ROCR” package in R was used to generate a Receiver Operating Characteristic (ROC) curve and calculate Area Under the Curve (AUC). Partial correlations between PRS and AD biomarkers (Aβ imaging, CSF Aβ42 and CSF total-tau) were performed using the “ppcor” package in R, covarying for sex and age at measurement. PRS and AD biomarker values residualized by covariates are graphically presented with regression lines. Random intercepts linear mixed-effects (LME) models, utilizing the “nlme” package in R, were used to determine associations between PRSs and cognitive measures. Initially, a PRS×Time interaction was modelled, with cognitive composites as the dependent variables. These LME models were presented graphically as PRS against both baseline composite score and composite score change over time, with PRS dependent standard error. Additionally, PRSs were partitioned into quartiles, and a PRS quartile group×Time interaction was modelled. PRS quartile group LME models were presented graphically with time point dependent standard error. All analyses for the AIBL-PACC co-varied for age.
RESULTS
Baseline demographics
Demographic data for the clinical groups (AD patients, CN older adults) are presented in Table 2. Significant differences were observed when comparing AD patients and CN older adults (Table 2) in age (p < 0.001), premorbid IQ (p < 0.001), depressive symptoms (p < 0.001), APOE ɛ4 allele carriage (p < 0.001), and high Aβ burden (p < 0.001). Further, demographic information is presented for CN older adults with high Aβ burden (n = 570). Minor allele frequencies and odds ratios for all SNPs included in the PRSs are presented in Table 1.
Baseline demographic information
Baseline demographic information for Alzheimer’s disease (AD) patients (n = 73) and cognitively normal older adults (CN, n = 570) in the AIBL Study. CN older adults with high Aβ (Aβ high , n = 247) were used to investigate changes in baseline and longitudinal cognition. All values represented as mean±standard deviation, unless otherwise stated. Italicized text denotes p < 0.001 when comparing AD and CN older adults. GDS, Geriatric Depression Scale; FSIQ, WTAR-estimated FSIQ.
PRSs are associated with risk for AD and related biomarkers
As detailed in the methods section, two PRSs were calculated based on the allelic frequency and effect sizes of 22 AD-associated genetic variants. One PRS was calculated that included APOE genotype (PRS

Receiver operating characteristic (ROC) curves. ROC curves displaying the ability of the respective PRSs to discriminate between cognitively normal (CN) older adults (n = 570) and Alzheimer’s disease (AD) patients (n = 73) in the AIBL study. PRS

Correlation between PRSs brain amyloid-β. Correlation between PRSs and brain amyloid-β (Aβ) burden in the whole cohort (a, b) and cognitively normal older adults (c, d). Plotted values represent residuals after model correction for age and sex. Regression lines are presented with 95% confidence interval error shading. AD, Alzheimer’s disease; CN, cognitively normal; PRS
Correlations of PRSs with CSF biomarkers were assessed in both a combined group (AD and CN; n = 58) and considering CN older adults only (n = 42). The PRS
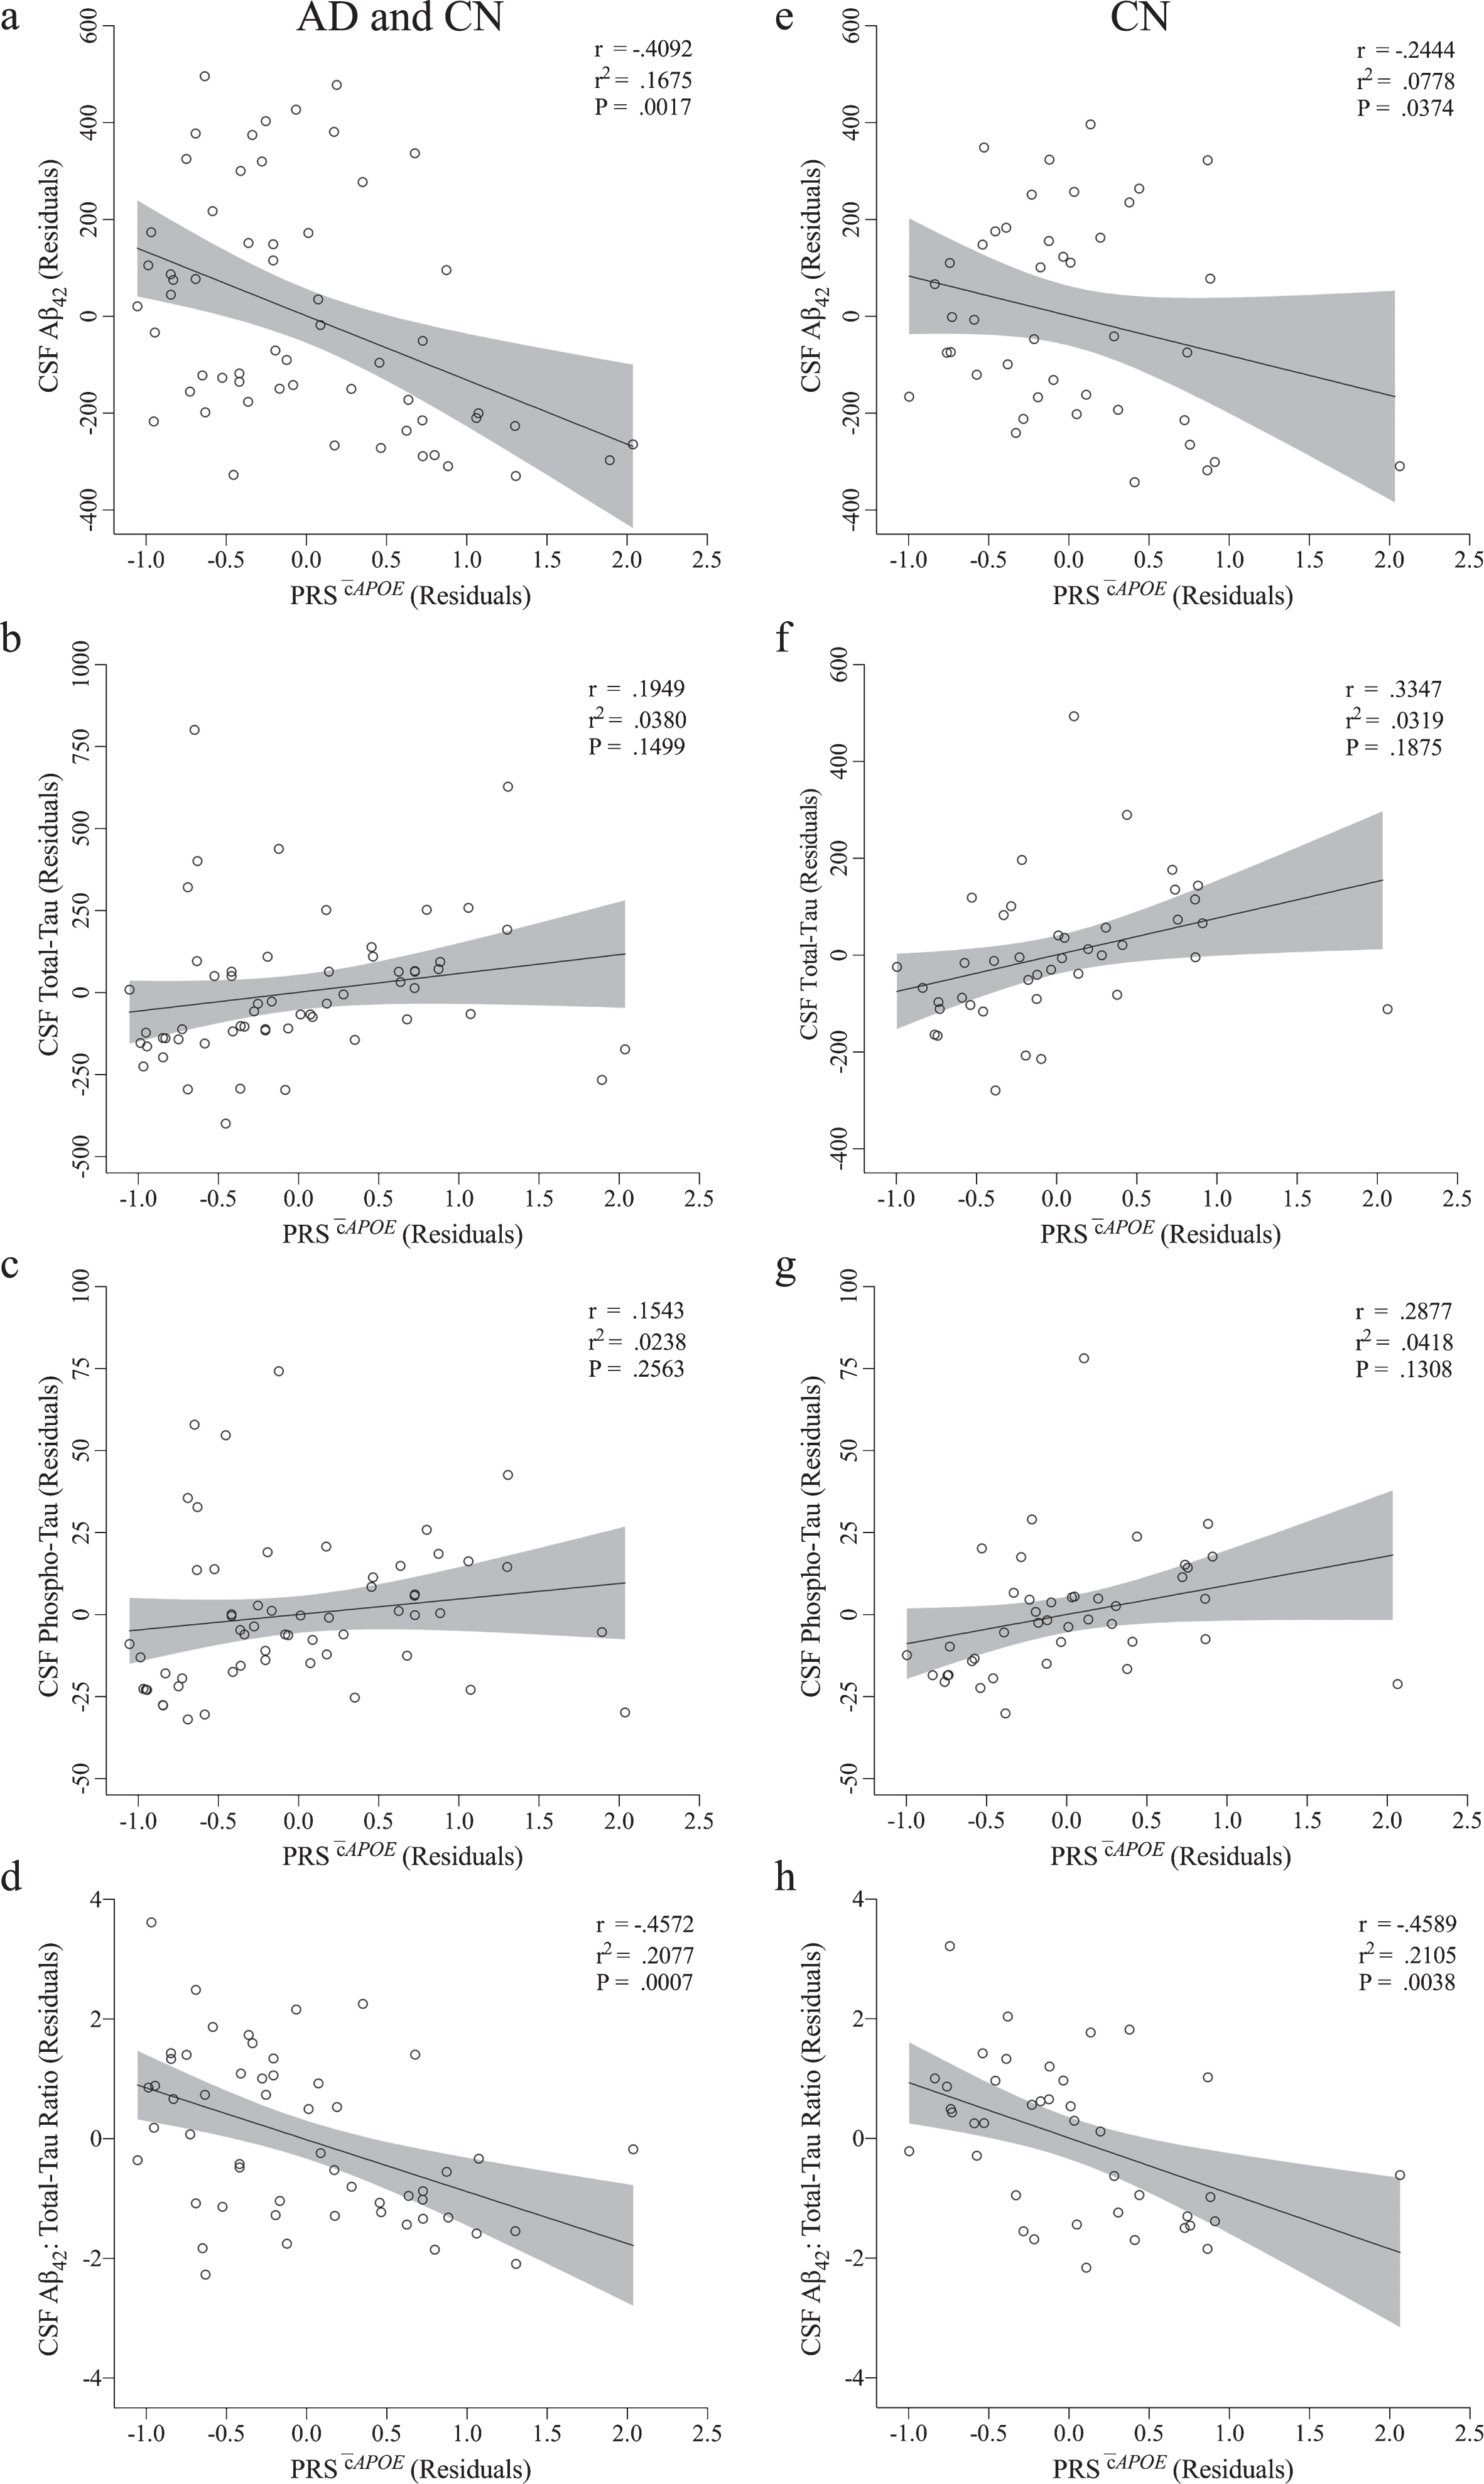
Correlation between PRS

Correlation between PRS
PRS
To assess the utility of a PRS incorporating APOE genotype (PRS

Association between PRS
Association between PRS
Models assessing the association between PRS

Cognitive rates of change in Aβ
high
CN older adults by PRS
Group intercepts and slopes for cognitive composites in Aβ
high
CN older adults by PRS
Group intercepts (α) and slopes (β) for cognitive composites (presented in SD and SD/year) and AIBL-PACC (presented in SD×4 and SD×4/year) in imaged cognitively normal (CN) older adults with high Aβ (Aβ
high
; n = 247). AIBL-PACC controlled for age. *p < 0.05 compared to PRS
While a PRS incorporating APOE genotype showed utility for predicting rates of cognitive decline in the preclinical stages of AD no such utility was observed for a PRS excluding APOE genotype (PRS
Association between PRS
Group slopes for models assessing the association between PRS and baseline (α) and longitudinal (β) change in cognitive composite measures in all cognitively normal (CN) older adults with high Aβ (Aβ
high
; n = 247), and by number of APOE ɛ4 alleles carried. AIBL-PACC controlled for age. PRS
Distribution of APOE genotypes within PRS quartiles
Investigation into the distribution of APOE genotypes between quartiles revealed a pattern of increasing PRS with increasing number of APOE ɛ4 alleles (Fig. 7). Quartile 4 contained all ɛ4 homozygotes (n = 20; Fig. 7), which made up 30.8% of the quartile. In addition, 50.0% of ɛ4 heterozygotes were also present in quartile 4 (66.2% of quartile 4), and 1.4% of samples with no ɛ4 alleles (3.1% of quartile 4; Fig. 7). The additional ɛ4 heterozygotes were present in quartile 3 and 2, 44.2% (62.3% of quartile 3) and 5.8% (8.1% of quartile 2) respectively (Fig. 7). Further, the remaining participants with no ɛ4 alleles were allocated to quartile 3, 2, and 1 with 16.3% (37.7% of quartile 3), 40.4% (91.9% of quartile 2) and 41.8% (100% of quartile 1), respectively (Fig. 7).
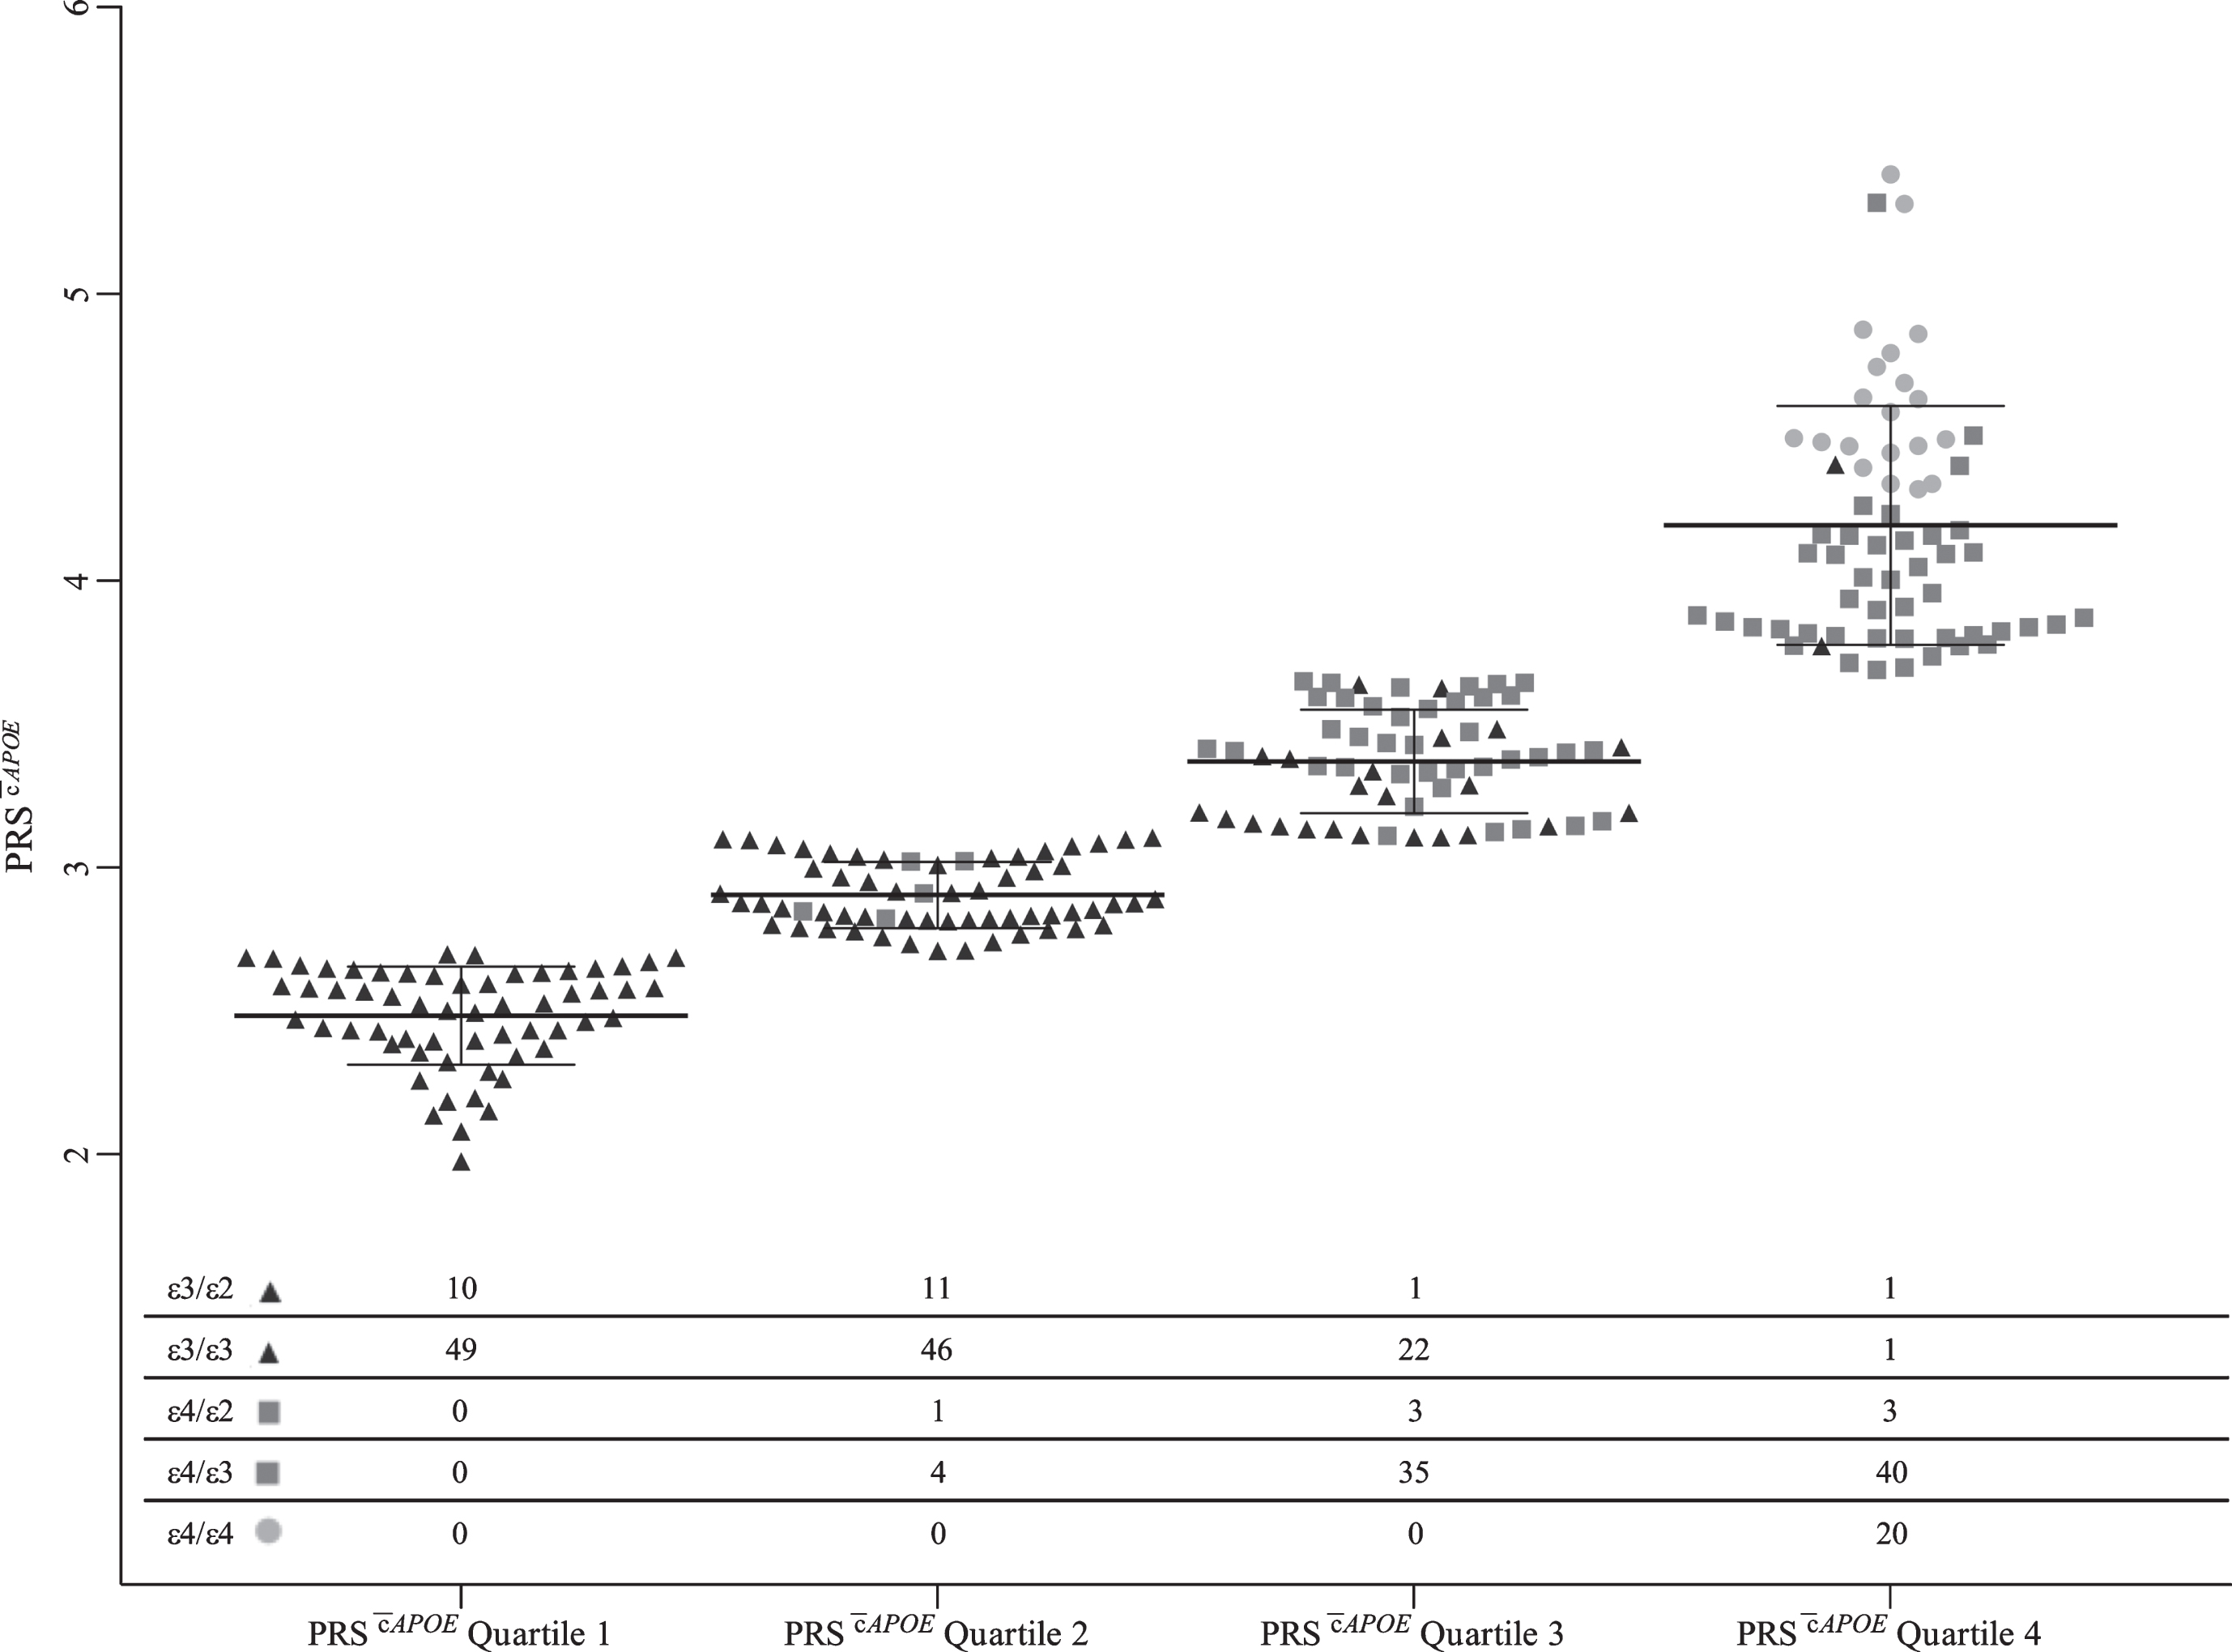
Distribution of APOE genotypes within PRS
DISCUSSION
The primary aim of the current study was to investigate the utility of current AD-risk-weighted methods for PRS calculation in predicting rates of cognitive decline in preclinical AD. However, the current study first sought to replicate previous associations with AD risk and biomarkers. Investigation into the PRS’ ability to predict AD found a marked improvement with the inclusion of APOE, although there was no improvement above that of APOE alone. Suggesting that the admixture of additional genes in an AD-risk-weighted PRS offers little above and beyond that of APOE genotype alone. When evaluating AD biomarker associations relating to the PRSs with and without APOE, significant positive correlations were observed with brain Aβ burden both in the combined group and when considering only CN older adults, which is consistent with a previous study [14]. With respect to CSF biomarkers there were slightly different associations observed for the PRSs, dependent on the inclusion of APOE. Both PRSs were inversely correlated with Aβ42:total-tau ratio. However, the inclusion of APOE (PRS
The association between PRSs and cognition was evaluated in a CN older adult at risk (preclinical) sample based on Aβ brain imaging. A significant association between the PRS
The findings reported herein suggest that APOE is a strong determinant of the ability of a PRS to predict cognitive decline with the initial PRS associations with cognition possibly due to the over-representation of APOE ɛ4 carriers at the higher end of the PRS range—particularly in the upper quartile of the PRS, which contained 100% of the APOE ɛ4 homozygotes. When considered collectively the AD-risk-associated weighting applied to APOE ɛ4 has a strong influence within the score, most likely saturating the effects of additional genes present. Few studies have investigated the specific influence of APOE on PRS performance in this regard, and no studies have assessed this specifically in Aβ high CN older adults. One study by Mormino and colleagues was successful in calculating a PRS without the influence of APOE that was significantly associated with baseline and longitudinal cognition [14]. That study observed a significant association between their PRS, and memory and executive function in older participants without dementia enrolled in the Alzheimer’s Disease Neuroimaging Initiative (ADNI) study [14]. In contrast with the study presented here, the PRS evaluated by Mormino et al. had a far less stringent statistical significance level (p < 0.01 as opposed to genome-wide significance, p = 5×10 - 8) for inclusion of SNPs, as reported by the International Genomics of Alzheimer’s Project (IGAP) meta-analysis [5]. This resulted in the inclusion of 16,123 SNPs, which were weighted by their log odds ratio [14]. In addition, that study investigated a conservative 18 SNP (p-value cut-off at 5×10 - 8) PRS, and similar to the current study reported no association with cognitive performance in the absence of APOE. In another study, Desikan and colleagues developed a polygenic hazard score through the combination of GWAS data and disease incidence rates from population-based epidemiology [35]. The resulting score included 33 SNPs and had the ability to predict age at onset in the absence of APOE [35]. With the inclusion of additional information into the weighting of a polygenic risk score this study demonstrated the ability of a conservative PRS, without APOE, to be able to predict an outcome [35]. Therefore, it is proposed that, at least within the AIBL Study, the prediction of preclinical decline in cognition using a conservative PRS weighted by AD risk offers little above and beyond that of APOE genotype alone.
Our study confirms recent findings that suggest that an AD-risk-weighted PRS has limited utility in terms of assessing AD progression [58]. In addition to the heavy weighting placed on APOE, there are potentially factors that contribute to this reduced utility. An AD-risk based approach to PRS construction is potentially biased as it excludes both “lesser” significant variants, but perhaps more pertinent, it would exclude variants that while not strong AD-risk factors are associated with cognitive performance. One such example is the brain-derived neurotrophic factor (BDNF), the Val66Met variant of which has previously been associated with cognitive decline in Aβ high CN older adults [59, 60]. This supports the notion that the genetic architecture that underpins AD-risk is likely different from that which underpins AD-progression, particularly at the preclinical stage. This being said in addition to APOE, several genes included within the PRS investigated in this current study have been individually associated with cognitive change. For example, studies investigating the SNPs, or in linkage with those presented here, within the genes CR1 [15, 62], ABCA7 [15, 61], CLU [62], BIN1 [63], and NME8 [64], have been associated with cognition and memory. Therefore, an optimized PRS with increased utility for the prediction of cognitive decline at the preclinical stages of AD is still likely to include several AD-risk associated genetic variants that were included in the current PRS assessed herein in addition to cognition-associated risk variants. However, it is likely that the effect sizes derived from associations with risk for developing AD will be substantially different from those associated with the rate at which cognition declines. As such, the combination of phenotype-associated variants and the development of phenotype appropriate effect size weightings may be more efficacious and thus warrants further investigation.
While the inclusion of brain Aβ burden and extended longitudinal follow-up periods are strengths of this study, the following limitations are acknowledged. Participants in the AIBL Study are voluntarily involved; this results in high levels of cognitive performance that are possibly not representative of the general population and difficult to replicate. Further, while the use of composite domain specific measures of cognition is becoming more common, different results could be yielded by alterations in the specific composition of cognitive composites used. Finally, while the length (7.5 years) of longitudinal follow-up data presented here is a clear strength of the study, it is acknowledged that different results could be yielded from the analysis of different durations of longitudinal follow-up, and particularly those of a shorter duration. Finally, the use of AD-risk, as both a basis of genetic variant inclusion and weighting, in the calculation of a PRS for preclinical cognitive decline is itself a potential limitation as it excludes genetic variants associated with cognition and utilizes weightings that are not specific for the rates of decline.
CONCLUSION
In conclusion, this study reports that AD-risk-weighted PRSs are associated with cognitive decline in a cognitively normal at-risk population; however, this association is dependent upon the inclusion of APOE genotype in the score. These results validate those reported in previous studies investigating cross-sectional and longitudinal AD cohorts. This suggests that the utility of an AD-risk-weighted PRS, above that of APOE genotype alone, is perhaps negligible, particularly for the prediction of early stage decline in the absence of APOE genotype. As half of AD cases do not carry an APOE ɛ4 allele, it is important to investigate APOE independent predictors of decline. Lessons from other studies point to the inclusion of phenotype specific weightings to account for the effects of genes in addition to APOE, thus further investigation of this premise is warranted.
Footnotes
ACKNOWLEDGMENTS
Funding for the AIBL study was provided in part by the study partners [Commonwealth Scientific Industrial and research Organization (CSIRO), Edith Cowan University (ECU), Mental Health Research institute (MHRI), National Ageing Research Institute (NARI), Austin Health, CogState Ltd.]. The AIBL study has also received support from the National Health and Medical Research Council (NHMRC) and the Dementia Collaborative Research Centres program (DCRC2), as well as funding from the Science and Industry Endowment Fund (SIEF) and the Cooperative Research Centre (CRC) for Mental Health (Grant ID:20100104), an Australian Government Initiative. We thank all those who took part as subjects in the study for their commitment and dedication to helping advance research into the early detection and causation of AD. We kindly thank all AIBL Research Group members (http://aibl.csiro.au/about/aibl-research-team/). All data and samples used in this study are derived from the Australian Imaging, Biomarkers and Lifestyle (AIBL) Study of Ageing. AIBL data can be accessed through an Expression of Interest procedure, for more information please see ![]() .
.