
Abstract
Microglial activation and oxidative stress have been linked to the formation of amyloid plaques found in Alzheimer’s disease (AD). Epidemiologic and experimental evidence also suggests that cholesterol (CH) contributes to the pathogenesis of AD, particularly the formation of amyloid plaques. We have previously described the development of amyloid-β (Aβ) plaques in New Zealand white rabbits maintained on a 0.125%–0.25% w/w CH diet for extended periods of time (28 months). Here we further characterize this model with combined immunofluorescence and immunohistochemical staining to evaluate markers of immune cell activation. Five out of eight CH-fed rabbits, but not control rabbits, developed extracellular Aβ plaques in both the hippocampus and cortex. Significantly (p < 0.05) higher CD11b microglial staining was found in the hippocampus, temporal cortex, and frontal cortex of CH-fed versus control rabbits. In the temporal cortex and parietal cortex, active CD-11b- and ferritin-positive microglia were found in close proximity to Aβ plaques. Classification and quantification of activated microglia in the temporal cortex showed that 68±12.9%, 25±7.3%, and 7±2.7% of all microglia had a primed, reactive, and amoeboid phenotype, respectively. Activated microglia also expressed myeloperoxidase which was co-localized to amyloid deposits. Our findings in this dietary-based model lend further support of a role of activated microglia and oxidative stress during the development of AD and strengthens the links between hypercholesterolemia, inflammatory status, and AD.
INTRODUCTION
Alzheimer’s disease (AD) is a devastating neurodegenerative disorder characterized by insidious onset in late life with progressive decline in memory and disabling cognitive impairment [1]. Although the etiology of AD remains unclear, the amyloid hypothesis emphasizes abnormal extracellular deposits of amyloid-β (Aβ) protein as an upstream causative factor of AD [2–4]. Amyloid plaques are thought to originate from the gradual accumulation of Aβ peptide and are typically associated with clusters of activated microglia, indicating an inflammatory process may be involved in their development [5–10].
While the role of activated microglia in Aβ deposition remains unclear, these cells are a major source of pro-inflammatory innate cytokines such as TNF-α and IL-1β, along with oxidizing radicals such as nicotinamide adenine dinucleotide phosphate (NADPH) oxidase, superoxide, hydroxyl radicals, hydrogen peroxide, and nitric oxide [11–14]. Microglia are also a major source of the pro-oxidative enzyme myeloperoxidase (MPO), known to catalyze the formation of the highly cytotoxic oxidant hypochlorous acid [15]. This myeloid-specific enzyme is rarely expressed in quiescent microglia in normal brain tissue, but has been found in the brain of individuals with neurodegenerative diseases [16–20]. With AD, in particular, the presence of MPO in the brains of AD patients has been showed to be significantly increased compared with that of non-demented individuals [16, 22]. MPO often co-localizes with amyloid plaques, and an MPO gene polymorphism has been correlated with AD incidence in females [16]. The secretion of MPO and production of the numerous oxidative species may eventually cause stress induced cross-linking of Aβ into insoluble beta sheet structures or fibrils, eventually facilitating increased Aβ deposition in the brain [16, 24].
Epidemiological, genetic, and clinical evidence has also associated disturbances of cholesterol (CH) homeostasis to the etiology of AD via increasing Aβ generation [25–27]. For instance, AD transgenic mice fed CH showed a positive correlation between the amount of plasma CH and Aβ deposition. Moreover, administration of the CH-lowering drug, BM15.766 (4-(2-[1-(4-chlorocinnamyl)piperazine-4-yl]ethyl]benzoic acid), to these mice reduced both brain Aβ peptide accumulation and the amyloidogenic processing of the amyloid-β protein precursor [28, 29]. Arguably, one of the most relevant connections between CH consumption and Aβ accumulation has been demonstrated in hypercholesterolemic rabbits. Sparks et al. originally demonstrated that a 1% to 2% w/w CH diet promoted increased Aβ immunoreactivity in the brains of New Zealand white (NZW) rabbits [30]. Subsequent studies in this model showed that CH feeding promoted many AD-associated pathological changes similar to those that occur in the human AD brain [31–34]. One limitation of this CH-fed rabbit model is that the level of CH being fed to animals can be only maintained for a short period of time since animals tend to succumb to liver and renal failure at around 8–10 weeks on a 2% CH diet or 6-7 months on a 1% CH diet. This rapid health decline precludes one to study how aging can influence amyloid deposition in these animals, which is important as AD is slowly-progressing disease with reported durations ranging from a few years to two decades [35]. To better mimic the natural history of AD development due to elevated CH levels in aging rabbits, we have recently refined this model by feeding NZW rabbits relatively lower amounts of CH (0.125% to 0.25% w/w) than previous work and have shown that this diet allows rabbits to survive for over two years [36]. We have also shown that this diet regimen induced both intracellular Aβ accumulation and, perhaps most importantly, the formation of numerous extracellular iron-laden Aβ-positive plaques in the brain that are detectable in vivo with iron-sensitive MRI techniques [36, 37]. These animals also showed evidence of xanthogranuloma formation in their ventricles [38]. In this study, we further study the brains of these animals, particularly focusing on evidence of microglial activation, MPO production, and their relationship with Aβ deposition.
MATERIAL AND METHODS
Animal model and tissue collection
All animals for this study were cared for in accordance with guidelines from the Canadian Council on Animal Care. Four months old male New Zealand white rabbits (n = 8; 2500–3000 g, Charles River Laboratories, Inc. Wilmington, MA) were acquired and initially fed ∼100 g/day of CH-supplemented (0.25% w/w) rabbit chow. Thereafter, the CH content was titrated as needed (between 0.125% and 0.25% w/w) to maintain a serum CH level of ∼400 mg/dl, which helped to prevent premature death of the animals due to liver failure (Table 1). Age-matched control rabbits (n = 5) were fed normal chow. Normal chow contains ∼15% protein, 40∼50% carbohydrate, 2% vegetable fat, and 15∼25% fiber, and the CH content is less than 0.01%). At specific time points during CH feeding, blood was drawn from the central ear artery following acepromazine administration (0.10 ml/kg intramuscular) to promote arterial dilation and analgesia. Total serum CH was measured (Table 1) using a colorimetric enzyme-based kit (Wako Diagnostics, Richmond, VA). Animals were sacrificed 28 months after initiating the experimental dietary protocol. Animals were sacrificed with an overdose of ketamine (2 ml intravenous bolus) and pressure-perfused via the left ventricle with a minimum of 1.5 L of heparinized (1 U/ml) Hanks’ balanced salt solution. Brains were then carefully dissected, immersed in 10% formalin for 48 h at 4°C, and switched to phosphate buffered saline at 4°C prior to embedding, sectioning, and staining.
Total plasma cholesterol levels (mg/dl) of CH-fed and control rabbits over time
Values represent mean±SD. *p < 0.001 when compared with control animal values at 9, 12, 18, and 24 months.
Hematoxylin and eosin (H&E) staining
Brain sections were washed briefly in distilled water, stained in Harris hematoxylin solution for 8 min and immersed in 1% acid alcohol for 30 s. After washing in 0.2% ammonia for 5 min, sections were counterstained in eosin-phloxine solution for 30 s, dehydrated through 95% alcohol and then two changes of absolute alcohol for 5 min each. Sections were then cleared through 95% ethyl alcohol, absolute alcohol, and xylene, and mounted with resinous medium.
Oil-Red-O staining for lipid
Brain sections were fixed in ice cold 10% formalin for ten minutes and rinsed in distilled water. After washing in absolute propylene glycol three times, sections were stained for lipids in pre-warmed Oil-Red-O working solution (0.5 gram of Oil-Red-O in 100 ml of absolute propylene glycol) for 8–10 min in a 45°C oven. Sections were then immersed in 85% propylene glycol solution for 2–5 min and counterstained with Gill’s hematoxylin for 30 s. Sections were mounted with glycerin jelly for microscopic observation.
Bielschowsky’s silver staining
Brain sections were placed in pre-warmed (40°C) 10% silver nitrate solution and stained for 20 min. After washing three times in distilled water, slides were placed in an ammonium silver solution (adding concentrated ammonium hydroxide to the 10% silver nitrate solution until the precipitate formed was clear) in a 40°C oven for 20 min, then directly placed in a developer working solution (400μl developer stock solution: 20.0 ml 37–40% formaldehyde, 0.5 gm citric acid, 2 drops nitric acid, and 100 ml distilled water). Slides were immersed in 50 ml distilled water containing 400μl ammonium hydroxide for 1 min to stop the silver reaction, washed three times in PBS, and placed in 5% sodium thiosulfate solution for 5 min. Slides were then dehydrated and cleared through 95% ethyl alcohol, absolute alcohol, and xylene, and mounted with resinous medium. Histological images were taken using a Zeiss Axioplan 2ie microscope equipped with an AxioCam digital camera (Carl Zeiss Canada, Toronto, ON).
Aβ, CD11b, and CD45 histochemical immunostaining
Aβ, CD11b, and CD45 immunohistochemistry was performed on 40μm sagittal free-floating brain sections. Immunostaining was performed using a mouse anti-human Aβ1 - 16 primary antibody (1:150 dilution; MAB5206, Millipore Canada LTD, Ontario), a mouse anti-rabbit CD11b antibody (1:50 dilution; GTX76528, GeneTex Inc, Irvine, CA, USA) and a mouse anti-rabbit CD45 antibody (1:50 dilution; GTX76533, GeneTex Inc, Irvine, CA, USA). In addition, CD45 immunohistochemistry was performed on sections collected from the descending aorta from two CH-fed rabbits. For Aβ immunostaining only, sections were pre-treated for 20 min with 95% formic acid (F0507, Sigma-Aldrich, Sigma-Aldrich Canada Co, Oakville, ON). All sections were rinsed in PBS, incubated for 30 min in PBS containing 3% hydrogen peroxide, and immersed for 30 min in blocking reagent (15% horse serum in PBS). Sections were then incubated with primary antibody at 4°C for 24 h followed by horse anti-mouse biotinylated secondary antibody at room temperature for 30 min (1:300 dilution; Vector Laboratories, Burlington, ON). Tissue sections were processed using the (ABC) solution for 30 min (Vector Laboratories, Burlington, ON), and visualized with 3,3’-diaminobenzidine (0.5 mg/ml; Sigma-Aldrich Canada, Oakville, ON). Negative control staining (without addition of primary antibody) was performed on adjacent sections. Counterstaining of CD11b and CD45 stained sections was performed using cresyl violet. Slides were then dehydrated through 70–100% alcohol, cleared with xylene, and cover slipped for microscopic examination.
Quantification of CD11b labelled microglia in cholesterol fed rabbits and controls
Quantification analysis of CD11b labelled microglia were performed on 5 CH-fed rabbit brains and 5 control rabbit brains by an observer blinded to the dietary regimen. Images were taken from three anatomical regions, the hippocampus, the frontal cortex and the temporal cortex with 5 random microscopic areas in each region (a total of 150 images). Digital images were obtained using a 10x objective on a Zeiss Axioscope microscope equipped with a Zeiss HRC camera. Images were subsequently evaluated using ImageJ (version 1.48, National Institutes of Health, Bethesda, MD, USA). The total number of CD11b stained pixels per section was measured by using the color sampling tool to select positive staining, determining a threshold value, and then applying this threshold across all images.
Classification and quantification of CD11b positive microglia in different activation states
CD11b positive microglia were categorized as primed, reactive and amoeboid microglia, according to morphological and immunohistochemical criteria [39, 40]. Primed microglia were variably enlarged with several higher-order branches and displayed intense CD11b immunoreactivity. Reactive microglia presented as enlarged cell bodies, a few first-order branches, as well as a shorter total process length than primed microglia. The processes extended by reactive microglia were generally longer than the cell body diameter. Amoeboid microglia displayed a characteristic amoeboid like cell body, were devoid of branches or had one or two unbranched processes shown to be shorter than the long diameter of the cell-body. The numbers of each of these activated microglial subtypes were counted in five microscopic fields (40x objective; each representing 0.48 mm2) of the temporal cortex in CD11b immunostained sections from each of the 5 CH-fed rabbits. Data is presented as number of each cell phenotype per mm2.
CD11b and Aβ double histochemical immunostaining
Tissue sections were first subjected to Aβ immunohistochemistry that stains amyloid plaques as dark brown. The tissue sections were immersed in 95% formic acid for 20 min and incubated for 30 min in blocking reagent (15% horse serum in TBS). Tissue sections were then incubated in the mouse anti-human Aβ1 - 16 primary monoclonal antibody (1:150 dilution; MAB5206, Millipore Canada LTD, Ontario) at 4°C for 24 h followed by horse anti-mouse biotinylated secondary antibody at room temperature for 30 min (1:300 dilution; Vector Laboratories, Burlington, ON). Tissue sections were processed using the (ABC) solution for 30 min (Vector Laboratories, Burlington, ON), and 3,3’-diaminobenzidine (0.5 mg/ml; Sigma-Aldrich Canada, Oakville, ON) for 3 min. Afterward, the CD11b immunostaining was employed on the same section, which stains the activated microglia as blue using the alkaline phosphatase substrate. Tissue sections were incubated for 30 min in blocking reagent (15% horse serum in PBS), then incubated in the mouse anti-rabbit CD11b antibody (1:50 dilution; GTX76528, GeneTex Inc, Irvine, CA, USA) for 24 h. Slides were then incubated with a horse anti-mouse biotinylated secondary antibody for 30 min (1:300 dilution; BA2000, Vector Laboratories) and rinsed three time with TBS for 5 min each. Tissue sections were processed using the ABC-AP solution for 30 min (Ak 5200, Vector Laboratories) and incubated in Vector Blue alkaline phosphatase substrate solution (SK-5300, Vector Laboratories) for 25 min in the dark. Slides were washed twice with TBS for 5 min, rinsed in water, and coverslipped with aqueous mounting medium for microscopic examination.
Aβ, ferritin, CD11b, MPO dual immunofluorescence staining
Dual immunofluorescence staining was performed on brain sections from 5 CH-fed and 5 control rabbits. Forty micron sagittal free-floating sections were fixed with 4% paraformaldehyde and 0.2% picric acid in a phosphate buffer at pH 7.4 for 10 min, pre-incubated for 30 min in blocking reagent (15% goat serum in PBS), and incubated overnight at 4°C in 0.3% Triton X-100 and 0.5 mg/ml bovine serum albumin containing a mixture of two sets of primary antibodies (mouse IgG1 paired with mouse IgG2a or mouse antibody paired with rabbit antiserum): 1) Aβ (1:400 dilution; MAB5206, Millipore Canada LTD, Ontario) and anti-ferritin (1:300 rabbit anti-ferritin, PA1-23700, Affinity BioReagents, Rockford, IL, USA); 2) MPO (1:100 dilution, mouse IgG2a anti-MPO, M1464, Pelicluster) and CD11b (1:150 dilution; mouse IgG1 anti-rabbit CD11b, GTX76528, GeneTex Inc, Irvine, CA, USA); and 3) MPO and Aβ. Following this, sections were incubated with a mixture of two fluorescent conjugated secondary antibodies (FITC conjugated goat anti-mouse IgG1 and Texas Red conjugated goat anti-mouse IgG2a or Texas Red conjugated goat anti-mouse IgG1 and FITC conjugated goat anti-rabbit IgG) in PBS for 60 min at room temperature. Sections were then rinsed three times with PBS-0.05% tween 20 for 2 min and cover-slipped with anti-fade fluorescent mounting medium (Vector, H-1000).
Statistical analysis
GraphPad Prism 6.0 (GraphPad Software Inc., San Diego, CA) was used for statistical analysis. One-way analysis of variance (ANOVA) was performed for comparisons between cholesterol-fed and control groups, with post hoc analysis (Tukey test). A nominal p-value of less than 0.05 was considered significant for all tests.
RESULTS
Long term CH-enriched diet induces extracellular senile plaques
Bielschowsky’s silver staining revealed a specific type of compact plaque without obvious surrounding fibril throughout the brains of 5 out of 8 CH-fed rabbits (Fig. 1). These plaques were typically small (10–15μm in diameter) with round morphology and found in clusters located in multiple regions including the hippocampus, parahippocampal gyrus, and cortex. Control rabbits maintained on regular chow did not showed extracellular plaque deposition.
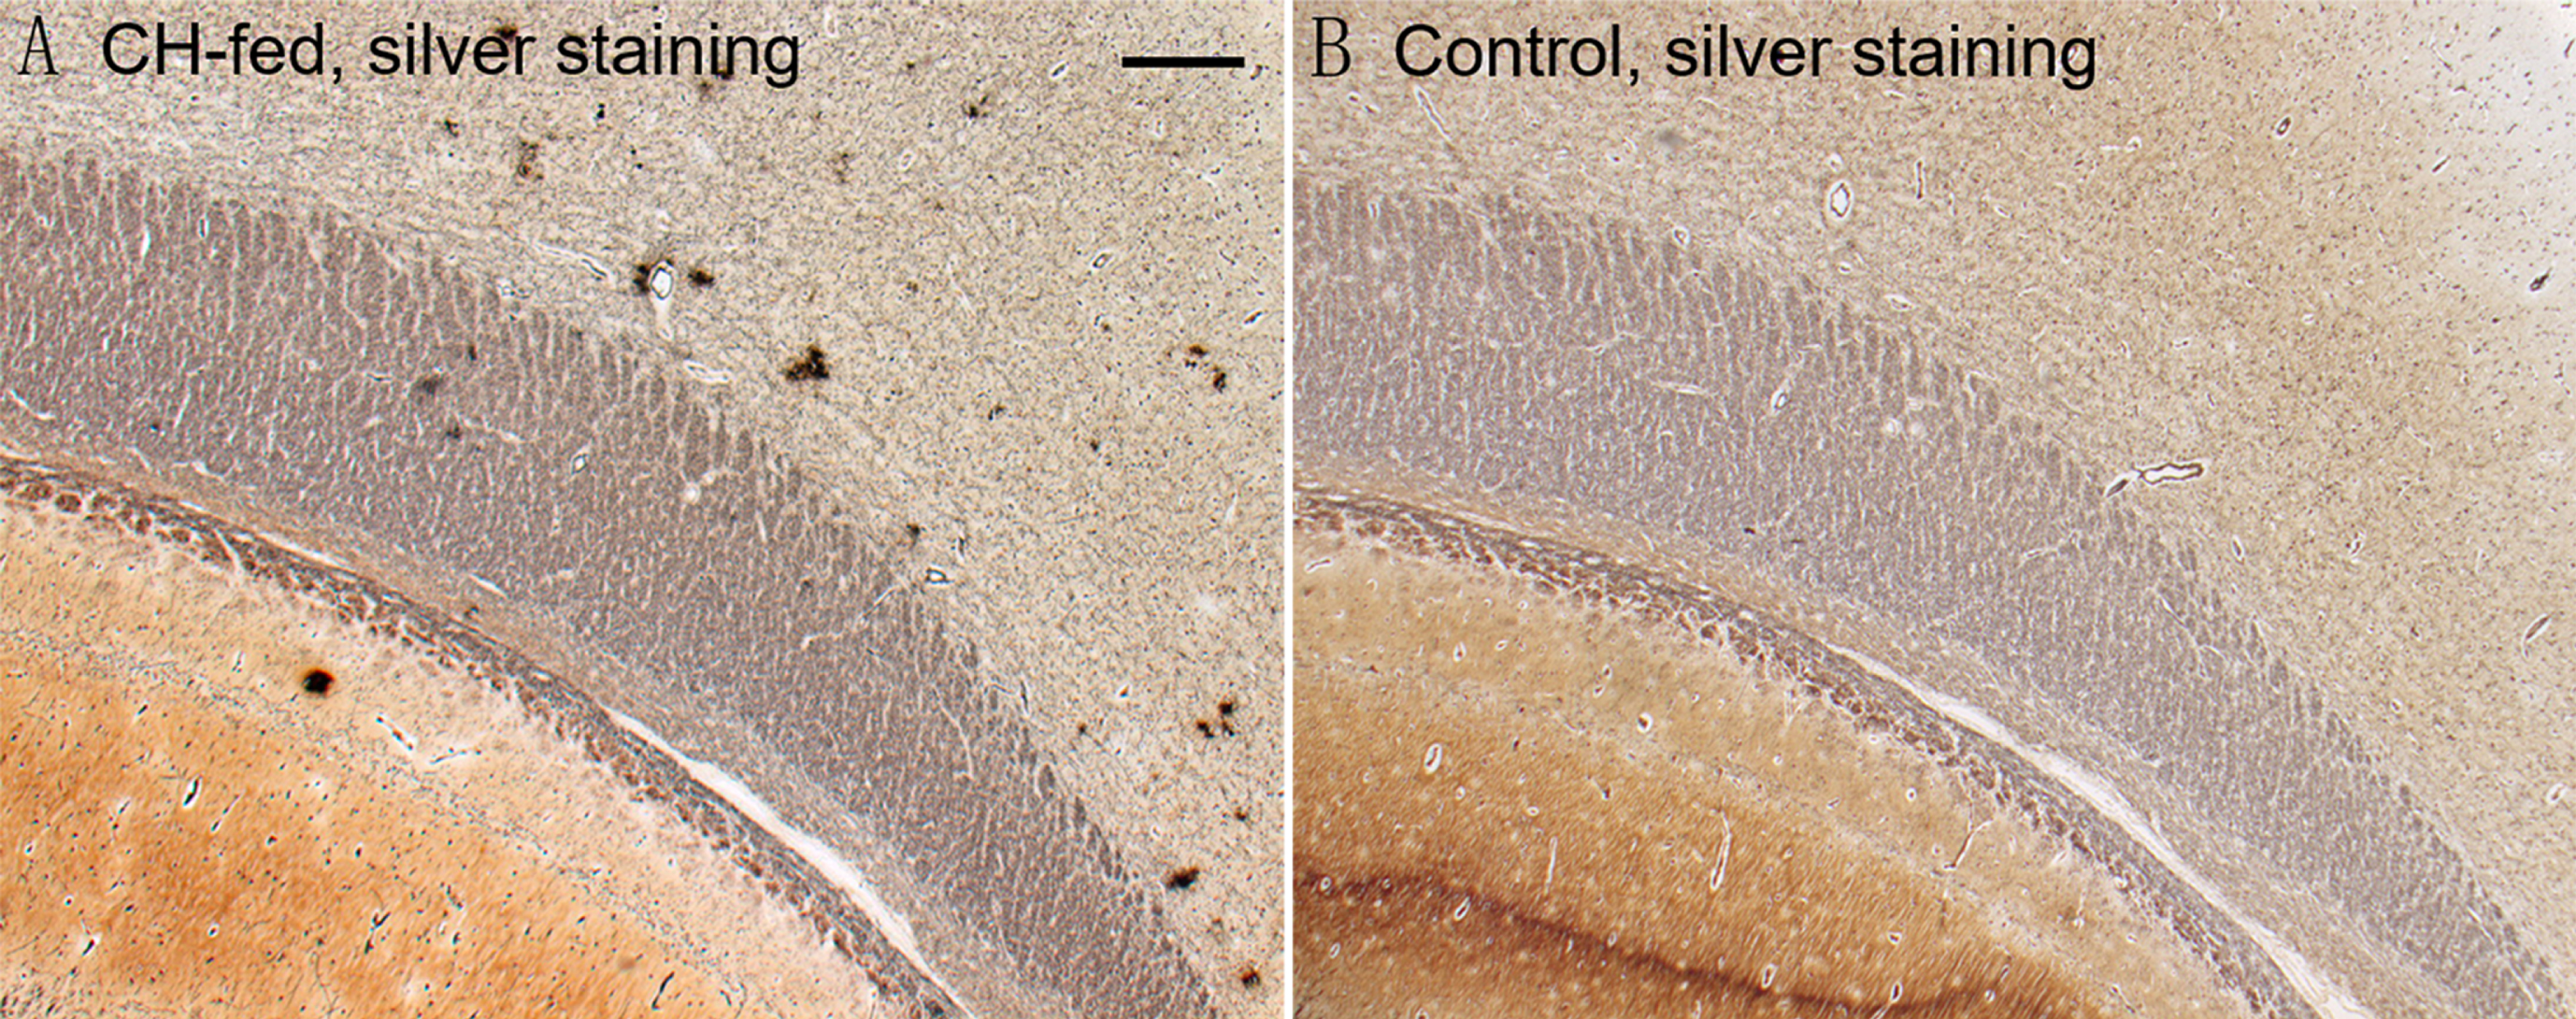
Bielschowsky’s silver staining (A) revealed a specific type of compact plaque without obvious fibril-surrounding in the parahippocampal cortex of CH-fed rabbits (A, arrows). In contrast, silver staining on control rabbit brains (B) did not show extracellular Aβ deposits. (Scale bar represents 100μm).
Microglial activation in the hippocampus and cortex of CH-fed rabbits
Immunohistochemical analysis of brain sections was performed with an antibody against CD11b, the beta-integrin marker of microglia, which acts as a binding protein for intracellular cell adhesion molecule-1 (ICAM-1) and complement C3bi during microglia activation [41, 42]. In brains from control rabbits, CD11b-positive microglia were sparsely distributed within the cortex (Fig. 2), and occasionally CD11b-positive microglia were found adjacent to blood vessels. The microglia in the control brains were typically of bipolar or multipolar morphology with a scanty cytoplasm, thin processes and small perikarya. In contrast, in CH-fed rabbits, microglial activation was observed in the various regions including hippocampus, parahippocampal gyrus, frontal cortex, temporal cortex, parietal cortex, striatum, and thalamus (Fig. 2). The microglial activation occurred mainly in two spatial patterns. In the hippocampus, microglia showed a more diffuse pattern of activation with dense CD11b staining throughout the stratum lacunosum moleculare, whereas in the cortex and parahippocampal gyrus, activated microglia were mostly present as clusters of hypertrophic cells and stained intensely (Fig. 2). Quantitative analysis of CD11b staining images showed significantly more CD11b positive microglia in hippocampus, frontal cortex, and temporal cortex of CH-fed rabbits compared to rabbits fed normal chow (p < 0.01; Fig. 3).

CD11b immunostaining revealed microglial activation in the temporal cortex (A), stratum radiatum of hippocampus (C), frontal cortex (E), parietal cortex (G), and striatum (I) of CH-fed rabbits. In the hippocampus, microglia showed a defuse pattern of activation with dense CD11b staining throughout stratum lacunosum moleculare; in the cortex and parahippocampal gyrus, activated microglia were mostly seen as clusters of hypertrophic cells with round and enlarged rod cells with retracted processes. No evidence of microglia activation was detected in temporal cortex (B), stratum radiatum of hippocampus (D), frontal cortex (F), parietal cortex (H), and striatum (J) of control rabbits. (Insets are higher magnification of regions indicated by arrows. Scale bar represents 100μm).

Quantitative analysis showed significantly higher CD11b positive staining (pixels) in hippocampus, frontal cortex and temporal cortex of CH-fed rabbits compared to controls. (*p < 0.01). Data is presented as mean±SD.
To assess microglial activation states, CD11b-positive microglia were categorized as either primed, reactive and amoeboid microglia based on morphological characteristics (Fig. 4). While all 3 phenotypes were present in the temporal cortex of 5 CH-fed rabbits, the primed microglia accounted for 68±12.9% of the total number, compared to 25±7.3 % for the reactive phenotype and 7±2.7% amoeboid phenotype. The density of primed microglia (61.2±14.5 per mm2) was significantly higher (p < 0.01) than reactive (24.8±7.2 per mm2) and amoeboid microglia, and amoeboid microglia (4.8±1.3 per mm2) were present at the lowest density (Fig. 4). To further identify if microglia were gitter cells, we performed H&E staining and Oil-Red-O lipid staining of brain sections from CH-fed and control rabbits. Although not abundant, a few lipid-laden microglial phagocyte/macrophages in the paraventricular white matter of CH-fed rabbits were noted, which were not seen in control rabbit brains (Supplementary Figure 1).
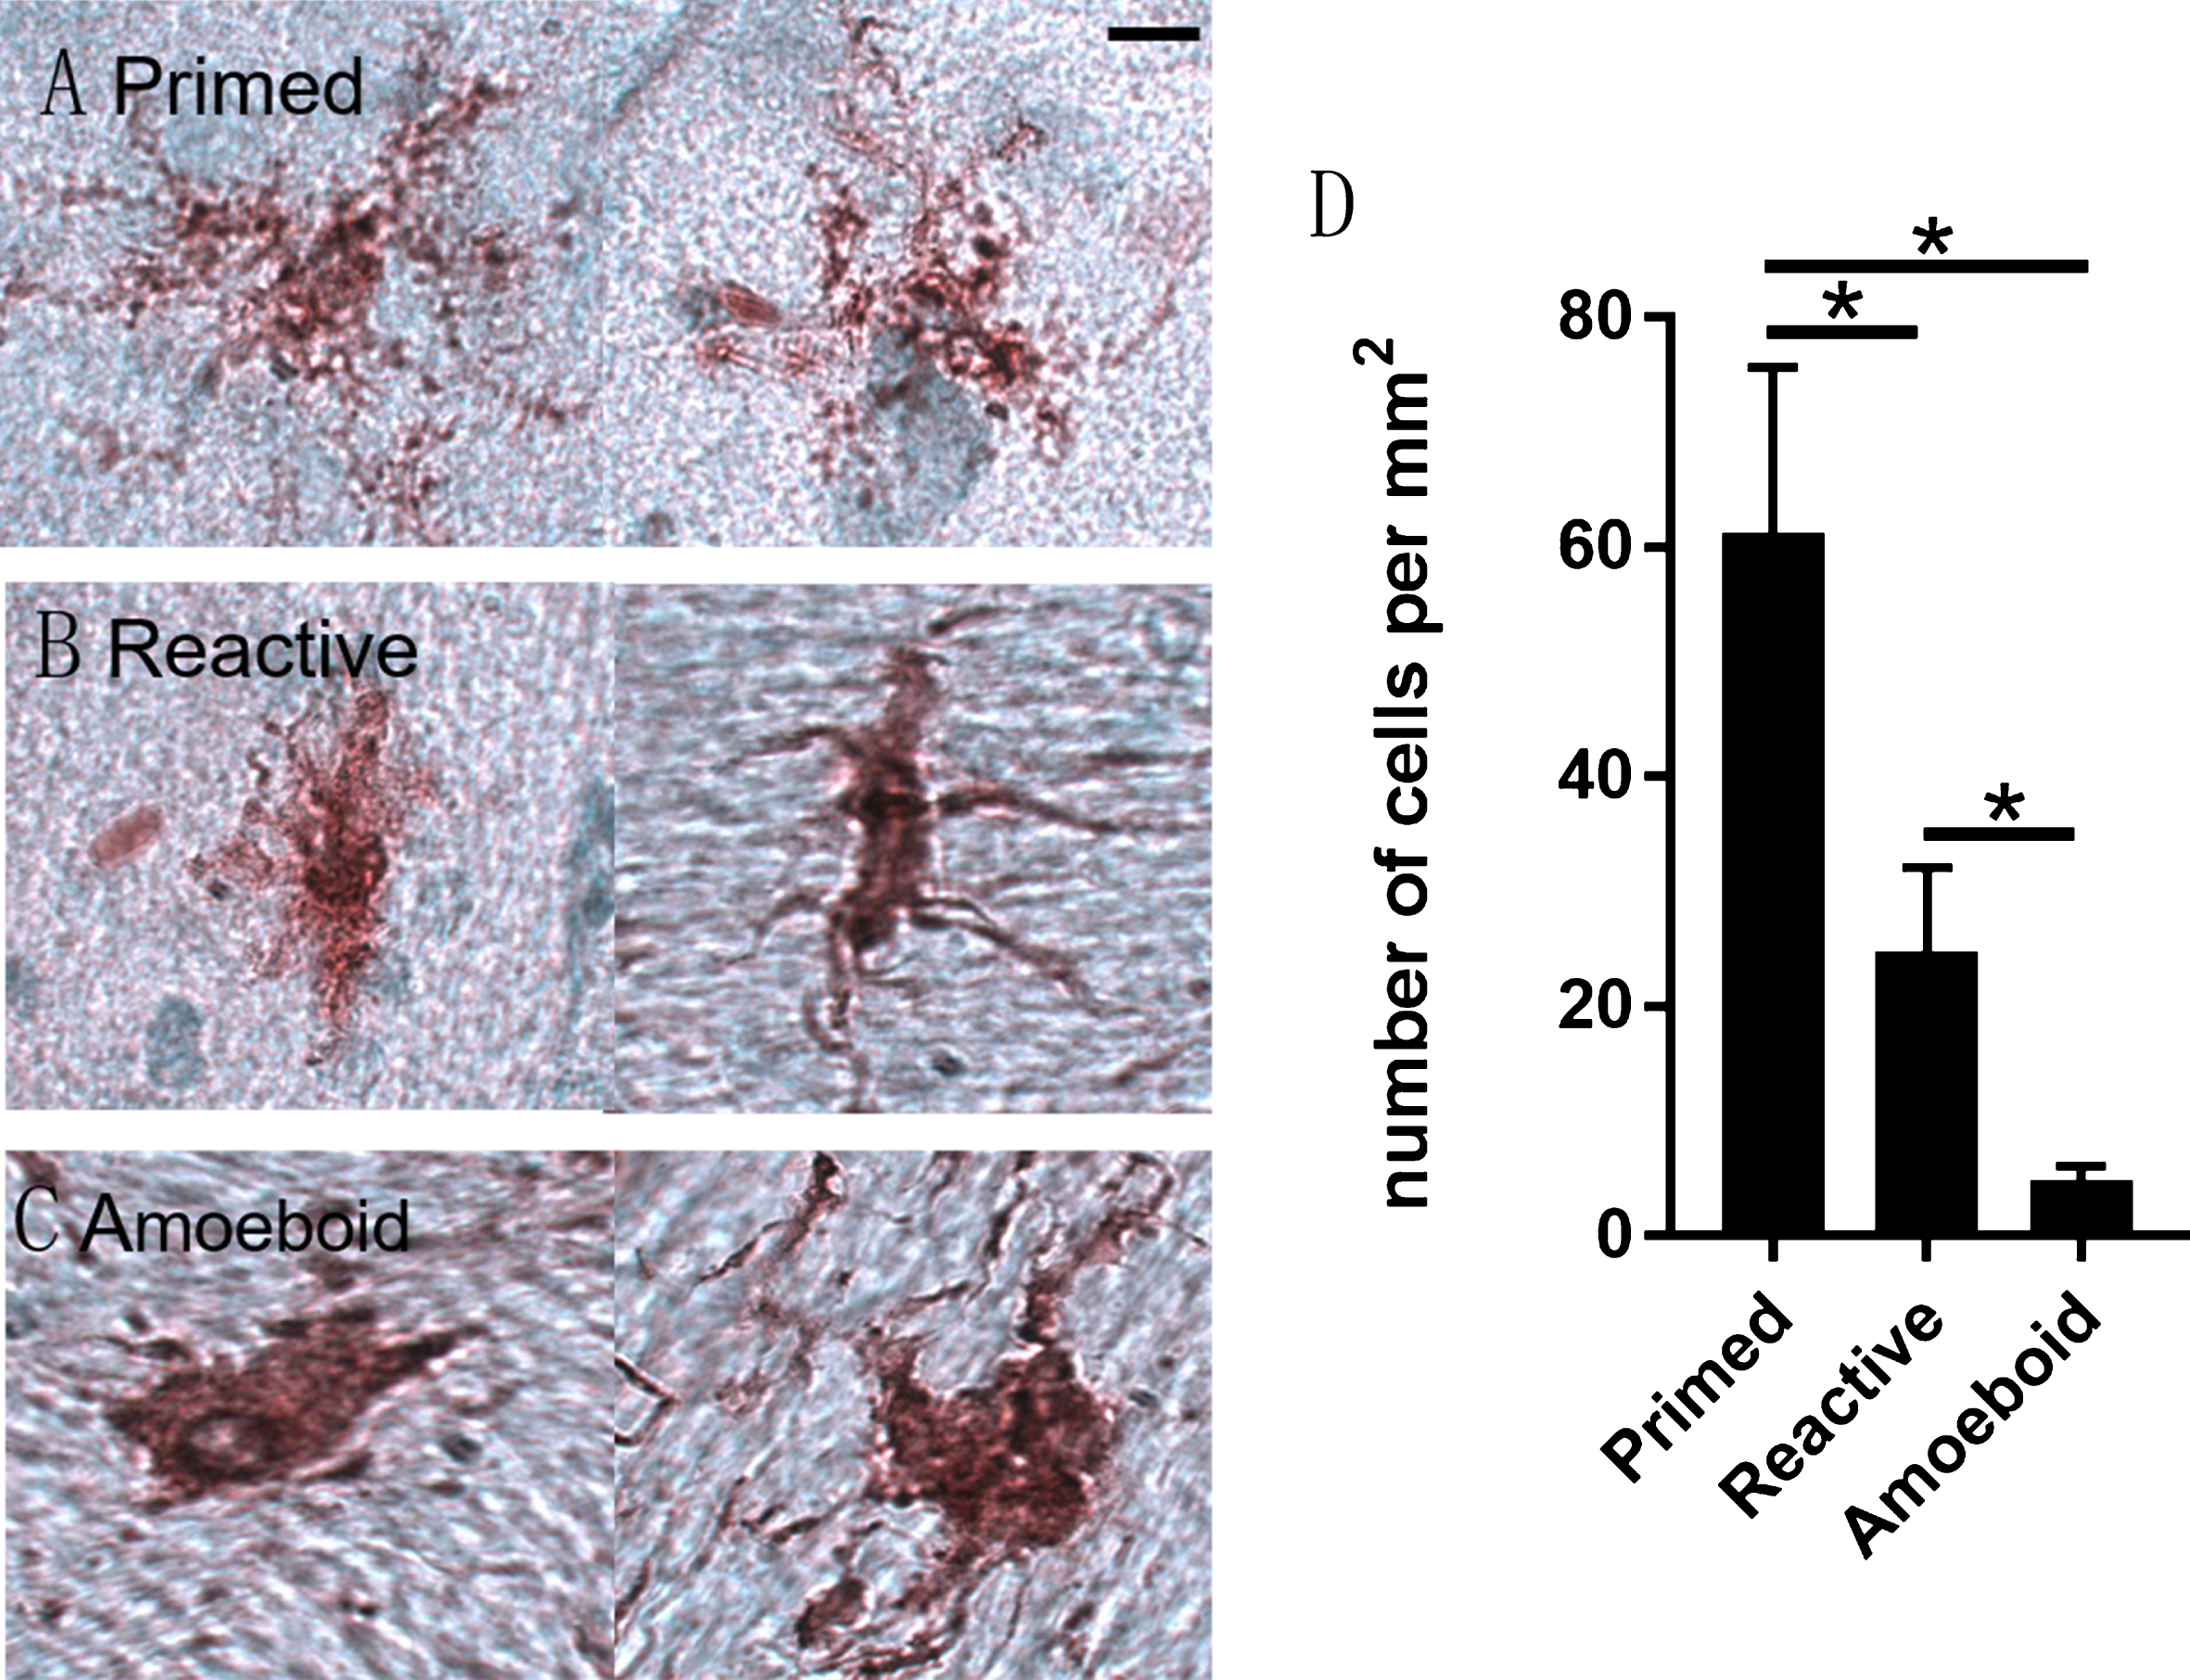
Morphological features of three subtypes of activated microglia in the brain of CH-fed rabbit. Primed microglia displayed intense CD11b immunoreactivity with higher-order branches (A). Reactive microglia had an enlarged round cell body with a few un-ramified processes. The processes extended by reactive microglia were longer than the cell body diameter (B). Amoeboid microglia displayed an amoeboid-shaped cell body, extending one process or are completely devoid of processes (C). D shows the numerical density (number of cells per mm2) of primed, reactive and amoeboid microglia in temporal cortex of CH-fed rabbits. Data is represented as mean±SD (Scale bars: 10μm; *p < 0.01).
Active microglia in the cortex are found in close proximity to extracellular Aβ plaques
CD11b/Aβ dual immunohistochemistry (Fig. 5) and ferritin/Aβ dual immunofluorescence staining (Fig. 6) was performed to determine if microglia activation was associated with Aβ plaques. Ferritin has been reported as a microglial marker and reactive microglia are more strongly stained with anti-ferritin sera than resting microglia [43]. In the temporal cortex and parietal cortex of CH-fed rabbits, but not in rabbits fed normal chow, active microglia were detected in close proximity to extracellular Aβ deposits. In some instances, ferritin and CD11b immunoreactivity were found to be nearly co-localized with Aβ deposits.
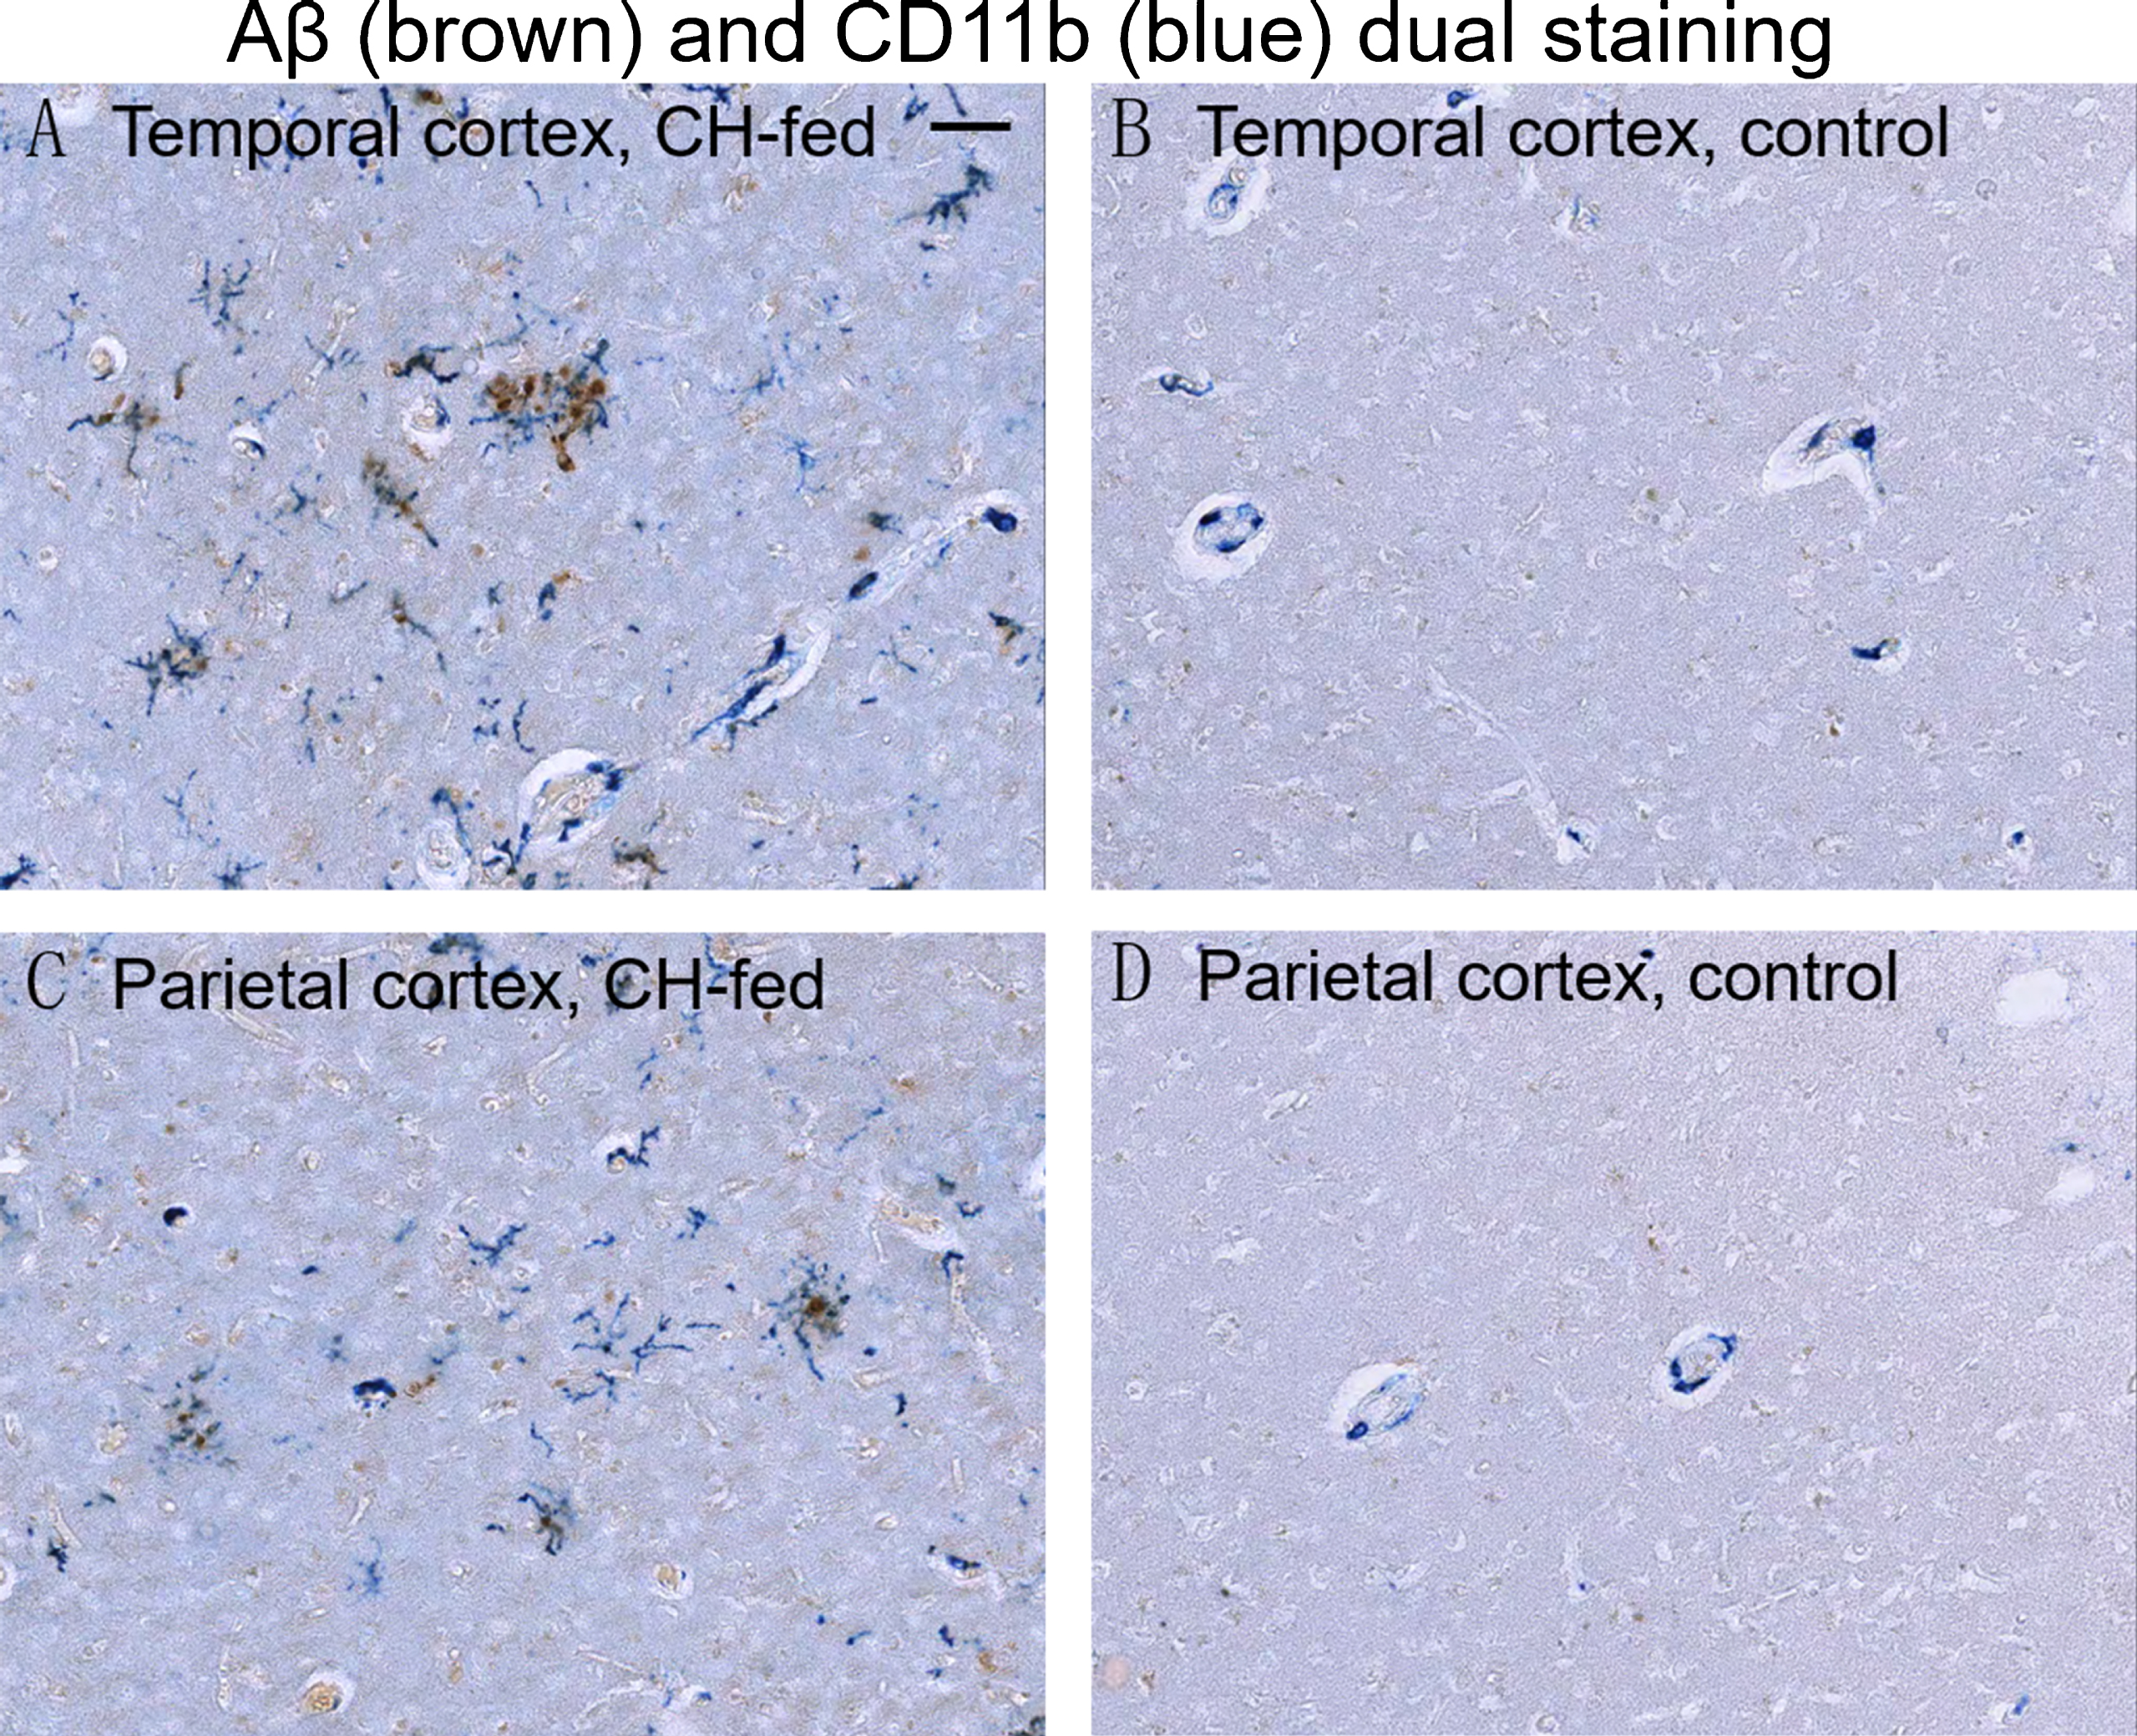
Aβ and CD11b dual immunohistochemistry in the cortex of CH-fed rabbit and control brain. Aβ (brown) and CD11b (blue) dual immunostaining the temporal cortex (A) and parietal cortex (C) of CH-fed rabbits demonstrated that reactive microglia are in close proximity to Aβ plaques. Minimal Aβ and CD11b immunostaining was seen in the temporal cortex (B) and parietal cortex (D) of control rabbits. (Scale bar represents 50μm).
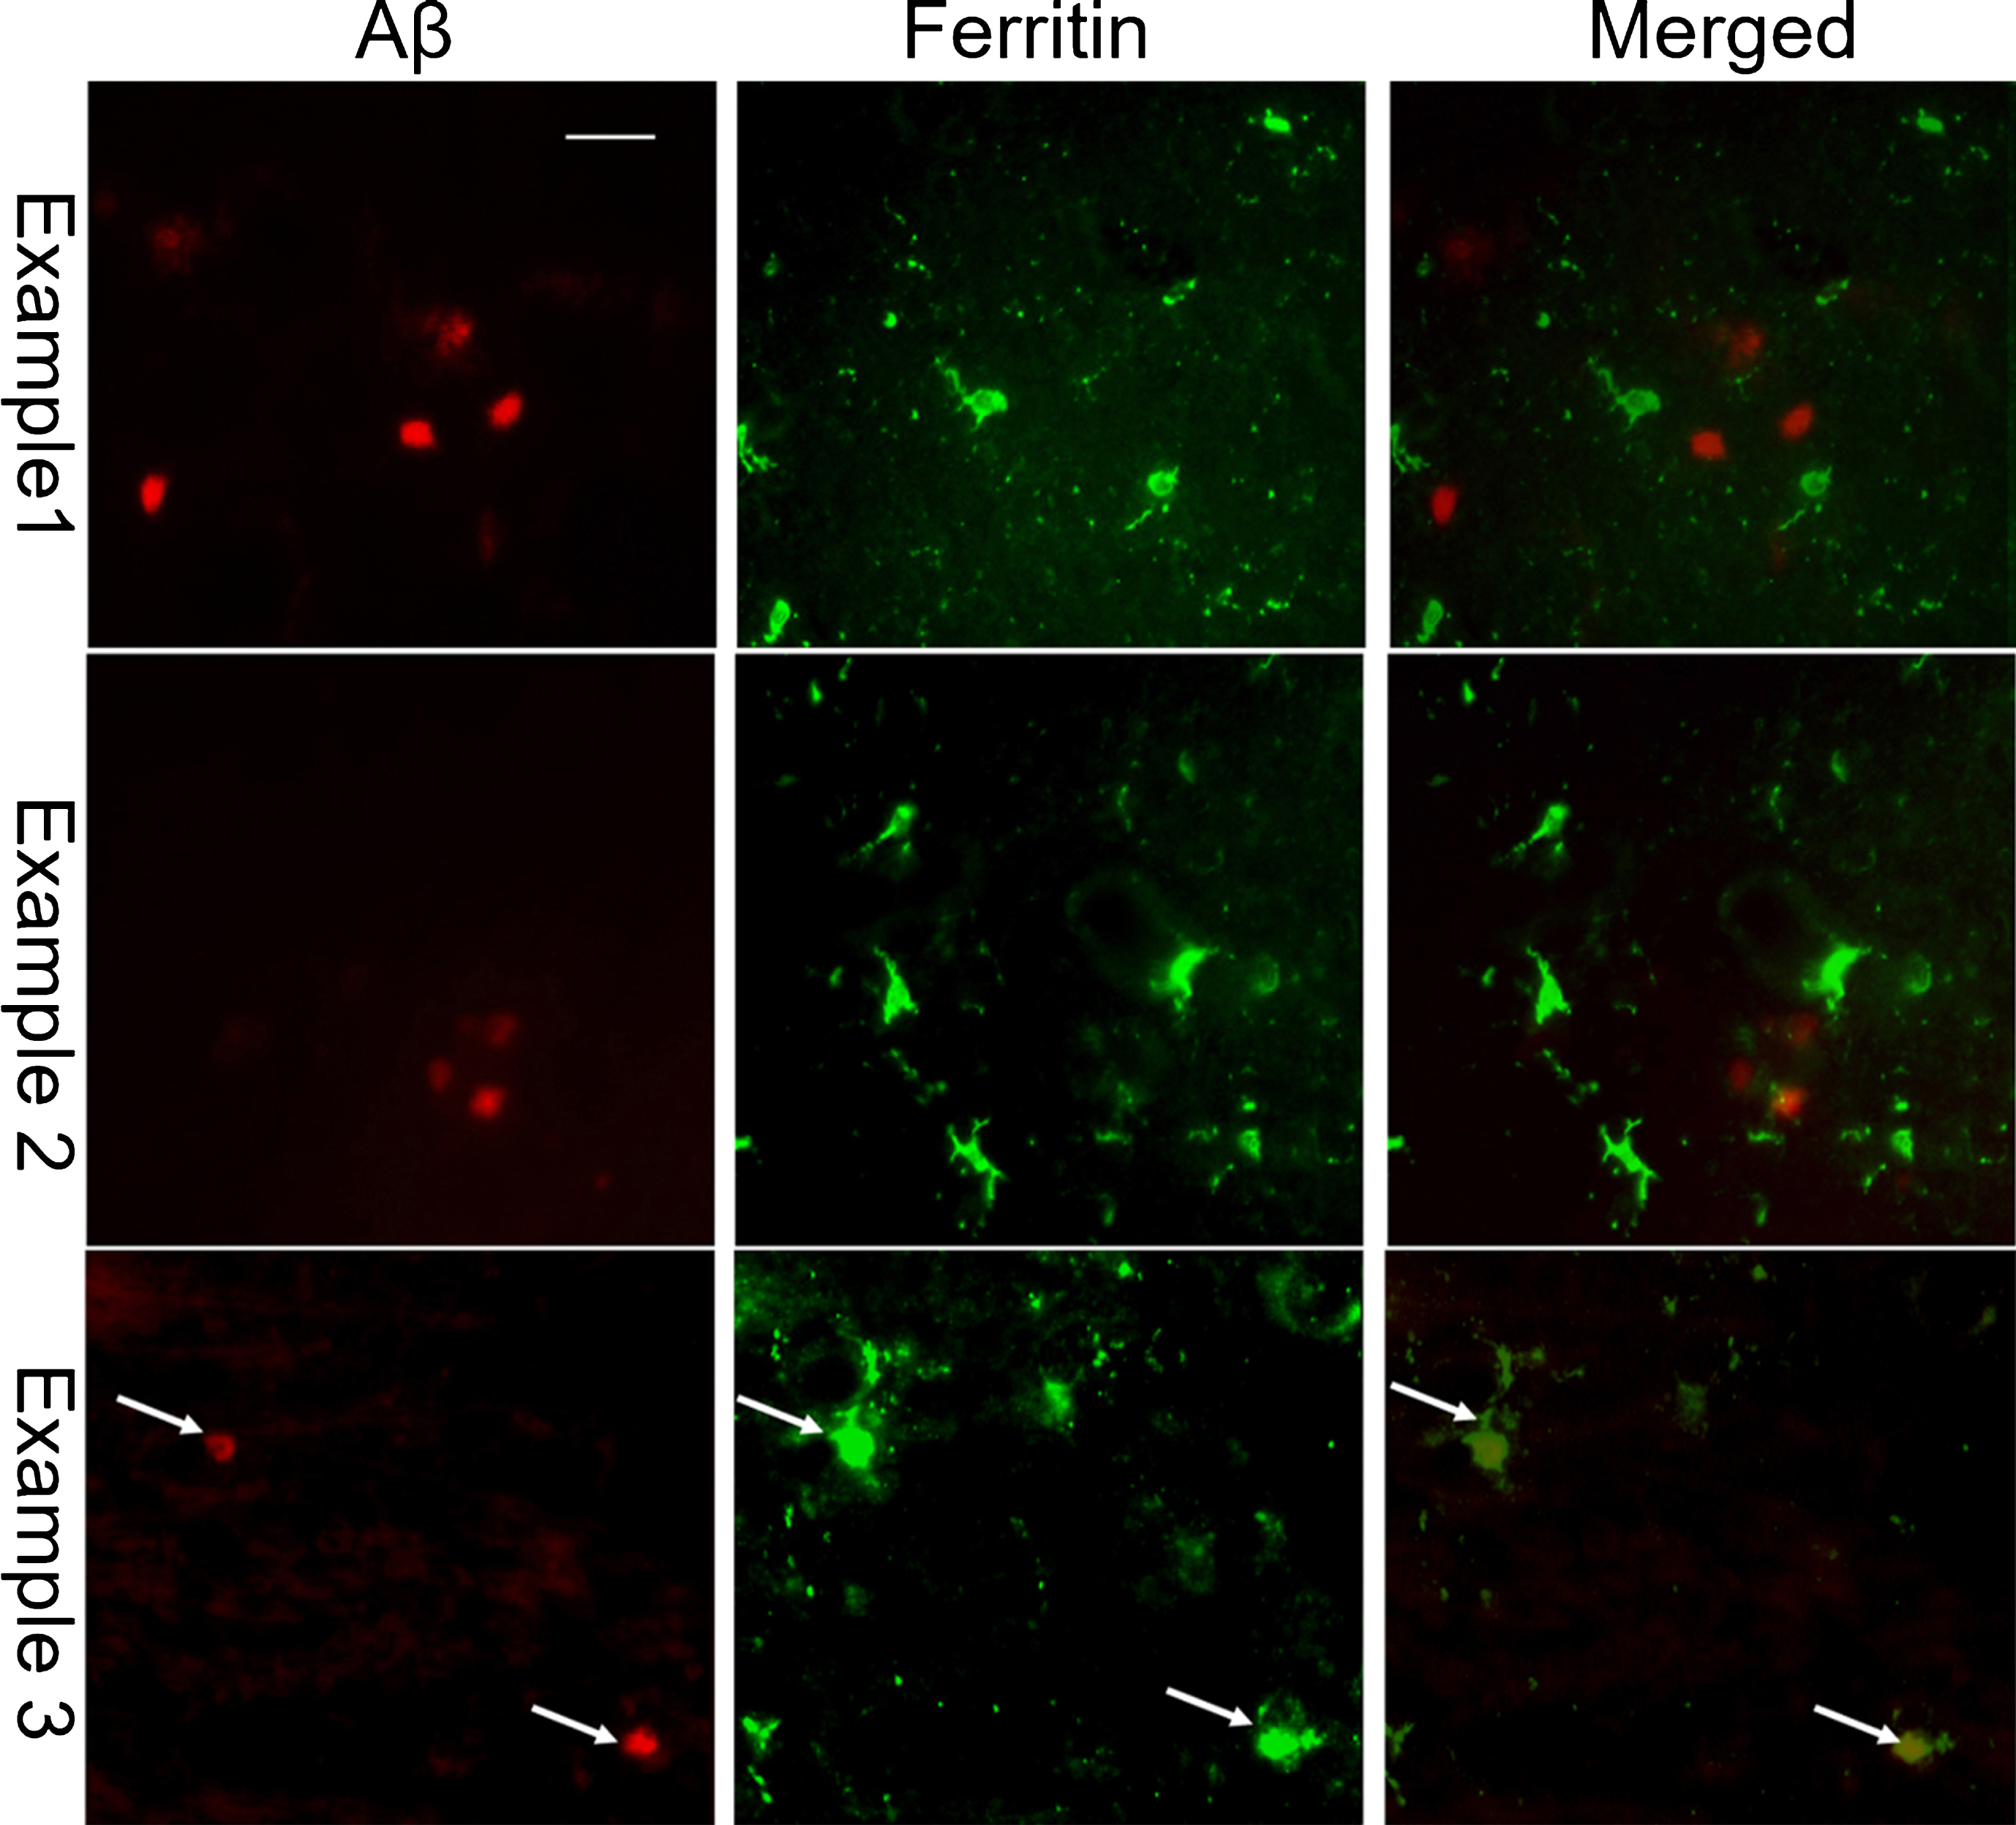
Aβ (left column; red) and ferritin (middle column; green) dual immunofluorescence in the temporal cortex of CH-fed rabbits reveals that ferritin-positive microglia closely associated with plaques (right column: merged images). The bottom row shows the examples of ferritin immunoreactivity found within an Aβ deposit (example 3, arrows). (Scale bar represents 50μm).
MPO immunoreactivity inside the active microglia and Aβ plaques in CH-fed rabbits
To determine if MPO was present in the active microglia, we performed dual immunofluorescence staining using MPO and CD11b antibodies (Fig. 7). Fluorescence microscopy revealed that MPO immunoreactivity was present in the cerebral cortex of CH-fed animals. No MPO positive immunoreactivity was found in the control rabbit brains (data not shown). Most of the MPO staining was present within the CD11b-positive microglia and MPO-positive microglia exhibited an activated morphology with dense CD11b fluorescence, an enlarged cell body and retracted processes. Within these same brain regions, we also evaluated dual Aβ and MPO staining in order to determine if MPO was present in or around amyloid plaques (Fig. 8). Qualitatively, most of the Aβ positive amyloid plaques were also MPO positive and these plaques were round with dense Aβ42 and MPO immunoreactivity.
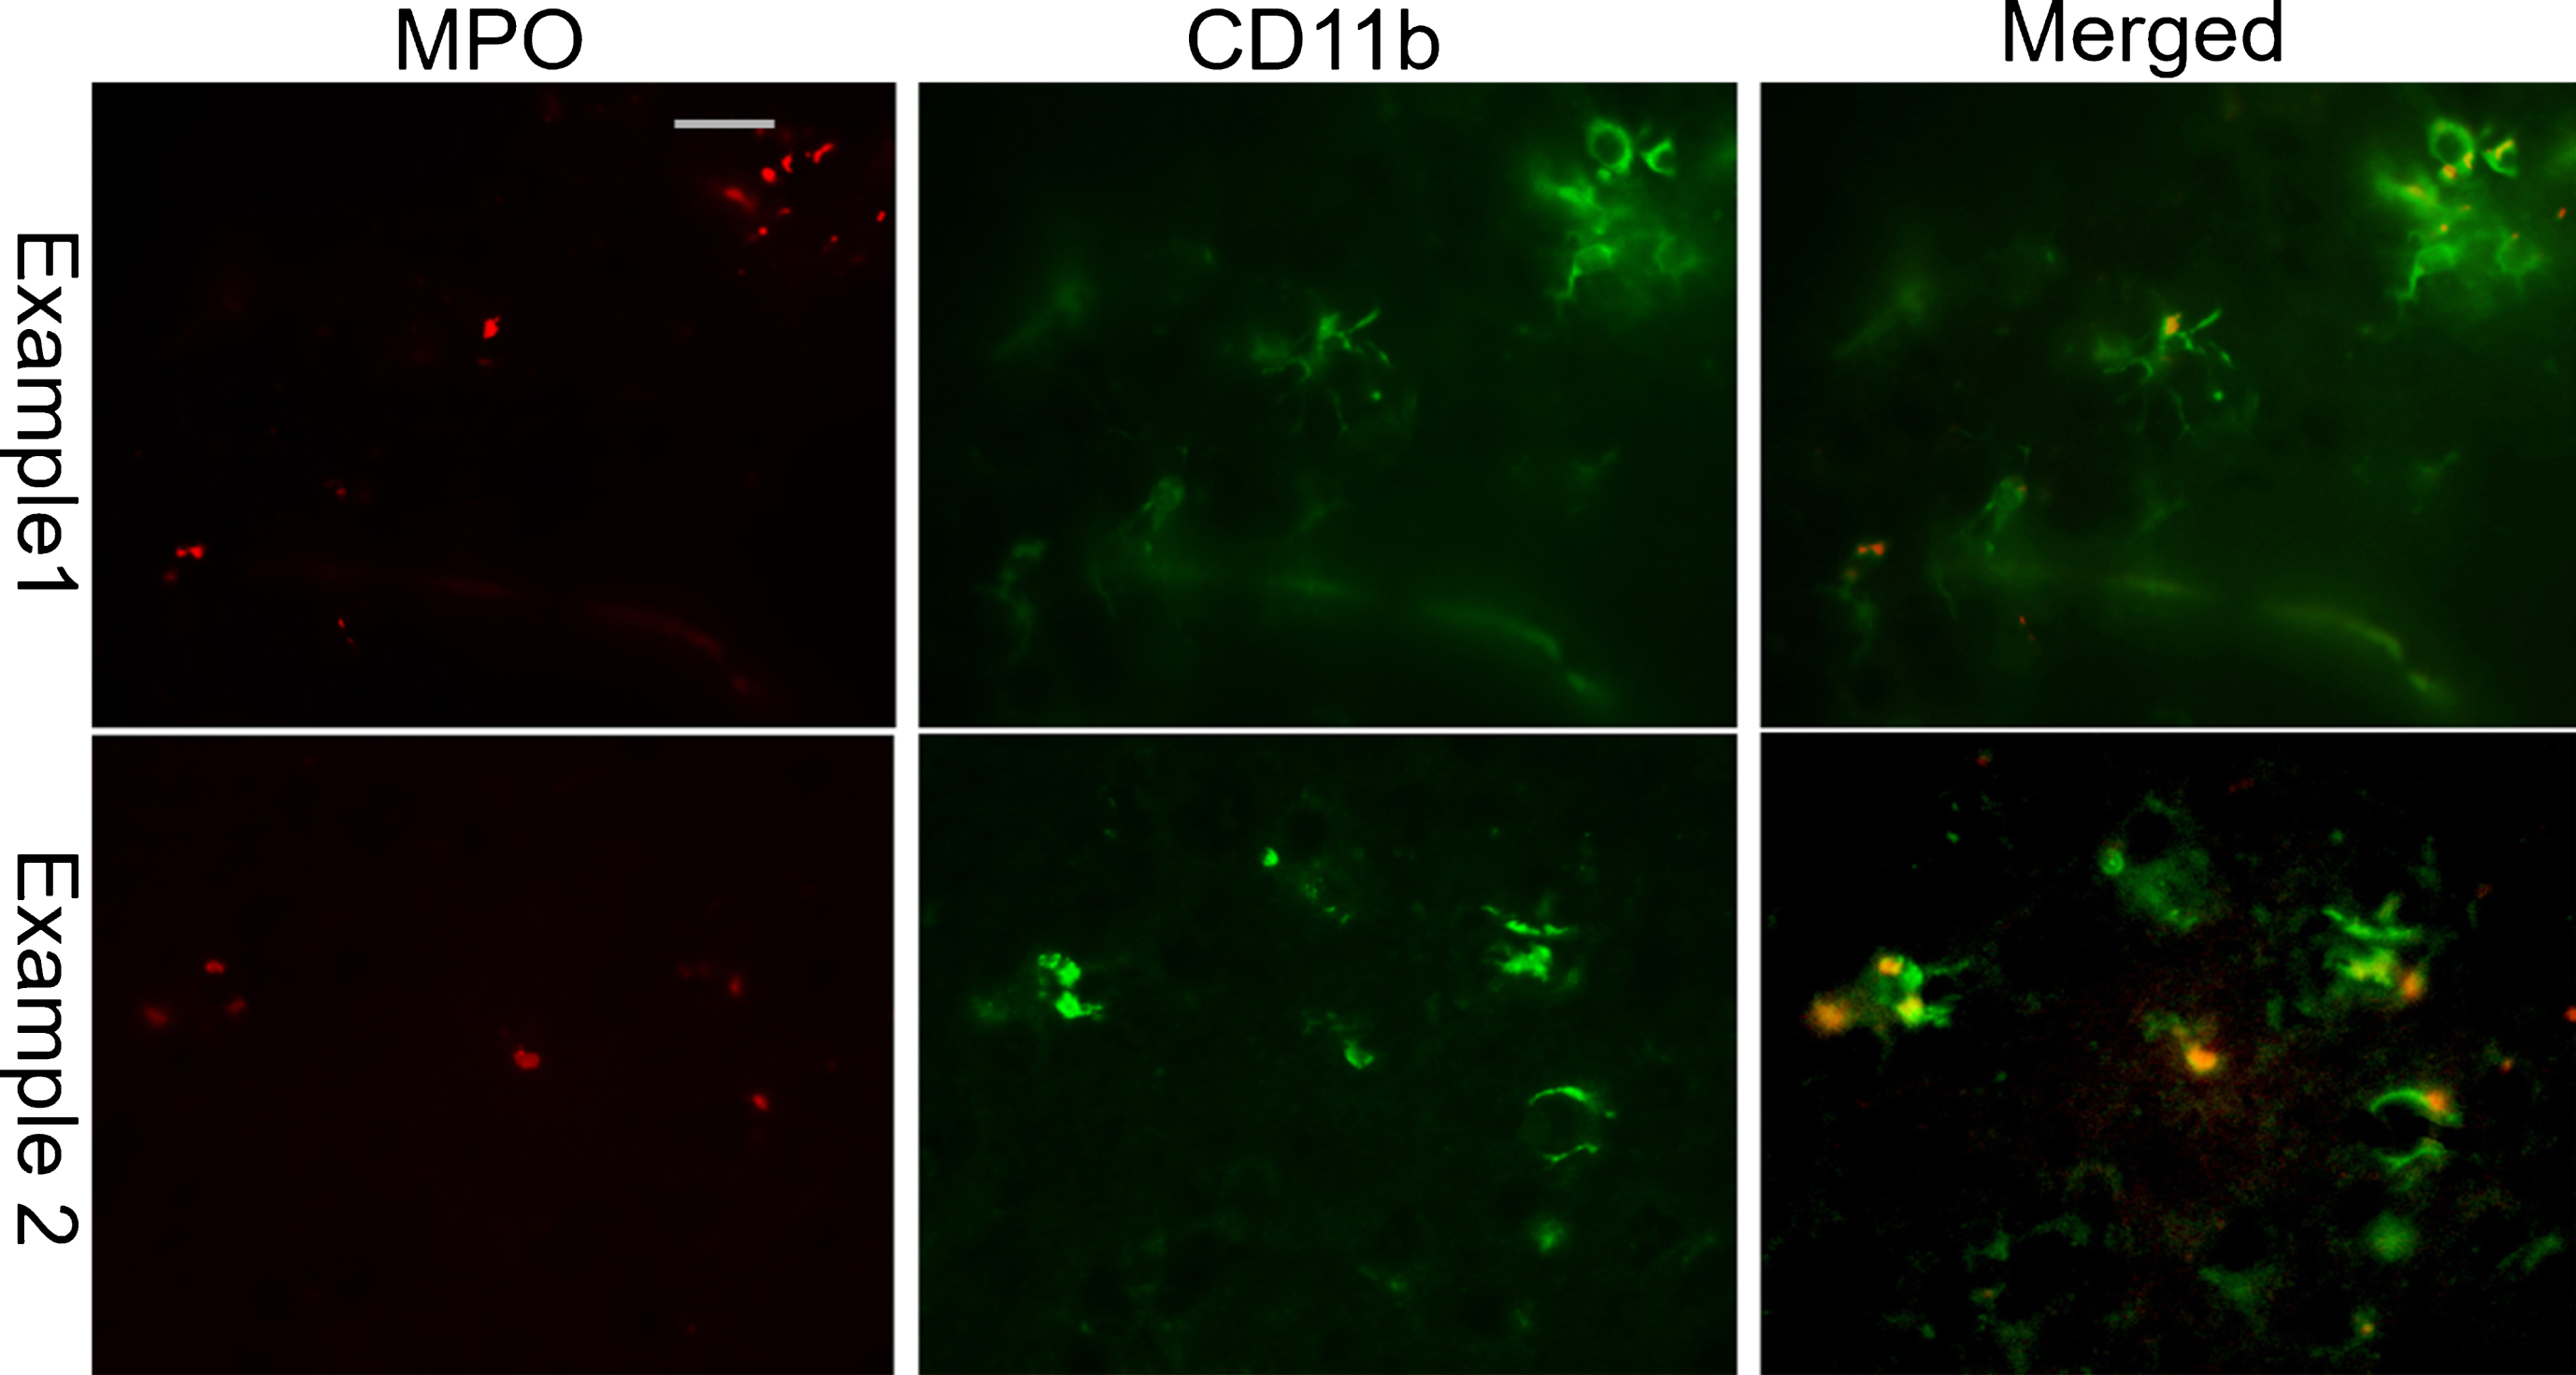
MPO (left column; red) and CD11b (middle column; green) dual immunofluorescence in the temporal cortex of CH-fed rabbits reveals that MPO immunoreactivity is present inside CD11b positive active microglia. (right column: merged images of CD11b and MPO double staining). (Scale bar represents 50μm).
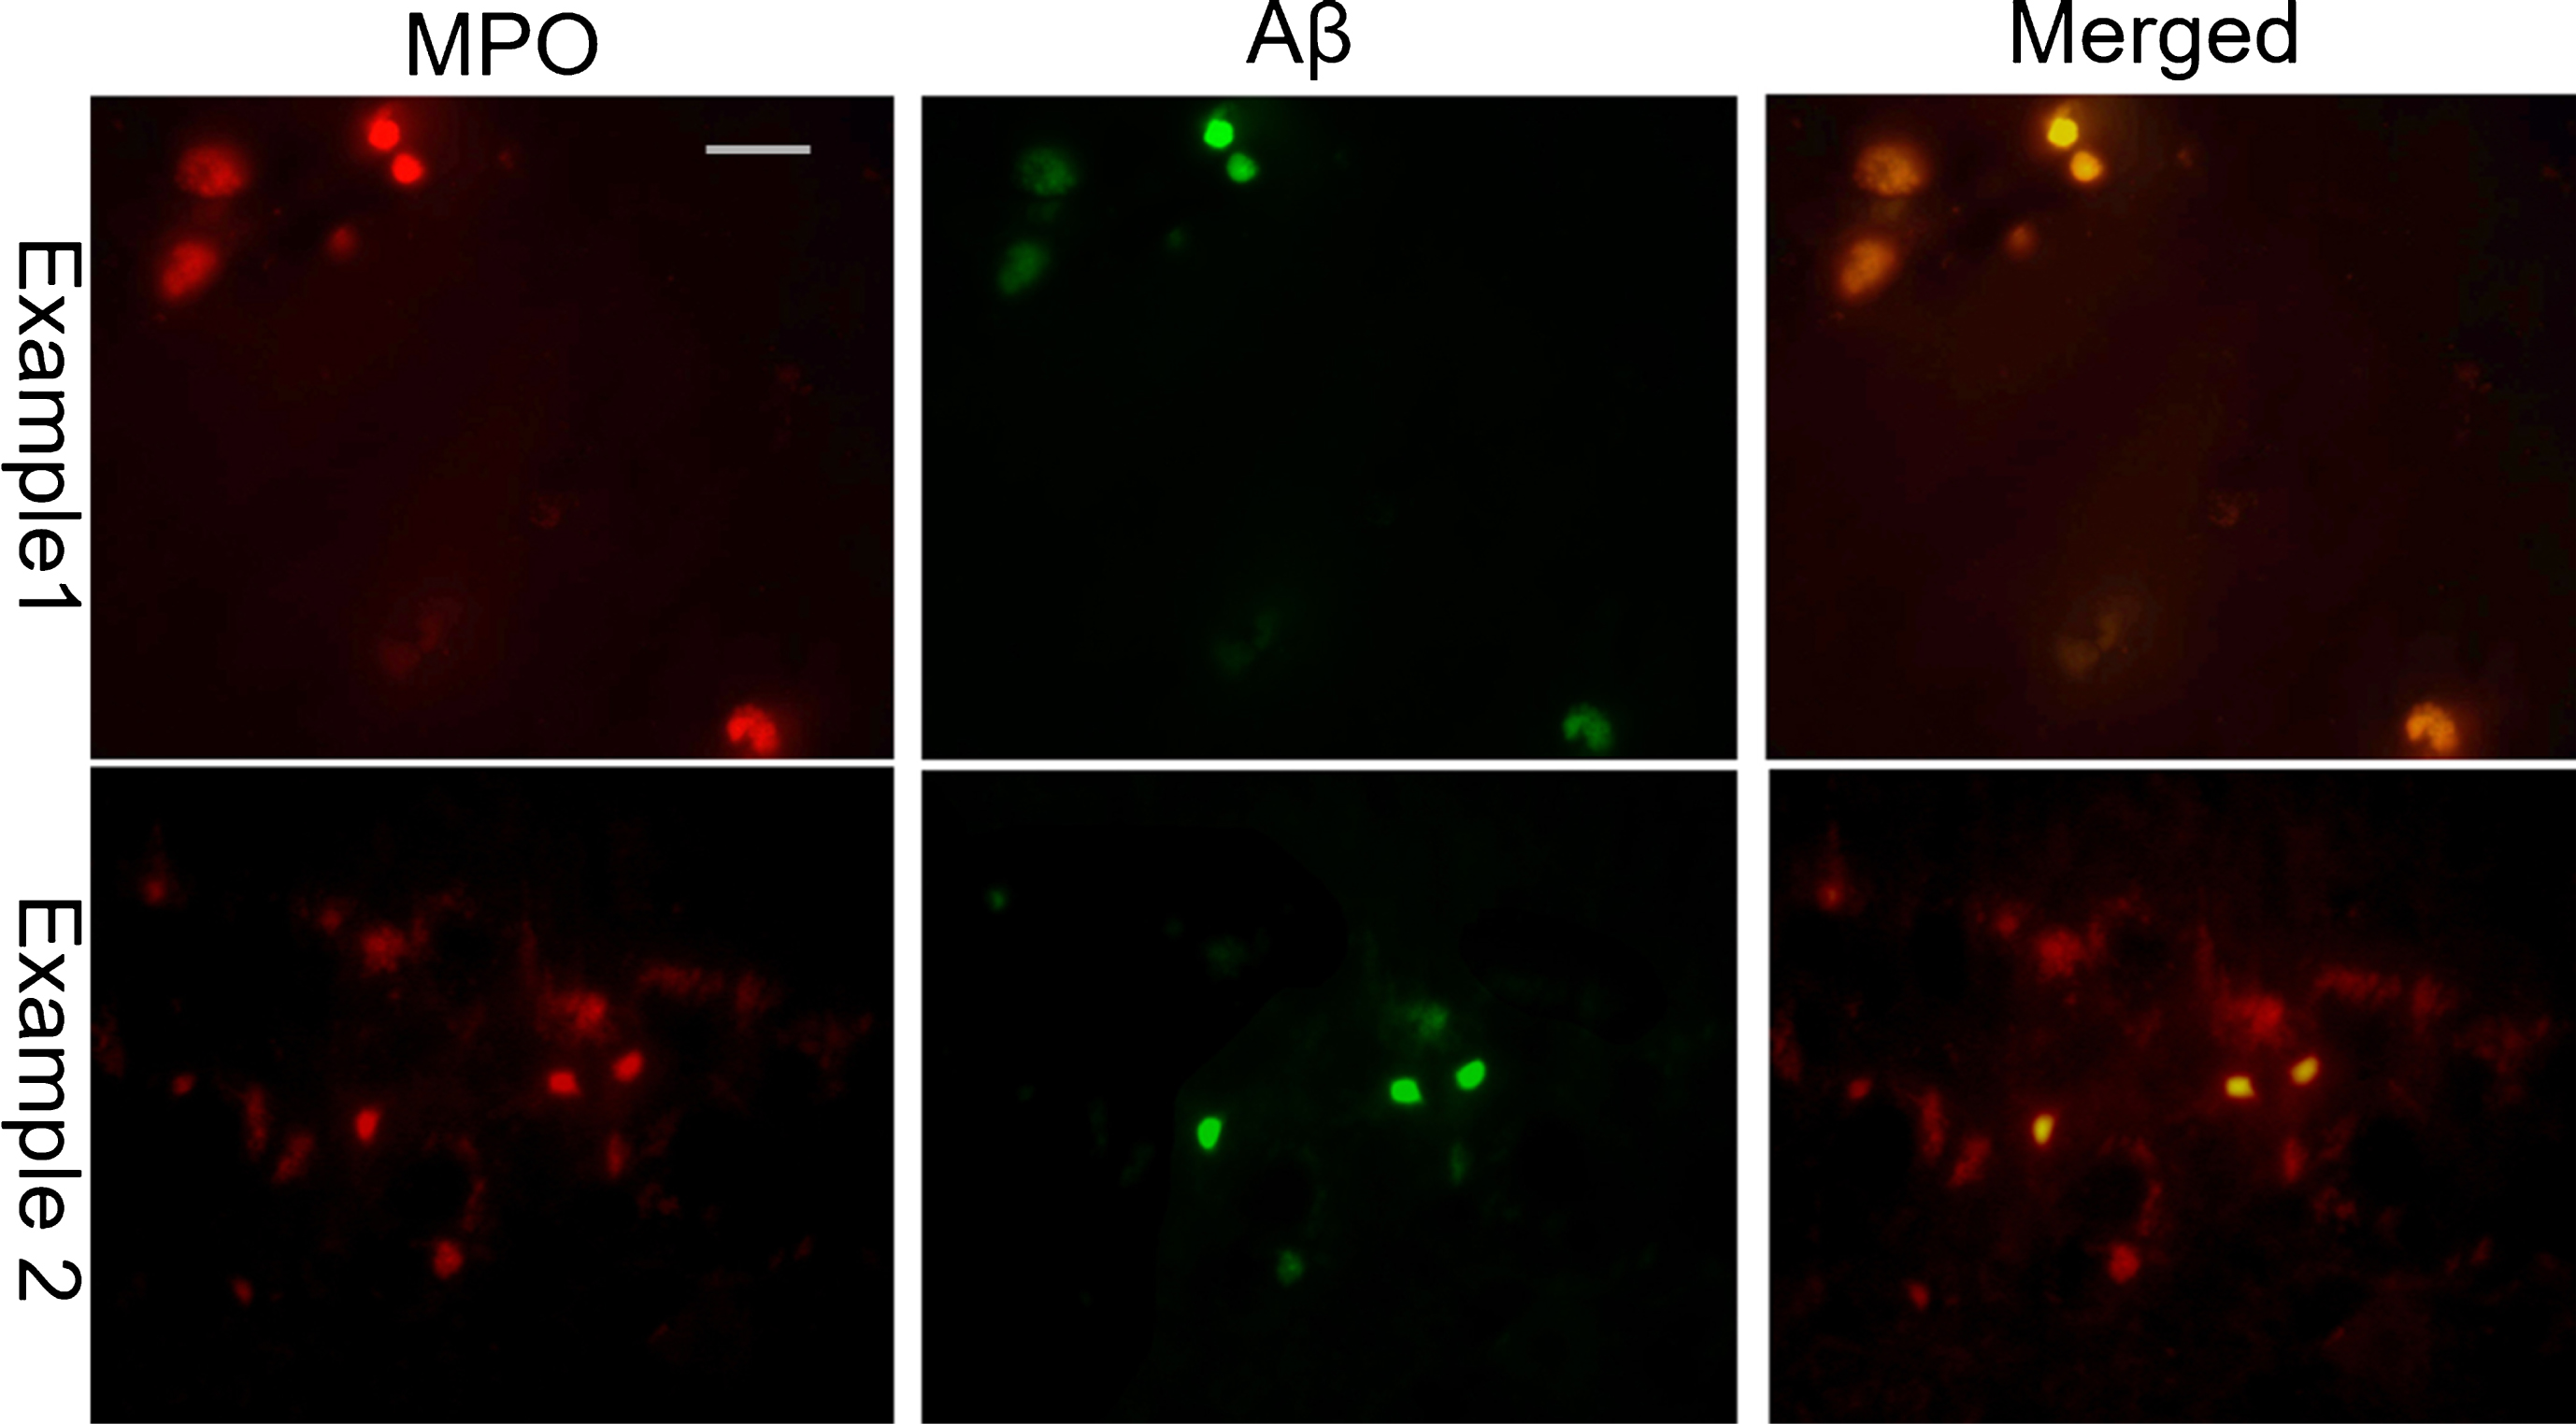
MPO (left column; red) and Aβ (middle column; green) dual immunofluorescence in the temporal cortex of CH-fed rabbits reveals the co-localization of MPO and amyloid plaques. The MPO-positive amyloid plaques were round in shape with dense immunolabelling for both Aβ and MPO. (right column: merged images of Aβ and MPO double staining). (Scale bar represents 50μm).
Microglia are resident (non-blood derived) microglia
Circulating monocytes are able to cross the blood-brain barrier and differentiate into fully functional microglia [44]. To determine whether microglia are resident or blood-derived, anti-CD45 immunostaining was performed on brain sections adjacent to CD11b stained sections (Fig. 9). To confirm our antibody staining was accurate, we first performed CD45 immunohistochemistry on the descending aorta dissected from CH-fed rabbits. CH-fed rabbits are known to form macrophage-infiltrated atherosclerotic plaques in the aorta [45], and CD45 immunostaining on the atherosclerotic aorta indicated a high-level of CD45 immunoreactivity by infiltrated macrophages (Supplemental Figure 2). In the brains of CH-fed rabbits, CD45 and CD11b immunostaining on adjacent sections showed that the CD11b-positive active microglia have weak or negative CD45 immunoreactivity (Fig. 9). Occasional CD45 immunoreactivity was sparsely distributed within the cortex and present in the lumen of the blood vessels, which did not associate with CD11b-positive cells.
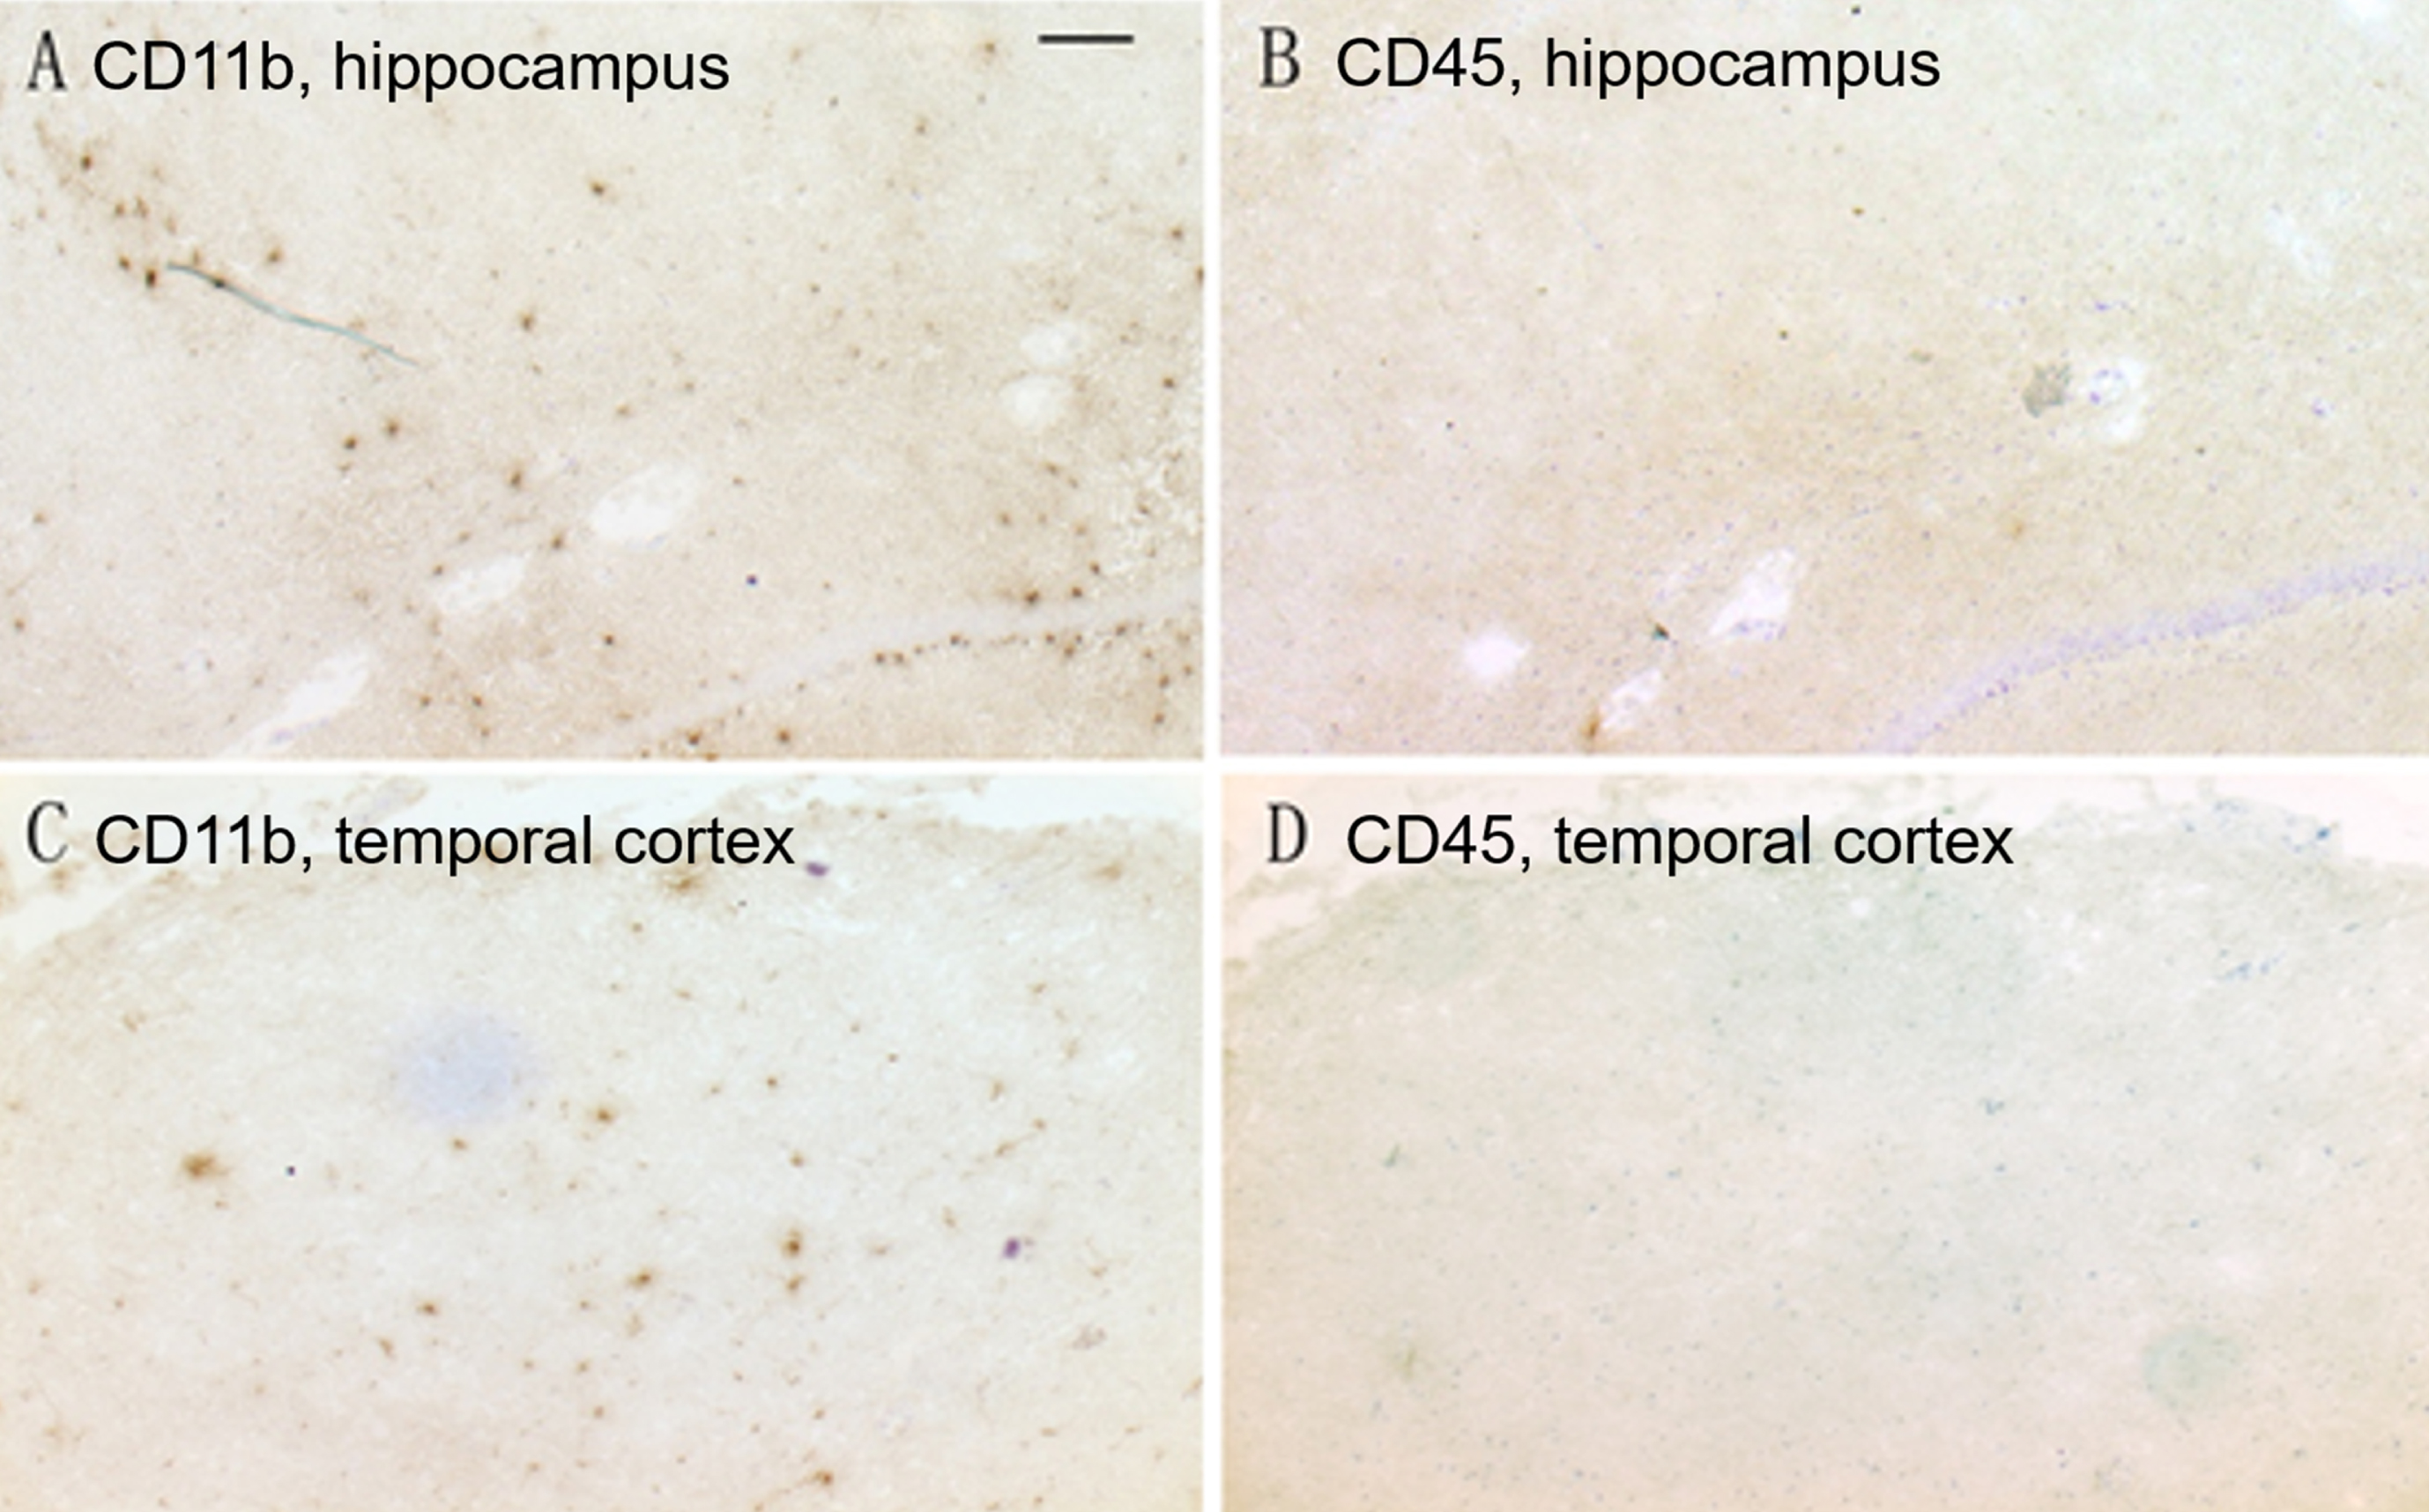
CD11b (A, C) and CD45 (B, D) immunohistochemistry on adjacent sections shows CD11b-positive activated microglia were present in the hippocampus (A, B) and temporal cortex (C, D) of CH-fed rabbits, but no CD45 immunoreactivity was found in adjacent sections. (Scale bar represents 50μm).
DISCUSSION
In this study, the male rabbits were used to constitute the experimental cohorts since the normal cholesterol levels in males are lower and do not change as much during the seasons as female rabbits. Unlike established CH-fed rabbit models of AD, which feed rabbits chow containing 1-2% w/w CH for a few months, we have developed a model that consists of feeding rabbits a 0.125–0.25% w/w CH diet for extended periods of time (28 months). Both Aβ immunostaining and Bielschowsky’s silver staining revealed that 5 out of 8 CH-fed rabbits formed extracellular Aβ deposits present in multiple regions including the hippocampus, parahippocampal gyrus, striatum, frontal cortex, parietal cortex, and temporal cortex. In this study, we show that these extracellular Aβ-positive plaques were often associated with activated MPO-reactive microglia, suggesting these microglia may play a role in plaque formation or become activated in response to amyloid deposition.
Microglia are a key component of the inflammatory response in the brain and have been found to be in close association with senile plaques in AD patients [5–9]. Initial clinical trials involving the treatment of patients with nonsteroidal anti-inflammatory drugs (NSAIDs) prior to the onset of AD have also shown that inhibiting the immune response reduces the occurrence of the disease [46–48]. Similarly, treatment of 5XFAD mouse model with the CSF1R inhibitor PLX3397s lead to ablation of microglia and reduced accumulation of amyloid plaques [49]. In the brains of CH-fed rabbits in our model, activated microglia were found to be present in close vicinity and occasionally directly in contact with Aβ plaques. Previous work has suggested that that inflammation is a causal component of onset or progression of AD rather than a consequence of the neurodegeneration [50–52]. Thus, future work in our model will evaluate the time course of microglia activation and Aβ plaque formation after initiation of our CH diet. This could be accomplished on separate cohorts of rabbits with similar histological studies as done in the present study, or alternatively by applying noninvasive molecular imaging technologies. For instance, positron emission tomography (PET) tracers for microglia (18F-FEPPA) and amyloid (11C-PIB) have been described [53]. We have also demonstrated that iron-sensitive MRI is capable of visualizing iron-laden plaques in this model [37], which could be used to evaluate when and where iron-laden plaques form in this model over time.
Active microglia are the major source of pro-inflammatory cytokines and oxidizing radicals such as superoxide, hydroxyl radicals, hydrogen peroxide, and nitric oxide which have been shown to promote neuronal injury [11–13]. MPO is a myeloid-specific enzyme which is present in circulating neutrophils and monocytes and generates an array of highly reactive oxidants that lead to tissue damage. Unlike macrophages in other parts of the body, MPO is not detectable in the quiescent microglia in normal brain tissue but is reported to be present in activated microglia near senile plaques. Evidence supports that the activated microglia contribute to AD pathology possibly through MPO-driven oxidation of Aβ peptide or apolipoprotein E, promoting their aggregation into insoluble complexes, or directly through oxidation-induced damage to associated neurons [16, 54]. It is noteworthy that exposure of Aβ1 - 42 to peroxidase and hydrogen peroxide was shown to cause dimerization through dityrosine crosslinks [24]. In our studies, we found that the activated microglia expressed MPO and that MPO immunoreactivity was also found to be present in the plaques, co-localizing with Aβ immunostaining, suggesting that this oxidative species is likely to be involved in plaque formation. A limitation of this study is that MPO enzymatic activity and the levels of downstream inflammatory cascades were not evaluated. Recent studies have revealed that MPO not only has catalytic activity that can activate inflammatory signaling cascades but also exhibits cytokine-like properties, stimulating mitogen-activated protein kinase activity, cell growth, protease activity, and influencing the immune responses and the progression of AD [55]. Future work focusing on studying MPO enzymatic activity and its downstream pathways in this model might allow one to better study the effects of these pathways on disease progression as well as permit testing of novel therapeutics targeting these pathways.
There is ongoing debate on the phagocytotic role of active microglia in clearing up Aβ deposits. In AD mouse models, the brain’s resident microglia, which are poorly phagocytic, are inefficient at degrading Aβ deposits [56, 57]. On the other hand, Simarsd et al. showed there are a second type of microglia of blood origin that are able to cross the blood-brain barrier [58]. In contrast to brain-resident microglia, these differentiated blood-derived microglia possess higher levels of antigen presentation and are more efficient at phagocytosis of amyloid deposits [44]. It has been proposed that removal of Aβ peptide is accomplished primarily by phagocytic microglia derived from blood monocytes. It is also reported that in neuroinflammatory diseases, increased CD11b expression corresponds to the severity of microglial activation [59, 60]. Morphologically, microglial activation involves intense ramification and cytoskeletal rearrangement in which changes in shape and motility correlate with increased expression of CD11b [61]. CD45 is a transmembrane glycoprotein which is expressed at high levels on the cell surface, and its presence distinguishes leukocytes from non-hematopoietic cells [62–64]. Fluorescence activated cell sorting and immunocytochemistry results have shown that resident parenchymal microglia possess the phenotype CD11b-high and CD45-low, whilst other blood-derived microglia and peripheral macrophages exhibit the phenotype CD11b-high and CD45-high [62–64]. In the brains of CH-treated rabbits, active microglia possessed a CD11b-high and CD45-low phenotype, suggesting their non-blood origin and that they may not be involved in Aβ clearance.
In summary, this rabbit model provides an opportunity to dynamically investigate the effects of hypercholesterolemia and microglial activation on AD pathogenesis, for tracking AD progression over time and is a suitable dietary-based model for investigating novel therapies on AD progression and regression.
DISCLOSURE STATEMENT
Authors’ disclosures available online (https://www.j-alz.com/manuscript-disclosures/18-0714r1).