
Abstract
Lack of a unitary operational definition of mild cognitive impairment (MCI) has resulted in mixed prevalence rates and unclear predictive validity regarding conversion to dementia and likelihood of reversion. We examined 1,721 nondemented participants aged 65 and older from the Adult Changes in Thought (ACT) community-based cohort. Participants were followed longitudinally through biennial visits (average years assessed = 5.38). Categorization of MCI was based on: 1) deviation of neuropsychological test scores from a benchmark based on either standard or individualized expectations of a participant’s mean premorbid cognitive ability, and 2) cutoff for impairment (1.0 versus 1.5 standard deviations [sd] below benchmark). MCI prevalence ranged from 56–92%; using individualized benchmarks and less stringent cutoffs produced higher rates. During follow-up, 17% of the cohort developed dementia. Examination of sensitivity, specificity, and predictive validity revealed that the criterion of 1.5 sd from the standardized benchmark was optimal, but still had limited predictive validity. Participants meeting this criterion at their first visit were three times more likely to develop dementia and this increased to seven times if participants had this diagnosis at the second timepoint as well. Those who did not have an MCI diagnosis at their first visit, but did at their second, had a significant increase of risk (but to a lesser extent than those diagnosed at both visits), while those who had an MCI diagnosis at their first visit, but not their second, did not have a significantly increased risk. These results highlight how assessing MCI stability greatly improves prediction of risk.
INTRODUCTION
Mild cognitive impairment (MCI) is defined as a disorder in which an individual demonstrates greater than normal age-related changes in cognition without accompanying functional impairment [1]. MCI is often considered an intermediary state between normal aging and dementia and, as such, has been recognized as a potentially important diagnostic feature in assessing risk of later dementia [2, 3]. However, researchers and clinicians have yet to implement a unitary operational definition of MCI, which has resulted in mixed predictive validity of the diagnosis and thus limited its usefulness [4–6]. Additional study has the potential to calibrate the clinical determination of MCI for increased predictive validity and better understanding of MCI over time, especially the factors which might influence conversion and reversion.
Historically, two main strategies for assessing MCI have been pursued. The first method, originally proposed by Petersen and colleagues [3], compares neuropsychological test scores to age-based normative data, while a second method compares neuropsychological test scores to an individualized benchmark [7]. The latter method is thought to address individual differences and detect subtle changes in cognition at the earliest stage of decline. Other diagnostic features, such as the specific cutoff for defining impairment, the number and types of cognitive tests considered, and the presence or absence of subjective concerns, can also differ across MCI operationalization. Moreover, using MCI subtypes, such as those proposed by Petersen [8], have not only provided useful information for clinical characterization, but also for the likelihood of conversion to dementia. For example, some research has shown that those with amnestic and multidomain MCI are at higher risk of developing Alzheimer’s disease compared to those in the nonamnestic or single domain categories [9, 10]. Some studies found different results [4], but varying MCI criteria are a possible explanation.
Due to heterogeneity in MCI diagnostic criteria and populations studied, rates of MCI prevalence and conversion to dementia vary widely. MCI prevalence rates commonly range from 10–50% [12–19]; however, rates as extreme as 1–92% are also reported [12, 20]. In a previous study, we applied several sets of diagnostic criteria and found that prevalence rates in a single community-based sample ranged from 11 to 92%, with the highest prevalence resulting from use of individualized benchmarks, less severe impairment cutoff (–1.0 sd), and required impairment on only a single test [20]. Longitudinal studies that followed participants between 2 to 10 years have found MCI to dementia conversion rates ranging from 15–42% and much of this variability is attributed to differences in MCI diagnostic criteria [5, 21–27]. For example, a meta-analysis found conversion rates of 4.9% in community samples and 9.6% in clinic samples; but these rates increased to 5.2% and 11.7%, respectively, if different diagnostic criteria were applied [28].
Interpreting conversion rates can be further complicated by the fact that reversion rates are rarely discussed or examined. Of studies that did report reversion rates, the rates once again ranged greatly, from 4–48%; though a reversion rate of 33% is typically accepted among professionals [13, 32]. Studied even less is how MCI diagnosis over multiple evaluations is considered when estimating risk of dementia. Some research suggests that a stable MCI diagnosis significantly predicts dementia risk, while a nonstable MCI diagnosis does not increase risk [33]. However, other research has shown that those diagnosed with MCI at any time point, including those who revert, are at an increased risk of dementia [34]. Poor MCI diagnostic stability has resulted in misunderstandings of how MCI diagnosis is related to risk of dementia. In fact, a survey found that 20% of American neurologists agreed that MCI is better described as early Alzheimer’s disease [29], even though research on conversion rates does not support this supposition [4]. Moreover, because of inadequate diagnostic stability, it has been difficult to employ interventions prior to the onset of dementia, and this is often thought to be one reason why many drug-trials have shown limited efficacy [30].
The purpose of this study was to utilize longitudinal data from a community-based cohort to describe MCI prevalence using different diagnostic operationalizations of MCI and to explore the best approach for predicting conversion from MCI to dementia. This will not only increase our understanding of MCI prevalence and dementia incidence in a community-based sample, but will also shed light on how best to use MCI diagnostic criteria. Moreover, this study will examine how MCI diagnostic stability over two timepoints can provide important information about risk of dementia, which could prove valuable when implementing early interventions or devoting resources, by identifying those individuals at highest risk of developing dementia.
METHODS
Participants
This study examined a subset of 2,095 participants from the Adult Changes in Thought (ACT) study. The ACT study has a key outcome of dementia incidence and its methods have been previously described in detail [35, 36]. Briefly, the cohort is a population-based sample of older adults aged 65 and older without evidence of dementia at the time of enrollment. The sample was randomly selected from patients of greater Seattle area clinics within an established, large health maintenance organization. As a result, the ACT cohort is predominately white and highly educated (Table 1). ACT participants are followed through biennial visits. At the initial evaluation, as well as at every subsequent evaluation, participants are administered the Cognitive Abilities Screening Instrument (CASI) [37], a standardized cognitive screening measure similar to the Modified Mini-Mental State Examination [38]. Other measures assessing physical function, well-being, and general medical information are also administered. If at any follow up point, a participant scores an 86 or below on the CASI (0–100 points possible), they are referred for a full dementia evaluation. Within the overall ACT methodology, a dementia evaluation can also be triggered based on observation of a decline in function or cognitive concerns raised by either the participant, a family member, or ACT staff. As part of the dementia evaluation, additional cognitive data are collected and a consensus case conference is held, including study physicians, a neuropsychologist, and nursing personnel, all with expertise in dementia. Dementia diagnosis is determined using DSM IV standardized diagnostic criteria [39] and the National Institute of Neurological and Communicative Diseases and Stroke/Alzheimer’s Disease and Related Disorders Association (NINCDS-ADRDA) criteria [40]. This includes review of the participant’s functional status and other medical history.
Demographics of study sample and ACT cohort
*p < 0.001.
During a discrete time period of additional funding (2008-2011; NIA R01AG024180), non-demented but otherwise unselected ACT participants were administered a battery of neuropsychological measures (described below) at each of their biennial visits, in an addition to the CASI. The current study includes only those participants who completed the neuropsychological battery at biennial visits during this time period; it was these cognitive data that were used to determine MCI status. Therefore, when we refer to “first visit” in the manuscript, we are referring to the first administration of the aforementioned neuropsychological battery, not participant’s first visit as part of the ACT study. If the participants of this sub-study triggered a full dementia evaluation, they underwent the same dementia consensus process described above.
This study was approved by the institutional review boards of the Kaiser Permanente Washington Health Research Institute (KPWHRI), and the VA Puget Sound Healthcare System. ACT participants gave informed consent via processes authorized by the KPWHRI Institutional Review Board.
Materials
As noted, participants were administered neuropsychological tests, in addition to the CASI, at each biennial visit from 2006–2011. This test battery included measures covering five cognitive domains: 1) Memory (Logical Memory Immediate and Delay Recall from the Wechsler Memory Scale-revised [WMS-R] [41]); Constructional Praxis Copy Delay from the Consortium to Establish a Registry for Alzheimer’s disease [CERAD] neuropsychological battery [42]), 2) Attention/processing speed (Trail Making Test, Part A [43]), 3) Language (supermarket category fluency [44]), 4) Visuospatial/construction (Constructional Praxis Copy from the CERAD neuropsychological battery [42]), and 5) Executive functioning (Trail Making Test, Part B [43], Letter F Fluency [44]).
Raw scores from cognitive tests were transformed into z-scores using published normative data. Normative data were chosen based on the demographics of the ACT population; as such, the normative samples included individuals that were older in age, higher in education, and primarily white. To minimize the variability between normative samples, we used Mayo’s Older Americans Normative Studies (MOANS) [45] data when possible. Age adjusted norms were used for WMS-R Logical Memory [46], fluency measures [47], and the Trail Making Test [47]. Age, education, and gender adjusted norms were used for the CERAD Constructional Praxis [48].
Individualized estimate of premorbid ability
The Shipley-2 Vocabulary test [49], referenced from hereon as the “Shipley-2”, was used as an estimate of premorbid ability. This test assesses vocabulary knowledge by requiring participants to read a target word and identify its synonym out of four other words. It is considered a measure of crystallized intelligence, resistant to age-related decline and brain disease [50]. Some participants were administered the Shipley-2 more than once. Although there was little variability in Shipley-2 scores across visits, participants’ first Shipley-2 score was chosen to represent each participant’s individualized benchmark. Scores were transformed into z-scores using normative data published in the test manual [49]. Similar to the measures included in the rest of the neuropsychological test battery, the Shipley-2 was selected for the above reasons and because its normative sample has demographics similar to those in the ACT study [49].
MCI diagnosis
As modeled after Trittschuh and colleagues [20], we chose an operational definition of MCI that closely aligns with the diagnosis of cognitive impairment, no dementia (CIND), which has also been used in several other population-based studies [51, 52]. CIND criteria is determined by having cognitive impairment in one or more domains that is not severe enough to be classified as dementia. This definition does not take into account subjective memory complaints. Four MCI subtypes were generated for each MCI diagnostic category: 1) MCI single domain, amnestic; 2) MCI multiple domain, amnestic; 3) MCI single domain, nonamnestic; and 4) MCI multiple domain, amnestic based on Petersen and colleagues’ criteria [8]. Performance on delayed memory measures was used to determine inclusion in the amnestic groups [53]. A 2×2 factorial design of MCI criterion was applied using the following factors:
MCI stability
To further expand on how MCI diagnosis over time impacts dementia risk, we also examined participants’ stability of MCI diagnosis across their first two biennial visits during the study time period. To do this, we performed additional analyses using the MCI operationalization with the best sensitivity and specificity. Then, using this MCI criterion, we created the following four groups: 1) No MCI (participants who did not receive an MCI diagnosis at their first or second visit), 2) Revert (participants who received an MCI diagnosis at their first visit, but not their second), 3) Decline (participants who did not receive an MCI diagnosis at their first visit, but did at their second visit), and 4) MCI x2 (participants who received an MCI diagnosis at both visits).
Statistical analyses
In order to ensure that our sample was an accurate representation of the greater ACT cohort, we conducted t-tests to determine whether any differences in mean age or education were present. Chi-square test was also used to detect any differences in participant-reported sex. Frequency analyses were conducted to examine prevalence rates of various MCI criteria/subtypes at first assessment. Crosstabulations were used to calculate sensitivity, specificity, and positive and negative predictive validity of dementia conversion for each MCI criterion/subtype. Cox regression was used to examine risk of developing dementia using the optimal MCI criterion at first assessment and over time controlling for age. SPSS statistical software was used to conduct all analyses.
RESULTS
There were no statistical differences in education, sex, or baseline CASI score between the larger ACT cohort and our sample (Table 1), although the larger ACT cohort had a lower mean age (M = 74 years compared to M = 78 years). Out of an initial 2,095 ACT subsample, 8 participants were removed because they had three or less cognitive measures contributing to their diagnostic profiles. An additional 370 participants were removed because they had not completed the Shipley at any one of their visits and, thus, had no individualized benchmark. Two participants were removed because their Shipley score was greater than two standard deviations from the mean. As such, 1,721 participants were included in the final analyses. Comparison statistics revealed that our final sample did not significantly differ from the larger sample on age, education, race, sex, or initial CASI score (see Table 1). However, when comparing those who did have Shipley scores to those who did not, the participants without a Shipley score had significantly lower education and initial CASI scores, and higher rates of conversion to dementia. As such, it is presumed that the group of participants without a Shipley score likely had a higher level of cognitive impairment at the outset. Table 2 provides the self-reported comorbid conditions for the sample. Of note, participants with comorbid medical and psychological factors were not excluded from the sample.
Self-reported comorbid conditions in the sample
*Coronary heart disease is defined as history of myocardial infarction, angina, coronary artery bypass graft (CABG), or angioplasty. **Cerebrovascular disease is defined as history of stroke, transient ischemic attack, or carotid endarterectomy. +Based on the Center for Epidemiologic Studies Depression Screen (CES-D).
MCI prevalence rates
Table 3 shows prevalence rates of those diagnosed with any-subtype MCI at their first visit using varying MCI criteria. Prevalence rates ranged from 43–87%, with the most conservative rate using a 1.5 sd cutoff from the standardized benchmark and the most liberal rate using a 1.0 sd cutoff from individualized benchmarks. When considering the overall prevalence rates as a function of MCI subtype, we observed percentile ranges of 19–27% for those with amnestic, single domain MCI, 7–24% for those with amnestic, multi-domain MCI, 5–7% for those with nonamnestic, single domain, and 9–39% for those with nonamnestic, multi-domain MCI (Table 4). Figure 1 demonstrates the breakdown of MCI-subtypes using the criterion of 1.5 sd from the standardized benchmark.
Prevalence and conversion rates (with sensitivity and specificity) of any MCI diagnosis at first visit by multiple diagnostic criteria
1Benchmark: comparison of cognitive test scores to standard diagnostic criteria or an individualized benchmark (determined by Shipley-2 performance). 2Severity of impairment: the amount of deviation from the mean required to indicate impairment (1.0 or 1.5 sd). PPV = Positive Predictive Validity, NPV = Negative Predictive Validity.
Prevalence of MCI Subtypes at Baseline
1Benchmark: comparison of cognitive test scores to standard diagnostic criteria or an individualized benchmark (determined by Shipley-2 performance). 2Severity of impairment: the amount of deviation from the mean required to indicate impairment (1.0 or 1.5 sd). PPV = Positive Predictive Validity, NPV = Negative Predictive Validity.
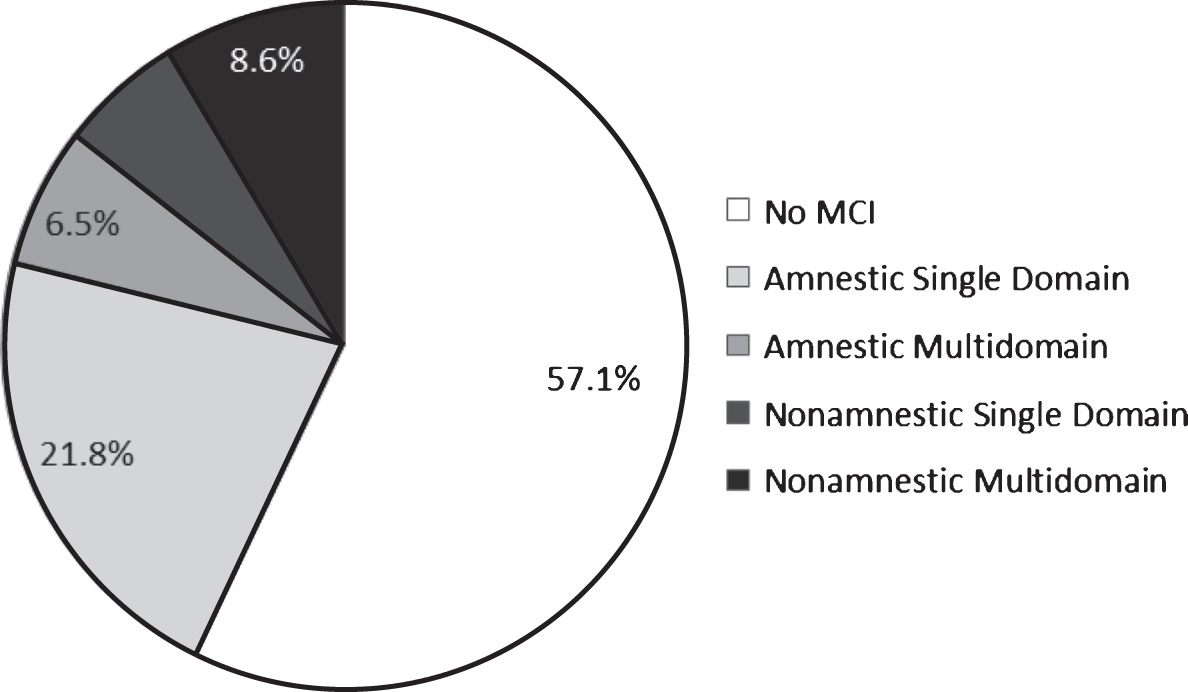
Breakdown of MCI-subtypes using the criteria of 1.5 sd from the standardized benchmark.
Predicting conversion to dementia
Of the 1,721 participants, 292 (approximately 17%) were diagnosed with dementia over follow-up. Mean years assessed was 5.2 (sd = 1.8; range = 1–10 years). Table 3 shows the sensitivity, specificity, and positive and negative predictive power of dementia diagnosis for each MCI criteria. Table 4 shows the same predictive values for each MCI subtype. Sensitivity ranged from 68.4–92.1%, with individualized benchmarks and a 1.0 sd cutoff value providing the highest sensitivity. In contrast, specificity ranged from 14–62%, with standardized benchmarks and a 1.5 sd cutoff value producing the highest specificity. Positive and negative predictor power were relatively better when using standardized benchmarks regardless of cutoff values, with values ranging from 18–27% and 89–95%, respectively. Looking across predictor values, using an MCI criterion of 1.5 sd from the standardized benchmark appeared to be the best criterion for predicting dementia as this was the only criterion that had neither specificity or sensitivity values in the unacceptable range, although neither of the values fell in the good to excellent range. Further analysis of varying MCI subtypes revealed that the nonamnestic multidomain MCI diagnosis was the best MCI category for predicting dementia.
Hazard ratios
Based on the previous analyses, using an MCI diagnostic criterion of 1.5 sd from the standardized benchmark has the optimal sensitivity, specificity, and predictive validity relative to the other diagnostic criteria examined. As such, this diagnostic criterion was used to further examine the risk of developing dementia using Cox Regression Hazard Ratio analyses. To account for potential confounding variables, the analyses were first ran by covarying for the following demographic factors known to be associated with dementia: age, education, sex, and race. The only covariate that significantly contributed to the model was age; therefore, the final model only included age as a covariate. The primary predictor variable was whether the participant was diagnosed with MCI at their first visit using a criterion of 1.5 sd from the standardized benchmark. The results revealed that, when controlling for age, participants who received an MCI diagnosis at their first visit were 3.1 times more likely to develop dementia, p < 0.001 (CI: 2.5–4; Fig. 2).
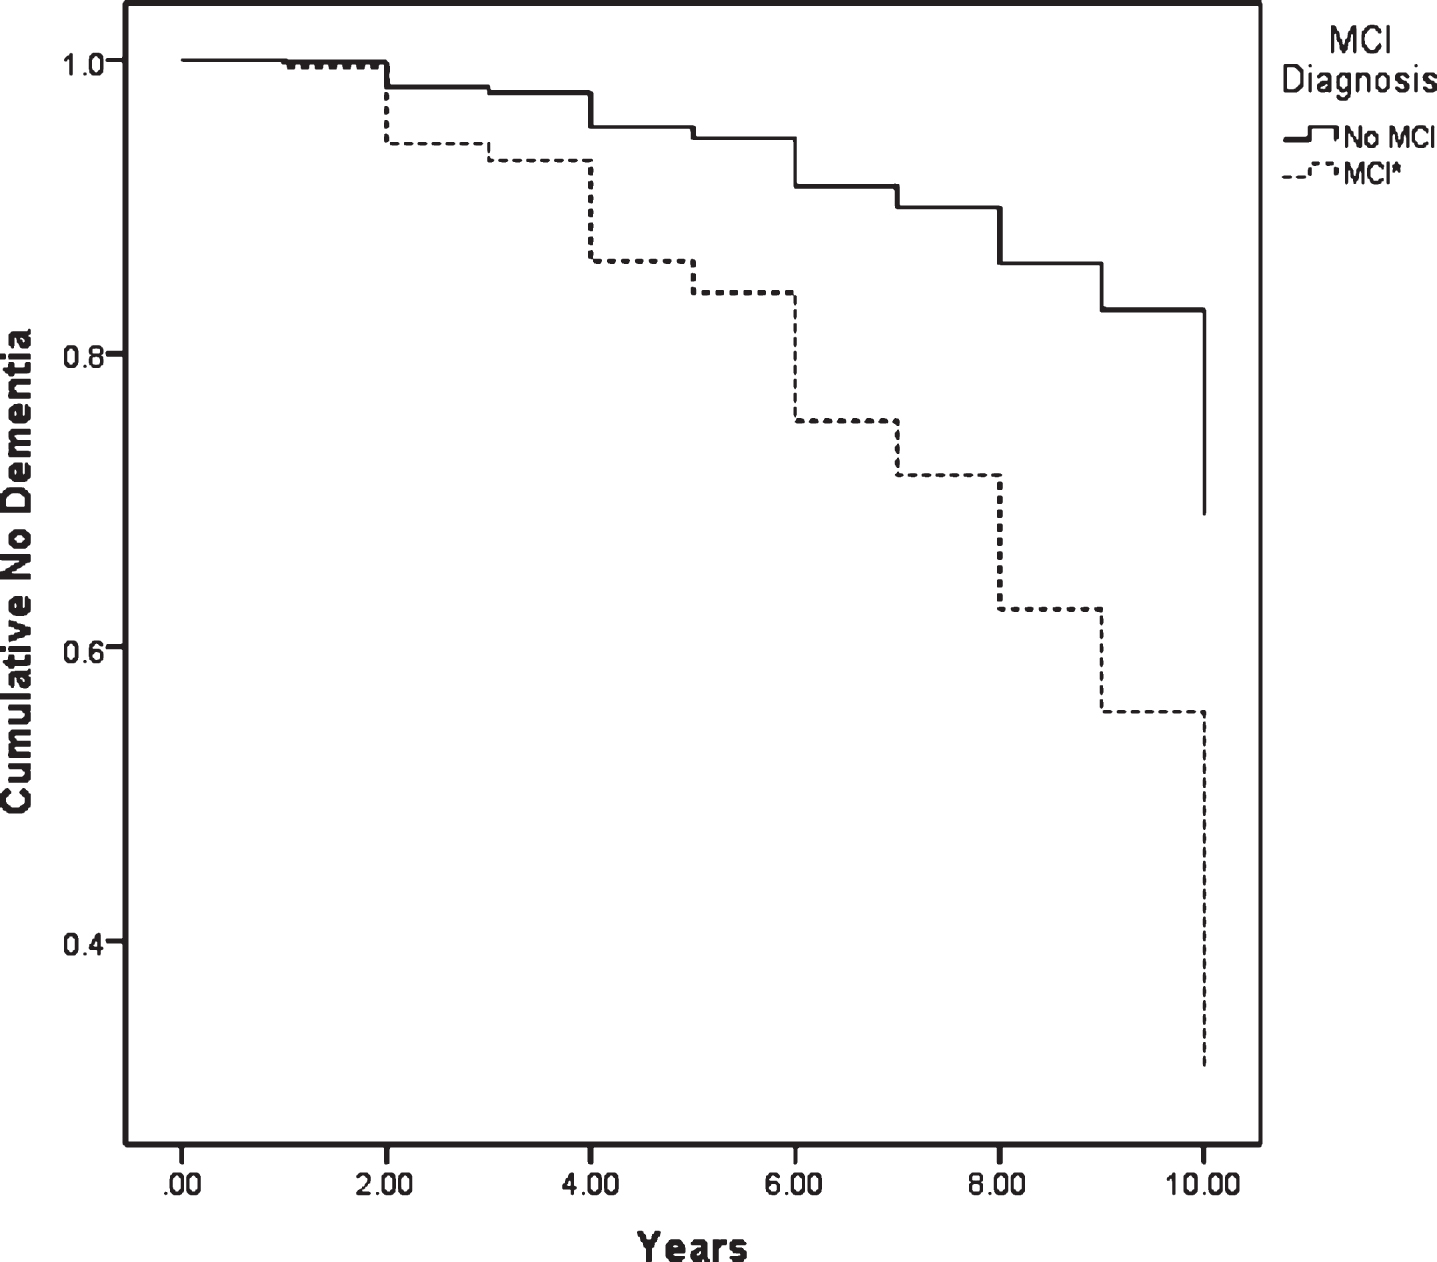
Risk of developing dementia based on MCI diagnosis at first visit using criteria of 1.5 sd from the standard benchmark. *p < 0.001.
To further explore how MCI diagnosis over time increases risk of dementia, we examined the stability of MCI diagnosis across two biennial visits for a reduced “stability” sample of 708 participants. The four MCI clusters (No MCI, Revert, Decline, and MCI×2) were created using the MCI criterion of 1.5 sd from the standardized benchmark. Analyses showed that the stability sample did not differ in age, education, or sex compared to our larger sample.
Of the stability sample, 178 participants (25%) were diagnosed with dementia over follow-up; mean years assessed was 5.6 (range = 1–10 years). Table 5 shows prevalence rates for each MCI cluster, as well as the sensitivity, specificity, and positive and negative predictive validity of dementia diagnosis between the various MCI clusters. The majority of participants fell into either the No MCI or MCI×2 cluster groups. Consistent with our expectation, the MCI×2 cluster had the highest predictive validity of all of the cluster groups, with sensitivity at 67%, specificity at 44%, positive predictive validity at 67%, and negative predictive validity at 92%.
Prevalence and conversion to dementia rates across MCI clusters based on 1.5 sd from the standard benchmark
No MCI = Did not meet MCI criteria at first two biennial visits. Revert = Met criteria for MCI at first biennial visit, but not the second. Decline = Did not meet criteria for MCI at first biennial visit, but did at the second. MCI × 2 = Met criteria for MCI at both of the first two biennial visits.
We once again used Cox Regression Hazard Ratio analysis to understand risk of dementia within each group. When controlling for age, the results revealed that being in the Revert group did not significantly increase risk of dementia (Hazard Ratio = 1.8, p = 0.1 (CI: 0.9–3.7) compared to the No MCI group. In contrast, the Decline group was 2.7 times more likely to develop dementia, p < 0.001 (CI: 1.5–4.8), and the MCI×2 group was 7.1 times more likely to develop dementia, p < 0.001 (CI: 4.4–11.3), when compared to those in the No MCI group. These results are represented in Fig. 3.
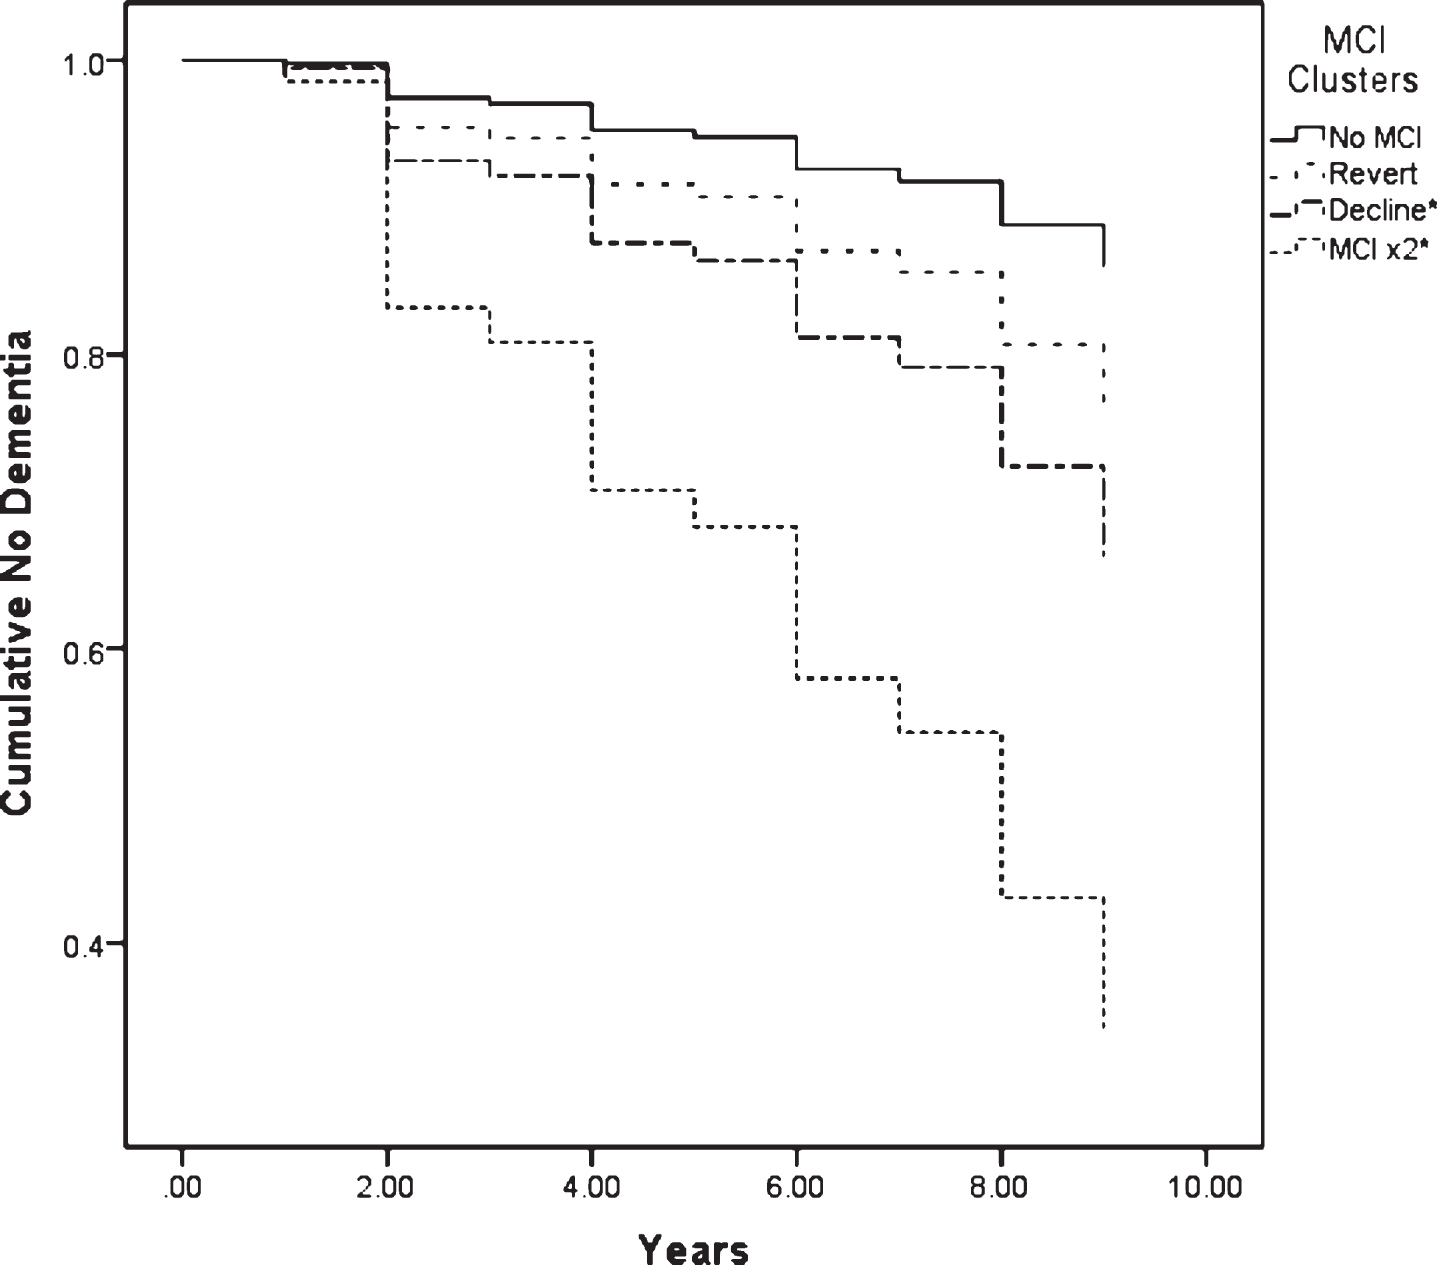
Risk of developing dementia over time based on MCI diagnosis over first two biennial visits using the criteria of 1.5 sd from standardized benchmark. *p < 0.001. No MCI = Did not meet MCI criteria at first two biennial visits. Revert = Met criteria for MCI at first biennial visit, but not the second. Decline = Did not meet criteria for MCI at first biennial visit, but did at the second. MCI × 2 = Met criteria for MCI at both of the first two biennial visits.
Post-hoc analyses
Given that many drug-trials and other intervention studies typically span over 2–5 years [30], we conducted further post-hoc analyses with a narrower time frame to understand how time might impact predictive validity. As such, the additional analyses examined whether participants had a dementia diagnosis by their second biennial visit; which was an average of approximately 2 years (range = 1–4 years). Of the 1,721 participants, 94 were diagnosed with dementia in this time frame. Crosstabulations indicated that using the criterion of 1.5 SD from the standardized benchmark continued to have optimal sensitivity, specificity, and predictive validity rates relative to the other criteria. More specifically, sensitivity was 78.7%, specificity was 59.1%, positive predictive validity was 10%, and negative predictive validity was 98%. The results from the Cox Regression Hazard Ratio analysis using the 1.5 sd from the standardized benchmark criterion with the narrowed timeline found that those diagnosed with MCI at their first visit were 4.4 times more likely to develop dementia over this shorter time frame, p < 0.001 (CI: 2.7–7.3), which is similar to when the analyses included the longer follow-up.
DISCUSSION
The purpose of this study was to: 1) examine how differing MCI criteria impact prevalence rates in a community-based cohort, 2) understand which MCI criterion is most useful in predicting risk of dementia, and 3) evaluate how short-term MCI diagnostic stability impacts risk of dementia. Not surprisingly, our results indicated that MCI prevalence rates are highly dependent on MCI diagnostic operationalization. Rates ranged from 42.9% –87.4%, with higher rates resulting from using a less stringent cutoff value and individualized benchmarks. Based on sensitivity, specificity, and positive and negative predictive values, using the criterion of 1.5 sd from the standardized benchmark was the best for predicting dementia relative to the other diagnostic criteria. The results indicated that those meeting this criterion for MCI at their first visit were three times more likely to develop dementia compared to those who did not meet this MCI criterion. These results held steady even when the time frame was narrowed to mimic drug trial studies, although sensitivity, specificity, and positive predictive validity were slightly lowered. Moreover, dementia risk increased to seven-fold if a person had an MCI diagnosis during both of the first two visits of the study period. That said, specificity of only 44% and positive predictive validity of 67% indicates that even the best performing criterion has limitations, although this criterion becomes more reliable with follow-up over time.
The results of variable MCI prevalence rates using differing MCI criteria are consistent with much of the previous literature [4, 20]. Although the prevalence rates we found are quite high, they are consistent with our previous study [20] and are not vastly dissimilar to many other studies conducted on community-based samples [12, 16]. Higher prevalence rates from our study are likely a result of using a 1.0 sd cutoff and individualized benchmarks for determining impairment, which increased prevalence rates and has not been evaluated in many of the other MCI prevalence studies. Regardless, this variability highlights what many others have already concluded, which is that overall MCI prevalence is difficult to determine without consistent diagnostic criteria.
Not only is use of differing MCI criteria problematic for prevalence rates, this variability brings into question the predictive validity and clinical utility of MCI diagnosis. There is some evidence to show that varying MCI prevalence rates do not appear to significantly change MCI to dementia conversion rates [54]; however, our results suggest otherwise. Of our 1,721 sample, 17% went on to develop dementia, which is generally consistent with several previous studies [12, 27]. MCI to dementia conversion rates varied from 17–27% by diagnostic criteria. This finding suggests that the majority of people diagnosed with MCI will not go on to develop dementia, which highlights how the original purpose of MCI, which was to identify those with dementia at the earliest stage, is not necessarily achieved using any of these criteria [4]. As expected, using a more stringent severity level increased specificity, but decreased sensitivity. More surprising, and contrary to our hypothesis, using the standardized benchmark had better combined sensitivity and specificity than the individualized benchmark. In fact, using a 1.5 sd cutoff from the standardized benchmark yielded the best sensitivity, specificity, and predictive validity, which provides support that this MCI criterion is the most useful in predicting dementia.
These results challenge the notion that basing impairment on a person’s estimated premorbid functioning, rather than standardized norms, can improve our ability to detect cognitive decline [7]. This finding is similar to that of Ivnik and colleagues’ [55] cross-sectional study that demonstrated that using standard cutoff values, rather than adjusted scores based on the reading subtest of the Wide Range Achievement Test-Third Edition (WRAT-3), had better diagnostic classification of cognitively healthy participants and those with Alzheimer’s disease. Another interesting finding was that the effectiveness of accurately classifying groups using adjusted scores differed based on which premorbid estimate is being used [55]. This can inform interpretation of our results because although there was careful consideration to choose a measure that has been shown to be a reliable and valid estimate of premorbid function, the Shipley-2 Vocabulary test, we acknowledge that there are inherent limitations with using any single test to determine premorbid function. It is possible that other methods, or perhaps using multiple methods, of estimating premorbid functioning (e.g., word-reading measures, advanced demographic estimates) might have improved predictive validity.
Furthermore, from a cognitive reserve perspective, it is most important to consider premorbid functioning when the estimated level of functioning is outside the average range [56]. Unfortunately, the normative data for the premorbid measure used in this study is limited in that the norms do not capture individuals at the more extreme ends of functioning. As a result, our ability to adjust scores for individuals with below or above average premorbid functioning was reduced. Moreover, 370 participants did not complete the Shipley-2 and thus were excluded from analyses; these participants had lower education and more cognitive deficits during their first neuropsychological testing visit. This represents a limitation to our study, as we had to exclude a large number of participants for whom comparison to a premorbid estimate might be particularly important.
Another interesting finding is that the nonamnestic multidomain MCI diagnosis was most predictive of dementia out of all of the MCI subcategories. Much of the research has shown that amnestic multidomain MCI is most predictive of future decline [9, 10]; however, this is usually focused on Alzheimer’s disease specifically. Given that our study focused on any dementia diagnosis, there appeared to be more diversity, which has also been found in other research without an exclusive Alzheimer’s disease focus [33, 57]. A more in-depth look into this finding revealed that performance on the letter fluency task was the primary driver behind participants meeting criteria for nonamnestic MCI subtype. Declines in letter fluency are considered a sensitive clinical finding for dementia in general, but to a lesser extent with Alzheimer’s disease [58]. Therefore, it is not entirely unexpected that research on Alzheimer’s disease would find fewer cases of conversion with nonamnestic MCI groups. Nevertheless, these findings demonstrate that nonamnestic MCI is an important classifier, and should not be ignored, when attempting to understand risk of dementia not limited to Alzheimer’s disease.
Given that MCI criterion of 1.5 sd from the standardized benchmark produced the highest predictive validity, we used this criterion to further elucidate risk of dementia over time. As stated, we found that those diagnosed with MCI at the first timepoint were almost three times more likely to develop dementia and seven more times likely if diagnosed with MCI at two visits. Risk of developing dementia is also increased, but to a lesser extent, if someone is not diagnosed with MCI initially, but are diagnosed at their second follow-up. Interestingly, the results indicated that if a person is initially diagnosed with MCI, but not at their second follow-up, there was no increased risk for developing dementia. This finding is contrary to some research that has shown that MCI diagnosis at any time point significantly increases risk of dementia [34], although other research has found that variable MCI diagnosis is much less predictive of dementia [33]. Moreover, the result of having a patient demonstrate impairment at their initial evaluation, but not at their second, can be a result of many factors. It is possible that this might reflect reversal of health factors impacting cognitive functioning, normal variability, practice effects, or potentially more comfort with the testing process at the follow up evaluation. Regardless, this finding highlights how repeat testing greatly increases ability to predict risk of dementia.
Limitations
There are limitations of the current study not already addressed. The generalizability of our findings is somewhat restricted due to the level of education and primarily white makeup of our sample. This type of sample could skew MCI prevalence and conversion to dementia rates. To reduce participant burden, the number of neurocognitive tests administered was briefer than what might be used in many clinical evaluations. The number of tests within each cognitive domain also varied. Thus, we recognize that the number and type of tests selected for the study may influence our results, although tests were carefully selected based on their quality and ability to detect cognitive impairment. We also used varying published normative data to convert raw scores into z-scores, which introduces heterogeneity to how these tests are being normed and interpreted. Although careful consideration was used when selecting which normative data to use, we recognize that this is a limitation and that selection of normative data likely plays a significant role in our findings. Another limitation of our study is that we did not fully account for medical comorbidities that might have also influenced conversion to dementia; however, medical comorbidities were reported and taken into account during the consensus meetings. We also did not examine dementia subtypes as to have the most robust findings possible, although, similar to many community-based cohort studies, Alzheimer’s disease accounts for the majority of cases. Although it is beyond the scope of this study, it would be interesting for future studies to examine how different dementia etiologies influence these findings.
Conclusions
Given that over 20% of the U.S. population will be 65 years and older by the year 2030, effective detection and cognitive interventions for those who will develop dementia might be of great value and mistaken early detection could be detrimental. Current dementia research is focusing on using biomarkers and neuroimaging for early detection [5]. Adopting comprehensive classification systems, such as the AT(N) definition of Alzheimer’s disease proposed the National Institute on Aging-Alzheimer’s Association (NIA-AA), might be another way to improve our research classification systems [59]. However, until these methods are further developed, the diagnosis of a dementia clinical syndrome continues to heavily rely on objective cognitive decline; thus, having a cohesive diagnostic classification system to capture early cognitive change and identify those likely to develop dementia is of great utility [4].
The findings from this study demonstrate the substantial impact varying MCI criteria has on MCI prevalence and conversion to dementia rates within a community-based sample. Importantly, using individualized benchmarks in attempt to detect cognitive decline was not superior to using normative data. While the original Petersen and colleagues [3] MCI criterion appears to be the most useful diagnostic classification, it continues to have shortcomings. However, those diagnosed with MCI using this criterion were three times more likely to develop dementia and this increased to seven times if diagnosed with MCI at two timepoints. That said, even the best criterion had specificity and positive predictive values that are problematic. These results highlight the value of using a solid and consistent diagnostic classification system, as well as how stability of MCI diagnosis over time provides important information about dementia risk.