
Abstract
Little is known about the extracellular matrix (ECM) during progression of AD pathology. Brain ECM is abundant in hyaluronan (HA), a non-sulfated glycosaminoglycan synthesized by HA synthases (HAS) 1–3 in a high molecular weight (MW) form that is degraded into lower MW fragments. We hypothesized that pathologic severity of AD is associated with increases in HA and HA-associated ECM molecules. To test this hypothesis, we assessed HA accumulation and size; HA synthases (HAS) 1–3; and the HA-stabilizing hyaladherin, TSG-6 in parietal cortex samples from autopsied research subjects with not AD (CERAD = 0, Braak = 0– II, n = 12–21), intermediate AD (CERAD = 2, Braak = III–IV, n = 13–18), and high AD (CERAD = 3, Braak = V–VI, n = 32–40) neuropathologic change. By histochemistry, HA was associated with deposits of amyloid and tau, and was also found diffusely in brain parenchyma, with overall HA quantity (measured by ELSA) significantly greater in brains with high AD neuropathology. Mean HA MW was similar among the samples. HAS2 and TSG-6 mRNA expression, and TSG-6 protein levels were significantly increased in high AD and both molecules were present in vasculature, NeuN-positive neurons, and Iba1-positive microglia. These results did not change when accounting for gender, advanced age (≥ 90 years versus <90 years), or the clinical diagnosis of dementia. Collectively, our results indicate a positive correlation between HA accumulation and AD neuropathology, and suggest a possible role for HA synthesis and metabolism in AD progression.
INTRODUCTION
The neuropathology of Alzheimer’s disease (AD) is defined by the presence of amyloid plaques and neurofibrillary tangles in a characteristic density and distribution [1–5]. In contrast, little is known about changes in extracellular matrix (ECM) of the brain parenchyma during progression of AD pathology [6–8]. Unlike other tissues, the ECM of brain is practically devoid of typical structural matrix proteins such as interstitial collagens, but rather is composed largely of proteoglycans, glycoproteins, and hyaluronan (HA), which account for approximately 20% of the total brain volume [3, 10]. Brain ECM components provide structural support and also regulate cell adhesion and migration.
HA, a non-sulfated glycosaminoglycan, is a major component of brain parenchyma ECM and endothelial glycocalyx [9, 11]. HA is synthesized by HA synthases (HAS) 1–3 in high molecular weight (MW) forms (i.e., >500 kDa), but is degraded by hyaluronidases into fragments of low MW that may be pro-inflammatory (reviewed in [9]); however, recent data have called the pro-inflammatory properties of HA into question [12]. Hyaladherins are ECM proteins that can bind to HA. Through their interactions with HA, hyaladherins not only contribute to HA stability and overall ECM structure, but also help regulate cell adhesion and cell signaling [13]. An important hyaladherin in the brain may be tumor necrosis factor-stimulated gene-6 (TSG-6), as this secreted protein is thought to mitigate inflammation and provide tissue protection in many organs [14]. TSG-6 is constitutively expressed in the brains of adult rodents and likely organizes HA during glial scar formation in the central nervous system (CNS) [15]. Moreover, TSG-6 alters the structure of HA via its direct crosslinking of HA chains [16], which also enhances HA-receptor interactions [13, 18] and perhaps contributes to the anti-inflammatory effects of HA [14].
The synthesis and degradation of HA are both continuous and rapid, and these processes are regulated in many ways [19]. Previous studies have specifically examined HA synthesis and degradation during neuroinflammation, ischemic injury, and infection [8, 21]. In all of these scenarios, HA accumulation and subsequent degradation were increased by the injury process. Studies of small numbers of occipital and temporal lobe specimens from patients with AD have shown that HA is near plaques of amyloid-β (Aβ), but little else is known about the relationship between HA and AD, such as the sources of HA and its MW distribution [7]. Given the influence of HA size on the affinity of HA for its major receptor CD44, a determination of how HA quantity and MW changes with AD neuropathology is fundamental to understanding how HA might influence AD progression and to the development of relevant therapeutic interventions [22].
We evaluated a series of cortical brain samples from subjects with not AD, intermediate AD, or high AD neuropathology to examine the relationship between AD pathology, accumulation and size of HA, and expression of TSG-6.
METHODS
Brain tissue samples
Samples of brain tissue were obtained from the tissue repository of the University of Washington Neuropathology Core, where fresh samples from diverse areas of the brain are collected from research subjects autopsied within 8 h of death (postmortem interval, PMI) and rapidly preserved. The brains of subjects autopsied at PMI greater than 8 h are fixed and paraffin-embedded. We chose to examine parietal cortex (inferior parietal lobule) as a region that is involved with AD pathologic progression by Aβ plaques and neurofibrillary tangles. Cases were selected based on the level of AD pathology for neuritic plaque density (CERAD score) and neurofibrillary tangle distribution (Braak stage) in subjects with no Lewy body disease and no more than 1 microinfarct. We stratified cases as high AD (CERAD = 3, Braak = V–VI, n = 32 frozen specimens, 40 paraffin embedded sections), intermediate AD (CERAD = 2, Braak = III–IV, n = 13 frozen specimens and 18 paraffin embedded sections), and not AD (CERAD = 0, Braak = 0– II, n = 12 frozen specimens and 21 paraffin embedded sections) neuropathology in alignment with NIA-AA guidelines [4, 23]. Female/male representation was 38% /62% (not AD), 39% /61% (intermediate AD) and 57% /43% (high AD) with age ranges as described in Table 1.
Samples for IHC {Paraffin Embedded} & Biochemistry [Frozen]
Table shows gender and age distribution for samples available for histology {paraffin embedded} and biochemistry [frozen] at the time of death. Among the 21 not AD samples, 2 subjects had dementia. Among the 18 intermediate AD samples, 8 subjects had dementia. Among the 40 high AD samples, 33 had dementia.
Histochemistry
At autopsy (after rapid dissection if PMI <8 h), brains that had been fixed in 10% neutral-buffered formalin (NBF) were sampled according to NIA-AA guidelines and samples processed and paraffin embedded. Histologic sections (5μm) were de-paraffinized, the antigens unmasked by boiling in pH 6.0 citrate buffer (Item 3300, Vector Laboratories), and endogenous peroxidases inactivated in 3% H2O2 in Tris-buffered saline (TBS). The sections were then blocked in 2% goat serum. For immunohistochemistry (IHC), sections were exposed to primary antibodies at 1–5μg/mL representing dilutions of 1:200–1:1000. Specific primary antibodies included: anti-Aβ (Item 803001, Biolegend), PHF-tau (Item MN1020, Thermo Scientific), HAS2 (Item PA5-25593, Thermo Scientific), TSG-6 [24], NeuN (Item MAB377, MilliporeSigma), Iba1 (Item 019-19741, WAKO), and PECAM (Item ab28364, Abcam). To label HA using affinity histochemistry (AHC), sections were exposed to biotinylated HA binding protein (bHABP) (Item 385911, Calbiochem ®/MilliporeSigma). To verify the specificity of bHABP for HA, selected sections were exposed to 20 Units/ml of hyaluronidase from Streptomyces hyalurolyticus (Item H1136, MilliporeSigma) in 50 mM NaOAc, 0.15 M NaCl, pH 6.0 for 1 h at 37°C and then exposed to bHABP, as described above. Secondary antibody/ABC staining alone served as negative controls.
All IHC/AHC studies were performed using both fluorescence and chromogenic substrates. The fluorescent dye-tagged secondary reagents were: Alexa-Fluor 594-strepavidin for bHABP (Item S32356, Thermo Scientific), Alexa-Fluor 594-goat anti-rabbit IgG (Item A11012, Thermo Scientific) for HAS2 and TSG-6, and Alexa-Fluor 488 goat anti-mouse IgG for NeuN and PECAM (Item A11011, Thermo Scientific). To validate immunofluorescence specificity, visualization of bound primary antibodies and bHABP was also accomplished by chromogenic means, using bHABP (or, for IHC, biotinylated secondary antibodies) in conjunction with Vectastain ® Avidin-Biotin Complex (ABC) (Item PK-6105, Vector) and 3,3’-diaminobenzidine (DAB) (Item SK-4105, Vector). Cell nuclei were counterstained with hematoxylin or DAPI. IHC studies to match expression of HAS2 or TSG-6 to a specific cell type (identified by PECAM, Iba1, or NeuN markers) utilized adjacent sections.
Specimens were imaged with a Leica DMR microscope (Leica Microsystems) equipped with a SPOT™ 1.4 megapixel CCD camera (Diagnostic Instruments) (for fluorescence) and a Leica DM2500 microscope equipped with a SPOT Insight 4 megapixel color CCD camera (for brightfield). TSG-6 chromogenic immunolabeling was quantified by brightfield microscopy; sections from each group (not AD, intermediate AD, and high AD) were stained at the same time and under the same conditions, and image acquisitions were performed using identical exposure parameters. The images were opened in ImageJ (NIH image analysis freeware, http://imagej.nih.gov/ij/) and the threshold of the blue channel was modified until the DAB-stained areas showed optimal contrast in the red channel. At least four digital images per section were obtained at 10X magnification with the same illumination and exposure settings. The intensity of staining was expressed as a percentage of stained area per a standard 10X field (4 mm2).
mRNA analyses
Biochemical assays of mRNA and HA content utilized frozen specimens from brains retrieved within 8 h PMI. Parietal blocks consisted of parietal cortex and underlying white matter; gray matter was dissected away from white matter on dry ice. Meninges and superficial vasculature were removed. Total cellular RNA was isolated from 0.5 to 1 mm cubes of gray matter parietal cortex using TRIzol™ Reagent (Invitrogen/ThermoFisher Scientific) and a Direct-zol™ RNA miniprep kit (Zymo Research). RNA purity and integrity was assessed by spectrophotometric analysis. A total of 1μg of RNA from each sample was reverse transcribed using an iScript kit (Bio-Rad Laboratories). Real-time polymerase chain reaction (RT-PCR) was performed using an ABI 7900 RT-PCR instrument with SYBR Green Master Mix (Bio-Rad) for mRNAs corresponding to human HAS 1–3, TSG-6, and 60 S ribosomal protein L13 (RPL13). All experiments were performed in triplicate and relative gene expression was normalized to RPL13. The following primer sets were used: Human Has1 F: TCTTGAGGCCTGGTACAACC Human Has1 R: AGGGCGTCTCTGAGTAGCAG Human Has2 F: CCTCATCATCCAAAGCCTGT Human Has2 R: GATGCAAAGGGCAACTGTTT Human Has3 F: CTTAAGGGTTGCTTGCTTGC Human Has3 R: AGAGCACACCTTGCGTCTTT Human TSG-6 F: TTTCTCTTGCTATGGGAAGACAC Human TSG-6 R: GAGCTTGTATTTGCCAGACCG Human RPL13 F: ACATAAACCTGTGTACCATGCAC Human RPL13 R: GGTAGCCAGTATGCGAAGAGT
Quantification of HA
Equivalent portions of gray matter (from which meninges and superficial vasculature were removed) from each subject were washed once with PBS and then homogenized, lyophilized, and weighed. The desiccated homogenates were then rehydrated in PBS, dialyzed against 0.1 M Tris / 0.1 M Na acetate solution (pH 7.3) at 4°C, and then digested with proteinase K (250μg/ml) at 60°C for 24 h to degrade endogenous proteins and proteoglycans [25]. After heat-inactivation of the proteinase K (100°C for 20 min), the samples were assayed by a competitive enzyme-linked sorbent assay (ELSA) as previously described [26–28], using a standard curve of purified HA to quantitate the experimental samples.
Measurement of HA MW
To determine the MW of HA in the brain samples, the samples were first purified by anion exchange chromatography using a DEAE-Sephacel (Sigma) mini column. The eluted fractions containing HA and glycoproteins were then applied to an analytical Sephacryl S-1000 column (GE Healthcare Life Sciences) to assess the MW of HA [27, 28]. MW markers were obtained from Lifecore Biomedical. HA content in each fraction was assessed by HA-ELSA as described above.
Statistical analysis
The relationship of HA content to AD neuropathology was evaluated estimating the slope in a linear regression model that entered AD neuropathology of not, intermediate, and high as values 1, 2, and 3, respectively. Relationships between HA synthases and TSG-6 expression and content in not AD and high AD cases were determined using a Student’s t-test with unequal variance. Statistical significance was defined as p < 0.05.
RESULTS
The focus of this study was to characterize changes in HA and HA-associated ECM proteins with respect to AD neuropathology. Accordingly, specimens were selected that had minimal evidence of vascular disease or other neurodegenerative conditions including Lewy body disease. We chose parietal cortex because the parietal lobe is impacted by both amyloid plaque and neurofibrillary tangle pathology in later stages of AD with strong correlation with dementia. Graded levels of Aβ and tau pathology in parietal cortex samples were confirmed by a Board Certified neuropathologist at the original autopsy using NIA-AA guidelines to include CERAD neuritic plaque density and Braak stage for neurofibrillary tangle distribution (Bielschowsky silver stain and immunostains for hyperphosphorylated tau [pTau]) (data not shown) [4, 23]. Based on these assessments, cases were selected from a large cohort with “high AD” pathology (Braak stages V–VI), “intermediate AD” pathology (Braak stages III–IV), and “not AD” pathology (Braak stages 0–II). Due to high autofluorescent background in formalin-fixed, paraffin-embedded brain sections, all IHC/AHC fluorescence data were confirmed using IHC/AHC with chromogenic (DAB) visualization. Co-localization studies utilizing DAB visualization were performed on adjacent sections.
First, we examined cytoarchitectural features of HA in not AD and high AD brain samples using AHC. While HA was present in lightly-stained, diffuse patches in the parenchyma of parietal cortex from not AD and high AD samples (Fig. 1A, B, respectively), there was greater staining intensity in the high AD samples compared to the not AD specimens. HA staining was evident in perineural nets (PNNs) of both not AD and high AD samples (Fig. 1A, B). Plaque areas of the high AD samples also had accumulation of HA in parenchyma and PNNs (Fig. 1C). In high AD, accumulations of diffuse parenchymal HA were often present near Aβ plaques (Fig. 1D). Similar to Morawski et al. [7], we noted that areas of HA only partially overlapped with Aβ and often had an intertwined appearance (see inset, Fig. 1D). HA both intercalated in and was adjacent to the amyloid deposits, irrespective of plaque type. In addition, diffuse HA was associated with pTau in the high AD samples (Fig. 1E, F). Brain sections pretreated with hyaluronidase, or exposed to secondary labeling agents only, were not stained, indicating the specificity of the HABP label for HA. The content for diffuse and localized HA in the intermediate AD samples was in-between that of not AD and high AD.
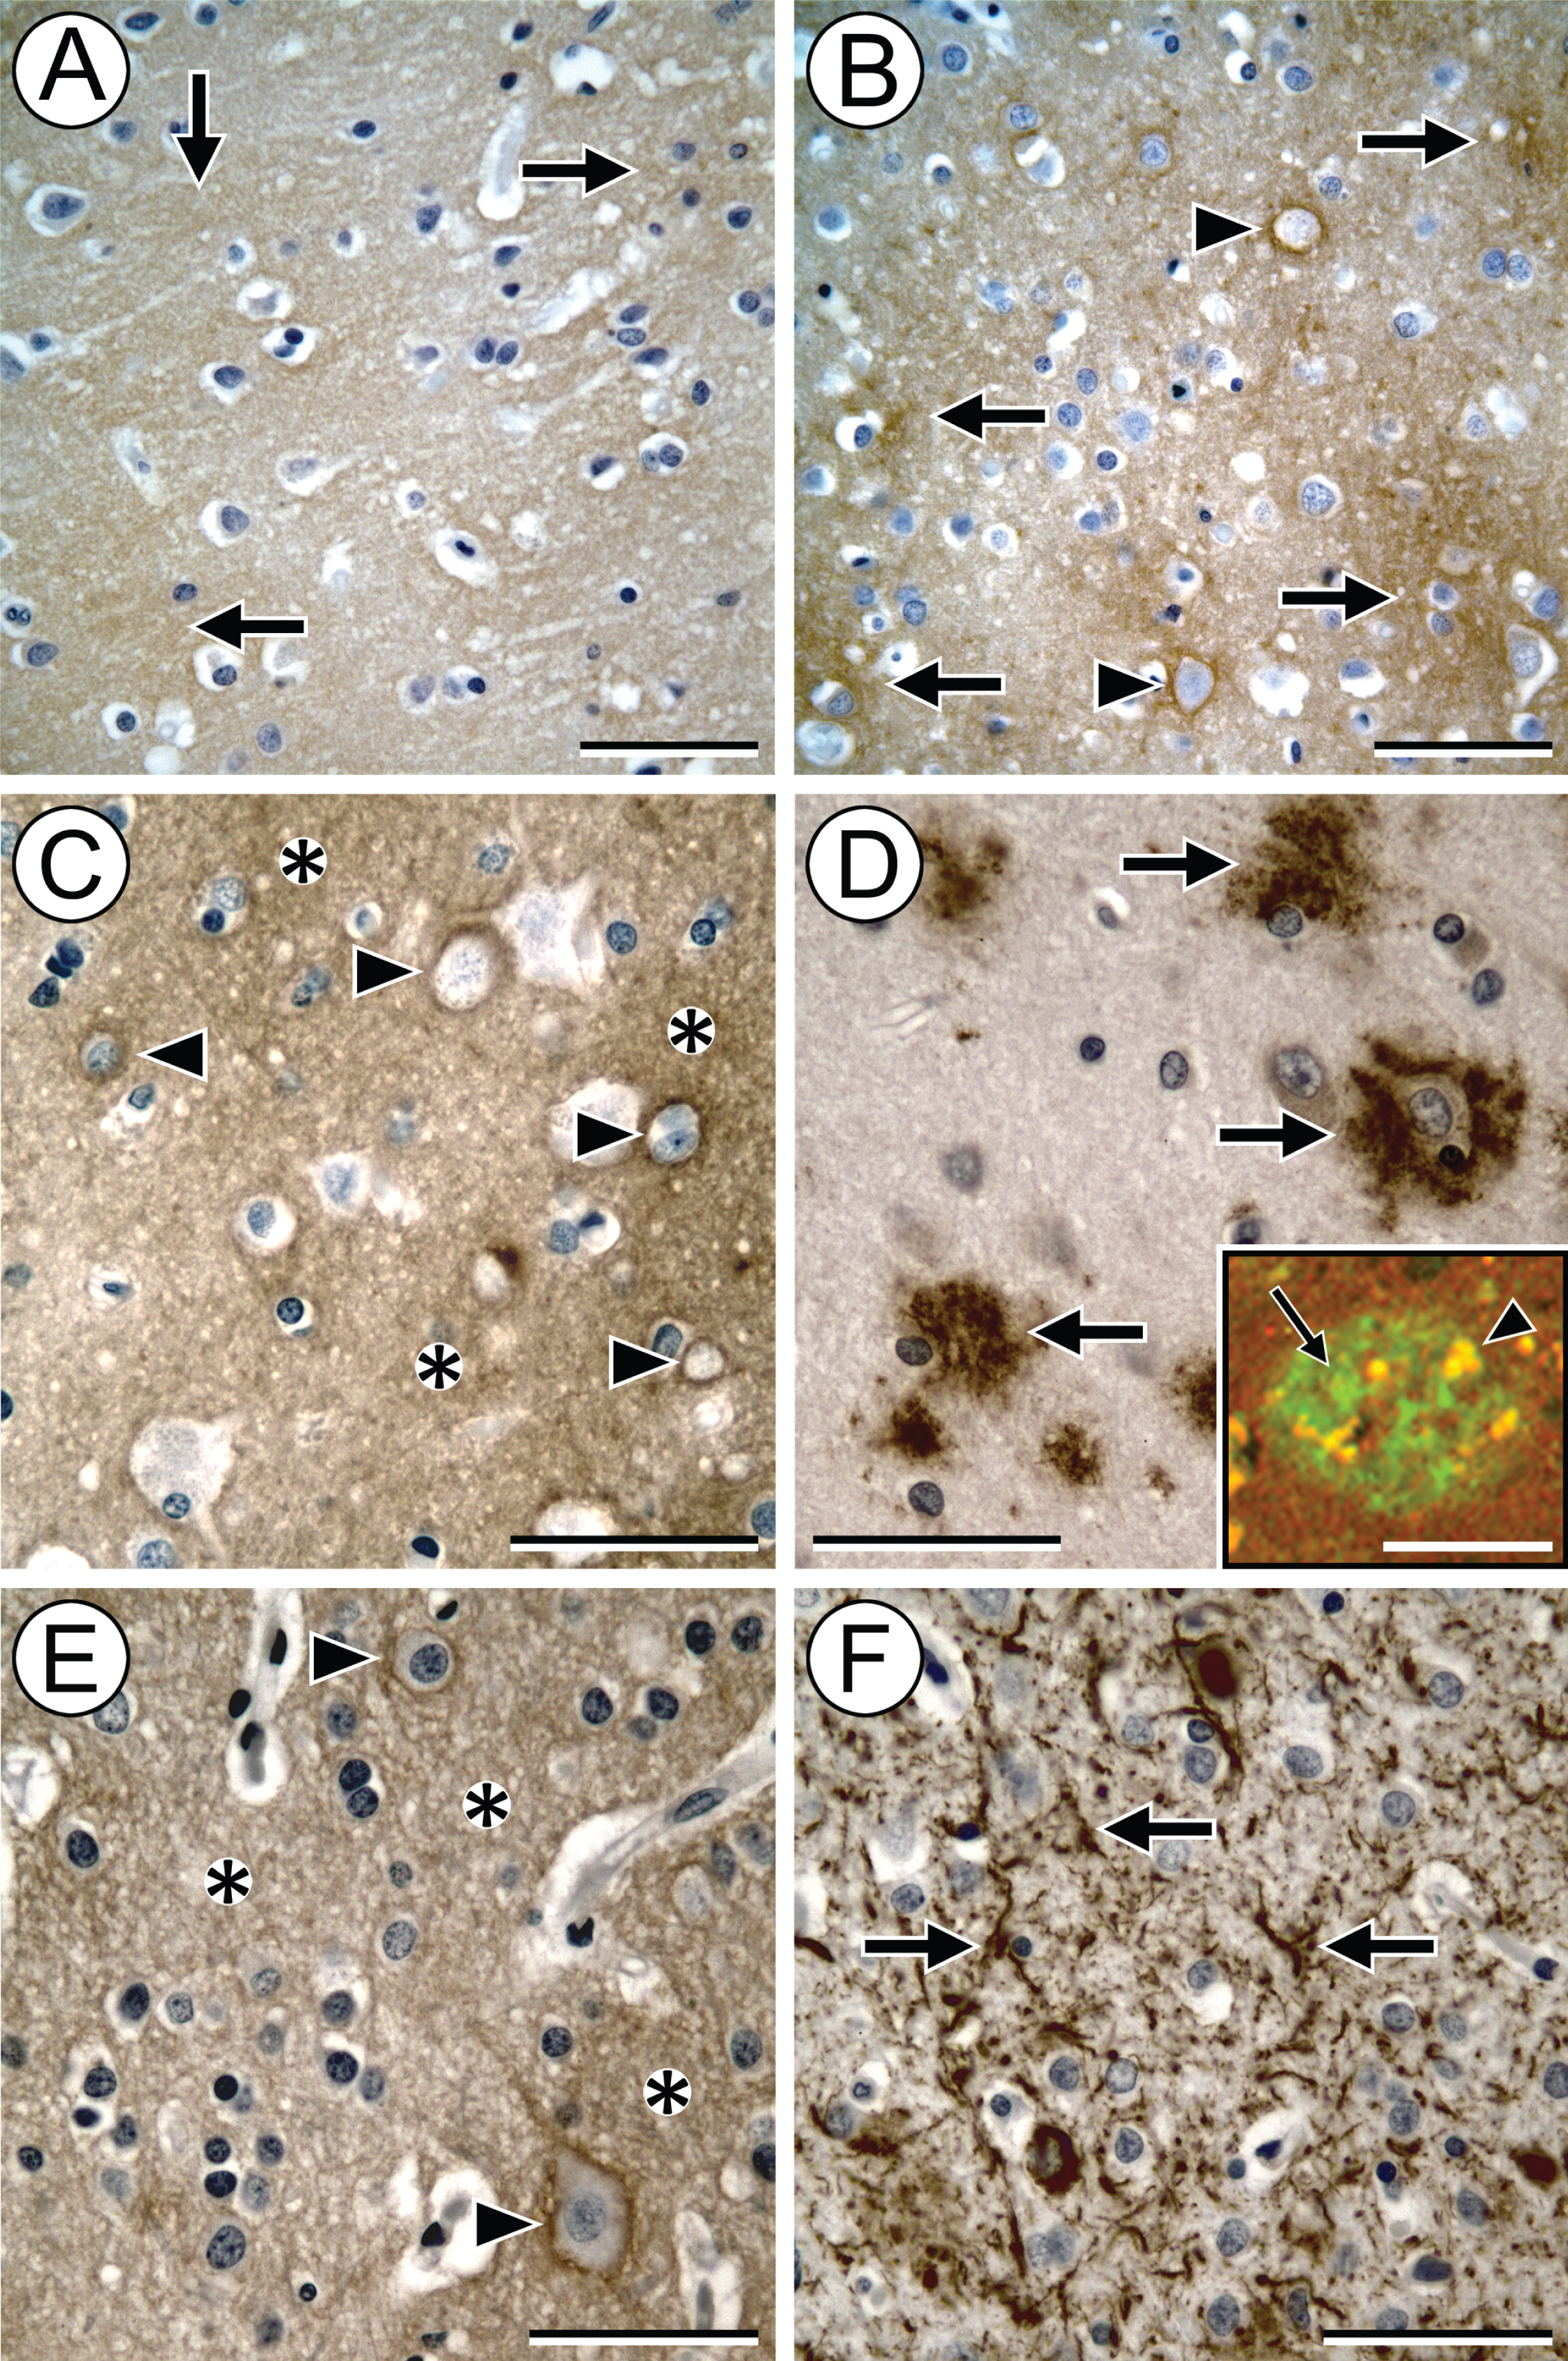
HA levels are increased in brains with AD neuropathology (demonstrated by bHABP labeling using DAB [brown stain] as the chromogen). In sections of not AD brain, HA appears as lightly-stained, diffuse patches in the parenchyma (A, arrows). In comparison, in the high AD brain samples, patches of HA stain with greater intensity (B, arrows). HA accumulation in PNNs is readily apparent (B, arrowheads). In some plaque areas of the high AD samples, HA accumulates in the parenchyma (C, asterisks) and PNNs (C, arrowheads). These areas also contain deposits of Aβ (D, arrows). IHC/AHC fluorescence imaging (D, inset) shows that Aβ (green, arrow) and HA (emitting in the red channel) often colocalize (yellow areas, e.g., arrowhead) in a plaque in a high AD sample. Moreover, areas of HA accumulation in the high AD brain parenchyma (E, asterisks) and PNNs (E, arrowheads) are often adjacent to deposits of pTau in the form of tau neurites and neurofibrillary tangles (F, arrows). Image pairs C/D and E/F represent the same areas of adjacent sections. Scale bars in A–F = 50μm. Scale bar in D inset = 100μm.
We then directly measured the HA content of each of the samples by ELSA (Fig. 2A). Measurements of HA content were performed on samples that were desiccated and then normalized to dry weight in order to account for proportional differences in brain atrophy that can accompany AD neuropathology. Consistent with our AHC staining for HA, the total amount of HA in samples of brains with high AD neuropathology was significantly increased, compared to intermediate AD and not AD samples. The effect of HA on cellular processes is mediated, in part, by its MW, which determines the avidity of HA for specific cell surface receptors, such as CD44 [22, 29]. Accordingly, we evaluated the MW distribution of HA purified from not AD, intermediate AD, and high AD brain tissue samples by molecular exclusion chromatography (Fig. 2B–D). We observed that the mean MW of HA (approximately 200 kDa) did not differ significantly among the three sample sets. Collectively, our analyses indicate that high AD neuropathology is associated with a significantly greater quantity of HA.
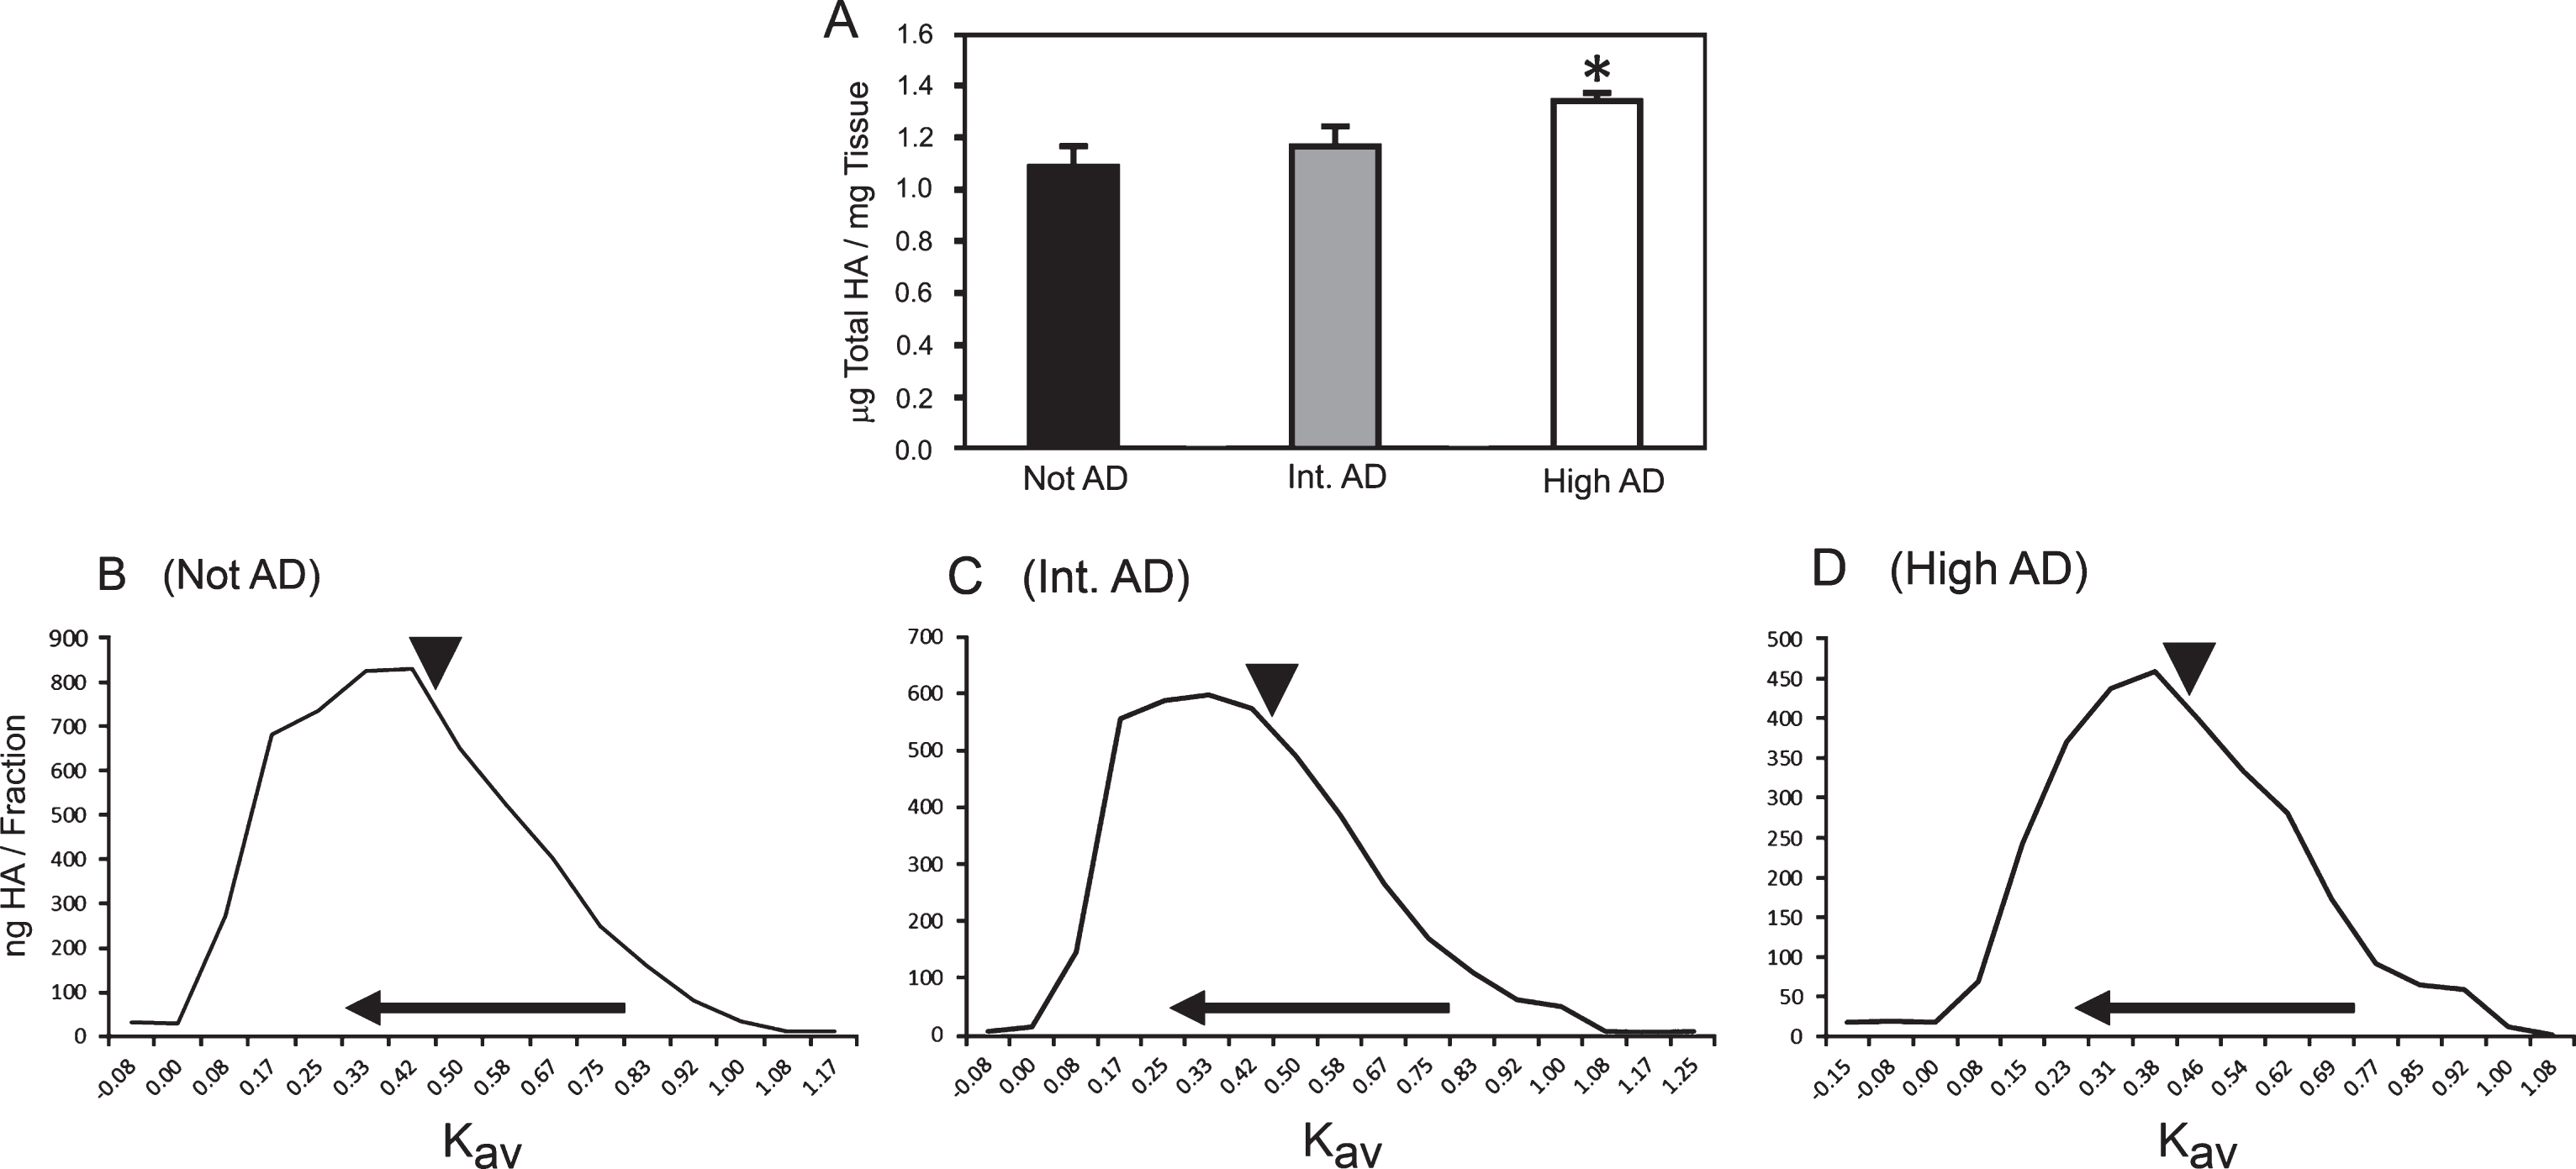
Total HA content increases in brains with AD neuropathology. HA content (A) was determined by ELSA analysis of frozen parietal tissue samples from not AD, intermediate (int.) AD, and high AD brains. *p = 0.0002 (value for linear trend) of not AD versus high AD samples. Sample weights represent dry weight. B–D) MW distribution curves of HA purified from not AD (B), intermediate AD (C), and high AD (D) samples. The x-axes indicate the average retention factor (Kav) of individual column fractions, with the horizontal arrow pointing in the direction of higher MW. The vertical arrowheads indicate the position of 200 kDa HA within the three MW profiles.
In vertebrates, HA is synthesized by HAS isoforms 1–3. We found that mRNAs corresponding to all three HAS isoforms are expressed in brain, with HAS2 mRNA predominating. Moreover, only HAS2 mRNA showed a significant increase in expression in high AD neuropathology (Fig. 3A), but the increased HAS2 mRNA in the high AD samples could not be consistently associated with an increase in HAS2 protein. We and others have shown that HAS2 is highly expressed in vasculature, including that of the brain [30–32] as shown in Fig. 3B and C. We did not detect differences in vessel density or size distribution among the three groups of brain samples (data not shown). HAS2 has been reported in astrocytes [33] and we observed by IHC that HAS2 was associated with Iba1-positive glial cells (Fig. 3D, E) and NeuN-positive neuronal cells (Fig. 3F1/2–H1/2).
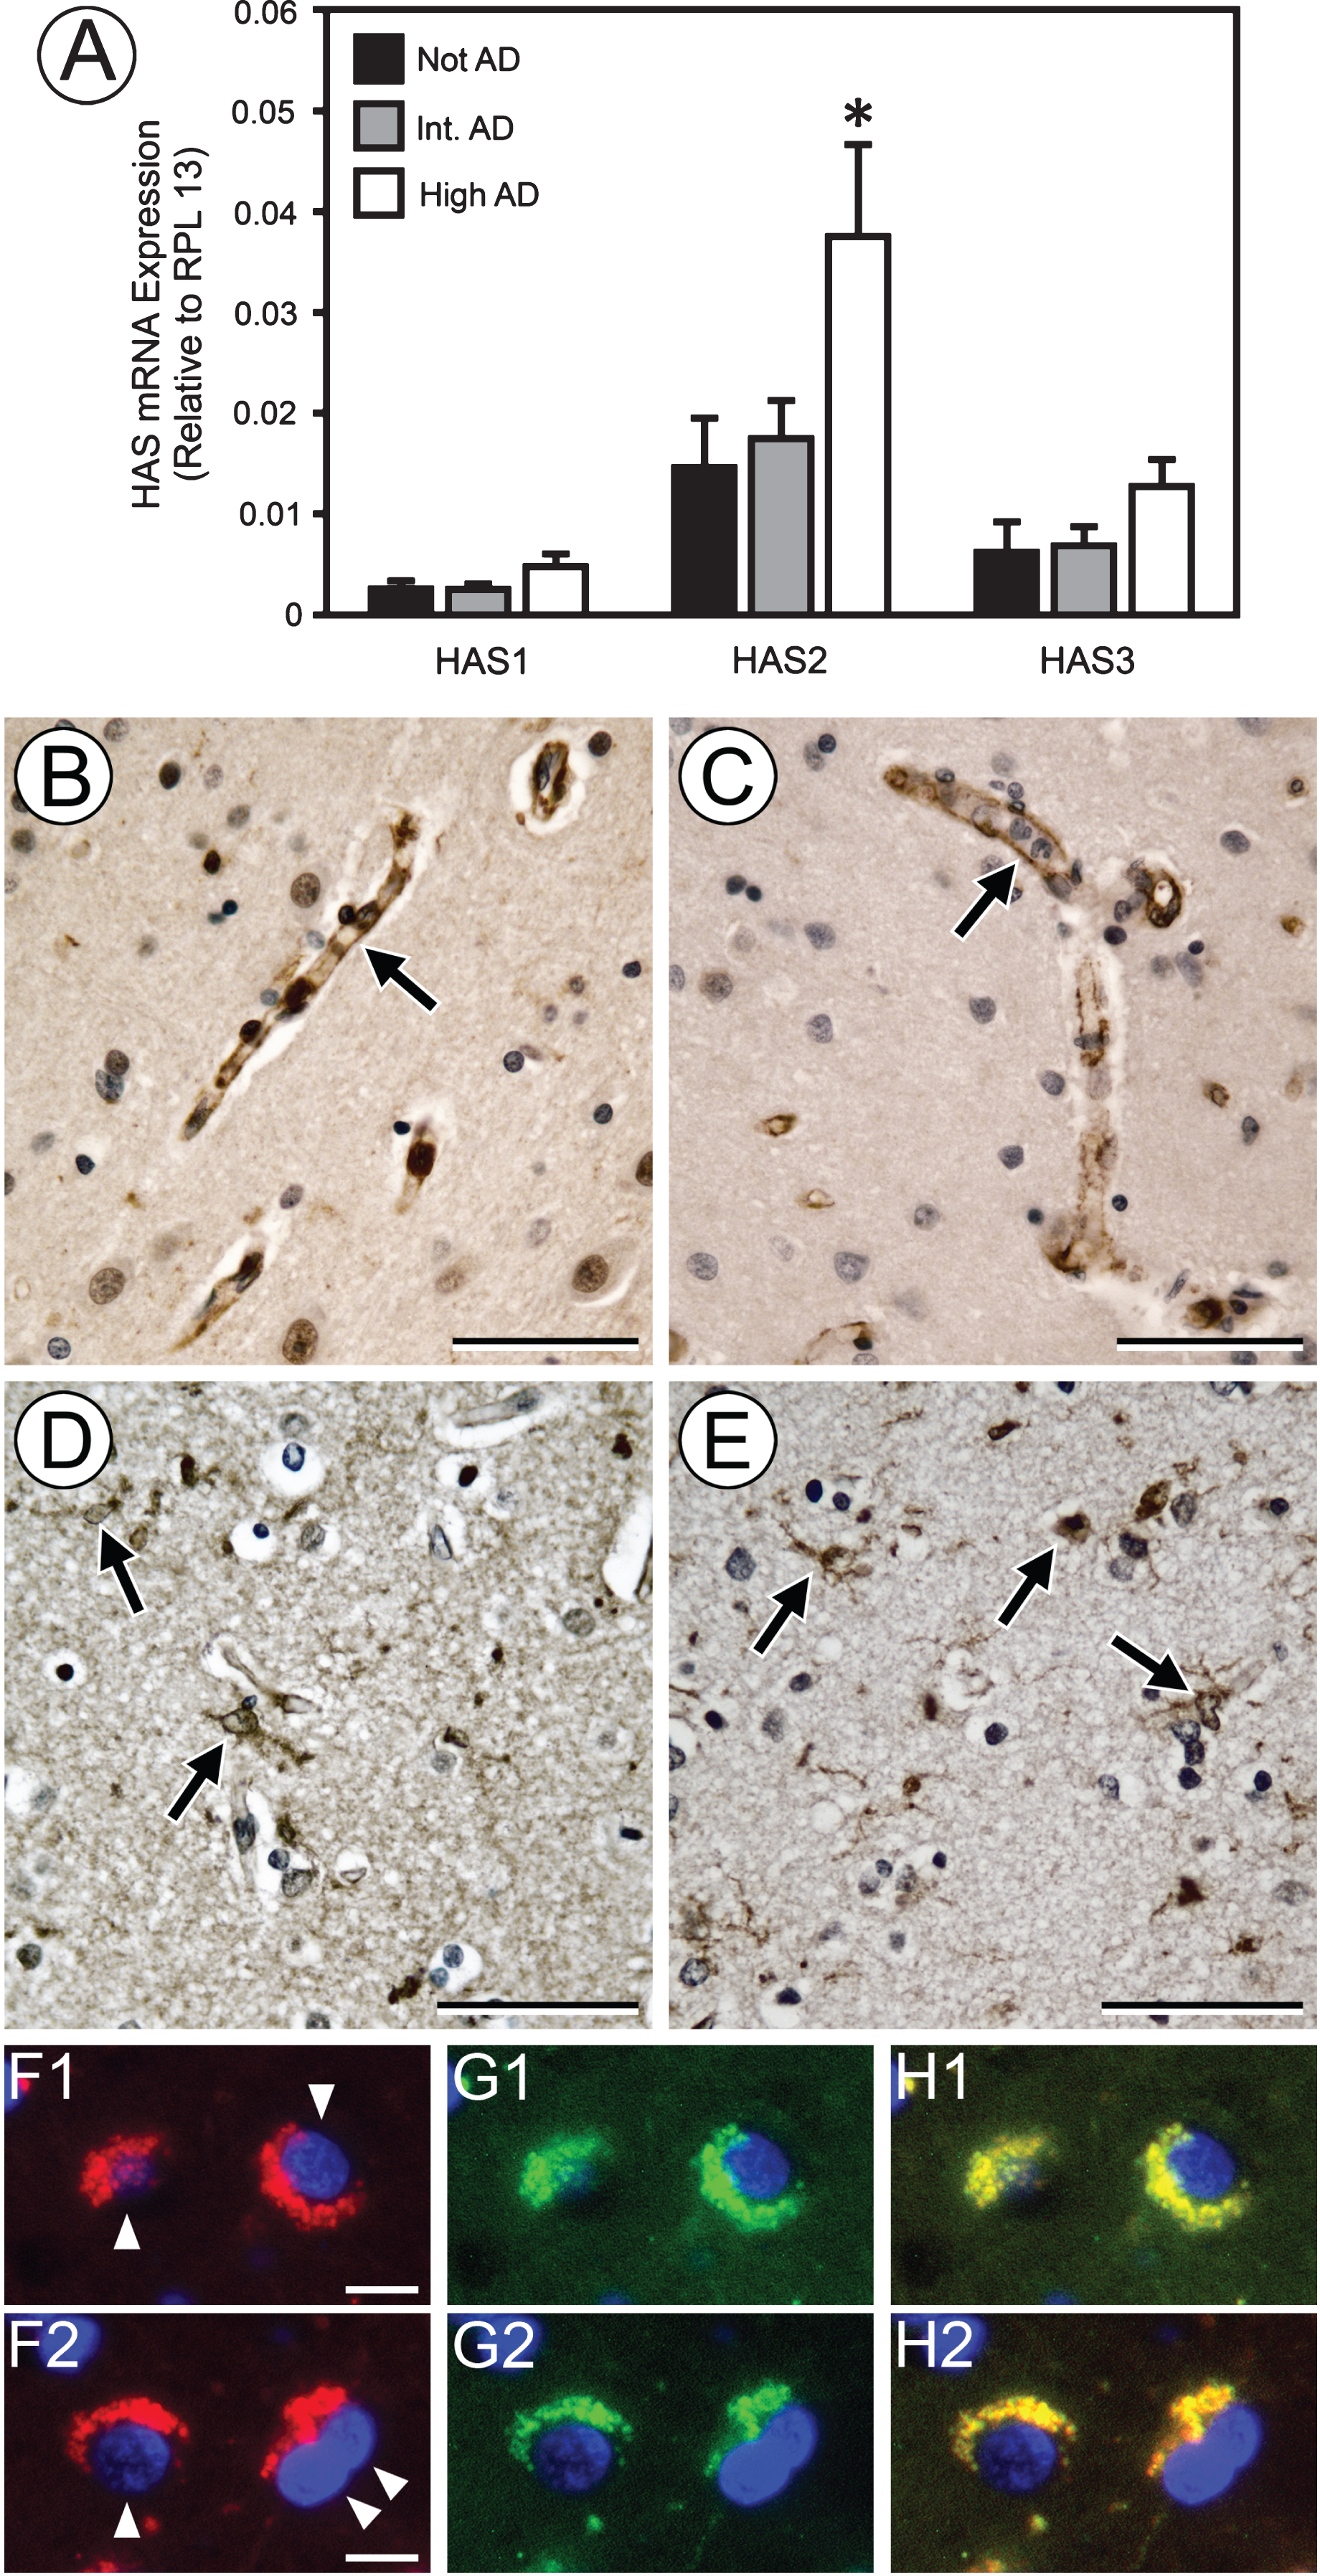
HAS2 mRNA increases with AD neuropathology. Measurement of HAS1–3 mRNA by RT-PCR (A) shows that the HAS2 isoform predominates and undergoes a significant increase in expression in high AD. *p < 0.05, not AD versus high AD samples. No significant increase in HAS1 or HAS3 expression was found with progression to high AD. Experiments were performed in triplicate with HAS mRNA expression normalized to RPL13. IHC staining of representative high AD samples for HAS2 (B, D, F1, F2) and PECAM (C) shows that HAS2 is strongly expressed by vasculature (B, C arrows) and is also associated with Iba1-positive glial cells (E, arrows). By IHC fluorescence, neuronal cells (F1, F2, arrowheads) express HAS2 (red) that colocalizes with NeuN (G1, G2, green), as indicated by yellow fluorescence in merges H1 and H2. Nuclei in F1–H2 are stained with DAPI (blue). Image pairs D/E represent the same area of adjacent sections. Scale bars in B–E = 50μm. Scale bars in F1 and F2 = 10μm.
The organization of HA in tissues is mediated by hyaladherins that bind to HA and likely dictate its susceptibility to degradation. We observed a significant increase in mRNA coding for the hyaladherin TSG-6 in brain samples with high AD neuropathology relative to not AD brain samples (Fig. 4A). This increase was confirmed at the protein level by quantitative IHC performed on brain sections (Fig. 4B). Representative images of IHC for TSG-6 on not AD and high AD samples are shown in Fig. 4C and D, respectively. TSG-6 is constitutively expressed by astrocytes [15]. We found that TSG-6 was expressed by vasculature in the brain (Fig. 4E, F), as has been shown for vasculature in other organs [34], and in areas containing Iba1-positive microglial cells (Fig. 4G, H) and NeuN-positive neurons (Fig. 4I–K) [35].

Increase in TSG-6 with AD neuropathology. RT-PCR of brain tissue samples (A) shows that expression of TSG-6 mRNA is significantly increased in high AD. *p < 0.05, not AD versus high AD. Experiments were performed in triplicate with TSG-6 mRNA expression normalized to RPL13. Analysis of TSG-6 protein expression by quantitative IHC of brain sections (B) shows a significant increase in levels of TSG-6 with high AD. *p < 0.005, not AD versus high AD. IHC for TSG-6 in not AD brain samples shows minimal staining (C); however, in high AD samples, TSG-6 staining is prominent in parenchyma (D, arrow) and is also associated with vasculature (E, arrow) and microglial cells (G, arrows) (for comparison, PECAM-positive vasculature [F, arrows] and Iba1-positive microglial cells [H, arrows] in adjacent sections are shown). By IHC fluorescence, TSG-6 (I, red stain, arrows) colocalizes with NeuN (J, green stain, arrows) in neuronal cells of high AD samples, as indicated by yellow fluorescence (arrows) in merge K. Arrowheads in I, J, and K indicate areas of TSG-6 staining that are not associated with NeuN-positive cells. Nuclei in I–K are stained with DAPI (blue). Scale bars in C–K = 50μm.
DISCUSSION
It is increasingly appreciated that the ECM has both structural and regulatory effects on the surrounding microenvironment. The role of ECM in modulating cellular function is of particular interest in the brain, as this organ has little of the structural ECM components found in other organs (for example, collagens, fibronectin, etc.), but is rich in hyaladherins, including members of the lectican family of chondroitin/keratan sulfate proteoglycans (CSPGs) [36]. Thus, in this context, we confirmed that HA, a non-sulfated glycosaminoglycan that is a well-known regulator of a variety of cell behaviors [8], is increased in the ECM of brain parenchyma in subjects with AD neuropathology. HA also has a structural role that is mediated by its strong capacity to bind water—either directly or through its association with CSPGs. In addition, HA chains can become crosslinked, for example, by hyaladherins such as TSG-6 [14, 16].
Others have found HA accumulation in association with amyloid plaques [7]. In the present study, we advance this finding by demonstrating that HA is increased in association with Aβ and pTau and is found throughout the diffuse or loose ECM that resides between cells in the gray matter. In all samples, some HA was found in PNNs, which are lattices of specialized ECM that includes CSPGs. PNNs wrap around subsets of neurons and inhibit plasticity of the brain during aging and disease processes [10]. CSPGs in these structures are also thought to confer protection from Aβ [37].
Early studies of HA in the brain were limited by tissue processing protocols that destroyed the binding sites necessary for detection [38], although an increase in glycosaminoglycans in CD44-positive astrocytes in patients with AD was appreciated over two decades ago [39], and an increase in total proteoglycans in the hippocampus of AD subjects was demonstrated nearly a decade ago [40]. The application of HABP as an affinity reagent for histochemical detection of HA revealed the ubiquitous presence of HA in the CNS [41]. Studies of HA in brain were especially intriguing as they related to neuroinflammation; HA accumulation was observed in association with demyelination and it was proposed that the HA increase inhibited maturation of oligodendrocyte progenitors [42]. In human magnetic resonance imaging studies [4, 43], it was observed that white matter lesions were significantly associated with vascular injury and co-localized with areas rich in HA, as determined by histochemistry. In multiple sclerosis and experimental autoimmune encephalitis, areas rich in high MW HA were also associated with regions that showed expansion of oligodendrocyte precursors that are not able to remyelinate affected axons. The subsequent limitation of remyelination promotes ongoing white matter injury [42]. Data presented in the present study, in conjunction with these earlier studies, suggests a link between neuroinflammation, HA metabolism, and AD progression. Future studies are necessary in experimental systems to further understand these pathways, which may yield targets for therapeutic intervention in nascent AD.
Gender is associated with the incidence, prevalence, and progression of AD, as well as AD neuropathology. Whereas males may demonstrate a higher incidence of mild cognitive impairment, females are disproportionately affected by AD [44, 45]. Studies of the cerebrospinal fluid (CSF) of patients have found significant gender-dependent differences in HA content, such that males with AD had twice the HA content of females with AD, but there were no differences among controls [46]. It has also been noted that there is increased amounts of HA in the CSF of patients with vascular dementia, but no AD [47]. Although vascular dementia is a chronic process and regulation of HA occurs constantly and rapidly, the role of HA in the endothelial glycocalyx in modulating brain parenchyma and CSF HA levels in health and disease is poorly understood. We did not find gender differences in association with AD brain parenchyma HA levels, but we excluded subjects with significant microvascular brain injury, which is more prevalent in male dementia cohorts in some studies [48] and may account for lack of significant gender-related HA differences in this study of AD. Gender differences reflect both environmental exposures and genetic factors, such as the presence of the APOE ɛ4 allele; future studies to determine the role of gender-specific factors and APOE are needed to probe gender and genetic differences in HA in AD.
We and others have previously shown that HA levels increase in the brain parenchyma of rodents during normal aging [33, 49]; thus, the influence of advanced age on HA levels and metabolism, in general and in the context of AD, is of great interest. The subjects in the present study had an average age of 86 years and a range of 67–99 years, so comparisons could only be achieved between those that had reached 90 years or above versus those under 90 years [50, 51]. Within each group (not AD, intermediate AD, and high AD) we did not find an age-related difference in HA content; however, future studies are needed in humans to characterize brain HA changes across the entire aging spectrum in normal and AD subjects.
We expected, but did not find, a shift toward lower MW HA in brain samples with high AD pathology. However, overall HA content was increased in AD, which is of itself a novel finding. Additional studies are needed to determine how focal pathologies (amyloid plaques and neurofibrillary tangles) interact with local effects of increased HA. Such interactions are difficult to study using whole-tissue assays such as those performed here, but future efforts will examine the role of HA MW in AD. The size of newly-synthesized HA is thought to be HAS isoform-specific. All three HAS isoforms are found in the brain [21] and, collectively, generate HA with a broad MW distribution (200–2,000 kDa) [52]. However, whereas HAS3 has been shown to generate the smallest form of HA (100 kDa), it is generally accepted that HAS2 is the isoform that produces HA at the very high end of the MW spectrum (>2,000 kDa) [19, 52]. We found that the only HAS mRNA that was significantly increased in the high AD group was HAS2 mRNA, which suggests that HAS2 could contribute to the increased HA content associated with AD neuropathology. However, the HAS isoforms can produce HA cell surface coats of different thicknesses and structures and, moreover, can combine to form heteromeric complexes, which complicates establishing a direct relationship between specific HAS isoforms and HA content and MW [53, 54]. Future studies in animal models and cell culture systems are needed to further understand the relationship between HA, HAS2, and AD pathology.
TSG-6 is generally upregulated during inflammation and can also crosslink HA either directly or via catalysis of the covalent modification of HA with heavy chains (HC) from members of the inter-alpha-inhibitor family [14, 55]. Consequently, it is likely that the increase in TSG-6 (concomitant with increased HA) observed in the brains of patients with high AD neuropathology impacts HA accumulation and organization. The direct crosslinking of HA mediated by TSG-6 has a dramatic structural effect on HA, causing condensation and stiffening of HA chains [14, 16]. Such interactions between HA and TSG-6 might alter not only the mechanical and hydration state of brain tissue, but also influence the binding and signaling of HA and TSG-6 through widely expressed receptors such as CD44 [16–18, 55]. Beyond interacting with HA, TSG-6 has many other activities that can be protective and anti-inflammatory, across a wide range of cell types and tissue sites [14]. Furthermore, TSG-6 has also been implicated in certain lung pathologies, where this has been linked to its catalytic role in the formation of HC-HA complexes. There is some evidence supporting TSG-6-mediated production of HC-HA in the rodent CNS during glial scar formation [15]; however, the presence of HCs in human brain/CNS has not yet been investigated. Thus, in the context of AD, it is not currently clear what role TSG-6 is playing; i.e., whether TSG-6 is actively driving the pathology of the disease, or whether its increase in expression is indicative of an attempted, but failed, tissue-repair response.
There is great interest in examining individuals who have neuropathologic evidence of high AD, but do not have clinical dementia [56, 57], as a way to understand concepts of cognitive resilience. Future studies with additional samples and in-depth clinical data are needed to establish the relationship, if any, between HA and HA-associated ECM molecules and clinical manifestations of dementia. Our finding that HA levels and expression of the hyaladherin TSG-6 were significantly greater in brain samples with high AD neuropathology compared to intermediate AD and not AD specimens is a step toward understanding the role of HA and, broadly, ECM structure and function, in AD pathogenesis and progression.
Footnotes
ACKNOWLEDGMENTS
The authors thank Ms. Kim Howard for technical support, Ms. Allison Beller for administrative support, and Virginia M. Green, PhD for her assistance with the manuscript. This work was supported by the National Center For Advancing Translational Sciences of the National Institutes of Health under Award Number UL1 TR002319; NIH grants R03AG051071 and R21AG056883 (to M.J.R.), R01AG046619 (to W.A.B.), and R01EB012558 (to R.B.V.); a major award from the Klorfine Foundation (R.B.V.); the VA (W.A.B.); and the Nancy and Buster Alvord Endowment (C.D.K.). The authors also thank the University of Washington Alzheimer’s Disease Research Center (NIH P50 AG005136) and the Adult Changes in Thought Study (NIH U01 AG006781).