
Abstract
Hyperhomocysteinemia is an independent risk factor of Alzheimer’s disease (AD), which is not diagnosed for many years before onset due to lack of peripherally detectable early biomarkers. Visual dysfunction is prevalent in AD patients and correlates with the severity of cognitive defects. Importantly, alterations in eyes can be non-invasively detected. To search for early biomarkers in eyes from high risk factors of AD, we injected homocysteine (Hcy) into the rats via vena caudalis for 3, 7, and 14 days, respectively, and characterized the chronological order of the AD-like pathologies appearing in retina and the hippocampus during the progression of hyperhomocysteinemia, and their correlations with cognitive impairment. We found that administration of Hcy for 14 days, but not 3 or 7 days, induced hyperhomocysteinemia, although a gradually increased blood Hcy level was detected. In retina and/or the hippocampus, significant loss of retinal ganglion cells and stenosis of retinal arteries with the AD-like tau and amyloid-β (Aβ) pathologies and memory deficit were shown only in the 14-day Hcy group. Interestingly, accumulation of Ser262 hyperphosphorylated tau (pS262-tau) but not Aβ with decreased methylation of protein phosphatase-2A catalytic subunit (M-PP2Ac) and increased de-methylated PP2Ac (DM-PP2Ac) was detected in retina of the 3-day Hcy group, in which the retinal pathologies were preceded by those of the hippocampus. These findings suggest that elevated pS262-tau and DM-PP2Ac and reduced M-PP2Ac in retina may serve as surveillance biomarkers for diagnosis of the hyperhomocysteinemia-induced AD in the early stage.
Keywords
INTRODUCTION
Sporadic Alzheimer’s disease (AD) accounts for over 95% of the total cases of AD and cannot be diagnosed in the early stage. The current AD treatments only offer a small symptomatic benefit, likely because “probable AD” [1] can be diagnosed only when the pathologies are well advanced. However, the treatments may be most efficient in the early phases of the disease progression [2]. As the brain pathologies are not easily accessible, searching for feasible and early diagnostic biomarkers would consequently help development of treatment strategies to prevent or delay the neurodegenerative process [3]. To this end, the retina and multiple AD risk factors, including hyperhomocysteinemia, are the idea candidates.
Retina is an integral part of the central nervous system (CNS) and has long been considered as a window of the brain. The signals produced by light-sensitive photoreceptors transmit to bipolar cells and then to retinal ganglion cells (RGCs), which send the information via their optic nerve axons to the visual centers in the brain [4]. Visual deficits are significant and common in AD [5 –7]. Reduced visual acuity, impaired contrast sensitivity, and abnormal motion perception are found in AD. These correlations are tied with the severity of behavioral and cognitive deficits [8 –15]. For example, ∼50% of AD patients show profound loss of spatial and pattern vision, including contrast sensitivity [15]. About 50% of AD patients and 33% of individuals diagnosed with mild cognitive impairment (MCI) have visual motion perception deficits [6]. About 44% of AD-related senile dementia patients have visual sensitivity or visual field deficit [16]. Recently, the pathophysiological changes of Aβ and tau have been reported in the retina [17]. However, whether and how the pathologies in the eyeball, especially in the retina, precede those in the brain remains unclear.
The normal serum level of homocysteine (Hcy) is 5∼15μM/L [18 –21]. Hyperhomocysteinemia is an independent risk factor of AD [18 –21], and patients with hyperhomocysteinemia show ∼50% increased prevalence of suffering from AD [21]. Although hyperhomocystinemia has been generally associated with vascular damages that may in turn contribute to AD, it can also directly induce toxic effects on neurons [22 –24] to play a role in neural plasticity and neurodegeneration [25]. Previous studies demonstrated that administration of Hcy through venous caudalis for 14 days induced spatial memory deficits with AD-like tau and Aβ pathologies in the hippocampus[26, 27]. However, it is not clear whether elevation of Hcy can cause pathologies in eyeballs besides hippocampus, and if so, where the pathologies appear first.
To search for the early molecular markers in the eyeballs for potential early diagnosis of sporadic AD, here we injected rats with Hcy for 3, 7, and 14 days and measured the changes in both eyeballs (retina, cornea, and lens) and hippocampus. We found that Hcy decreased the number of RGCs and caused stenosis of retinal arteries. Memory deficit and certain AD-like tau and Aβ pathologies were only detected in 14 days Hcy group. Interestingly, accumulation of Ser262 hyperphosphorylated tau (pS262-tau) but not Aβ with decreased methylation of protein phosphatase-2A (M-PP2A) and increased de-methylated PP2A (DM-PP2A) was detected in retina of the 3-day Hcy group, in which the retina pathologies preceded those of the hippocampus. These findings may have important translational implications for early diagnosis of sporadic AD based on measuring the increased pS262-tau and DM-PP2A and a decreased M-PP2A in retina.
MATERIAL AND METHODS
Antibodies and chemicals
The primary antibodies used in current study are listed in Table 1. Oregon Green 488-conjugated goat anti-rabbit IgG (H + L) and Rhodamine Red-X-conjugated goat anti-mouse IgG (H + L) were obtained from Molecular Probes (Eugene, OR, USA). DL-homocysteine was obtained from Sigma Chemical Co. (St Louis, MO). Bicinchoninic acid (BCA) protein detection kit was from Pierce Chemical Company (Rockford, IL, USA).
Antibodies employed in this study
Animals and drug administration
Male Sprague-Dawley rats (3∼4-months old), supplied by the Experimental Animal Central of Tongji Medical College, Huazhong University of Science and Technology, were housed under a 12:12 light-dark (L/D) cycle with accessible water and food ad libitum. The animal experiments were performed according to the “Policies on the Use of Animals and Humans in Neuroscience Research” revised by the Society for Neuroscience in 1995, and all animal experiments were approved by the Animal Care and Use Committee of Huazhong University of Science and Technology (No. 2015042901739). This study was not pre-registered.
The rats were randomly divided into four groups. To induce hyperhomocysteinemia, the rats were injected with Hcy (400μg/kg/day) through vena caudalis for 3, 7, and 14 days, respectively, and normal saline (NS) with the same volume was injected as controls. The injection was implemented from 9:00 am to 11:30 am every day. The animals were sacrificed 24 h after the final injection following the measurement of behavior test and ocular fundus examination.
Novel object recognition test
The test was conducted in the open field arena (100×100 cm) and constituted three periods: habituation, acquisition, and retention. Rats were first habituated to the open field arena (without any object inside) for 30 min and placed back into the home cage for 1–2 min approximately. Afterwards two identical copies of the same objects were placed in the two corners of the open field arena, approximately 4 cm from the sidewall. The rat was placed back into the same arena facing the opposite side of the objects and allowed to explore the setting freely for 10 min. After this acquisition phases, the rat was placed back into the home cage. Following various retention intervals (10 min for short term memory, 24 h for long term memory) the subject rat was transferred back to the arena where one of the identical objects was replaced by a novel object. The rat was allowed to explore the setting for 10 min as before. Recorded videos were scored manually with a stopwatch. Object exploration was defined as a clear nose contact with the object. To measure the recognition memory, a preference index for the novel object was calculated as the ratio of the time spent exploring the novel object over the time spent exploring the old object [(Discrimination index (DI) = (Novel object exploration time − familiar object exploration time)/(Novel object exploration time + familiar object exploration time)] and the time spent freezing during the three different test sessions (habituation, training, and test phase) was scored using the video tracking software. Rats displayed object exploration of less than 10 s was excluded from data analysis.
Open field test (OFT)
The test was done to assess rats’ locomotor activity and exploration in a novel environment. The open field space consisted of an open rectangular plastic box (100 cm×100 cm×40 cm). The floor was divided by lines into 25 equal squares (20 cm×20 cm). In the meantime, rats were marked by an investigator blind to the experimental design. During the test, the rats were put in the center of the box and were allowed to explore freely for 5 min. The total squares a rat crossing in the arena was defined as zone crossing number. After every test, the area was cleaned with 75% alcohol to ensure the next rat’s behaviors will not be affected by the current one.
Immunohistochemistry and hematoxylin-eosin (HE) staining
For immunohistochemical studies, rats were sacrificed by overdose chloral hydrate (1 g/kg) and perfused through the aorta with 100 ml 0.9% NaCl followed by 400 ml phosphate buffer containing 4% paraformaldehyde. The brains were removed and post-fixed in perfusate overnight and then cut into sections (30μm) with a vibratome (Leica, Nussloch, Germany; S100, TPI). The eyes were removed and paraffin embedded then cut into sections (4μm). The sections of rat brain or retina were collected in PBS consecutively for immunohistochemistry staining. Free floating sections were blocked with 0.3% H2O2 in absolute methanol for 30 min and nonspecific sites were blocked with bovine serum albumin for 30 min at room temperature. Then sections were incubated overnight at 4°C with primary antibodies (see Table 1). After washing with PBS, sections were incubated with biotin-labeled secondary antibodies for 1 h at 37°C. The immunoreaction was measured using horseradish peroxidase-labeled antibodies for 1 h at 37°C and visualized with the diaminobenzidine tetrachloride system (brown color). For each primary antibody, 3 to 5 consecutive sections from each brain or retina were used. The images were observed using a microscope (Olympus BX60, Tokyo, Japan). For immunofluorescence staining, free floating slices were incubated at 4°C overnight with 6E10, pS262, and anti-demethylated (DM)-PP2A. The secondary antibodies conjugated to Alexa-Fluor 488/546 were added to the coverslip for 1 h at room temperature, and then DAPI (1:1, 000) for 10 min. The coverslips were washed and mounted onto slides and imaged under a Carl Zeiss LSM710 confocal microscope. The HE staining was carried out by following the instructions of the Kit (Beyotime, China), and the images were taken by using an optical microscope (Olympus BX60, Tokyo, Japan).
Fundus photography and optical coherence tomography (OCT)
The central retina (radius of 3–4 disc diameters around the disc) of the SD rats was detected under a microscope (Zeiss, Thornwood, NY) using hydroxypropyl methylcellulose ophthalmic (Goniosol; Novartis, Basel, Switzerland). The entire retina, including the peripheral retina up to the ora serrate in all directions, was examined and photographed using fundus camera (Micron; Toshiba, Irvine, CA).
Sandwich enzyme linked immunosorbent assay (ELISA)
ELISA was performed to detect the plasma level of Hcy and the level of Aβ1 - 42 in hippocampal and retina extracts by following the manufactures’ instruction (Elabscience, Wuhan, China).
Western blotting
The dissected tissues from hippocampi or eyes were homogenized or lysed in RIPA buffer and then centrifuged for 10 min at 5,000×g. The supernatant was collected and the protein levels were analyzed by bicinchoninic acid (BCA) assay [28]. The proteins were separated by SDS/PAGE and transferred onto PVDF membrane. The membrane was blocked with 5% non-fat milk dissolved in Tris-buffered saline (TBS) containing 50 mM TrisHCl (pH 7.6) and 150 mM NaCl for 1 h and then incubated with primary antibodies (shown in Table 1) for 18 h at 4°C, followed by washing with TBS-Tween-20 and incubation with the secondary antibody (1:10, 000; Odyssey) at room temperature for 1 h. The immunoreactive bands were visualized with the Odyssey Infrared Imaging System (Li-Cor Biosciences) and quantitatively analyzed by Image J software.
Long-term potentiation (LTP)
Rats (3 m old) were deeply anesthetized as mentioned above. When all pedal reflexes were abolished, brains were removed and placed in ice-cold oxygenated slicing solution containing the following: 225 mM sucrose, 1.25 mM NaH2PO4, 3 mM KCl, 6 mM MgSO4, 24 mM NaHCO3, 0.5 mM CaCl2, and 10 mM d-glucose. Coronal slices (350μm thick) containing the dorsal hippocampus were cut at 4–5°C in the slicing solution using a Leica VT1000S vibratome and then transferred to an incubation chamber for 1 h filled with oxygenated slicing solution before being recorded. The slices were laid down in a chamber with an 8×8 microelectrode array in the bottom planar (50×50μm in size with an interpolar distance of 150μm) and kept submerged in artificial cerebrospinal fluid (aCSF) with a platinum ring glued by nylon silk. Signals were acquired with the MED64 System (Alpha MED Sciences, Panasonic). The fEPSPs in CA1 neurons were recorded by stimulating the Schaeffer fibers from CA3. LTP was induced by using three trains of high-frequency stimulation (HFS; 100 Hz, 1 s duration).
Statistical analyses
Data were analyzed using commercial software (GraphPad Prism, GraphPad Software, Inc, La Jolla, CA; SPSS version 21.0 for Windows, SPSS Inc., Chicago, IL, USA). The Student’s t–test for two-group comparisons, or two–way ANOVA or one–way ANOVA followed by post hoc tests for multiple comparisons among more than two groups were used to determine the different means among groups. The results were presented as mean±SEM and p < 0.05 was accepted as statistically significant.
RESULTS
Hcy exposure for 14 days but not 3 or 7 days induces synapse and recognition memory deficits
Hyperhomocysteinemia produced by vena caudalis injection of Hcy for 14 days induces AD-like spatial memory deficit with Aβ and tau pathologies [26, 27]. Since no obvious change was seen among control animals injected with saline for different intervals [26], here we only showed the control (Con) received saline at day 0 (Fig. 1A). To explore whether recognition memory deficits build up progressively in hyperhomocysteinemia, we injected the rats with Hcy (400μg/kg/day) for 3, 7, and 14 days, respectively (Fig. 1A). The plasma Hcy concentration was increasing during 3, 7, and 14 days according to the standard [18 –21]; hyperhomocysteinemia was only detected after 14 days injection (Fig. 1B). Then we employed novel object test to evaluate the recognition memory at different time points (Fig. 1C). The recognition memory deficit was only observed in the rats received 14 days Hcy injection (Fig. 1D). No difference of total distance and zone crossing number were detected among groups by open field test (OFT), suggesting no motor dysfunction and anxiety behavior in the Hcy rats (Fig. 1E, F). These data identify that venous administration of Hcy for 14 days, but not 3 and 7 days, induces hyperhomocysteinemia with recognition memory deficit.
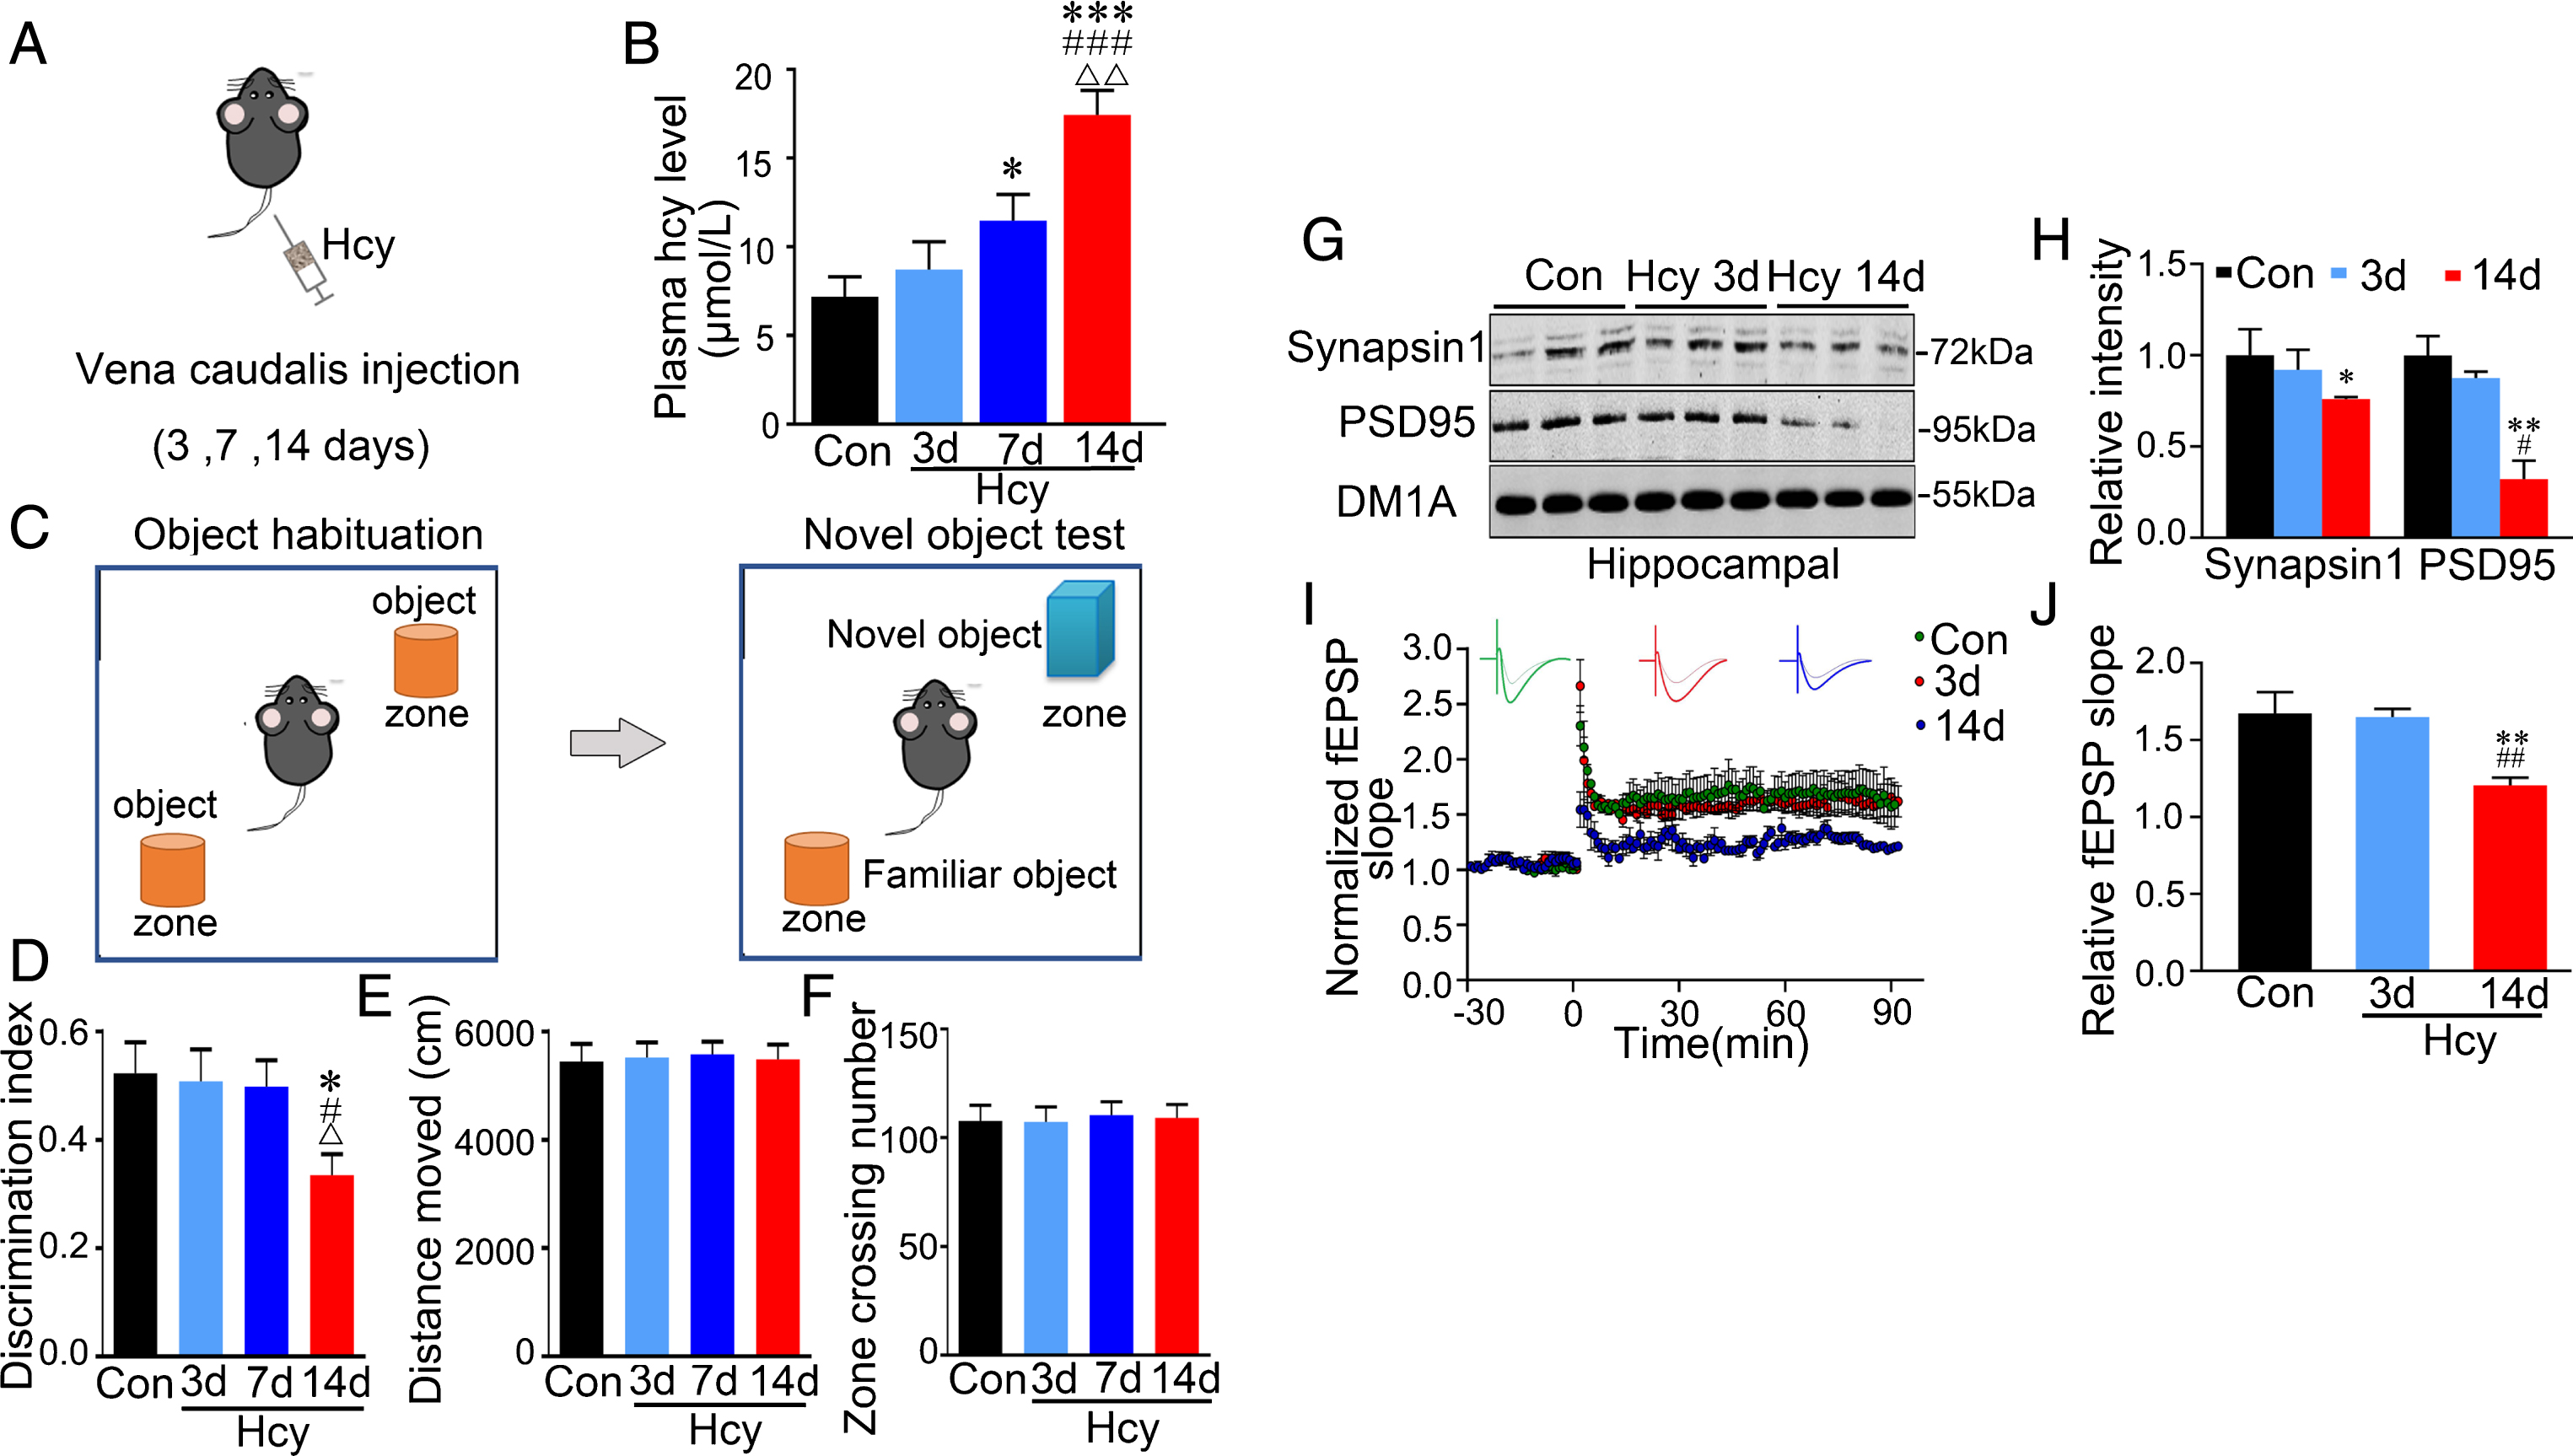
Hcy administration for 14 days, but not for 3 or 7 days, induces hyperhomocystinemia with recognition memory deficit and synaptic impairment. A) Experimental schematic diagram: rats were injected via vena caudalis with Hcy (400μg/kg/day) or normal saline as control for 3 days, 7 days, and 14 days, respectively. B) Sandwich ELISA reveals a time-dependent increase of plasma Hcy level upon Hcy treatment. C) Schematics illustrate object habituation and novel object test. D) The rats received Hcy injection for 14 days show decreased discrimination index in novel object test. E, F) Hcy injection does not affect motor function (E) and anxiety behavior (F) in the open field test. G, H) Hcy decreases protein levels of synapsin-1 and PSD95 in hippocampus after 14-day injection measured by western blotting. I, J) Hcy impairs synaptic plasticity shown by decreased slop of the evoked fEPSP (I), and the decrease was still significant at 90 min after high frequency stimulation (HFS) (J). The sample size is composed of 6∼7 rats for each group and each trace is the average of 10∼12 slice recordings. Data were expressed as mean±SEM. * p < 0.05, ** p < 0.01, *** p < 0.001, versus control; # p < 0.05, # # p < 0.01, # # # p < 0.001 versus Hcy 3 days; Δ p < 0.05, ΔΔ p < 0.01 versus Hcy 7 days.
To evaluate synaptic function during Hcy exposure, we performed western blotting and ex vivo brain slice electrophysiological recording. Compared with control, Hcy significantly decreased protein levels of syanpsin-1 and PSD-95 in hippocampal extracts (Fig. 1G, H) with significant suppression of field excitatory postsynaptic potential (fEPSP) after high-frequency stimulation (HFS) in rats received 14 days but not 3 days Hcy injection (Fig. 1I, J). These data show that only long-term (14 days) but not short-term (3 days) of Hcy exposure induces synaptic dysfunction.
Hcy exposure for 14 days but not 3 or 7 days impairs retinal artery and RGCs without affecting retinal geomorphic feature
Substantial retinal lesion had been reported in AD patients [29, 30]. To explore the retinal changes at early stage of Hcy exposure, we first conducted fundus photography examination. We observed that Hcy injection for 14 days but not 3 or 7 days induced arterial stenosis and vessel distortion in retina (Fig. 2A–C). By HE staining, we also observed vacuolar disarrangement and nuclear shrinkage in RGC layer with significantly decreased RGC number in rats with 14 days Hcy exposure (Fig. 2D, E). Although the cell number in INL also showed a decreasing trend, the difference did not reach statistical significance in the 14-day Hcy exposure rats (Fig. 2F). Hcy exposure did not change the topographic feature of retina viewed by OCT, as all the layers were smooth and RNFL thickness was normal in all Hcy-injected groups compared with saline-injected controls (Fig. 2G, H). These data suggest that Hcy exposure for 14 days, but not 3 or 7 days, impairs retinal arteries and induces RGC death without affecting the geomorphic feature of retina.

Hyperhomocystinemia impairs retinal blood vessels and causes cell death. A) The representative retina images recorded by fundus photography. Arrow heads indicate tortuous and narrow artery, the bottom panel shows a representative vessel in retina. Quantification of diameters of vessels and the number of distorted vessels in retina shown in (B, C). Hcy treatment for 14 days, but not for 3 days or 7 days, induces a narrowing in vessel diameter with an increased in the number of distorted vessels in retina. D) The representative retina images of HE staining. Black and green arrows indicate vacuolar spaces and nuclear shrinkage, respectively. GCL, ganglion cell layer; INL, inner nuclear layer; ONL, outer nuclear layer [n = 3, scale bar: 10μm (upper) and 50μm (below)]. E, F) The decreased RGC number with unchanged INL cell number in the 14-day Hcy group analyzed by Image J software. G, H) The representative retina images recorded by optical coherence tomography (OCT): Hcy did not significantly affect retinal laminar structure (G) and the RNFL thickness (n = 3, scale bar: 100μm). Data were expressed as mean±SEM. * p < 0.05, versus control; # p < 0.05, versus Hcy 3 days; Δ p < 0.05, versus Hcy 7 days.
Hcy exposure for 3 days induces retinal Ser262-tau hyperphosphorylation preceding that of the hippocampus
Accumulation of Aβ and tau is the recognized pathology in AD brain. Therefore, we studied whether retinal Aβ and tau were altered in Hcy-injected rats, and if so, what is the chronological order in retina and brain. By ELISA and western blotting, we found that the levels of Aβ42 and the phosphorylated tau at Ser396 epitope were significantly increased in retina but not in cornea and lens after 14 days of Hcy injection (Fig. 3A–D). These data demonstrate that Hcy can increase Aβ level and tau phosphorylation selectively in retina but not in cornea and lens in 14-day Hcy rats.
To characterize Aβ distribution within retina in Hcy rats, immunohistochemistry and immunofluorescence staining were performed at different time points after injection. Compared with the controls, Aβ staining was started to show in INL and GCL layers of the retina in the 7-day Hcy group, and significant Aβ accumulation was only detected in the 14-day Hcy group (Fig. 4A, B). By ELISA assay using Aβ42-specific antibody, significant elevation of Aβ42 in retina was only detected in the 14-day Hcy group (Fig. 4C). We also observed that elevation of AβPP, PS1, and BACE-1 in retina was only detected in the 14-day Hcy group (Fig. 4D, E). Interestingly, although the increase of Aβ in total hippocampal extracts was only detected by ELISA in the 14-day group (Fig. 4F), a remarkably increased Aβ expression in hippocampal CA3 was detected in the 3-day Hcy group (Fig. 4G). These data suggest that Aβ and its producing system are activated in both retina and hippocampus during Hcy exposure, and the retinal Aβ pathology lags behind hippocampus.
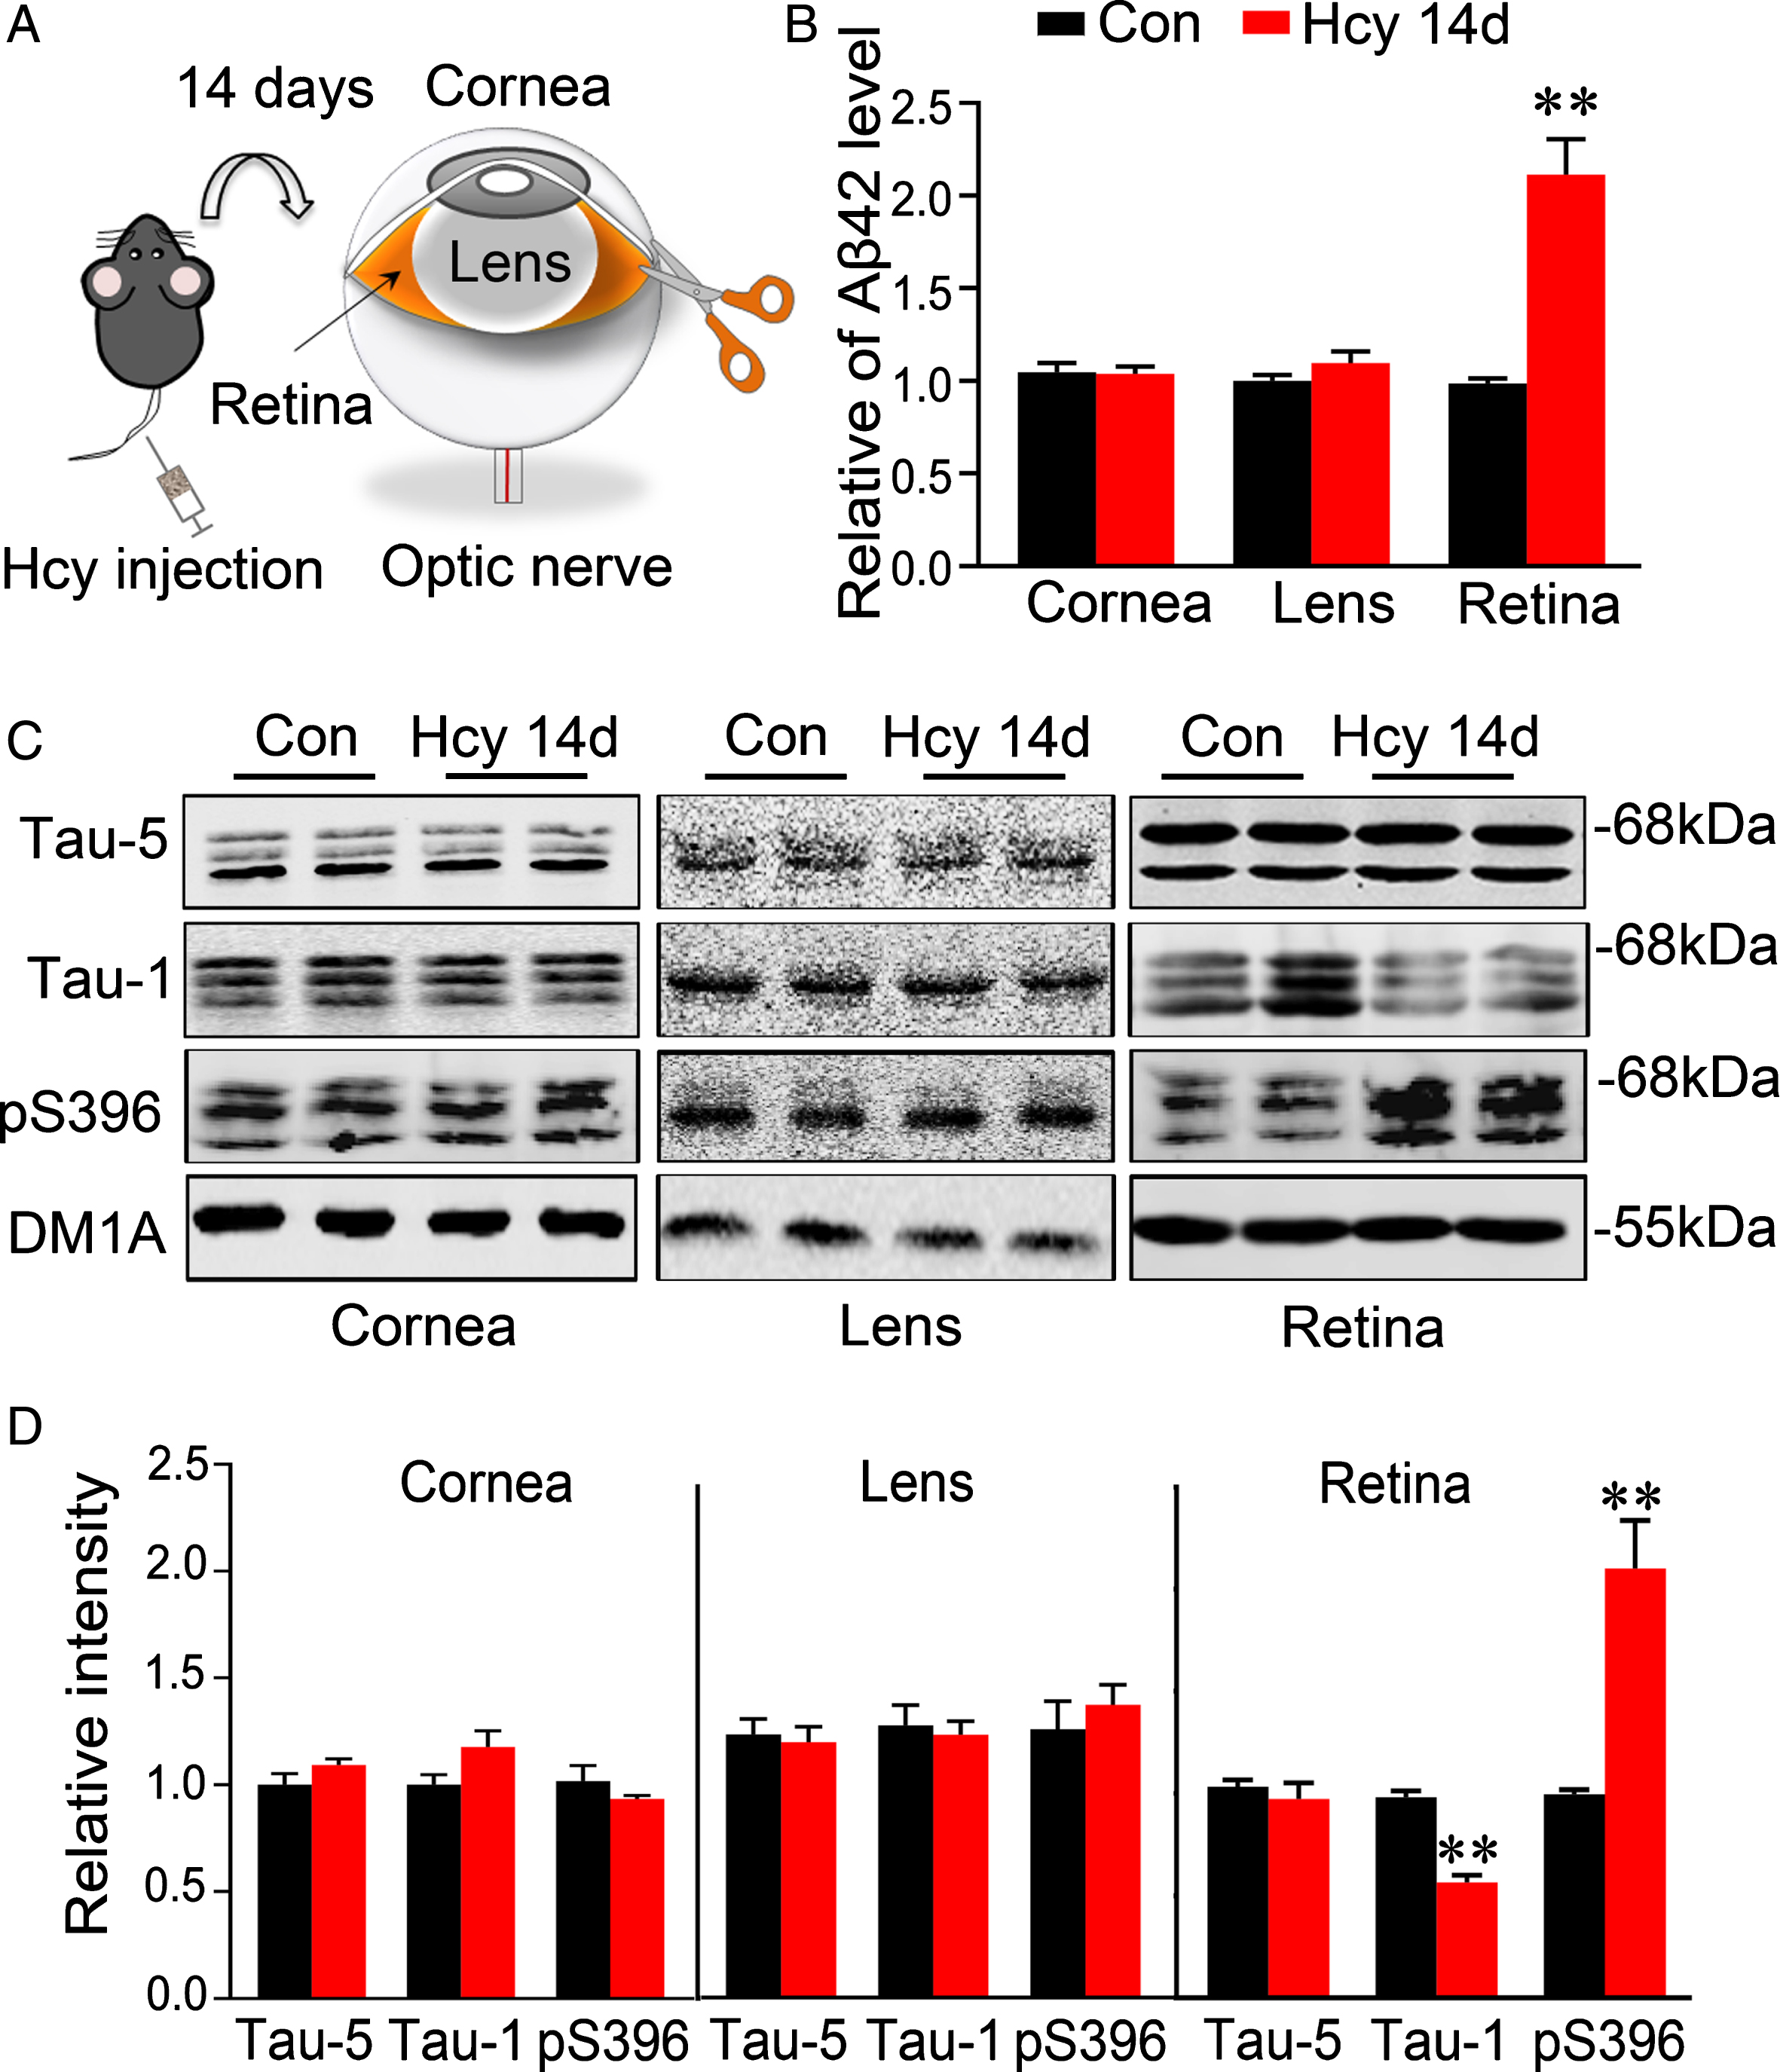
Hyperhomocystinemia induces AD-like Aβ and tau pathologies in retina but not in cornea and lens. A) Experimental schematic diagram to illustrate experimental procedures: Rats were injected via vena caudalis with Hcy or normal saline for 14 days, and then the retina, cornea, or lens were collected for measurement of Aβ and tau. B) Hcy increased Aβ42 level in retina but not in cornea or lens measured by ELISA. C, D) Hcy increased tau phosphorylation in retina but not in cornea or lens measured by western blotting. Data were expressed as mean±SEM. ** p < 0.01, versus control.
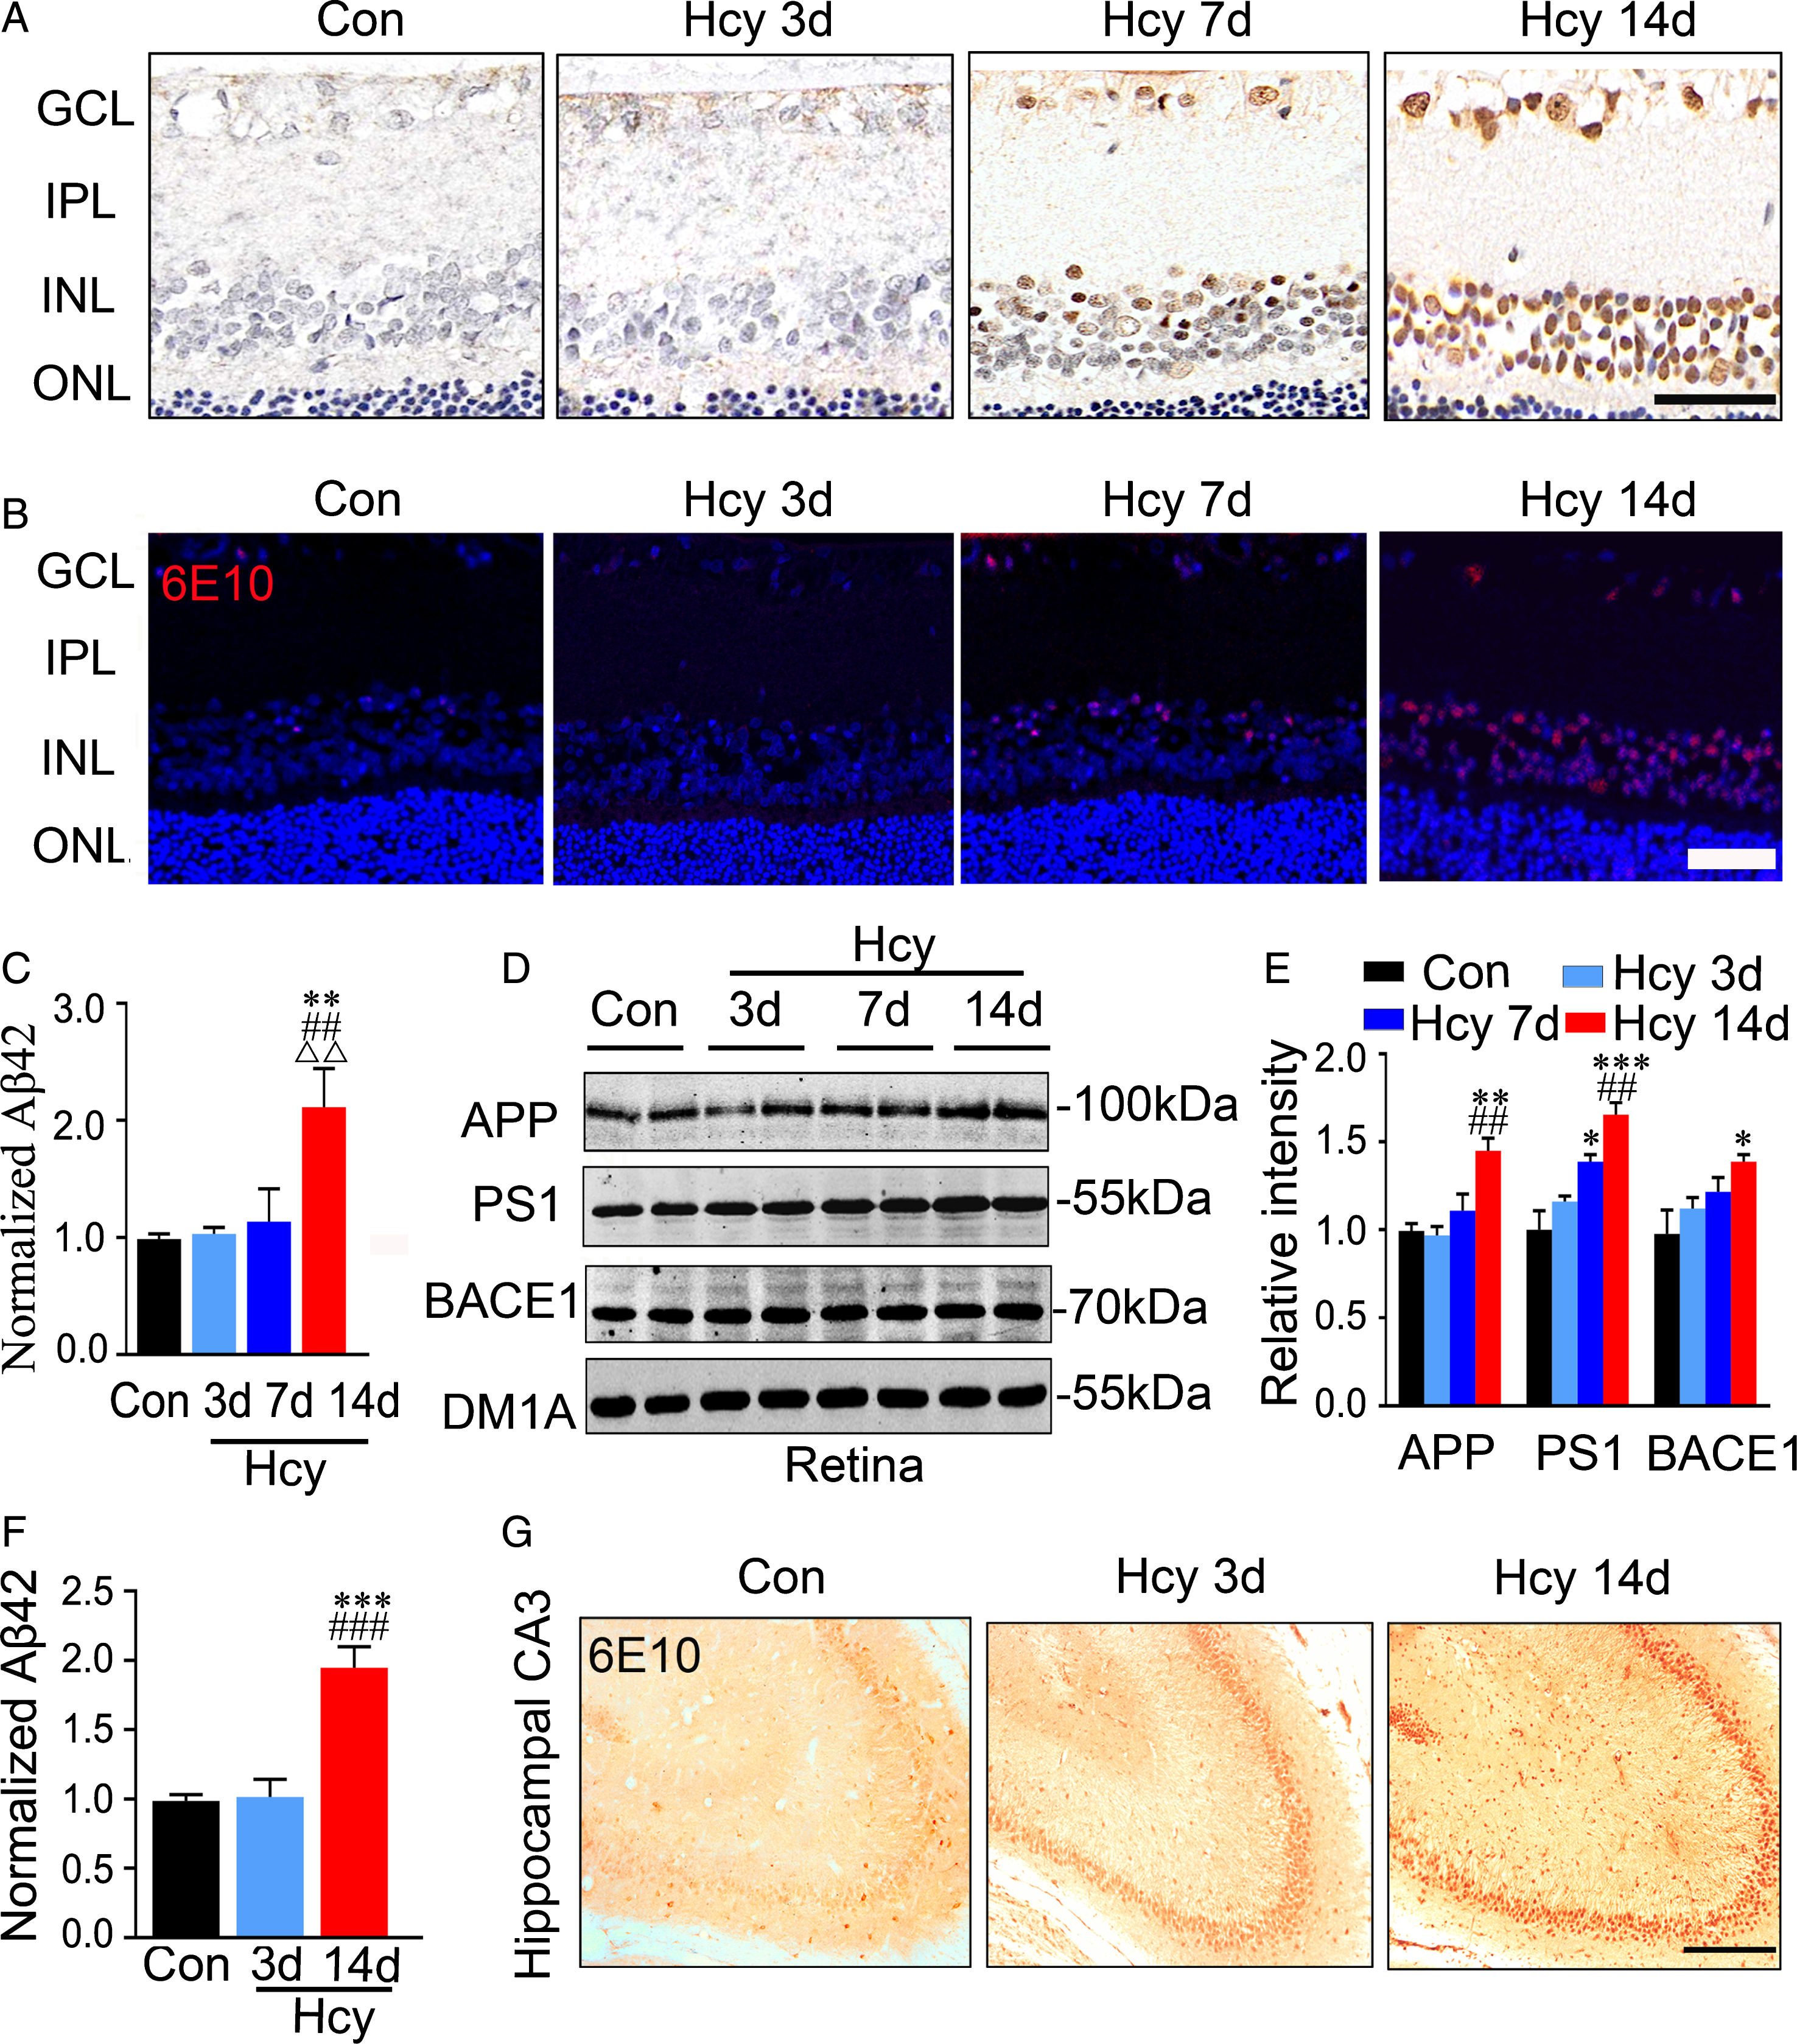
Aβ accumulation in retina lags behind its build up in hippocampus of the Hcy-injected rats. A, B) The representative retina images of Aβ accumulation measured by immunohistochemical and immunofluorescent staining using 6E10 (n = 3, scale bar: 50μm). C–E) The increased levels of Aβ42, AβPP, PS1, and BACE1 measured, respectively, by ELISA and western blotting in retina rats with Hcy injection for 14 days. F, G) A significantly increased Aβ42 was detected by ELISA in total hippocampal extracts, and the enhanced 6E10 immunoreactivity was already shown at 3 days after Hcy administration. Data were expressed as mean±SEM. * p < 0.05, ** p < 0.01, *** p < 0.001, versus control; # # p < 0.01, # # # p < 0.001, versus Hcy 3 days; ΔΔ p < 0.01, versus Hcy 7 days.
The tangles formed with hyperphosphorylated tau is the major protein component of neurofibrillary tangles in the degenerated neurons of AD brains [31 –33]. Therefore, we analyzed tau phosphorylation in retina and hippocampus by using phosphorylated tau-specific antibodies, pS262, pS356, pT212, pS214, and pS422, which react with the AD-related epitopes [34 –38]. By immunohistochemistry and immunofluorescence staining, we observed accumulation of pS262-tau in INL after 3 days Hcy injection, and the accumulation was extended to the inner plexiform layer (IPL) and GCL of retina after 14 days Hcy injection (Fig. 5A, B). In retina, we observed that Hcy exposure increased tau phosphorylation at Ser365 at 14 days, while the increase of tau phosphorylation at Ser262 was started to show at 3 days of Hcy injection (Fig. 5C, D). And Hcy did not change the phosphorylation level of tau at pT212, pS214, and pS422 epitopes in retina (Fig. 5C, D). In hippocampal CA3 subset, Hcy increased Ser262 phosphorylated tau only in the 14-day group (Fig. 5E, F). In hippocampus, Hcy exposure induced tau hyperphosphorylation at Ser262, Ser356, and Ser214 only in the 14-day Hcy group (Fig. 5G, H). These data together demonstrate that increase of pS262-tau in retina precedes that of the hippocampus, suggesting that pS262-tau may serve as a feasible biomarker for early diagnosis of AD.
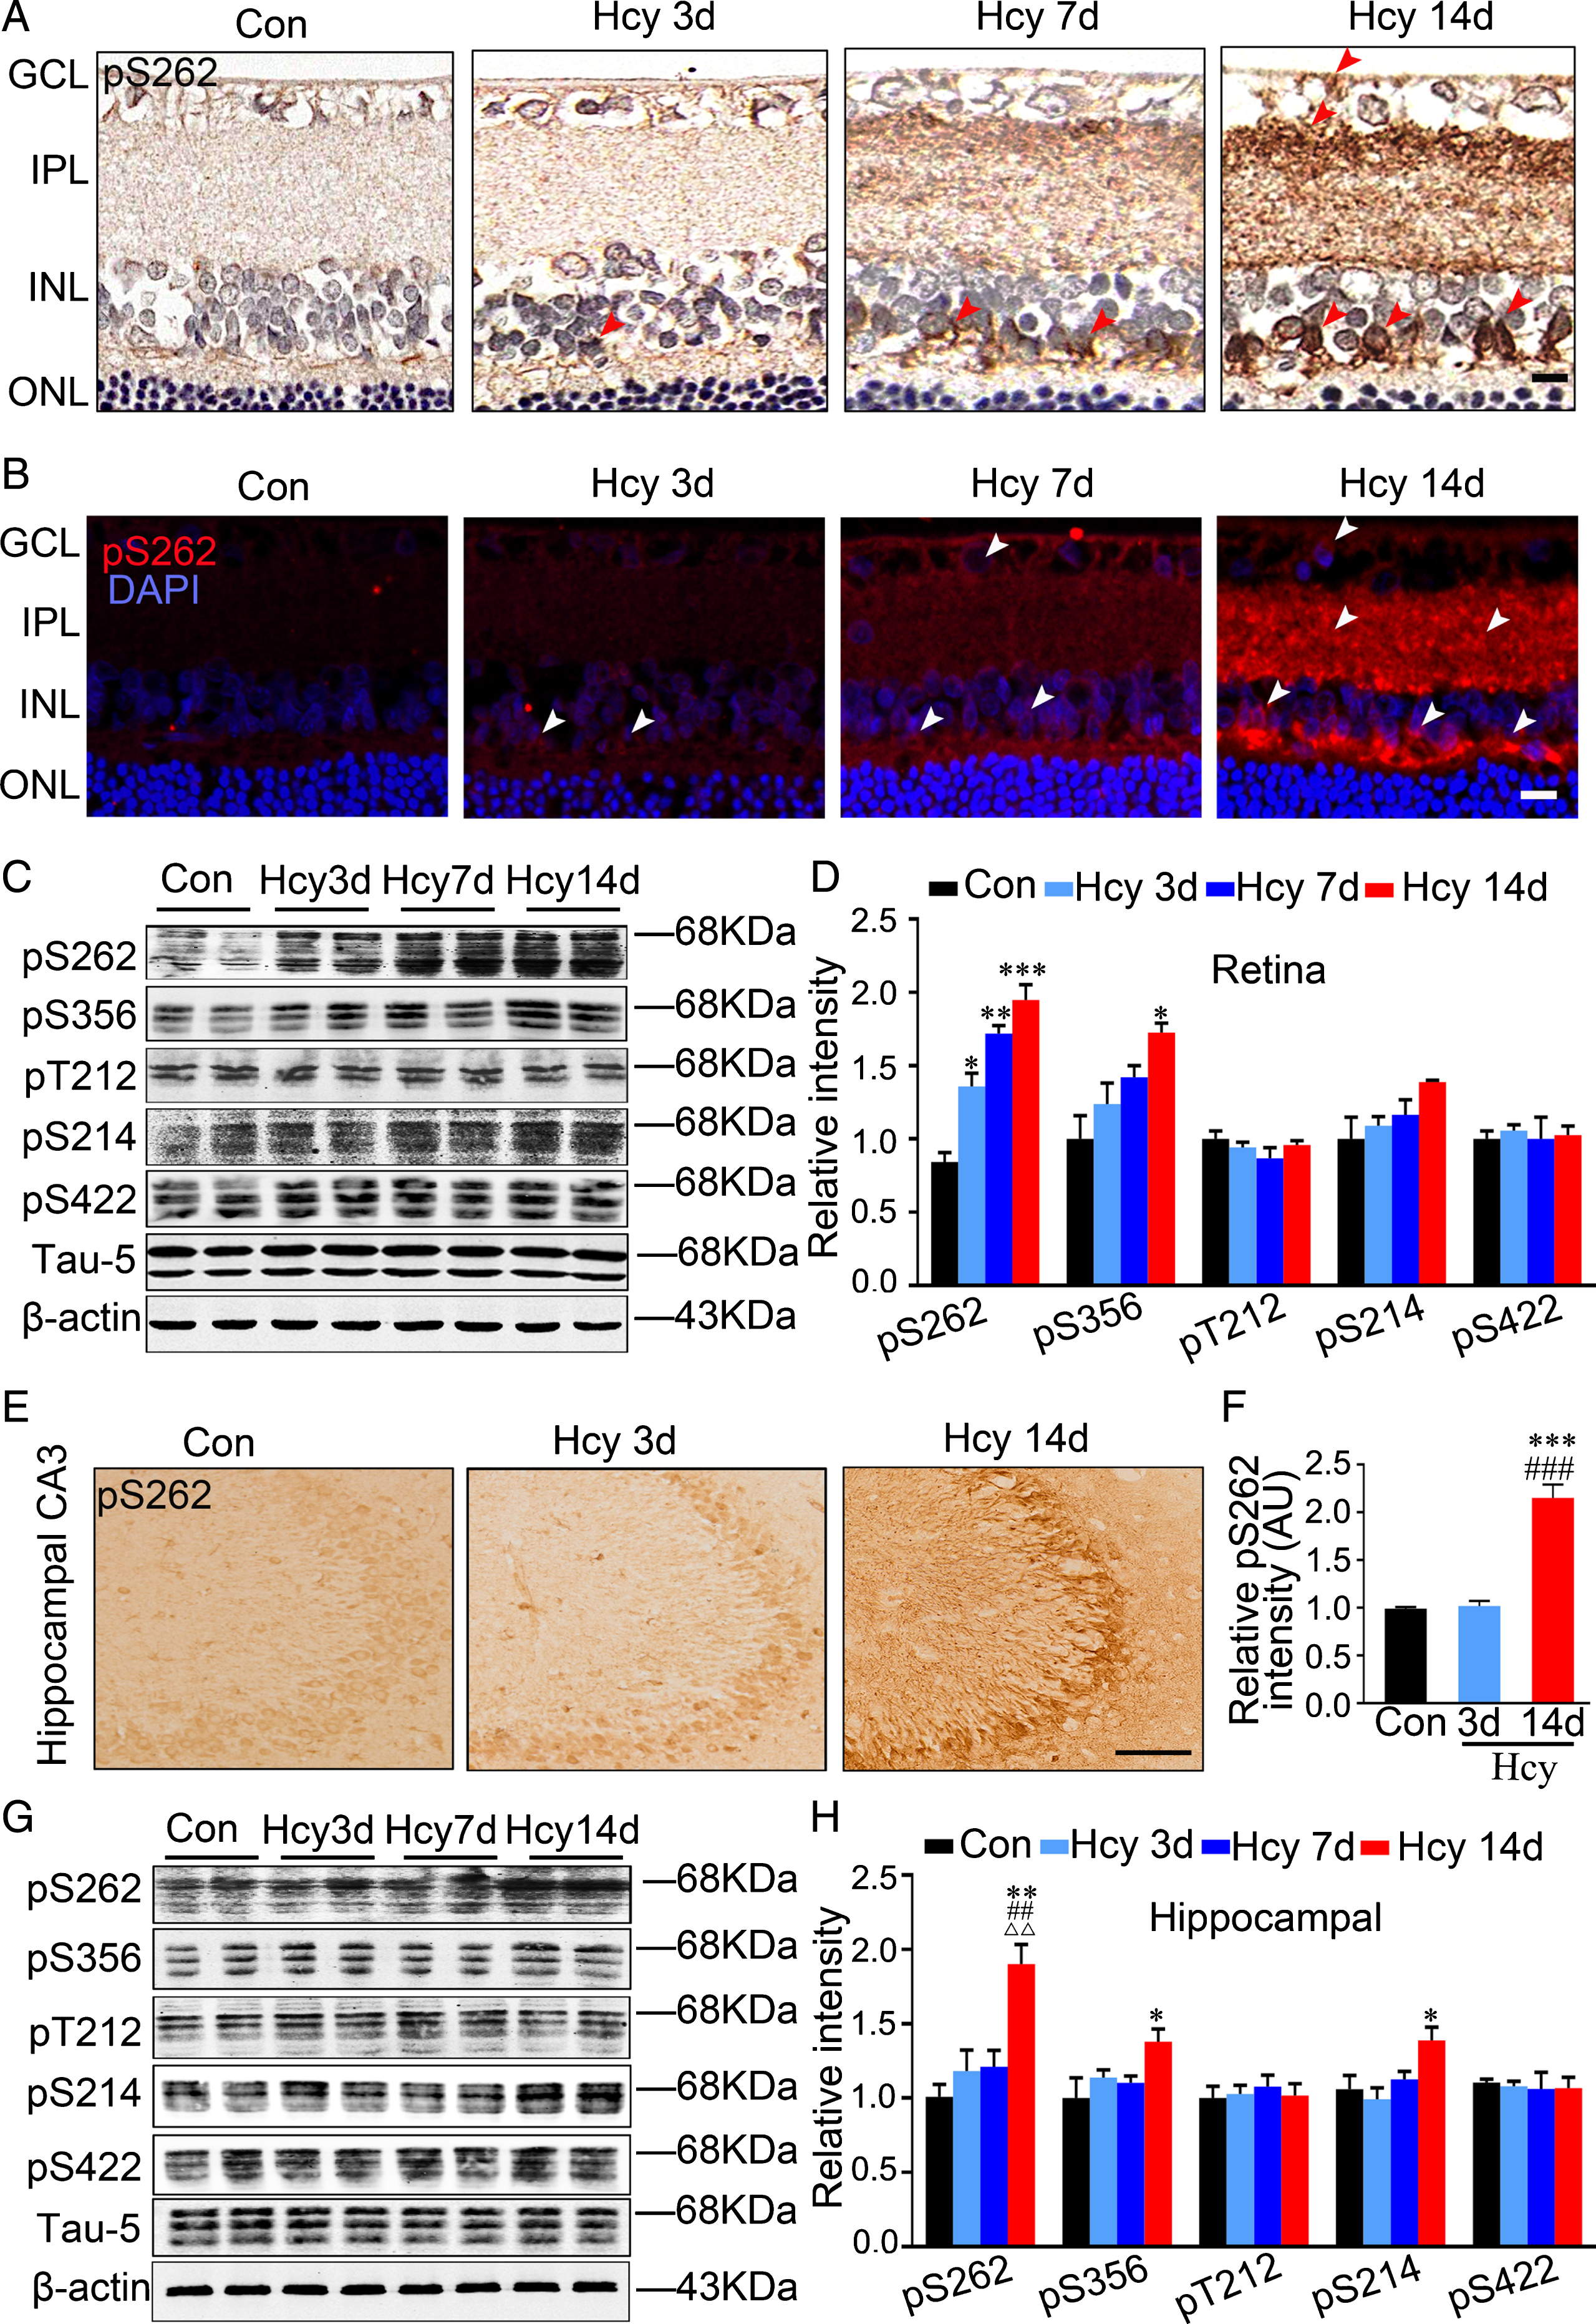
Hcy-induced tau hyperphosphorylation in retina precedes its build up in hippocampus. A–D) In retina, Hcy administration induces a time-dependent tau hyperphosphorylation at Ser262 measured by immunohistochemistry (A) and immunofluorescence (B) and western blotting (C, D). Arrow heads indicate neurons with hyperphosphorylated tau (n = 3, scale bar: 10μm). E–H) In hippocampus, the increased tau phosphorylation at Ser262, Ser356, and Ser214 was only seen at 14 days after Hcy injection measured by immunohistochemistry (n = 3, Scale bar: 10μm) and western blotting. The phosphorylation level of tau was normalized to total tau level probed by tau5. The total level of tau was normalized by β-actin. Data were expressed as mean±SEM. * p < 0.05, ** p < 0.01, *** p < 0.001, versus control; # # p < 0.01, # # # p < 0.001 versus Hcy 3 days; ΔΔ p < 0.01, versus Hcy 7 days.
Hcy exposure for 3 days decreases methylation level of PP2A in retina preceding that in the hippocampus
Activation of protein kinases and/or inhibition of protein phosphatases are the direct cause of tau hyperphosphorylation. Among various kinases and phosphatases, GSK-3β and PP2A are the most implicated. Therefore, we measured the levels of GSK-3β and PP2A. We observed that Hcy did not change the total GSK-3β or the Ser9-phosphorylated GSK-3β in retina and hippocampus (Fig. 6A–D). Hcy exposure for 3 days significantly decreased methylated PP2A (M-PP2A, the active form) with an increased demethylation (DM-PP2A, inactive form) and unchanged total PP2A level in retina (Fig. 6A, B). In hippocampus, the significant reduction of M-PP2A and increase of DM-PP2A were only detected in the 14-day Hcy group (Fig. 6C, D). Additionally, the phosphorylation of PP2A at Y307 (pY307-PP2A, the inactive form) increased in both retina and hippocampus of the 14-day Hcy group (Fig. 6A–D). By immunohistochemical and immunofluorescent staining, we also observed that Hcy exposure for 3 days significantly increased DM-PP2A in GCL and INL (Fig. 6E), while Hcy increased hippocampal DM-PP2A only in the 14-day Hcy group (Fig. 6F). We also measured the alterations of related proteins including extracellular signal-regulated kinase (ERK), protein kinase A(PKA), and calcium/calmodulin-dependent protein kinase II (CaMKII) in retina by western blotting. We found that Hcy significantly increased p-ERK and the activity of PKA at 7 days and the phosphorylation level of pT286-CaMKII at 14 days, while Hcy did not change the total levels of CaMKII and ERK in retina (Supplementary Figure 1). These data suggest that in addition to PP2A inhibition, activation of mitogen-activated protein kinase (MAPK), PKA, and CaMKII may also contribute to the Hcy-induced pS262-tau hyperphosphorylation in the retina.

Hcy-induced PP2A demethylation in retina precedes the hippocampus. A, B) In retina, Hcy decreases the methylated PP2A (M-PP2A) with an increased level of the de-methylated PP2A (DM-PP2A) at 3 days after Hcy injection. The increased tyrosine-307 phosphorylation of PP2A (PP2A-Y307) was detected at 14 days, and no changes of GSK-3β and GSK-3β-S9 were observed upon Hcy administration. C, D) Hcy increases PP2A-Y307, DM-PP2A while decreases M-PP2A in hippocampus at 14 days after Hcy injection. E) The representative images of DM-PP2A in retina measured by immunohistochemistry (upper) and immunofluorescence (below). Increased DM-PP2A immunoreactivity was already detected in GCL and INL of the retina in the 3-day Hcy treatment mice. F) In hippocampal CA3, the increased DM-PP2A was only detected at 14 days but not at 3 or 7 days after Hcy injection (n = 3, Scale bar: 10μm). The phosphorylation level of GSK-3β, PP2A, M-PP2A, and DM-PP2A was normalized to the total level, and the total level of PP2A and GSK-3β was normalized to β-actin. Data were expressed as mean±SEM. * p < 0.05, ** p < 0.01, *** p < 0.001, versus control; # p < 0.05, # # p < 0.01 versus Hcy 3 days; Δ p < 0.05, versus Hcy 7 days.
Hyperhomocystinemia induced the activation of microglia in the retina
Astrocyte and microglia are sensitive to retina injury, altering their phenotype and morphology to adopt activated state in response to retina insults. Immunohistochemistry of glial fibrillary acidic protein (GFAP) (Supplementary Figure 2A, B) and Iba1 (Supplementary Figure 2C, D) staining were performed at different time points after injection. We observed Hcy did not significantly change the level of GFAP (Supplementary Figure 2A, B), while the accumulation of Iba1 in the retina was increased after 14 days Hcy injection (Supplementary Figure 2C, D).
DISCUSSION
AD is the most common type of senile dementia in the elderly. By the time symptoms suggestive of clinical diagnosis appear, the brain damages may be too extensive to be healed [39]. Thus, it is in urgent need to identify feasible and specific early diagnostic biomarkers for the population at risk to developing AD. Hyperhomocysteinemia is an independent risk factor of AD [18, 21]. Intravenous injection of Hcy for 14 days induces tau and Aβ pathologies in hippocampus with memory impairment in rats [26, 27]. With direct nerve bonds to the brain, the retina could be an ideal/accessible target for monitoring the progression of brain damage and for early diagnosis of certain brain disorders. Based on these, we studied the pathological changes in retina and the chronological order of the pathologies in retina and hippocampus during the progression of hyperhomocystinemia. To this end, we injected rats with Hcy through vena caudalis for 3, 7, and 14 days, respectively, and measured the AD-like changes in both retina and the hippocampus.
We found that injection of Hcy for 14 days induced severe vessel damage and cell death in retina and a gradually increased accumulation of tau and Aβ in both retina and hippocampus. Our findings in hippocampal pathologies of 14-day Hcy exposure rats were consistent with the previous reports [26, 27]. The AD pathologies have been observed in the retina of 5×FAD and 3×Tg AD mice [40]. We also reported recently that supplement of folic acid and vitamin B12 could attenuate hyperhomocysteinemia-induced pathologies in retina [41]. However, we demonstrated in the current paper that Hcy exposure for 3 and 7 days did not induce memory deficit or severe pathologies in hippocampus or retina. More importantly, we found that the remarkable increase of pS262-tau and DM-PP2A and decrease of M-PP2A in retina were shown at very early stage of hyperhomocystinemia, and these changes were preceded the hippocampal pathologies and memory impairment. These novel findings reveal that the increased pS262-tau and DM-PP2A and the decreased M-PP2A in retina may serve as biomarkers for surveillance or early diagnosis of hyperhomocysteinemia-induced AD, which has significant translational implication.
Many studies suggest that it is elevated Aβ that triggers tau pathologies in hippocampus [42 –44], therefore, lower Aβ level could significantly attenuate tau accumulation in hippocampus [45, 46]. In the current study, we observed in Hcy rats that accumulation of the abnormally hyperphosphorylated tau proteins preceded Aβ build-up in the retina, suggesting that orders of Aβ and tau pathologies during AD on set and progression may be brain region-specific. We also found that retinal tau accumulation appeared earlier than that of the hippocampus, which is consistent with Chiasseu’s work on 3×Tg mice [40]. Hyperphosphorylated tau has been found in AD brain and correlates with severity of disease [45, 47]; however, nothing is known about how epitope-specific phosphorylation of tau proteins are altered in the retina during the AD process. We found that accumulation of hyperphosphorylated tau at SerS262 and Ser356 was significant in both hippocampus and retina of 14-day Hcy rats, while increased phosphorylation at Ser262 in retina was already significant at 3 days after Hcy administration. The pS262-tau is abundant in pre-tangles or neurons that have not yet formed mature neurofibrillary tangles [48], suggesting that it may represent an early phosphorylation site in the AD brains. It also prime tau for further phosphorylation at other sites [49]. Our current data suggest that pS262-tau may serve as an early retinal marker for monitoring the conversion of Hcy to AD, which can be verified by future follow-up studies.
PP2A, a serine/threonine protein phosphatase, plays a major role in dephosphorylating tau [50 –52]. PP2A is composed of a catalytic subunit (PP2Ac) and a regulatory subunit, and the PP2A alone possess enzyme activity. The highly conserved carboxyl-terminal sequence of PP2A has a Thr-Pro-Asp-Tyr-Phe-Leu motif. This motif contains Tyr307 and Leu309, the focal sites for the regulation of PP2A activity [53, 54]. In AD brains, PP2A activity is inhibited by an increased phosphorylation at Tyr307 [55, 56], and/or an increased demethylation or decreased methylation at Leu309 [56]. Our data show that administration of Hcy decreases the methylation and increases demethylation of PP2A at very early stage, which correlated with the hyperphosphorylation of tau at Ser262 in retina. PP2A is an efficient phosphatase in dephosphorylating tau at Ser262 [51]. Therefore, these findings not only provide early retina biomarker for hyperhomocystinemia-induced AD, but also reveal the mechanism underlying the Ser262-tau hyperphosphorylation in retina of the Hcy rats. Hyperhomocystinemia is an independent risk factor of AD; therefore, early detection of AD-like pathologies in hyperhomocystinemia patients may lead to early diagnosis of AD. As the invasive measurement of brain pathologies is almost not acceptable in living patients, the retina could be an ideal window to non-invasively surveil the incipient of AD. For instance, researchers have used a retinal curcumin optical imaging approach in rodent AD models and living patients to detect amyloid deposits in retina [57, 58]. Using retinal fundus photography and OCT, they can analyzed single, cluster, and large-area deposits with increased curcumin fluorescent intensity in human subjects [59]. Therefore, we may design the specific cell-penetrating fluorescent antibody for pS262 and/or other related markers to measure the retinal changes during the progression of hyperhomocystinemia, so that to assess noninvasively the disease progression and/or monitor the response to therapy.
In summary, the present study reveals that the increased pS262-tau and DM-PP2A and a decreased M-PP2A in retina are promising non-invasive early biomarkers, which may be used for early diagnosis of AD in the population of hyperhomocysteinemia patients.
Footnotes
ACKNOWLEDGMENTS
We thank Prof. Xiangtian Zhou of School of Optometry and Ophthalmology and Eye Hospital, Wenzhou Medical College, China, for his technique support. This work was supported in parts by the Ministry of Science and Technology of China (2016YFC1305801), and the Natural Science Foundation of China (31730035, 91632305, 81721005, and 81471303).