
Abstract
Background/Objective:
Higher white matter hyperintensity (WMH) load has been reported in Alzheimer’s disease (AD) patients in different brain regions when compared to controls. We aimed to assess possible differences of WMH spatial distribution between AD patients and age-matched controls by means of lesion probability maps.
Methods:
The present study included MRI scans of 130 probable AD patients with a mean age of 73.4±8.2 years from the Prospective Dementia Registry Austria Study and 130 age-matched healthy controls (HC) from the Austrian Stroke Prevention Family Study. Risk factors such as hypertension, diabetes mellitus, hypercholesterolemia, coronary artery disease, and smoking were assessed. Manually segmented FLAIR WMH masks were non-linearly registered to a template and voxel-based probability mapping was performed.
Results:
There were no significant between-group differences in cardiovascular risk factors and WMH volume. AD patients showed a significantly higher likelihood of having WMH in a bilateral periventricular distribution than controls before and after correcting for age, sex, cardiovascular risk factors, and ventricular volume (p≤0.05; threshold-free cluster enhancement corrected). There was no significant association between the periventricular WMH volume and cognitive decline of AD patients.
Conclusion:
In AD, WMH were preferentially found in a periventricular location but the volume of lesions was unrelated to cognitive decline in our study irrespective of lesion location.
Keywords
INTRODUCTION
White matter hyperintensities (WMH) become more prevalent with aging and generally result from cerebral small vessel disease [1]. Increased frequencies and extent of WMH has also been reported in Alzheimer’s disease (AD) [2]. Several studies have found higher WMH load in AD patients in periventricular [3, 4] and in subcortical frontal and parietal white matter [4]. There have also been studies reporting that WMH in the periventricular region [5] and parietal lobes [6, 7] increase the risk for future AD.
Most studies investigating the location of WMH in AD used visual rating [2, 5]. We here extend previous work by using voxel-based probability mapping in age-matched AD patients and controls with comparable WMH volume to assess the pattern of WMH spatial distribution in AD and normal aging. Voxel-based probability mapping has previously been used in healthy aging cohorts [8, 9] in subjects with risk for AD [10] and in AD patients [11, 12]. Our patients are from the Prospective Dementia Registry Austria Study (PRODEM-Austria) [13] and controls from the Austrian Stroke Prevention Family Study (ASPSF) [14]. We also test if WMH in AD specific locations relate to future cognitive decline.
METHODS
Study subjects
The present study included subjects from the ongoing longitudinal multi-center cohort study PRODEM-Austria [13]. Dementia was diagnosed according to DSM-IV criteria [15]. Those 130 study participants with a diagnosis of probable AD meeting the NINCDS-ADRDA criteria [16] and complete MRI examination were included. Study participants (male/female = 48/82) with a mean age 73.4±8.2 years (range 50 to 89 years) received a comprehensive clinical evaluation and underwent testing using a standardized neuropsychological test battery, as extensively described previously [13, 17]. In brief, assessment of cognitive function included the Mini-Mental State Examination (MMSE) [18], the Clinical Dementia Rating Scale (CDR) [19], and the “Consortium to Establish a Registry for Alzheimer’s disease (CERAD-Plus)” [20] at baseline and at subsequent examinations at 6, 12, and 24 months. Cognitive assessment for our study was available for 113 patients at baseline. The CERAD-Plus data were transformed into z-scores and corrected for age, sex, and education. All study participants had at least one follow-up of cognitive testing, and we calculated the annualized change for cognitive measures by dividing the score difference between follow-up and baseline measurements by the time interval between examinations. MRI examination and clinical assessment were conducted at the Medical Universities of Graz, Innsbruck, Vienna and the Kepler University Hospital Linz, and were obtained according a standardized study protocol.
The control group included 130 age-matched (±5 years; male/female = 50/80) healthy controls (HC) from the ASPSF. ASPSF is a prospective single-center, community-based follow-up study of the normal elderly population of the city of Graz, Austria, including individuals without neuropsychiatric disease randomly selected from the community register [14].
Risk factors such as hypertension, diabetes mellitus, hypercholesterolemia, coronary artery disease, and smoking were assessed in patients and controls and defined on the basis of history and taken medications. Hypertension was considered as a systolic blood pressure over 140 mmHg or a diastolic blood pressure over 90 mmHg [21] and/or current use of antihypertensive agents. Diabetes mellitus was determined if a subject had as physician-diagnosed history diabetes, used antidiabetics or had a fasting blood glucose level above 126 mg/dl (7.0 mmol/l) at the time of examination [22]. Hypercholesterolemia was defined as low-density lipoprotein cholesterol≥160 mg/dL and/or use of cholesterol-lowering agents [23]. Coronary artery disease was defined as a history or signs of myocardial infarction, angina pectoris, or atrial fibrillation at the time of examination. The status of smoking was classified as never, previous, or current smoking.
The study was approved by the ethics committees of all contributing centers. All study subjects or their caregivers signed informed consent.
Magnetic resonance imaging
Magnetic resonance imaging protocol
All MRI protocols between centers were standardized. MRI scans were obtained on a 3 T (Magnetom TrioTim; Siemens, Erlangen, Germany) and 1,5 T scanners (Magnetom TimTrio, (Magnetom Avanto or and Symphony TIM; Siemens, Erlangen, Germany) using a standardized scanners sequence protocol. The MRI conventional protocol included an axial T2w-FLAIR sequence (TR = 10000 ms, TE = 69 ms, TI = 2500 ms, TI = 800/1100 ms (1.5/3 T), number of slices = 40, slice thickness = 3 mm, in-plane resolution = 0.9×0.9 mm2) and a high-resolution T1-weighted 3D MPRAGE sequence covering the with magnetization preparation and whole entire - brain in 1 mm isotropic resolution coverage (TR = 1900 ms, TE = 2.19 ms, TI = 1100/900 ms (1.5/3 T), flip angle = 9°, isotropic resolution = 1 mm).
Image analysis
Masks of WMH were drawn on the T2w-FLAIR-sequence by two experienced raters using the semi-automatic lesion segmentation program DispImage [24]. Thereby, the rater identified each lesion slice by slice by marking a point inside each lesion and the algorithm automatically drew the borders of the lesion. In case of misclassification, the rater modified the lesion masks manually [24].
The WMH volume was calculated using fslstats from the FMRIB’s Software Library (FSL) [25]. Intracranial and ventricular volumes (right and left lateral ventricles) were computed from the T1 weighted MPRAGE images using FreeSurfer [26]. The manually segmented WMH masks were non-linearly transformed using the structural T1 scan in the MNI152 space (Montreal Neurological Institute) by FSL-FLIRT [27] and FSL-FNIRT [28]. All registrations steps were visually inspected.
Frequency WMH maps for each group were formed using fsladd by averaging the lesion masks, which were previously co-registered into the MNI152 space.
Voxelwise statistics has been performed with the General Linear Model using FSL randomize tool [29], presented by non-parametric permutation tests. Significant clusters were defined by means the threshold-free cluster-enhancement (TFCE), controlling for family-wise error rate [30]. Clusters were interpreted statistically significant at p≤0.05. The resulting TFCE corrected p-value map was thresholded at a level of 0.05 and binarized. Further, it was multiplied with the t-value map to determine only significant voxels.
The resulting unsmoothed significant voxel mask of the differences between AD and HC was then inversely transformed to obtain the significant lesion load for each individual of the AD group (Fig. 1).

Schematic view of the three main processing steps (A-C) in order to assess the individual amount of WMH located in the AD-related periventricular areas. A) For each subject, the manual segmented WMH masks on T2-FLAIR scans were co-registered on the T1-scan. The figure shows a representative example of the AD cohort. B) The resulting (unthresholded and unsmoothed) significant voxel map of the voxelwise paired t-test comparison between AD and HC in the MNI space (“AD>HC map”) was registered on the T1-scan of each individual subject of the AD group, using a non-linear transformation, and was finally thresholded at a level of 0.95. C) Representative example of the co-registration of the manual segmented WMH mask (green), the significant-voxel map “AD>HC map” (red) and the resulting intersecting areas (blue), which represent the amount of WMH inside the AD-related periventricular areas.
Statistical analysis
For the statistical analysis, we used the Statistical Package for the Social Sciences version 20. Normal distribution was tested with the Kolmogorov-Smirnov test and nonparametric Mann-Whitney U-test was used for the group comparisons of age, MMSE, WMH and ventricle volume. Differences of risk factors and sex between groups were assessed by Pearson’s chi-square test.
To find possible differences in WMH spatial distribution between AD and HC, we used a voxelwise paired t-test, generating 5000 permutations. Voxels in which WMH were significantly more common in AD than in HC at p-values≤0.05 (TFCE corrected) were denoted. Three models were analyzed. Model 1 compared AD and HC without correction for possible confounders. Model 2 adjusted for hypertension, diabetes mellitus, hypercholesterolemia, coronary artery disease, smoking, sex, and age. Model 3 was corrected for all model 2 variables plus ventricular volume. All covariates were demeaned before entering the design matrix.
Multiple linear regression analysis was performed to assess whether the volume of WMH in AD-related voxels (all voxels found to be significantly more commonly affected by WMH in AD than in controls) were predictors of cognitive decline as assessed by CERAD-Plus, MMSE, and CDR in AD patients. For analyses all variables were standardized by calculating z-scores. All multiple linear regressions models were adjusted for age, years of education, and intracranial volume. Data were considered significant at p≤0.05. Adjustment for multiple testing was made using the Bonferroni correction.
RESULTS
As can be seen from Table 1, there were no significant differences in age, sex, ICV, WMH, hypertension, hypercholesterolemia, diabetes, coronary artery disease, and smoking between AD patients and controls.
Demographic, clinical, and MRI characteristics of the groups
HC, healthy controls; AD, Alzheimer’s disease; IQR, interquartile range; n, number of persons; ICV, intracranial volume. aMann-Whitney-U-test for continuous, bPearson χ2 for nominal variables were applied.
The mean pattern of WMH spatial distribution in AD patients and HC, overlaid on the T1-MNI brain, is shown in Fig. 2.
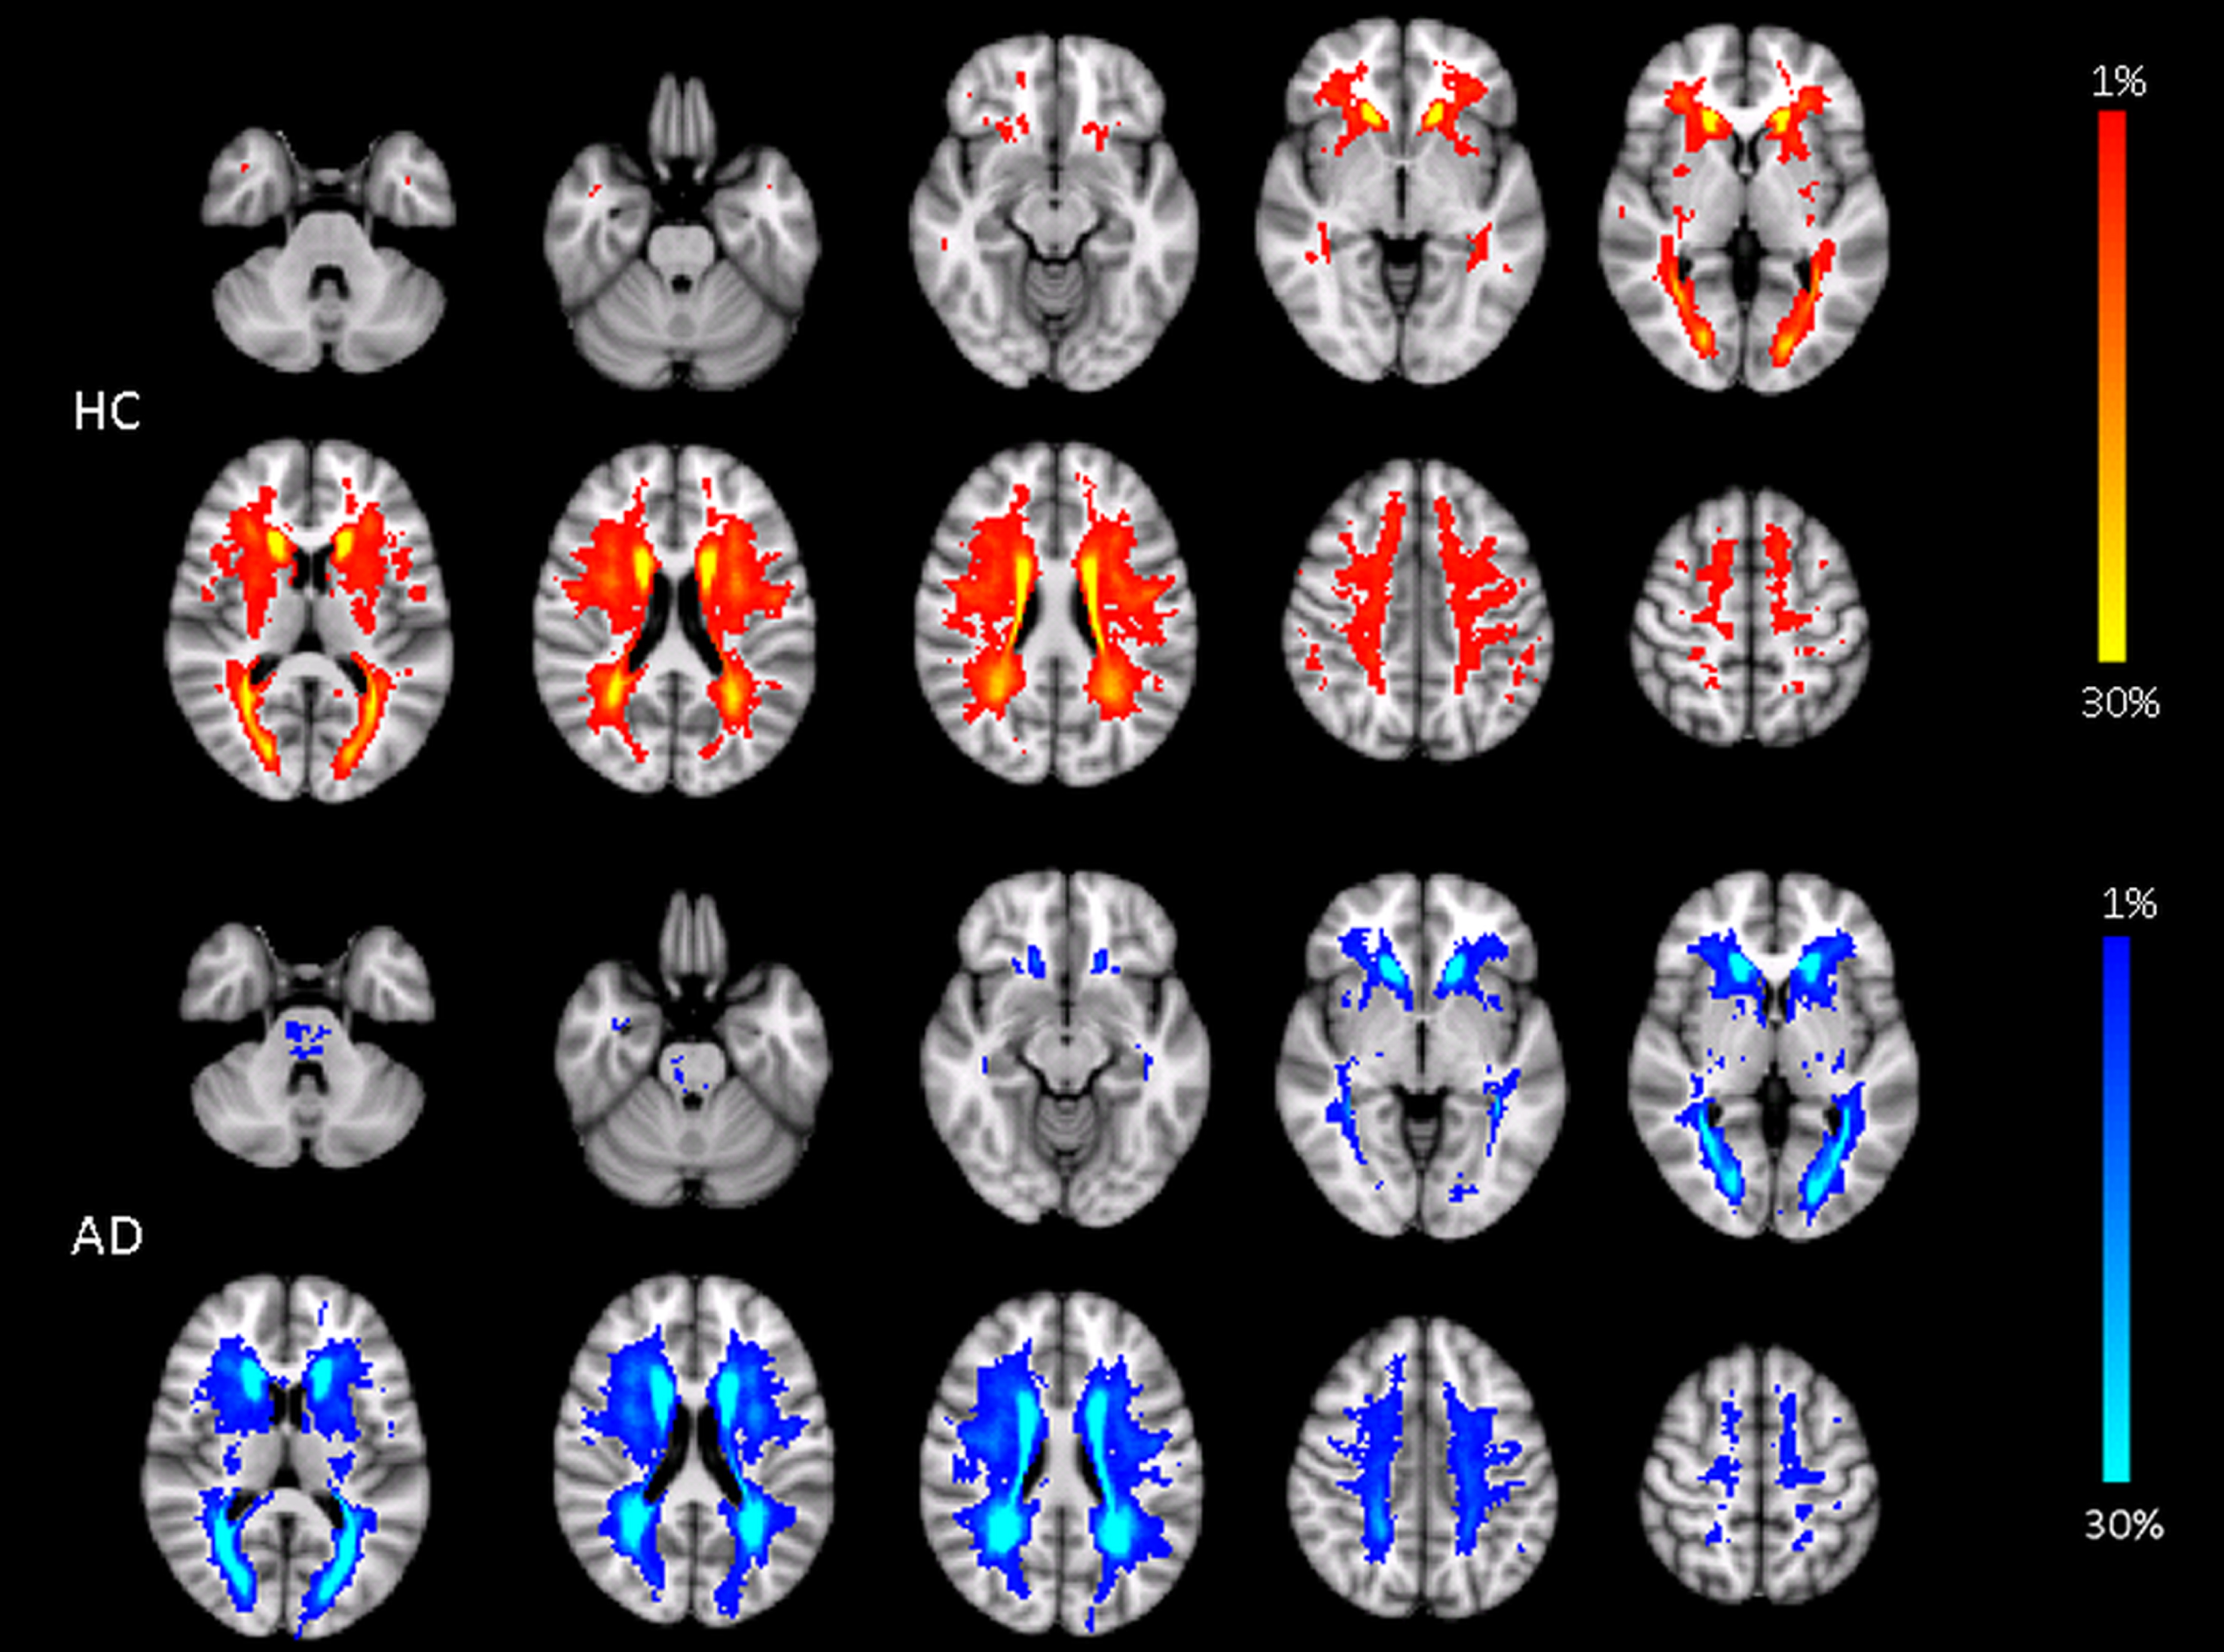
Frequency maps of WMH distribution in HC and AD. Axial views demonstrate the mean pattern of WMH in AD patients and HC overlaid on the T1-MNI brain. Red-yellow colors denote voxels for HC and blue-lightblue colors for AD group. The percentage of lesion probability is indicated by the color bar.
Using voxelwise comparison of lesion masks in AD patients versus age-matched HC, overlaid on the T1-MNI brain template, AD patients showed a higher likelihood of having WMH in a bilateral periventricular distribution than controls (p≤0.05; TFCE corrected) (Fig. 3, model 1). After adjusting for hypertension, diabetes mellitus, hypercholesterolemia, coronary artery disease, smoking, sex, and age the number of significant voxels decreased by 12% in comparison to model 1 (Fig. 3, model 2) and additional correction for ventricular volume (Fig. 3, model 3) reduced significant bilateral periventricular WMH voxels by another 27%. However as can be seen from Fig. 3 even the fully corrected model delineated periventricular WMH in a symmetric distribution to be significantly more common in AD than in HC.
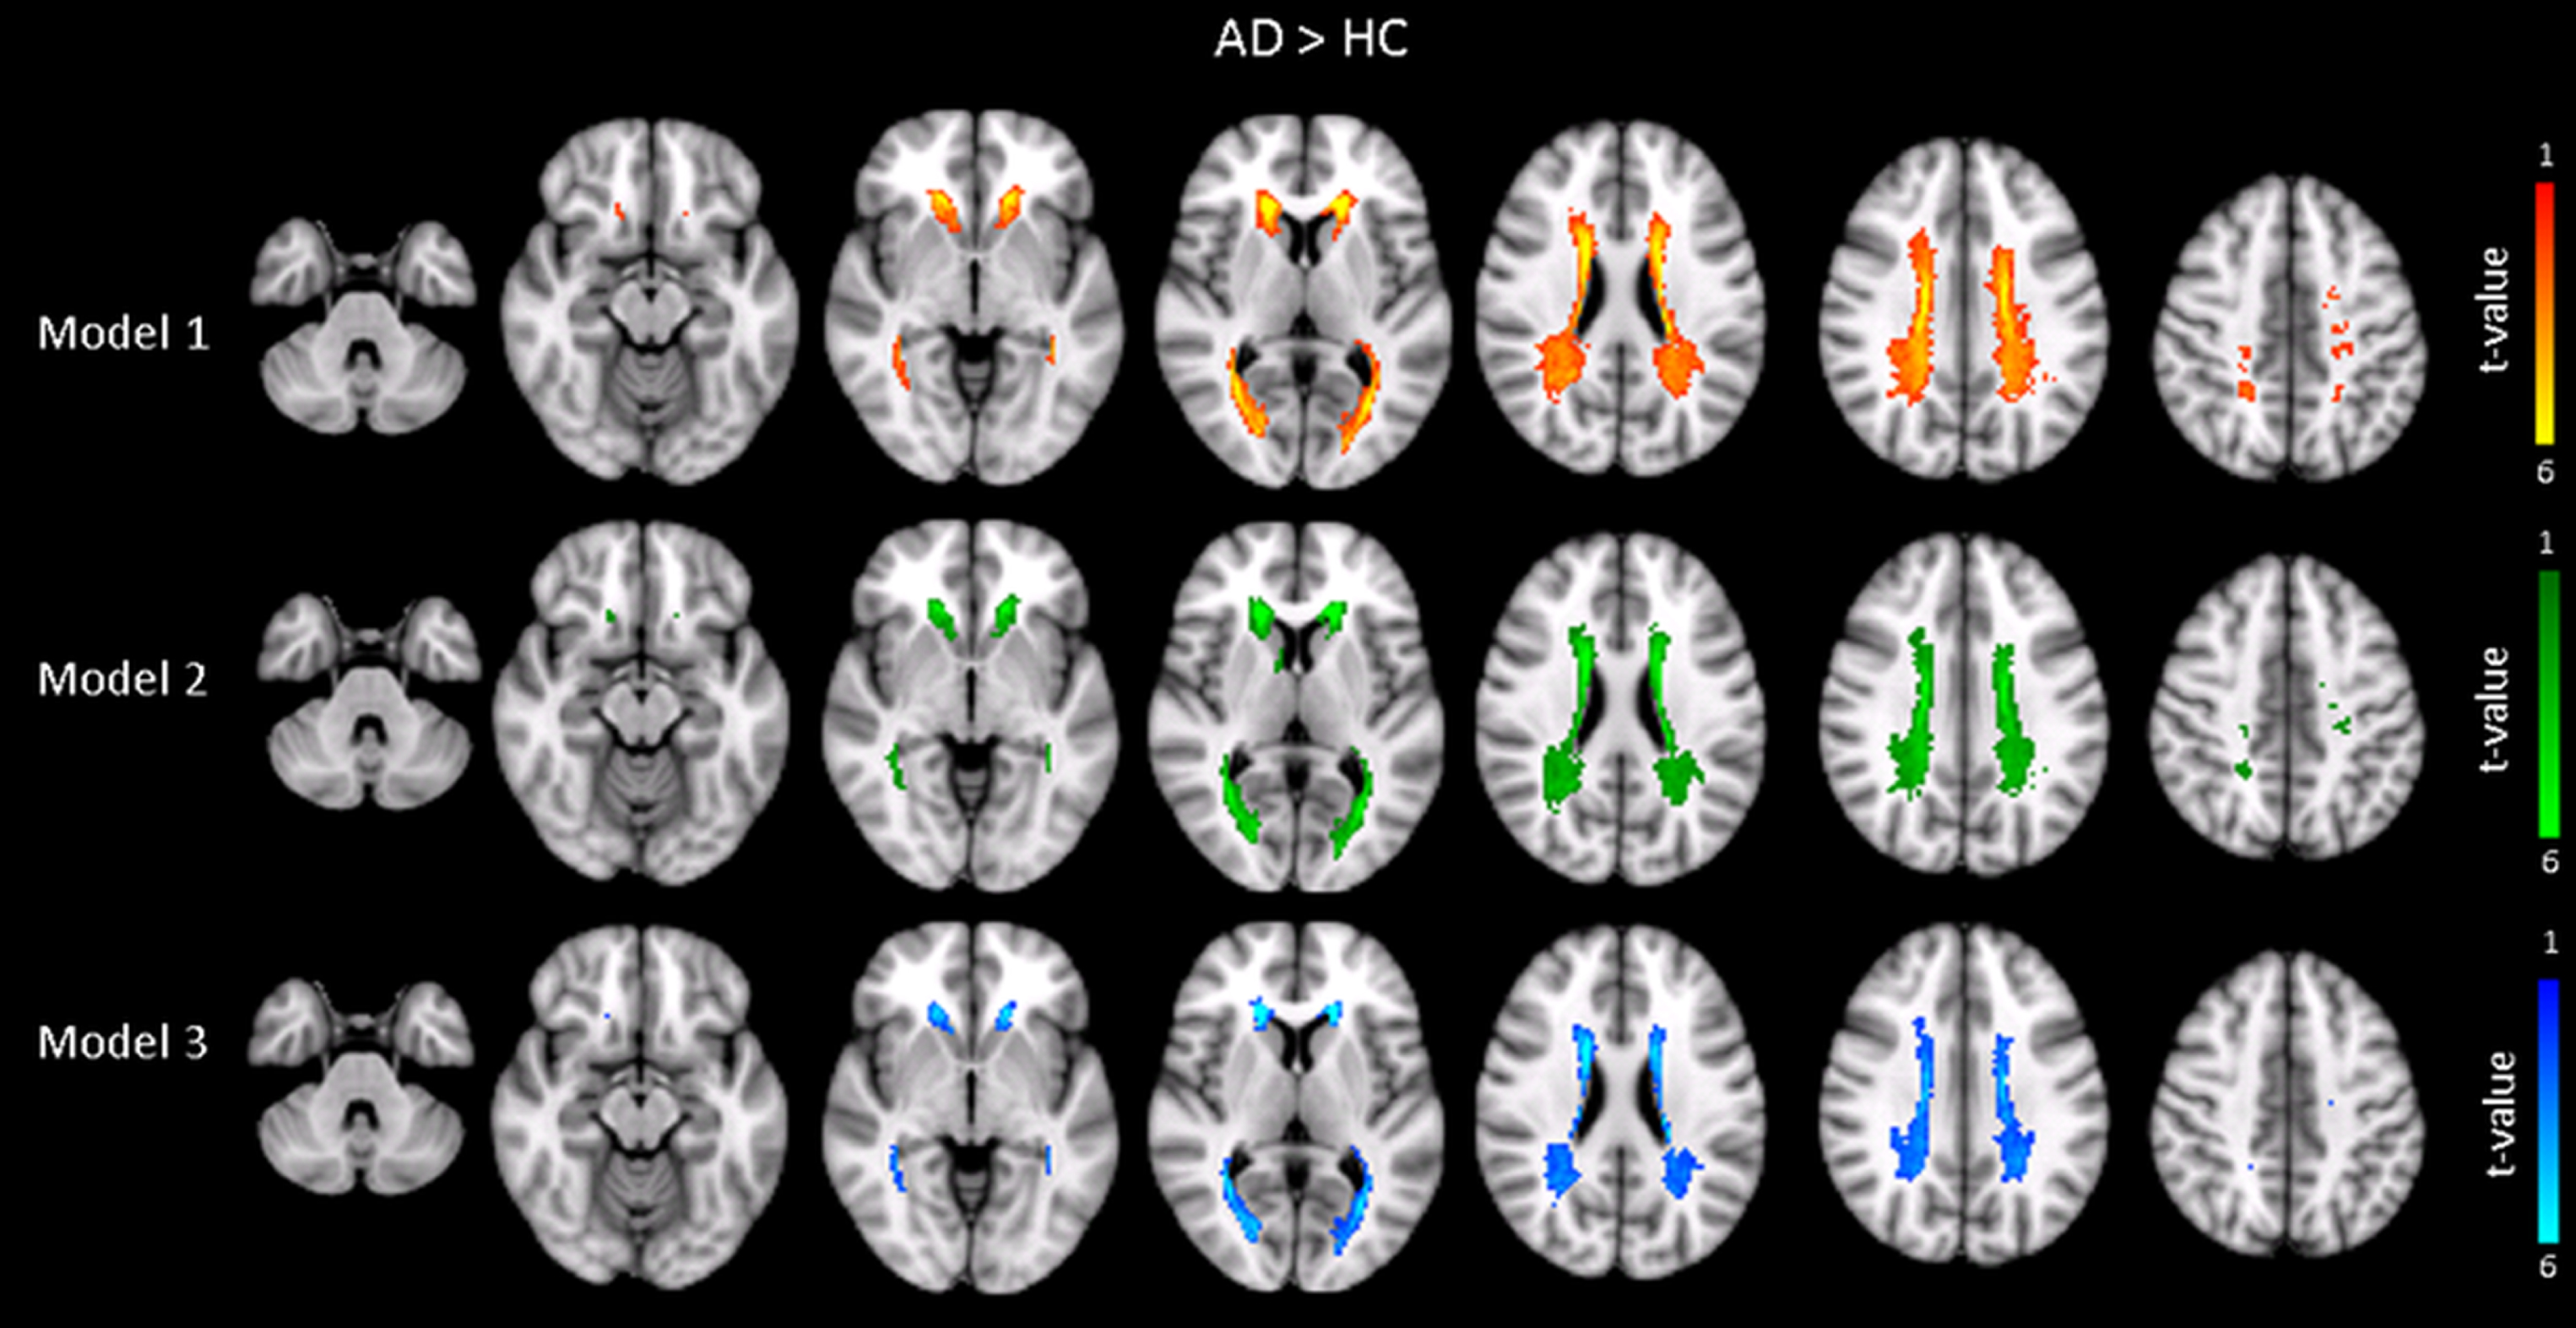
Result of the voxelwise comparison of lesion masks in AD patients versus age-matched HC. Axial views are overlaid on the T1-MNI brain and illustrate the t-statistics in voxels containing WMH significantly more commonly in AD versus HC (p<0.05; TFCE corrected). Model 1 (yellow-red colors) is uncorrected for possible confounders. Model 2 (green-lightgreen colors) is adjusted for hypertension, diabetes mellitus, hypercholesterolemia, coronary artery disease, smoking, sex, and age. Model 3 (blue-lightblue colors) corrected for all model 2 variables plus ventricular volume.
To assess whether WMH in periventricular location are related to cognitive decline in AD patients we calculated the volume of WMH in all voxels found to be significantly more commonly affected in AD than in controls, and correlated the volume with the patients' cognitive test performance. After Bonferroni correction there was no significant association between the volume of periventricular WMH and any of the cognitive measures (Table 2). There were also no significant associations between WMH volumes in AD-related voxels and cognitive test results at baseline (data not shown).
Associations between WMH volume in AD-related periventricular voxels and longitudinal change in cognition
CI, confidence interval; WMH, white matter hyperintensities; AD, Alzheimer’s disease; MMSE, Mini-Mental State Examination; CDR, Clinical Dementia Rating Scale. aadjusted for age, years of education, and intracranial volume.
DISCUSSION
Our finding that AD patients are significantly more likely to have WMH in a bilateral periventricular distribution than controls is in line with previous longitudinal studies describing periventricular WMH but not deep WMH as independent predictors for conversion from mild cognitive impairment (MCI) to AD [5]. Periventricular WMH have also been described as risk factors for incident AD in the general population [31].
It was suggested that long cholinergic projection fibers, leading from subcortical to the cortical regions, could be disrupted by periventricular WMH [32] and thus increase the cholinergic deficit and cognitive impairment in AD patients. Such mechanism is supported by a study of Swartz [33] who used immunohistochemical tracings of cholinergic pathways to demonstrate that WMH at the intersection with cholinergic fibers contribute to cognitive decline of AD patients. Previous studies using a visual rating [5, 31] or voxelwise approach [8, 10] also found an association between periventricular WMH and cognitive decline. In our study the volume of WMH in AD-associated periventricular voxels was neither related to cognitive functioning at baseline nor to longitudinal cognitive decline. One reason for these contrasting results might be that previous studies focused on cognitively normal subjects [8, 31], subjects with risk for AD [10], or patients in the MCI state [5, 8], while our study included patients with dementia. It might well be that the cognitive impairment caused by periventricular WMH is too small to be revealed in a disease state that is dominated by the cortical neurodegeneration. This is supported by a study of Makino [34], in which cognitive function was significantly associated with periventricular WMH in MCI, but not in AD.
The mechanisms responsible for the high amenability of AD brains for periventricular WMH are unclear. In an early study of our own [35], we reported that the increased volume of periventricular hyperintensity in AD patients originates from ventricular enlargement [35]. We here show that after adjustment for ventricular size the association between periventricular WMH and AD is indeed somewhat attenuated but it still remains significant. There is evidence from molecular pathological analysis in brains that periventricular WMH differ from deep and subcortical WMH [36, 37]. Periventricular WMH have increased fluid accumulation associated to the proximity of the ventricles and reduced integrity of the ventricular ependyma [36]. They are probably of non-ischemic origin and blood–brain barrier (BBB) breakdown may play an important etiological role [37]. Recent neuroimaging studies in MCI and early AD have actually demonstrated BBB disruption in the hippocampus and several gray and periventricular white matter regions [38].
Our study extends previous work in which the differentiation between periventricular and deep WMH was purely based on the decision of the investigators. By using a voxel-wise comparison we determined the high probability of WMH in a periventricular location in AD patients in a hypothesis-free and, by in large, investigator-independent manner. The AD and control groups were age-matched and the total volume of WMH was similar which means that the a priori likelihood of detecting a lesion at a specific brain region was comparable in the two investigational subsets. The fact that studies of different methodology unanimously determine periventricular white matter damage as a feature in AD increases the reliability of this finding.