
Abstract
Resting-state fMRI studies have demonstrated that Alzheimer’s disease (AD) is associated with aberrant organization and function of large-scale brain networks. However, the nature of the disruption of cross-network interactions in the key neurocognitive networks in the brain remains unclear. In this paper, we examined the ‘triple-network model’, including the default mode network (DMN), salience network (SN), and central executive network (CEN), to identify the cross-network interactions in late mild cognitive impairment (LMCI) and AD. With resting-state fMRI, we tested cross-network functional connectivity among the DMN, SN, and CEN in 33 AD patients, 24 LMCI, and 25 well-matched normal control subjects. Then, we identified the most influential brain regions affected by AD and LMCI. Finally, we investigated the relationship between aberrant functional connectivity and clinical cognitive dysfunction. We found the cross-network functional connectivity of the SN-centered ‘triple-network model’ was significantly impaired in the AD group and the alterations were negatively correlated with the Mini-Mental State Examination (MMSE) scores. For the LMCI group, the functional connectivity of the SN-centered ‘triple-network model’ also changed compared to AD; however, we found no correlation with MMSE score. As predicted, the abnormal connections among the three networks mainly overlap with the key nodes of the three networks. Overall, our findings suggested that the interactions of the SN-centered ‘triple-network model’ are impaired in AD patients and that these alterations contribute to the decline in cognitive function. This ‘triple-network model’ provides new insights into AD and provides more information about the dysregulation of brain networks in AD.
Keywords
INTRODUCTION
Alzheimer’s disease (AD) is the most common cause of dementia [1] and is a growing global health concern with huge implications for individuals and society [2]. AD is an age-related, nonreversible neurodegenerative brain disorder. The initial symptom of AD is the decline in recent memory, and other cognitive deficits, such as executive dysfunction manifested by changes in attention and problem-solving abilities, are typically also present [3]. AD is now considered as a dynamic disease with a spectrum of cognitive states ranging from cognitively normal control (NC) to mild cognitive impairment (MCI) to dementia [4]. As the disease progresses, language dysfunction, visuospatial difficulty, loss of insight, and personality changes (withdrawal, decreased initiative, and occasionally depression) are frequently apparent [3]. The pathological hallmarks of AD are an accumulation of amyloid-β (Aβ1 - 42) and tau tangles [2, 3]. Although the understanding of AD has increased dramatically over recent years, it remains far from complete [5].
MCI is a progressive state between normal aging and AD and is a higher at-risk state for AD [6]. Amnestic MCI is one of the MCI subtypes with high risk of conversion to AD and can be divided in to early (EMCI) and late (LMCI) stages based on the severity of impaired delayed recall of logical memory [4, 7].
Over the years, with the development of neuroimaging techniques, functional magnetic resonance imaging (fMRI), which measures intrinsic neural activity based on blood oxygen level-dependent (BOLD) signals, has provided a promising tool for investigating both cognitive function and dysfunction [8–10]. The study of intrinsic connectivity networks (ICNs) with resting-state fMRI can identify disease-related brain network alterations and may reveal the fundamentals of disease pathophysiology [9].
Researchers have proposed that the human brain is a complex patchwork of interconnected regions [11], and understanding how the human brain processes cognitive functions depends on the organizational pattern of large-scale brain networks [10]. The science of large-scale brain networks can help us to characterize the neurobiology of psychiatric disorders [11–13]. Of the many stable intrinsic brain networks, Menon proposed a ‘triple-network model’, which consists of three core neurocognitive networks: 1) the default mode network (DMN): a task-negative network, anchored in the posterior cingulate cortex and ventromedial prefrontal cortex, is associated with self-referential mental processes; 2) the central executive network (CEN): a task-positive network, anchored in the dorsolateral frontoparietal cortex, is involved in the maintenance and manipulation of information in working memory, decision making and goal-directed behavior; and 3) the salience network (SN): a task-positive network, located in the anterior cingulate cortex (ACC) and anterior insula, is related to both attention as well as interoceptive and affective processes [14]. He then notes that the aberrant organization and dysfunction of the ‘triple-network’ might be a feature of several psychiatric and neurological disorders [11]. Specifically, the model highlights the core role of the SN for initiating network-mediated dynamic interactions between the CEN and DMN, which are involved in externally oriented attention and internally oriented self-related mental processes [11]. The abnormal salience detection of the SN may lead to altered dynamic interactions between DMN and CEN, thus leading to abnormal mapping of goal-relevant stimuli and internal mental events [11, 15–17].
Many resting-state fMRI studies have demonstrated that AD is related to atypical patterns of functional connectivity in large-scale brain networks [18–22]. Convergent evidence based on resting-fMRI studies has reported decreased DMN activity in AD patients [13, 23–25]. However, studies of the CEN and SN have reported inconsistent results. Zhou et al. showed that AD attenuated DMN functional connectivity, mainly in the hippocampus and medial cingulate-parieto-occipital regions, but intensified SN connectivity [9]. Lim and colleagues found decreased functional connectivity of CEN in AD patients [26]. However, Agosta et al. reported increased mean functional connectivity in both the SN and CEN [27]. In contrast, Onoda et al noted that disruption of the SN is related to cognitive decline in elderly people [28]. Several studies have investigated the potential biomarker for identifying EMCI and LMCI by neuroimaging [4, 29], suggesting that DMN functional connectivity might deteriorate progressively from NC to EMCI to LMCI stages, where LMCI is closely resembles AD in terms of DMN connectivity pattern [4]. Through LMCI, it would be more efficiency to understand the change in brain during the progress of the disease from NC to AD.
Recently, researchers have concentrated more on cross-network connectivity patterns of ICNs, which may deepen our understanding of AD-related brain organization. Liu et al. mapped whole-brain resting-state functional connectivity and found that different insular subregions presented distinct resting-state functional connectivity patterns with various functional networks that are affected by AD [30]. Li et al. constructed directional connectivity models of resting-state networks and revealed changed directional connectivity among eight large-scale brain networks [31].
Despite the large-scale network-based functional connectivity studies and the cross-network connectivity mentioned above, the published literature lacked a cross-network study of the core neurocognitive brain networks to illustrate the neurocognitive networks fundamental to AD and LMCI. In this study, we apply the novel ‘triple-network model’ to investigate the specific organizational pattern of the three core neurocognitive networks in AD and LMCI patients using resting-state fMRI as well as identifying the relationship to clinical symptoms. The model is shown in Fig. 1A. To obtain the inter-regional functional connectivity that cross-network, we applied a seed-based method to identify the brain regions of the DMN, SN, and CEN according to Stanford Functional Imaging in Neuropsychiatric Disorders Lab. We postulated that the SN-centered ‘triple-network’ showed a particularly altered interaction from NC to LMCI to AD. We then identified the most influential brain regions affected by AD and LMCI. Finally, we explored whether these altered inter-regional connections were associated with Mini-Mental State Examination (MMSE) scores.

A) The ‘triple-network model’ of the brain. B) Data analysis pipeline schematic. (a) 45 ROIs were chosen for the seed-based method, including 22 ROIs of the DMN, 15 ROIs of the SN, and 8 ROIs of the CEN. (b) We then extracted the raw time series, which is the average of all voxels in the chosen brain region. Each time series contained 136 time points, and these time series were bandpass filtered (0.01 0.08 Hz). Next, we computed the z-transformed Pearson correlations between ROIs as the measure of the connectivity strength. (c) The inter-network functional connectivity was calculated as the mean strength of all the existing positive connections between ROIs that belong to different networks We then used one-way ANOVA to find the specific altered connection after regressing out the covariates of sex and age by general liner model analysis, and the statistical significance was set at p < 0.05 (FDR corrected). For the identified damaged connectivity, two-sample t-test was used as post hoc test to identify the significant effect between AD and LMCI, between LMCI and NC and between AD and NC (p < 0.01). (d) To identify the features that contributed the most to the classification between the AD patients and health controls, we performed the random forest method to rank the importance of these input features. (e) To investigate the clinical relevance of the identified large-scale functional connectivity changes and the six selected inter-regional, strongly discriminative functional connectivity measures, we calculated Pearson correlations with the Mini-Mental State Examination clinical symptoms.
MATERIALS AND METHODS
ADNI database
All the data used in this research were obtained from the Alzheimer’s Disease Neuroimaging Initiative (ADNI) open database (http://adni.loni.usc.edu/). The ADNI study began in 2003 by the National Institute on Aging (NIA), the National Institute of Biomedical Imaging and Bioengineering (NIBIB), the Food and Drug Administration (FDA), private pharmaceutical companies and non-profit organizations. The goals of ADNI was to find sensitive and accurate methods through to detect AD at earlier stages and make it as possible biomarkers by means of neuroimaging (e.g., MRI, fMRI, PET), genetic profiles, and biomarkers in blood and cerebrospinal fluid. Now ADNI includes four phases (ADNI, ADNI GO, ADNI 2, and ADNI 3), recruiting over 1,500 adults. The participates in the research ages from 55 to 90, consist of AD patients, MCI subjects and elderly health controls. For more up-to-date information, please see http://www.adni-info.org.
Subjects
In this study, we downloaded the data from phase ADNI 2, including 3T fMRI, structural MRI, and corresponding clinical diagnosis form. We chose data that both structure MRI and resting state fMRI that were acquired using 3.0 T Philips Healthcare MRI machine according to ADNI 2 protocol. Thirty-three AD patients (ages from 57 to 87), twenty-four LMCI patients (ages from 59 to 85), and twenty-five NC subjects (ages from 66 to 96) were used in this research. Cognitive function and degree of dementia were evaluated by the MMSE and Clinical Dementia Rating scale (CDR) [32]. Table 1 shows more information.
Demographics and clinical information
Data are given as mean±standard error (SE). According to One-way ANOVA with Bonferroni correction, there were no group differences (p < 0.05) in age and gender among the AD, LMCI and NC groups. aSignificant difference (p < 0.001) compared to AD (group difference between AD and LMCI and between AD and NC). bSignificant difference (p < 0.001) compared to LMCI (group difference between LMCI and NC). MMSE, Mini-Mental State Examination; AD, patients with Alzheimer’s disease; NC, normal controls.
Patients considered for inclusion with AD were required as follows: 1) MMSE scores between 6 and 26, 2) CDR = 0.5 or 1, and 3) they have the ability to finish the experiment and stay steady during the data collection. The LMCI criteria were as follows: 1) MMSE scores between 20 and 26, 2) CDR = 0.5, and 3) absence of depression and other kind of dementia. The NC subjects’ criteria were included as follows: 1) MMSE scores between 26 and 30, 2) CDR = 0, and 3) absence of depression and other kind of dementia.
Data acquisition
Resting-state fRMI images were acquired using 3.0 T Philips Healthcare MRI scanner. Subjects should have their eyes open. Resting-state functional images were acquired by echo-planar imaging (EPI) sequence with the parameters as follows: repetition time (TR) = 3 s, echo time (TE) = 30 ms, flip angle (FA) = 80°, number of slices = 6720, number of volumes = 140, slice thickness = 3.3 mm, voxel size = 3×3×3 mm, and acquisition matrix = 64×64, 3D T1-weighted were acquired in sagittal plane with the following parameters: TR = 6.7 ms, TE = 3.1 ms, FA = 9°, slice thickness = 1.2 mm. All original image files are available to the general scientific community.
Data processing
Preprocessing
Resting-state fMRI data were preprocessed using the FSL (FMRIB’s Software Library, http://www.fmrib.ox.ac.uk/fsl/fslwiki) and Analysis of Functional Neuroimaging (AFNI) software package [33]. The first 4 volumes were discarded for magnetization equilibrium. For each subject, motion correction was performed using 3D image realignment with the AFNI program 3dvolreg function, and the data were spatially smoothed with a 6 mm full width half maximum (FWHM) Gaussian kernel. Then, the following steps were taken: linear trend removal, band-pass filtering with 0.01 Hz 0.08 Hz, and spurious variance removal through linear regression by using FSL that includes six rigid body motion correction parameters, the white matter signal and the cerebrospinal fluid signal. Next, the preprocessed fMRI data were registered to the MNI152 standard template using FSL’s linear registration algorithm.
Region-of-interest selection
In this study, we performed a seed-based analysis. After preprocessing, 45 regions of interest (ROI) were chosen to extract the time course for further study. A total of 45 ROIs of the DMN, SN, and CEN were downloaded from the Stanford Functional Imaging in Neuropsychiatric Disorders Lab (http://findlab.stanford.edu/research) [34], including 22 ROIs in the DMN, 15 ROIs in the SN, and 8 ROIs in the CEN (Table 2). The DMN comprised the “dorsal DMN”, the “ventral DMN”, and the “precuneus” subnetworks of the atlas. The SN comprised the “anterior SN” and the “posterior SN”. The CEN network consisted of the “left CEN” and the “right CEN”. The time series of an ROI was the average of all voxels in the chosen brain region. Each time series contained 136 time points, and these time series were bandpass filtered (0.01∼0.08 Hz).
Coordinates of SN, CEN, and DMN regions according to Stanford Functional Imaging in Neuropsychiatric Disorders Lab
BA, Brodmann area; MNI, Montreal Neurological Institute. The labels are the tag corresponding to the brain area in figures.
Functional connectivity analysis
We calculated Pearson’s correlation coefficients to measure the connectivity strength between each pair of ROIs. Figure 1B shows the overall data analysis pipeline schematic. To improve normality, Fisher’s r-to-z transformation was applied after the correlation. Age and gender effects were regressed out using a general linear model before further statistical analysis to control for the impact of sex and age. Due to the ambiguous biological explanation of negative correlations [35–37], our analysis only focused on the positive correlations. The cross-network connectivity strength was defined as the mean strength of all the existing positive connections between ROIs that belong to different networks, that is,
Identify the brain connections that contribute the most for classification
In order to identify the features (brain connections) that contributed the most for classification between the AD patients and NC subjects and between AD and LMCI patients, we performed Random Forest of 10-fold cross-validation method implemented in the “Caret” R (Version R x64 3.5.2) package for classification. Features for classification included Z-scores of inter-regional connections cross-network (626 connections, Z normalized). Random Forest, a well-established and commonly used machine learning algorithm for classification, regression and feature selection, is based on the concept of decision trees [38]. The random forest method can also produce an estimate of the feature’s importance via an out-of-bag error estimate [39]. We used rfeControl and rfe function implemented in the “Caret” R (Version R x64 3.5.2) package to rank the importance of the input features. We then chose the top 20% of significantly altered inter-regional connections from all the input features as the most important features. Finally, we tested Pearson’s correlations between the MMSE scores and the chosen inter-regional functional connectivity. The statistical significance was set at p < 0.05 (FDR corrected).
Statistical analysis
Group differences in demographic and neuropsychological clinical measures shown in Table 1 were assessed by Statistical Package for Social Sciences (SPSS v19.0) applying analyses of one-way variance (ANOVA) with Bonferroni correction. To find the specific altered connections between brain regions and between networks, we first regressed out the covariates of sex and age by general linear model (GLM) analysis to control the possible impact of sex and age differences. We then used one-way ANOVA to find the specific altered connections, and the statistical significance was set at p < 0.05 (FDR corrected). For the identified damaged connectivity, two-sample t-test was used as post hoc test to identify the significant effect between AD and LMCI, between LMCI and NC and between AD and NC (p < 0.01).
To examine the clinical relevance of identified functional connectivity changes, we calculated Pearson correlations with MMSE clinical symptoms. We tested Pearson’s correlations between the MMSE scores and the Z scores of the both altered inter-network and inter-regional functional connectivity. The statistical significance was set at p < 0.05 (FDR corrected).
RESULTS
Altered internetwork functional connectivity between DMN, CEN, and SN and the correlation with MMSE scores
The results demonstrated that the inter-network functional connectivity between SN and DMN (p = 0.002, F = 6.867) and between SN and CEN (p = 0.048, F = 3.147) were significantly changed among the three groups. As is shown in Fig. 2A, the inter-network functional connectivity strength increased from NC to AD. Relative to the control group, post hoc analysis revealed that both the AD and LMCI group showed significantly increased functional connectivity between DMN and SN and between SN and CEN [35–37]. There were no significant changes between AD group and LMCI group. The inter-network connectivity between CEN and DMN also changed among the three groups but with no significance (p = 0.623, F = 0.475).

Group difference by one-way ANOVA and the relationship between Z-scores and MMSE scores. A) The differences in inter-network positive functional connectivity strength in the three groups. The figure shows the internetwork connectivity strength increased significantly among the three groups (SN-DMN: Z-score AD = 0.117±0.006, LMCI = 0.114±0.006, NC = 0.087±0.005, p = 0.002; SN-CEN: Z-score, AD = 0.119±0.006, LMCI = 0.116±0.008, NC = 0.095±0.005, p = 0.0048). The black rectangles represent the AD group, the grey rectangles represent the LMCI group and the white rectangles represent the NC group. The error bars represent the standard error of each group. *Significant difference between two groups. **Significant difference among three groups. B) The correlation between the Z-scores of the significantly altered internetwork connections for the SN-DMN (r = -0.25, p = 0.022) and for the SN-CEN (r = -0.27, p = 0.014) with the MMSE scores. AD patients are indicated by pink dots, LMCI patients are indicated by green dots and NC patients are indicated by blue dots. SN, salience network, DMN, default mode network, CEN, central executive network.
We then explored the relationship between the severity of cognitive impairment and the inter-network connectivity pattern. Figure 2B illustrates the correlation between the MMSE scores and Z-scores of inter-network functional connectivity. The left figure shows that the Z-scores of inter-network functional connectivity between the DMN and SN network were negatively related to the MMSE score (r = -0.25, p = 0.022). The right figure illustrates that the correlation in the functional connectivity between SN and CEN was significantly negatively related to the MMSE score (r = -0.27, p = 0.014).
Altered inter-regional cross-network functional connectivity for AD and NC groups
To assess the inter-regional cross-network functional connectivity pattern of the ‘triple-network’, we then investigated the strength of inter-regional correlations between pairs of ROIs. Compared to healthy controls, the intra-network analysis showed that patients with AD and LMCI groups had decreased DMN connectivity. Although there were no significant differences within the SN and CEN among the three groups, the enhanced intra-network connectivity n the SN and CEN is consistent with previous studies [9, 40]. In this paper, we only report and discuss the altered cross-network connections.
The AD and NC group differences in inter-regional connections between SN and DMN are shown in Table 3 and Fig. 3A. Twenty-five pairs of connections between DMN and SN showed significant group differences between NCs and patients with AD. Specifically, patients with AD had greater correlations between subregions of the insula (e.g., between the left anterior insula cortex (AIC.L) and middle frontal gyrus (MFG); between the right anterior insula cortex (AIC. R) and superior occipital gyrus (SOG); between the left posterior insula cortex (PIC.L) and MFG; between the right posterior insula cortex (PIC.R) and SOG). In addition, the AD group also had greater inter-regional connections that connected to the cingulate cortex (e.g., between the left dorsal anterior cingulate gyrus (dACC.L) and MFG), between right dorsal posterior cingulate gyrus (dPCG.R) and angular gyrus (AG), between dPCG.R and parahippocampal gyrus (PHG)), and to precuneus (e.g., between precuneus and MFG, between precuneus and PHG (BA 36)). Compared to the NC group, the connectivity between the left inferior parietal lobule (IPL.L) and precuneus (dorsal posterior cingular cortex), between IPL.L and posterior cingulate gyrus (PCG), between right inferior parietal lobule (IPL.R) and PCG, and between MFG.L and MFG.R were significantly increased in patients with AD. In contrast, the AD group had reduced connectivity between PIG.L and the ventral anterior cingulate gyrus (vACG, BA 24).
Pairs of regions showing significant group differences between DMN and SN in AD and NC group
Post hoc analysis in AD and NC group between DMN and SN obtained by two sample t-tests (FDR-corrected, p < 0.01). R and L represent the right and left part of the brain area.
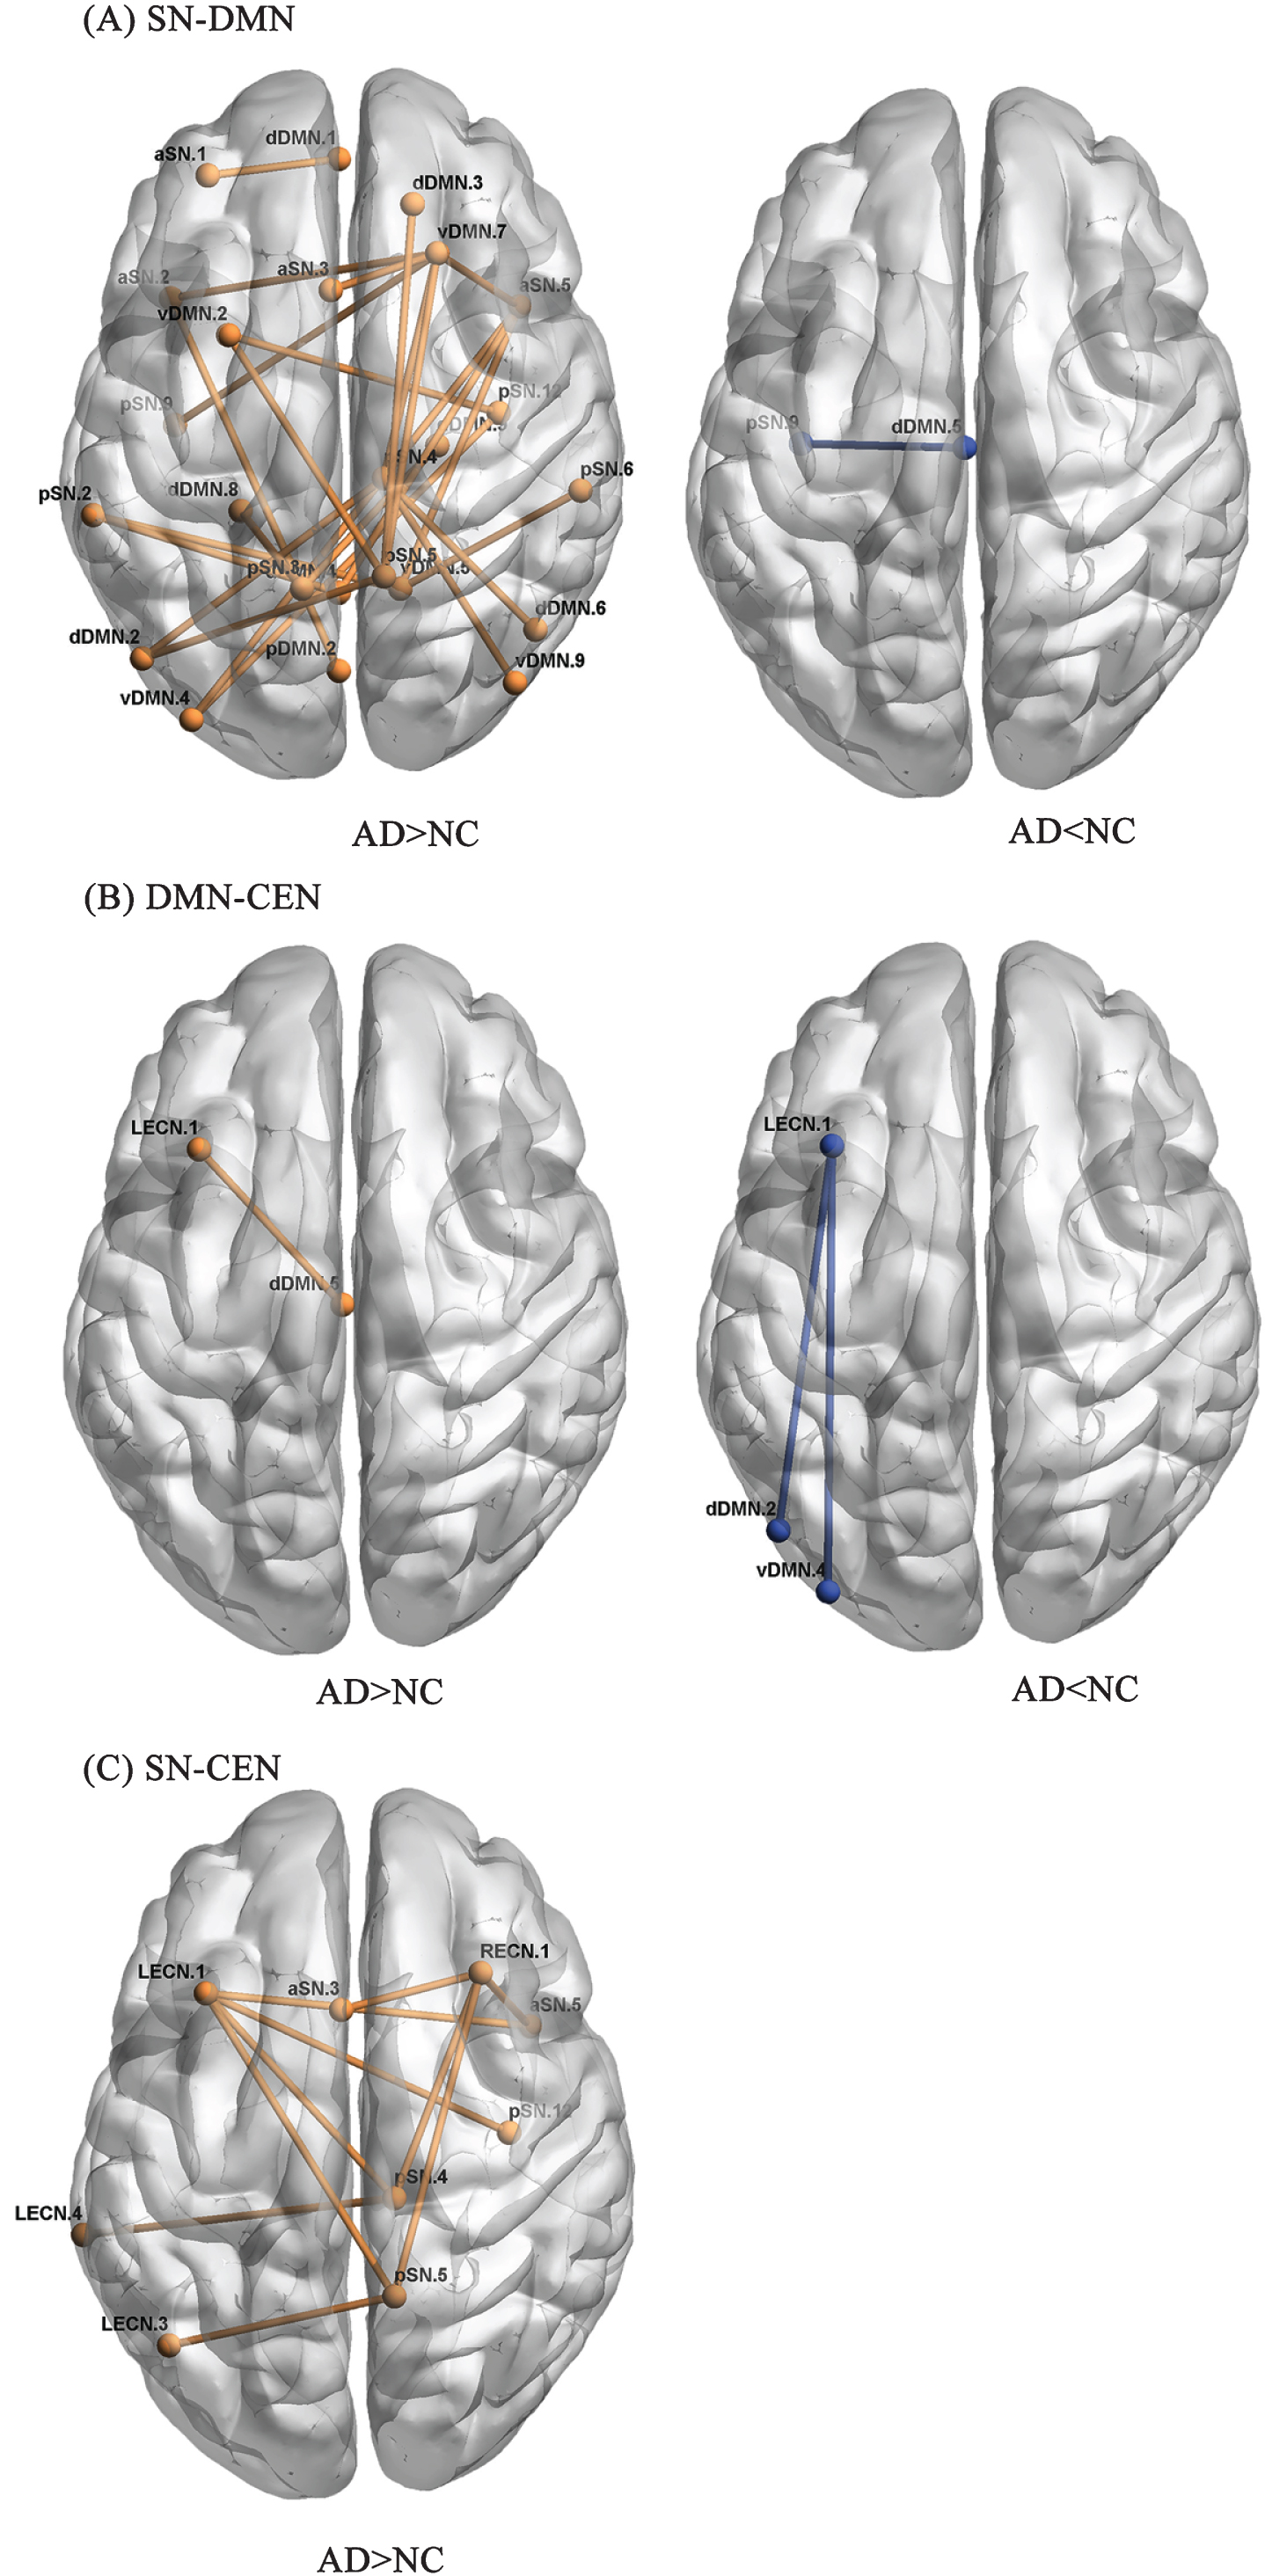
AD and NC group differences in inter-regional correlations between the SN and DMN, between the SN and CEN and between the DMN and CEN. The alpha for between-group differences was set at p < 0.01 (FDR-corrected). A) SN-DMN. B) DMN-CEN. C) SN-CEN. AD, Alzheimer’s disease group; NC, normal control group. See Tables 3–5 for detailed information. The name of the ROI corresponds to Table 2.
The group differences in inter-regional correlations between CEN and DMN are shown in Table 4 and Fig. 3B. Compared with the NC group, the AD group had greater inter-regional correlations between PCG.L and vACG, and reduced functional connectivity between PCG.L and SOG and between PCG.L and right AG.
Pairs of regions showing significant group differences between SN and CEN in AD and NC group
Post hoc analysis in AD and NC group between SN and CEN obtained by two sample t-tests (FDR-corrected, p < 0.01).
The group differences in inter-regional connections between SN and CEN are shown in Table 5 and Fig. 3C. Compared to the NC group, the AD group had enhanced inter-regional functional connectivity mainly related to the cingulate gyrus, insula cortex and precuneus (e.g., between dACG. L and right precentral gyrus (PCG.R), between dPCG.R and left precentral gyrus (PCG.L), between dPCG.R and middle temporal gyrus (MTG), between AIC.R and PCG.L, between PCG.L, and between precuneus and IPL).
Pairs of regions showing significant group differences between DMN and CEN in AD and NC group
Post hoc analysis in AD and NC group between DMN and CEN obtained by two sample t-tests (FDR-corrected, p < 0.01).
Altered inter-regional cross-network functional connectivity for AD and LMCI groups
For AD and LMCI group, the significant group differences between DMN and SN are shown in Table 6 and Fig. 4A. Compared with LMCI group, the enhanced pairs of functional connectivity mainly related to insula (e.g., between PIC.R and MFG.R), the decreased connections mainly distributed in MFG.L.
Pairs of regions showing significant group differences between DMN and SN in AD and LMCI
Post hoc analysis in AD and LMCI group between DMN and SN obtained by two sample t-tests (FDR-corrected, p < 0.01).
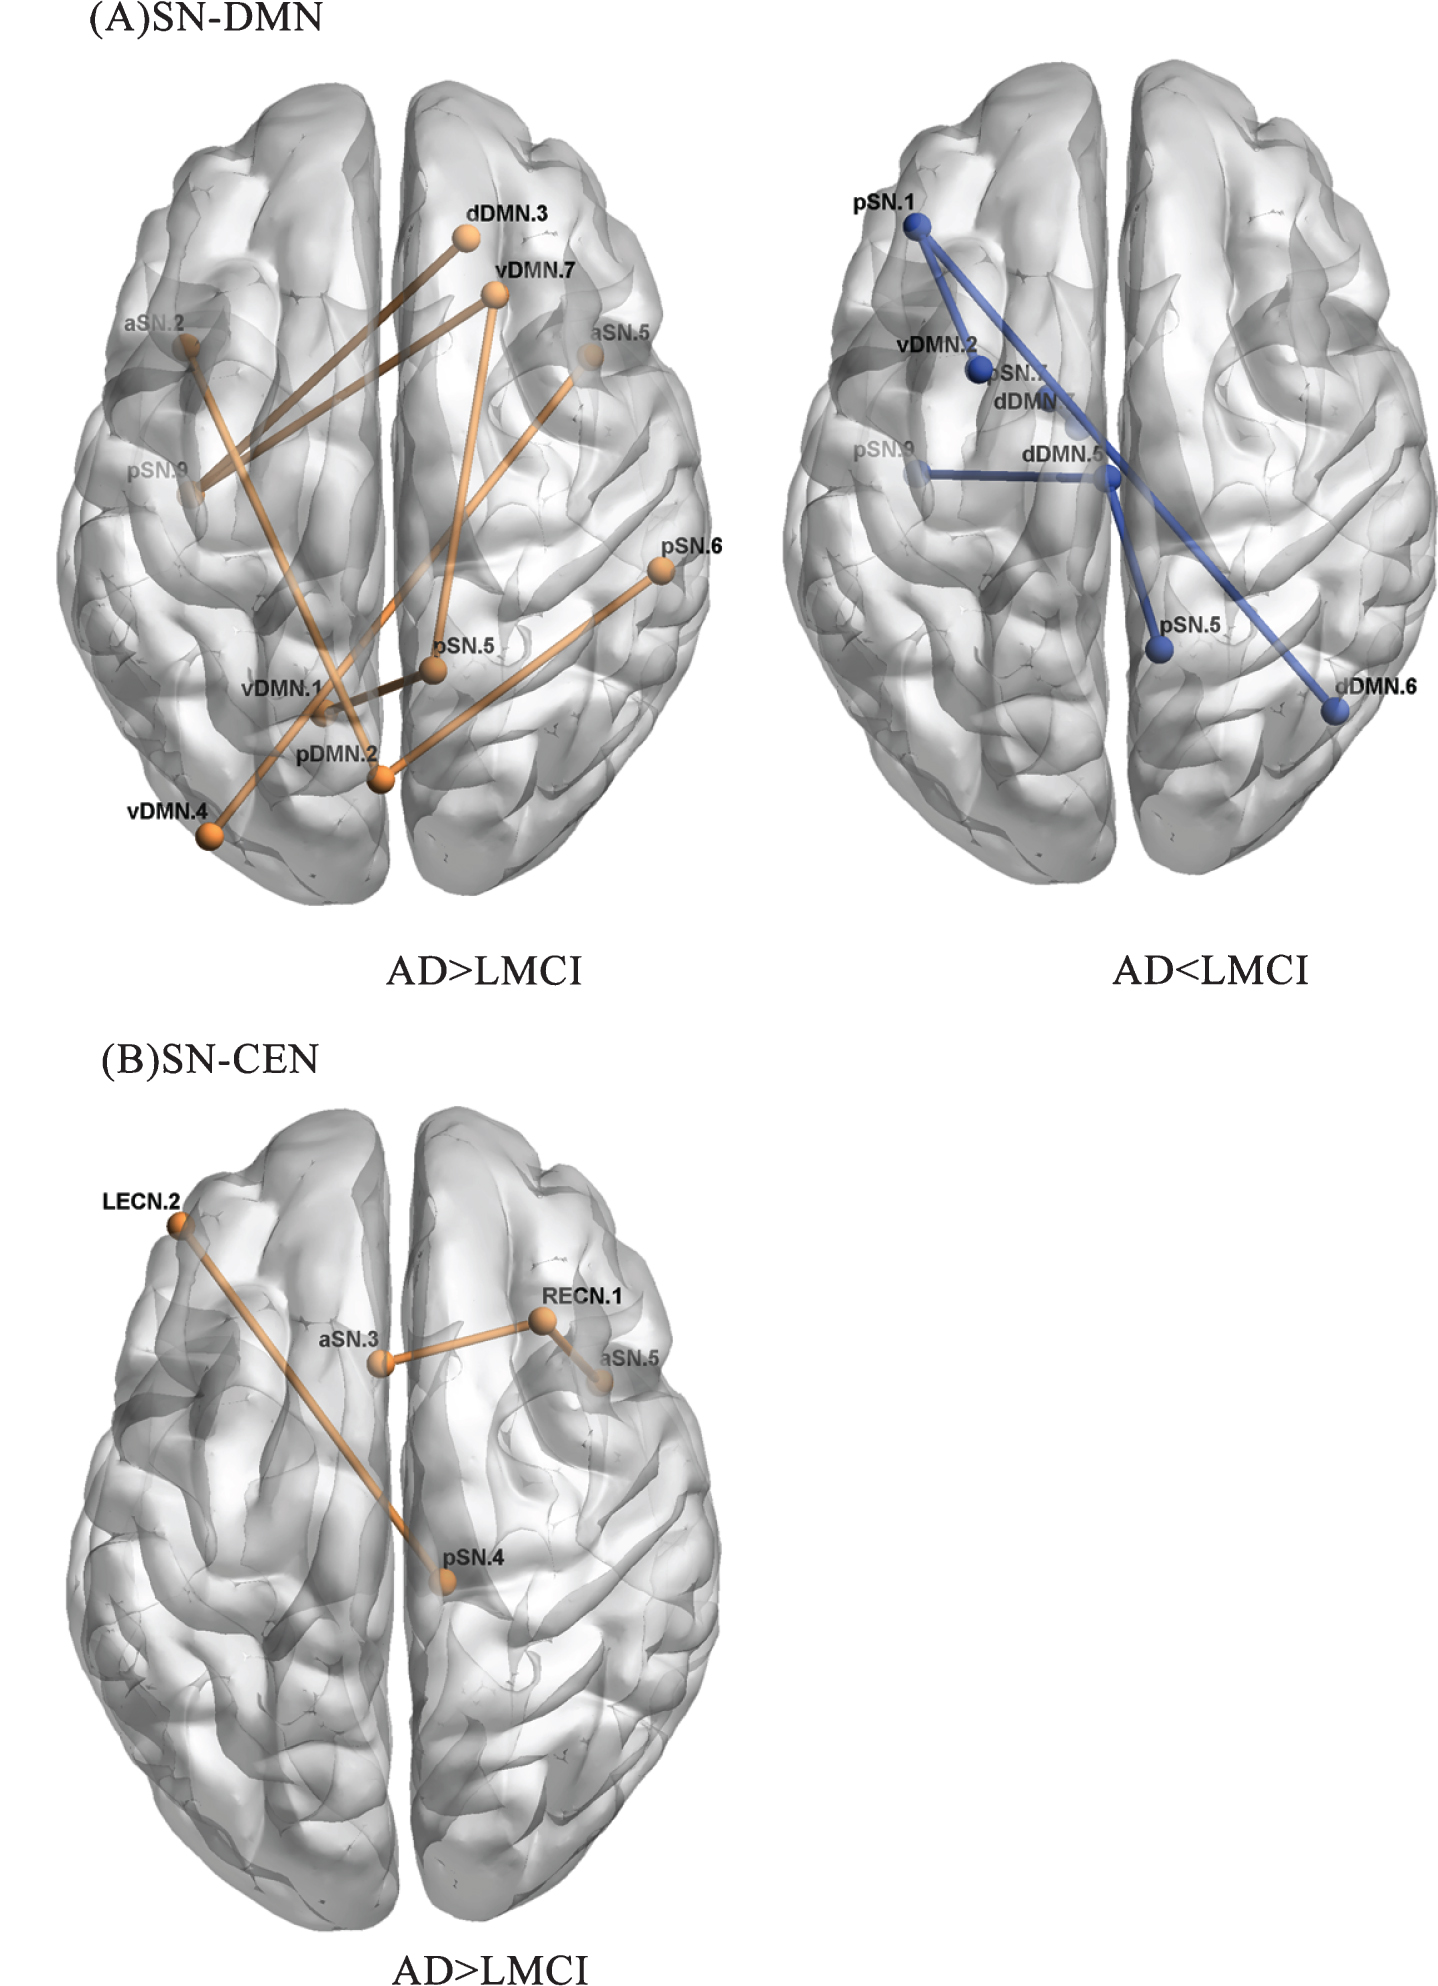
AD and LMCI group differences in inter-regional correlations between the SN and DMN, and between the SN and CEN. The alpha for between-group differences was set at p < 0.01 (FDR-corrected). A) SN-DMN. B) SN-CEN. AD, Alzheimer’s disease group; LMCI, Late mild cognitive impairment. See Tables 6 and 7 for detailed information. The name of the ROI corresponds to Table 2.
The AD and LMCI group difference between CEN and SN are shown in Table 7 and Fig. 4B. The AD group mainly showed increased functional connections between DLPFC.L and insula (e.g., between DLPFC.L and PIC.L, between DLPFC.L and AIC.R).
Pairs of regions showing significant group differences between CEN and SN in AD and LMCI
Post hoc analysis in AD and LMCI group between CEN and SN obtained by two sample t-tests (FDR-corrected, p < 0.01).
There was no group difference between DMN and CEN in AD and LMCI group and the post hoc analysis showed there was no significant group difference between LMCI and NC group in inter-regional functional connectivity.
Inter-regional connections that disturbed most by AD and LMCI
Totally six hundred and twenty-six inter-regional functional connectivity were chosen as the input features. The classification accuracy of AD and NC is 83.14%, and classification accuracy of AD and LMCI is 63.67%. We chose the top 20% of the significantly altered functional connectivity between groups to test for correlations with clinical symptoms. Figure 5A showed the six specific connections of regions were chosen as they ranked in the top 20% that affected significantly by AD compared to NC. Figure 5B illustrates the relationship between the six discriminating features and MMSE scores. As shown in Fig. 5B, the Z-scores of the connections between dPCG.R and DLPFC.R (r = -0.32, p = 0.014), between AIC.R and MFG.R (r = -0.44, p < 0.01), between precuneus and MFG.L (r = -0.39, p < 0.01), between dPCG.R and AG (r = -0.26, p = 0.045) and between dPCG.R and DLPFC.R (r = -0.28, p = 0.036) are increased in the AD group compared with NC group and are significantly negatively correlated with MMSE scores. The top 20% features that contributed the most for classifying between AD and LMCI is the connectivity between AIC.R and SOG, between PIC.R and superior frontal gyrus and between AIC.R and DLPFC. However, these significantly changed functional connectivity in AD and LMCI showed no obvious correlations with clinical MMSE scores.

The top 20% of specific brain connections that were disturbed the most by AD and their relationship with cognitive behavior. A) The specific connections of regions ranked in the top 20% that affected by AD. The importance decreased from a to f. B) The relationship between these altered brain connections and MMSE scores.
DISCUSSION
In this current study, we used resting-state fMRI to investigate the organization of the ‘triple-network model’ in AD and LMCI, focusing on the cross-network functional connectivity between the SN, DMN, and CEN. Consistent with our hypothesis, we found the following: 1) the cross-network functional connectivity of the SN-centered ‘triple-network model’ was significantly impaired in the AD and LMCI groups, and the increased cross-network functional connectivity were negatively correlated with the MMSE score; 2) the abnormal connections in the three groups between regions of the SN and DMN, between the SN and CEN and between the DMN and CEN mainly overlapped with the key nodes of the three networks, including subregions of the insula and dACC in the SN, the PCG and AG in the DMN, and the dorsolateral prefrontal cortex in the CEN; and 3) the inter-regional cross-network functional connectivity distinguished the AD and NC groups with high accuracy of 83.14%, and the random forest method ranked the disrupted connections, identifying the PCC, DLPFC, AIC, and AG as contributing the most to the classify between AD and NC whose connections were negatively correlated with the MMSE scores. For AD and LMCI, the inter-regional cross-network functional connectivity distinguished the AD and LMCI groups with accuracy of 63.67%, and the AIC, PIC, and DLPFC were identified as contributing the most to the classification. However, these connections showed no significant correlations with MMSE scores.
Abnormal cross-network connectivity between the DMN, SN and CEN in AD, LMCI and NC
Published research findings suggested that aberrant organization and functioning of the CEN, SN and DMN were prominent features of several major psychiatric and neurological disorders [11]. In this paper, inter-network connectivity, especially between the SN and DMN and between the SN and CEN, was significantly increased in the AD and LMCI group compared to the NC group. This result led us to think more about the organization pattern of the three core neurocognitive networks under AD conditions, especially the role of the SN. Emerging evidence suggested that the SN serves to identify salient stimuli, to dynamically allocate resources between the DMN and CEN [16, 17], to capture attention enhanced by error signals and to control dynamic cognitive processes [11, 17]. Specifically, a study showed that the SN is crucial for the efficient regulation of DMN activities and that impaired regulation results in inefficient cognitive control [15]. The enhanced connectivity between the SN and DMN and between the SN and CEN in AD and LMCI patients compared to NC may suggest the aberrant function of the SN, resulting in abnormal saliency mapping of internal mental events and external stimuli. This kind of alteration might relate to the patients’ impaired cognitive control, increased emotional sensitivity, irritability and anxiety [9, 41].
To discriminate the specific impaired brain regions, our study focused on the intrinsic functional connectivity of the inter-regional cross-network connections of the DMN, SN, and CEN. Studies of both task-related (visual tasks and auditory tasks) and task-free conditions revealed that the insula, in particular to 4 subregions, are responsible for switching between the CEN and the DMN [14, 42] and atypical engagement of specific subdivisions of the SN is a feature of many neuropsychiatric disorders [16, 30]. The AIC is consistently thought to be a key node of the SN, which is involved in high-level cognitive processes, and the PIC is associated with sensorimotor processes [16, 43]. Daniel and colleagues demonstrated that the insular cortex undergoes substantial pathologic changes [44], and neuroimaging studies revealed that the subregions of the insula present distinct functional connectivity patterns in different networks (CEN, sensorimotor network) in AD compared to NCs [30]. Consistent with previous studies, we found that the insula, especially the AIC, dominated the alteration of the SN-centered ‘triple-network model’ in the both AD and LMCI groups. The ACC, involved in attention, interoceptive and affective processes [14, 42], was reported to exert enhanced functional connectivity in AD patients versus healthy controls [9]. As a heterogeneous brain area, the IPL is associated with motor processing [45, 46] executive control [42] and salience detection [47]. Researchers observed both enhanced and disrupted functional connectivity to subregions of the IPL in AD patients, indicating that the IPL is impaired in AD patients [48–50].
In our study, we found mostly increased positive connections in the AD and LMCI patients in subregions of the SN and several particular regions overlapping with the DMN and CEN, most notably in connection to the bilateral insula, ACC, precuneus, and IPL. For the DMN and SN, the damaged brain areas are involved in functions of spatial orientation (angular gyrus), visual information (superior occipital gyrus, middle temporal gyrus), language processing (angular gyrus), cognitive integration (dorsolateral prefrontal cortex) and so on. Combined with these findings, we speculated that the enhanced SN function in AD and LMCI patients may imply a compensatory mechanism for the decreased DMN function and that the SN needs to call more resources to keep the brain functioning well, which contributes to the clinical cognitive decline observed in AD patients. It was proposed that neurodegenerative disease that implicate a small amount of cerebral lesions would decrease processing efficiency but preserve processing capacity, which can be achieved by increasing the recruitment of neurons to compensate for neuronal loss and prevent performance from decreasing [51]. With the accumulation of more important damage, the capacity for neuronal recruitment decreased. As a result, the level of performance decreased [51, 52] and the disease may develop into secondary and more advanced dementia. This model could explain the enhanced cross-network functional connectivity result that patients with amnestic MCI and early AD would be able to activate compensatory networks in order to impede the neural damage, thus increasing functional activation to maintain good level of performance [53, 54].
The lack of significant group differences between LMCI and NC in the cross-network inter-network functional connectivity of ‘triple-network’ suggested that these features may not be appropriate for the early detection of LMCI.
Relationship between inter-network as well as inter-regional cross-network changes and clinical cognitive severity
To explore whether the inter-network and inter-regional changes hold promise as biomarkers for disease monitoring, we tested the correlation between the Z-scores and clinical severity based on the MMSE. For inter-network connectivity, we sought a correlation between connectivity strength and MMSE scores. The results showed that inter-network connectivity strength between SN and DMN and between SN and CEN are negatively correlated with clinical severity. This result might indicate that the aberrant organization of the SN, DMN, and CEN can be a distinguishing feature of AD [11].
We then applied the inter-regional cross-network Z-scores to classify participants AD and NC groups with 83.14% accuracy. To examine the clinical relevance of the identified functional connectivity, we ranked those significantly changed inter-regional correlations and correlated the clinical MMSE score with top six connections. Our findings suggested that the altered function of the anterior insula cortex, dorsal posterior cingulate cortex, dorsolateral prefrontal cortex, and AG predominate the cognitive decline observed in AD. This result can be explained by the ‘brain reserve’ hypothesis. The accumulation of Aβ plaques is found widely with the progression of AD [5]. The ‘brain reserve’ hypothesis suggests that increased brain metabolism and enhanced functional connectivity might resist Aβ deposition, thus maintaining normal cognitive function [55]. These findings suggested that the alteration in connectivity of these brain areas may be a fundamental neural mechanism of cognitive decline in AD patients. The change in connectivity of these brain areas might be a promising biomarker for AD clinical diagnosis.
Limitations and future considerations
There are several limitations to the present study. First, our study mainly focuses on the functional connectivity of the SN-centered ‘triple-network model’. Because AD is closely related to amyloid burden and APOE4 carriers, further study should combine the alterations in the ‘triple-network model’ with genotype analysis or bioanalysis to elucidate the fundamental pathology of AD. Second, studies note that static connectivity provides limited information about the functional organization of brain circuits because the interactions among large-scale brain systems are highly dynamic [12, 57]. Future studies should apply time-varying functional interactions to investigate the psychopathology of AD. Third, the sample size is also a critical limitation of our study. The small sample size may have confined the statistical results and provided little information for classification. Finally, given the evidence that the AD patients showed widespread grey matter atrophy throughout the brain [58, 59], it would be necessary to investigate the relationship between the altered structure (e.g., grey matter atrophy, white matter hyperintensities) and the progress of the disease.
CONCLUSION
In conclusion, the present study demonstrated that the abnormal interactions among the DMN, SN, and CEN are prominent features of AD and that the aberrant functional connectivity of the SN-centered ‘triple-network model’ is closely related to clinical cognitive decline. This ‘triple-network model’ provides a new and powerful framework for understanding the dysfunctional brain architecture of AD. For the detection of LMCI, more neuroimaging indicators need to be considered.
Footnotes
ACKNOWLEDGMENTS
The study was financially supported by the National Natural Science Foundation of China (Grant No. 61431012, 61503295), Natural Science Foundation of Shaanxi Province (Grant No. 2018JM7080, 2017JM6013) and Doctoral Program Foundation of Ministry of Education (Grant No.20130201110049).
Data collection and sharing for this project was funded by the Alzheimer’s Disease Neuroimaging Initiative (ADNI) (National Institutes of Health Grant U01 AG024904) and DOD ADNI (Department of Defense award number W81XWH-12-2-0012). ADNI is funded by the National Institute on Aging, the National Institute of Biomedical Imaging and Bioengineering, and through generous contributions from the following: AbbVie, Alzheimer’s Association; Alzheimer’s Drug Discovery Foundation; Araclon Biotech; BioClinica, Inc.; Biogen; Bristol-Myers Squibb Company; CereSpir, Inc.; Cogstate; Eisai Inc.; Elan Pharmaceuticals, Inc.; Eli Lilly and Company; EuroImmun; F. Hoffmann-La Roche Ltd and its affiliated company Genentech, Inc.; Fujirebio; GE Healthcare; IXICO Ltd.; Janssen Alzheimer Immunotherapy Research & Development, LLC.; Johnson & Johnson Pharmaceutical Research & Development LLC.; Lumosity; Lundbeck; Merck & Co., Inc.; Meso Scale Diagnostics, LLC.; NeuroRx Research; Neurotrack Technologies; Novartis Pharmaceuticals Corporation; Pfizer Inc.; Piramal Imaging; Servier; Takeda Pharmaceutical Company; and Transition Therapeutics. The Canadian Institutes of Health Research is providing funds to support ADNI clinical sites in Canada. Private sector contributions are facilitated by the Foundation for the National Institutes of Health (![]() ). The grantee organization is the Northern California Institute for Research and Education, and the study is coordinated by the Alzheimer’s Therapeutic Research Institute at the University of Southern California. ADNI data are disseminated by the Laboratory for Neuro Imaging at the University of Southern California.
). The grantee organization is the Northern California Institute for Research and Education, and the study is coordinated by the Alzheimer’s Therapeutic Research Institute at the University of Southern California. ADNI data are disseminated by the Laboratory for Neuro Imaging at the University of Southern California.