



Abstract
In sporadic Alzheimer’s disease (AD), an imbalance between production and clearance of amyloid-β (Aβ) peptides seems to account for enhanced Aβ accumulation. The metalloprotease neprilysin (NEP) is an important Aβ degrading enzyme as shown by a variety of in vitro and in vivo studies. While the degradation of full-length Aβ peptides such as Aβ1-40 and Aβ1-42 is well established, it is less clear whether NEP is also capable of degrading N-terminally truncated Aβ species such as the common variant Aβ4-42. In the present report, we confirmed the degradation of Aβ4-x species by neprilysin using in vitro digestion and subsequent analysis using gel-based assays and mass spectrometry. By crossing Tg4-42 mice expressing only Aβ4-42 peptides with homozygous NEP-knock-out mice (NEP-/-), we were able to demonstrate that NEP deficiency increased hippocampal intraneuronal Aβ levels and aggravated neuron loss in the Tg4-42 transgenic mouse model of AD.
Keywords
INTRODUCTION
Alzheimer’s disease (AD) is neuropathologically characterized by the extracellular deposition of amyloid plaques consisting of amyloid-β (Aβ) peptides, as well as the intracellular presence of neurofibrillary tangles, composed of hyperphosphorylated tau protein. While there is evidence that overproduction of Aβ1-42 contributes to the build-up of Aβ in familial AD cases [1], the mechanism of Aβ deposition in the more common sporadic AD cases is much less clear. Alterations in Aβ catabolism by a variety of proteolytic enzymes seem to play an important role [2]. Several proteases have been proposed to be involved in the physiological degradation of Aβ with neprilysin (NEP) and insulin-degrading enzyme (IDE) being the most prominent candidates (reviewed in [3]). The metalloprotease neprilysin (also known as neutral endopeptidase, enkephalinase, or CD10) is a type II membrane-associated metallo-endopeptidase and can hydrolize Aβ1-40 peptides without affecting the metabolism of the amyloid-β protein precursor (AβPP) [4]. Pharmacological inhibition of NEP by the enkephalinase inhibitor thiorphan resulted in an accumulation of endogenous Aβ42 in wildtype (WT) mouse brain [5] and caused elevated insoluble Aβ40 and Aβ42 levels in the hippocampus and impairments in behavior tasks in inhibitor-infused non-transgenic rats [6]. Genetic ablation of NEP in several AD mouse models led to increased amyloid plaque pathology, an aggravation of behavioral deficits and an overall increase in Aβ levels [7–9]. On the other hand, overexpression of NEP resulted in reduced Aβ42-induced neuron loss in a Drosophila model [10] and was shown to impact impairment in spatial learning in AβPP transgenic mice, however, with conflicting results [11, 12]. In addition to full-length Aβ peptides, N-terminal truncated Aβ variants represent prominent peptide species in AD brain [13, 14]. It is currently unclear whether enzymes such as NEP can degrade these peptides. To address this question, we studied whether Aβ4-x peptides represent NEP substrates in vitro and quantified CA1 hippocampal neuron numbers in Aβ4-42 expressing mice [15], in the presence and in the absence of endogenous NEP expression.
MATERIAL AND METHODS
Proteolysis of synthetic Aβ peptides by neprilysin
Stock solutions of synthetic peptides Aβ4-40, Aβ4-42, Aβ1-40, and Aβ1-42 were prepared at 1 mg/mL in DMSO and stored until use at –80°C. In an initial experiment we determined suitable reaction conditions and incubation times for monitoring Aβ4-40 and Aβ4-42 cleavage by neprilysin. To this end, 176μL of 20 mM HEPES, pH 7.0 were mixed with 4μL of Aβ4-40 (1 mg/mL) or Aβ4-42 (1 mg/mL) and 20μl of recombinant human neprilysin (R&D Systems) prediluted to 10 ng/μL in 20 mM HEPES, pH 7.0. The respective control reactions contained 196μL of 20 mM HEPES, pH 7.0 and 4μL of either Aβ4-40 (1 mg/mL) or Aβ4-42 (1 mg/mL). The reaction mixtures and controls were incubated at 37°C on a thermomixer at 500 rpm. After 0 min, 2 h, 4 h, 8 h, and 24 h, aliquots of 2×15μL were retrieved and pipetted into separate vials. For subsequent SDS-polyacrylamide gel electrophoresis, one of the 15μL aliquots for each time point was mixed with 15μL of 2×SDS-sample buffer (0.72 M bistris, 0.32 M bicine, 30% (w/v) sucrose, 2% (w/v) SDS and 0.015% bromophenol blue) and heated at 95°C for 5 min. The samples were separated on a 15% T / 5% C bicine / Tris SDS-gel [16] followed by fixation with 30% ethanol/10% acetic acid for 1 h. The peptides were visualized by silver staining, essentially as described in [17].
In a follow-up experiment, aliquots of Aβ4-40, Aβ4-42, Aβ1-40, and Aβ1-42 were incubated in 4 technical replicates for 2 h at 37°C with neprilysin in the presence or absence of the neprilysin inhibitor phosphoramidon. A stock solution of 10 mg/mL of inhibitor was prepared by dissolving 1 mg of phosphoramidon (PA, Enzo Life Sciences) in 100μL of ultrapure water and stored at –20°C until use. The reactions (20μL reaction volume) were prepared in low bind 1.5 mL Eppendorf reaction vials by mixing 4μL of each single synthetic peptide (0.1 mg/mL) and 2μL of neprilysin (10 ng/μL) with or without 2μL of phosphoramidon, prediluted to 0.1 mM with 20 mM HEPES, pH 7.0. Appropriate volumes of 20 mM HEPES, pH 7.0 were added to reach the reaction volume. The respective control reactions contained 16μL of 20 mM HEPES, pH 7.0 and 4μL of synthetic peptide. After the incubation phase, 2 of the 4 technical replicates for each condition were mixed with 1μL of 10% trifluoroacetic acid (TFA), stored at 4°C and finally analyzed by mass spectrometry. The remaining 2 replicates were each mixed with 20μL of 2×SDS-sample buffer and analyzed by SDS-PAGE as described above. The silver-stained gels were scanned on a Bio-5000 Plus scanner (Microtek International) and evaluated with the Quantity One basic software (BioRad). To confirm repeatability, the experiment was repeated one more time with 2 technical repeats for each peptide and condition and analyzed by SDS-PAGE as before.
For quantification, rectangular boxes were drawn around each protein band. The volume within each band (measured as intensity*mm2) was adjusted by global background subtraction and expressed as percentages of all the volumes of the single gel. Averages of the resulting percentages of the adjusted volumes from the 4 replicates were used to perform statistical analyses.
For tentative comparative assessment by two-way ANOVA, the data points of the two independent experiments were pooled and normalized to % of the averaged controls for each tested condition. A power calculation using G*Power 3.1.9 (http://www.gpower.hhu.de) has been performed to estimate the required sample size to ensure sufficient statistical power. Based on the data obtained in the initial experiment, an effect size of 0.8 was assumed, resulting in a total sample size of n = 48. The statistical analysis was carried out using a two-way ANOVA with “treatment” and “Abeta-variant” as the 2 factors with 3 (control, Neprilysin, and Neprilysin+PA) and four (Aβ1-40, Aβ1-42, Aβ4-40, Aβ4-42) levels, respectively. This was followed by Dunnett’s multiple comparison tests comparing every mean to its control peptide mean. In total, 2 individual experiments comprising four different peptides with 2 technical replicates each and 3 treatment conditions were analyzed (total sample size n = 48).
Mass spectrometry
The masses of the intact Aβ peptides and their NEP cleavage products were essentially determined as described previously [18, 19]. Briefly, an Anchor-Chip target (Bruker Daltonics) was precoated with 2-cyano-4-hydroxycinnamic acid (CHCA) and 1μl of 1% TFA/0.1% octyl β-D-glucopyranoside was deposited on the anchor positions. To these droplets, 0.5μl of the NEP reaction mixture (see above) were added and allowed to adsorb to the CHCA surface for 3 min. The samples were washed twice with ammonium dihydrogen phosphate (NH4H2PO4, 10 mM in 0.1% TFA) and analyzed by mass spectrometry using an UltrafleXtreme MALDI TOF/TOF instrument (Bruker Daltonics). Positively charged ions in the m/z range 300-6000 were analyzed in the reflector mode under the control of the FlexControl 3.4 operation software. A mixture of Peptide Calibration Standard II (m/z 757-3147, Bruker Daltonics) and Peptide calibration Mix 2 (m/z 1673-5730, LaserBio Labs) was used for calibration.
Transgenic mice
The generation of Tg4-42 mice has been described previously [15]. In brief, Tg4-42 mice express the human Aβ4-42 sequence fused to the signal peptide sequence of the thyrotropin-releasing hormone (TRH), ensuring secretion through the secretory pathway, under the control of the neuron-specific Thy1 promoter. As no gender differences were detected in a previous study [20], both male and female mice were used. Neprilysin gene-disrupted mice (generous gift of Dr. Takaomi Saido) [21, 22] were kept as a homozygous line (NEP-/-) and were bred with homozygous Tg4-42 mice to obtain Tg4-42+/-/NEP+/- mice. The resulting F1 offspring was bred with NEP-/- mice to generate Tg4-42+/-/NEP-/- and NEP-/- littermates. The number of animals used per age and genotype in the respective analysis is given in the corresponding figures (n = 3–7). All animals including wildtype (WT) mice were maintained on a C57Bl6/J genetic background and handled according to the German guidelines for animal care.
Quantification of neuron numbers using unbiased stereology
Mice were transcardially perfused with 4% paraformaldehyde (PFA) in PBS and brains were carefully dissected. Post fixation of the left hemisphere was carried out in 4% PFA overnight. Subsequently, the left brain hemispheres were cryoprotected in 30% sucrose, quickly frozen, and cut frontally into series of 30μm thick sections using a cyrostat (CM1850 UV, Leica, Germany). Every tenth section was systematically sampled, stained with cresyl violet and used for stereological analysis of the number of CA1 neurons. The hippocampal cell layer CA1 (Bregma – 1.22 to – 3.80 mm) was delineated on cresyl violet-stained sections using a low-magnification lens. Using a stereology workstation (Olympus BX51 with a motorized specimen stage for automatic sampling), StereoInvestigator 7 (MicroBrightField, Williston, USA) and a 100x oil lens, all neurons whose nucleus top came into focus were counted using the Optical Fractionator in a blinded fashion as previously described [15, 23].
Immunohistochemistry on paraffin sections
Post fixation of the right hemisphere was carried out in 4% buffered formalin at 4°C before paraffin embedding. Immunohistochemistry was performed on 4μm sagittal paraffin sections as described previously [24]. In brief, sections were deparaffinized in xylene and rehydrated in a descending series of ethanol (100%, 95%, 70%). After treatment with 0.3% H2O2 in PBS to block endogenous peroxidases, antigen retrieval was achieved by boiling sections in 0.01 M citrate buffer pH 6.0, followed by 3 min incubation in 88% formic acid. Non-specific binding sites were blocked by treatment with skim milk and fetal calf serum in PBS prior to the addition of the primary antibodies: 24311 (rabbit-anti-Aβ, 1:500 [25]) or IBA1 (guinea-pig, 1:500, #234004, Synaptic Systems, Germany). Primary antibody incubation was carried out overnight in a humid chamber at room temperature followed by incubation with biotinylated anti-rabbit secondary antibodies (DAKO, Glostrup). Staining was visualized using the ABC method using a Vectastain kit (Vector Laboratories, Burlingame, USA) and diaminobenzidine (DAB) as chromogen resulting in a reddish-brown color. Counterstaining was carried out with hematoxylin.
Intracellular Aβ deposition and semi-quantitative analysis of IBA1-immunoreactivity was quantified using images of the CA1 pyramidal layer at 200x magnification on three sections per mouse which were at least 30μm afar from each other. Slides were analyzed using an Olympus BX51 microscope equipped with a digital camera (MoticamPro 282B, Motic, Germany). Photos were binarized to 8-bit black and white images and a fixed intensity threshold was applied defining the DAB signal. Aβ load and IBA1-immunoreactivity were calculated as the percentage of positive DAB staining in the defined region of interest [20].
RESULTS
Aβ4-40 and Aβ4-42 are degraded by recombinant neprilysin in vitro
In a pilot experiment, the proteolysis of Aβ4-40 and Aβ4-42 by neprilysin was studied in a time dependent fashion. SDS-polyacrylamide gel electrophoresis of the protease reactions and the corresponding no-enzyme controls indicated efficient in vitro degradation of synthetic Aβ4-40 and Aβ4-42 by NEP after 2 h incubation at 37°C. We did not observe smaller Aβ fragments resulting from the proteolysis on the silver stained gels. Longer incubation led to a further decrease in the Aβ band intensities in the NEP reactions (Supplementary Fig. 1). However, after extended incubation time, a gradual signal loss was observed in the no-enzyme controls, suggesting peptide aggregation or possible surface adsorption (Supplementary Fig. 1). Thus, for a more detailed analysis including comparison with Aβ1-40 and Aβ1-42 peptides, we chose 2 h incubation at 37°C. Densitometric quantification of the silver-stained SDS-polyacrylamide gels shown in Fig. 1A indicated reductions of approximately 73% of Aβ4-40, 31% of Aβ4-42, 45% of Aβ1-40, and 18% of Aβ1-42 resulting from NEP catalyzed hydrolysis (Fig. 1B). Addition of 10μM phosphoramidon efficiently inhibited Aβ degradation. The experiment was repeated once with similar outcome (Supplementary Fig. 2). Again, the rate of degradation by NEP was greatest for Aβ4-40 followed by Aβ1-40 > Aβ4-42 > Aβ1-42. Two-way ANOVA of the normalized pooled data from the two independent experiments (n = 4 normalized data points for each condition) followed by Dunnett’s multiple comparison test indicated statistically significant differences between controls and NEP treated reactions for Aβ4-40, Aβ4-42, and Aβ1-40 (Supplementary Table 1).

In vitro hydrolysis of synthetic Aβ peptides by NEP. A) 0.4μg of the indicated synthetic Aβ peptides were incubated for 2 h at 37°C with 20 ng of recombinant NEP in a total reaction volume of 20μL. Control reactions without enzyme or with enzyme plus phosphoramidon were treated in the same way. The analysis was done by SDS-PAGE followed by silver staining. The sample volumes loaded on the gels correspond to 75 ng of the synthetic peptides at the start of the reactions. B) Quantification of the silver stained gels shown in A. LMW, low molecular weight marker (GE Healthcare); Aβ1-40 and Aβ4-40, 75 ng of synthetic Aβ1-40 or Aβ4-40 prepared in SDS-sample buffer.
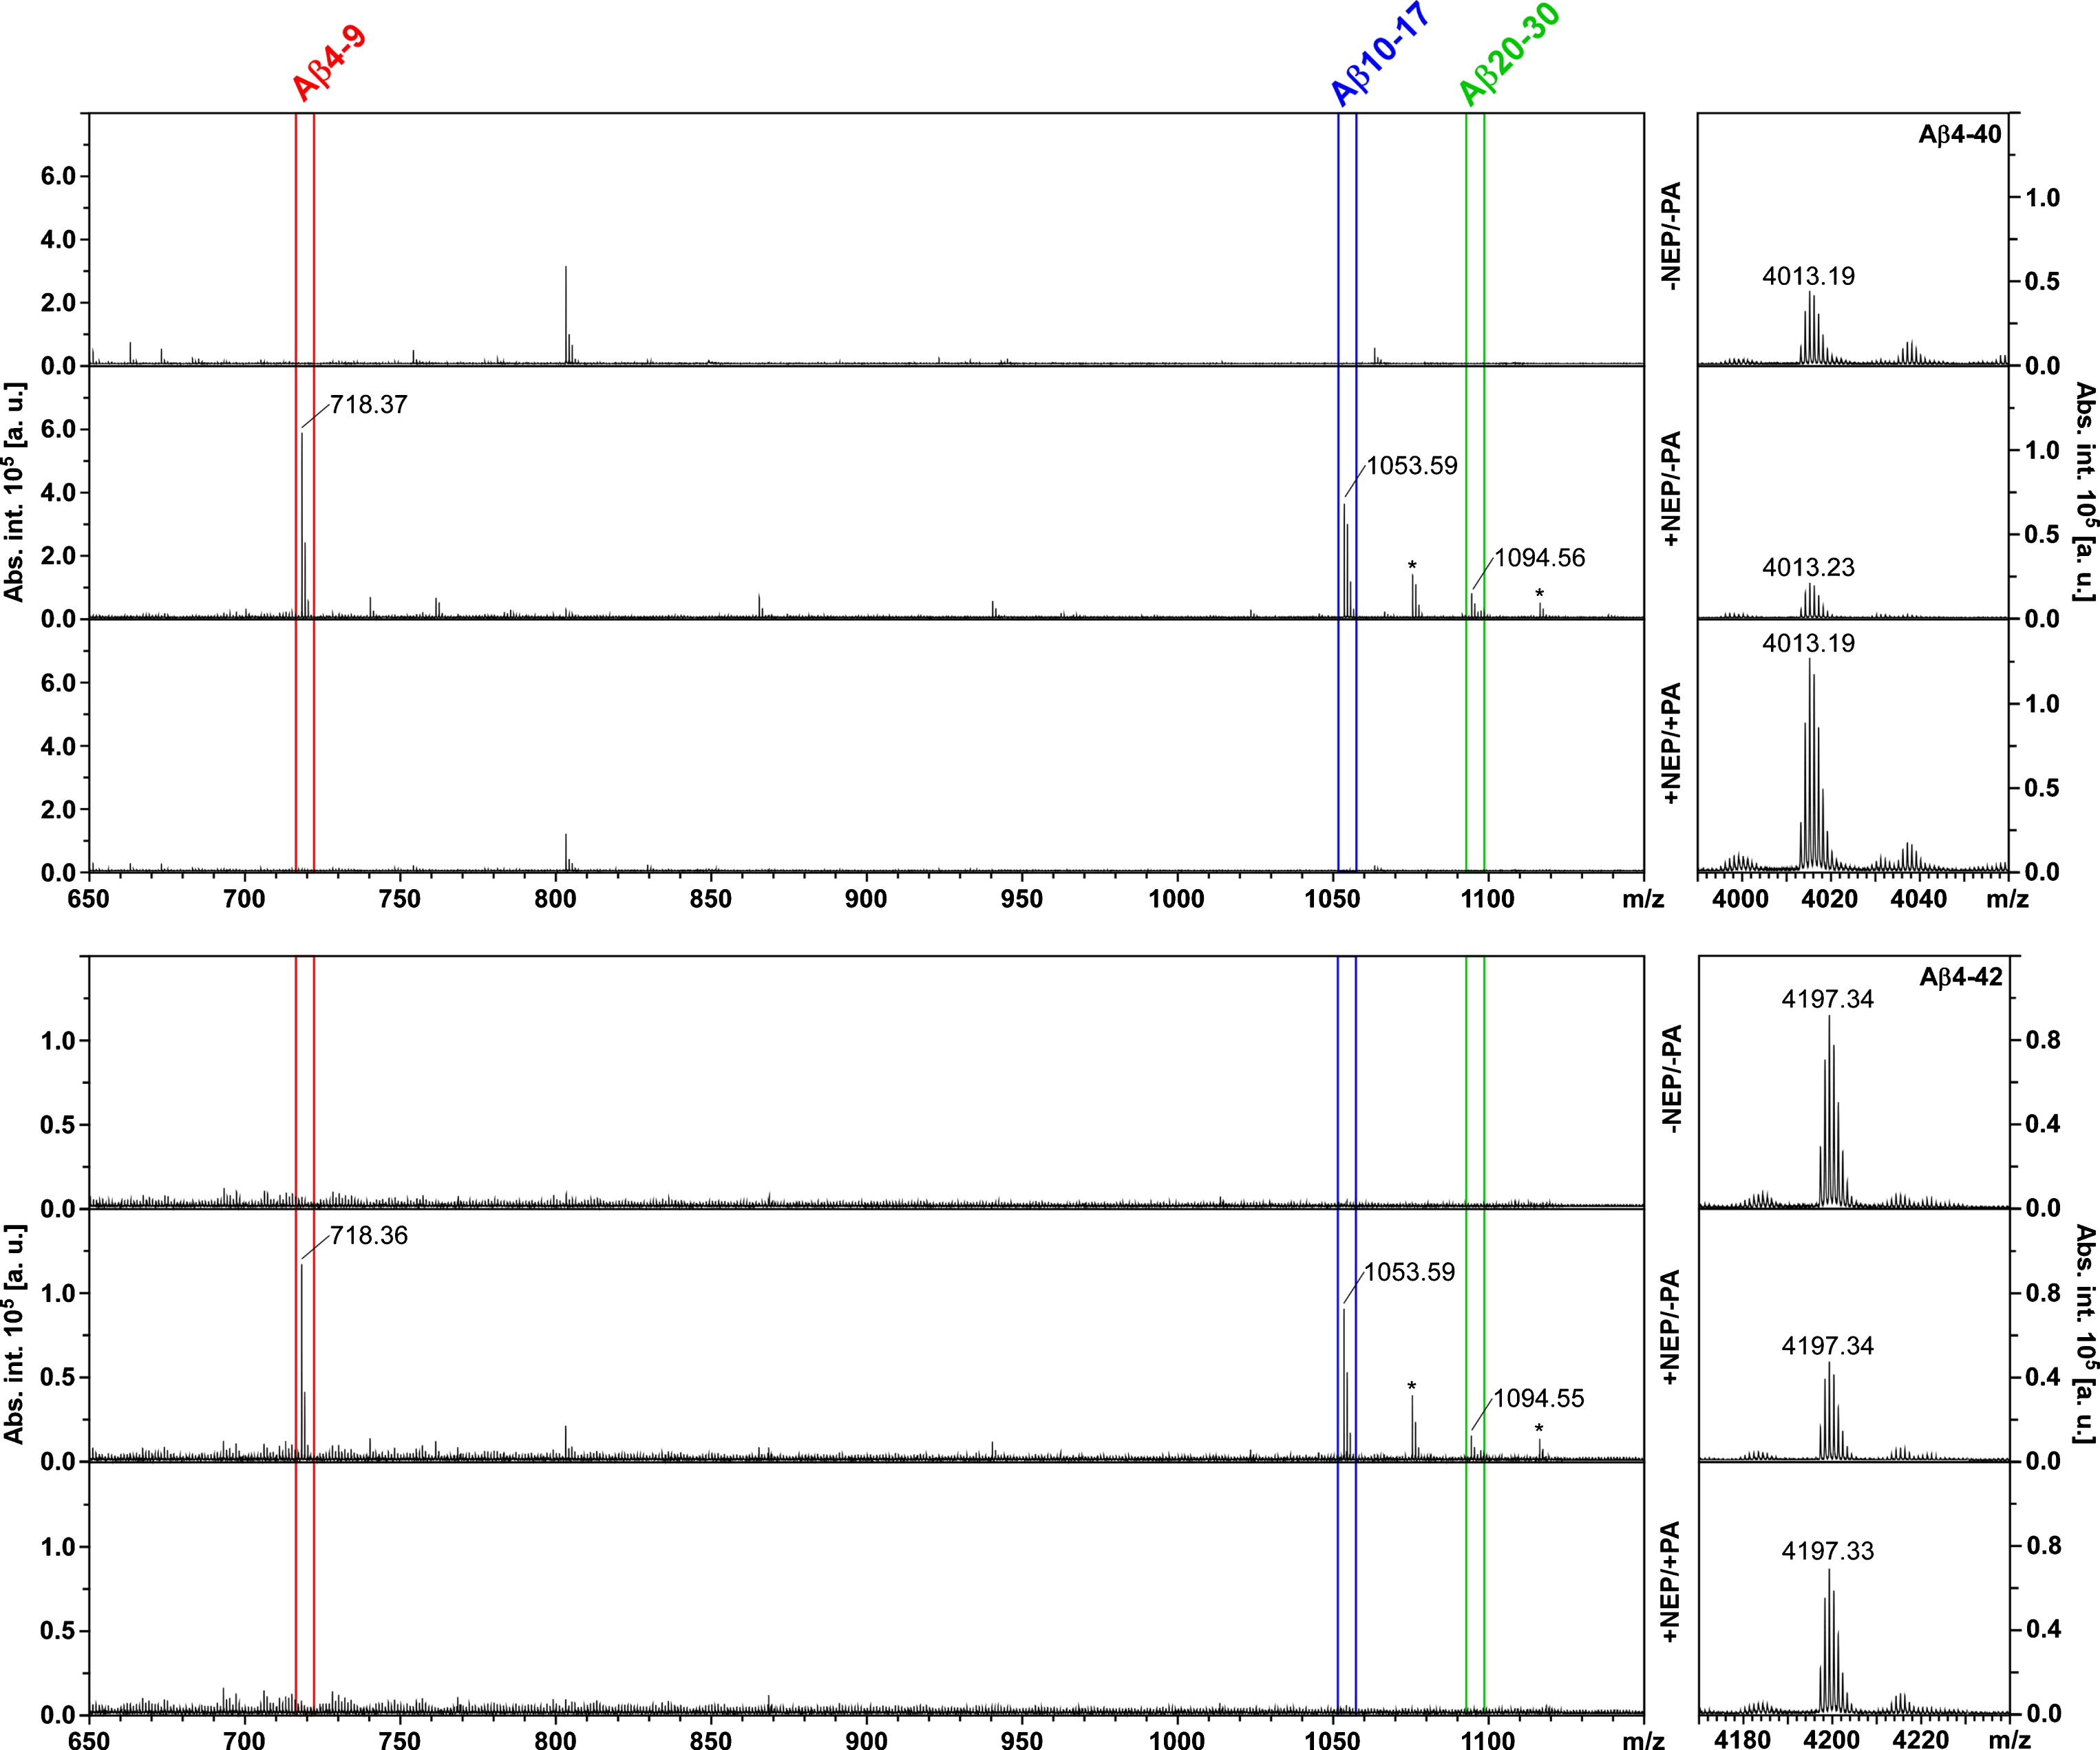
Mass spectrometric detection of Aβ4-x peptides and their NEP cleavage products. Aβ4-40 (upper panel group; [M + H]+calc = 4013.0491) or Aβ4-42 (lower panel group; [M + H]+calc = 4197.1702) was incubated under control conditions (-NEP/-PA), with neprilysin (+NEP/-PA), or with neprilysin in the presence of its inhibitor phosphoramidon (+NEP/+PA). Only the major cleavage products Aβ4-9 (red), Aβ10-17 (blue), and Aβ20-30 (green) are annotated for the sake of clarity. See Supplementary Table 2 for a list of all fragments detected. Note that the m/z ranges for the intact Aβ4-x peptides (right) and for the cleavage products (left) are shown with different intensity axes (in arbitrary units, a. u.) only for display reasons, but originate from the same mass spectrum. Asterisks indicate the sodium adducts of Aβ10-17 and Aβ20-30, respectively.
In order to determine the occurrence of shorter Aβ fragments generated by NEP hydrolysis, which may have escaped gel electrophoretic detection, parallel reactions were subjected to analysis by MALDI mass spectrometry. When the mass spectra of Aβ4-40 and Aβ4-42 were compared in a semi-quantitative manner, the signal for the intact peptides was decreased after incubation with NEP in comparison to the no-enzyme controls or the inhibitor-treated samples (Fig. 2). Correspondingly, signals for the major enzymatic cleavage products Aβ4-9, Aβ10-17, and Aβ20-30 were detected only after treatment of the Aβ4-x peptides with NEP (Fig. 2, Supplementary Table 2). The same pattern was observed with the Aβ1-x peptides, where Aβ1-9 was detected in addition (Supplementary Fig. 3, Supplementary Table 2). Taken together, these findings confirm the degradation of Aβ4-x and Aβ1-x peptides by NEP as revealed by gel electrophoresis (Fig. 1) and identify Aβ4-9/Aβ1-9, Aβ10-17, and Aβ20-30 as the major enzymatic products, which is in agreement with a very recent mass spectrometric study on the NEP cleavage sites in Aβ1-40 [26].
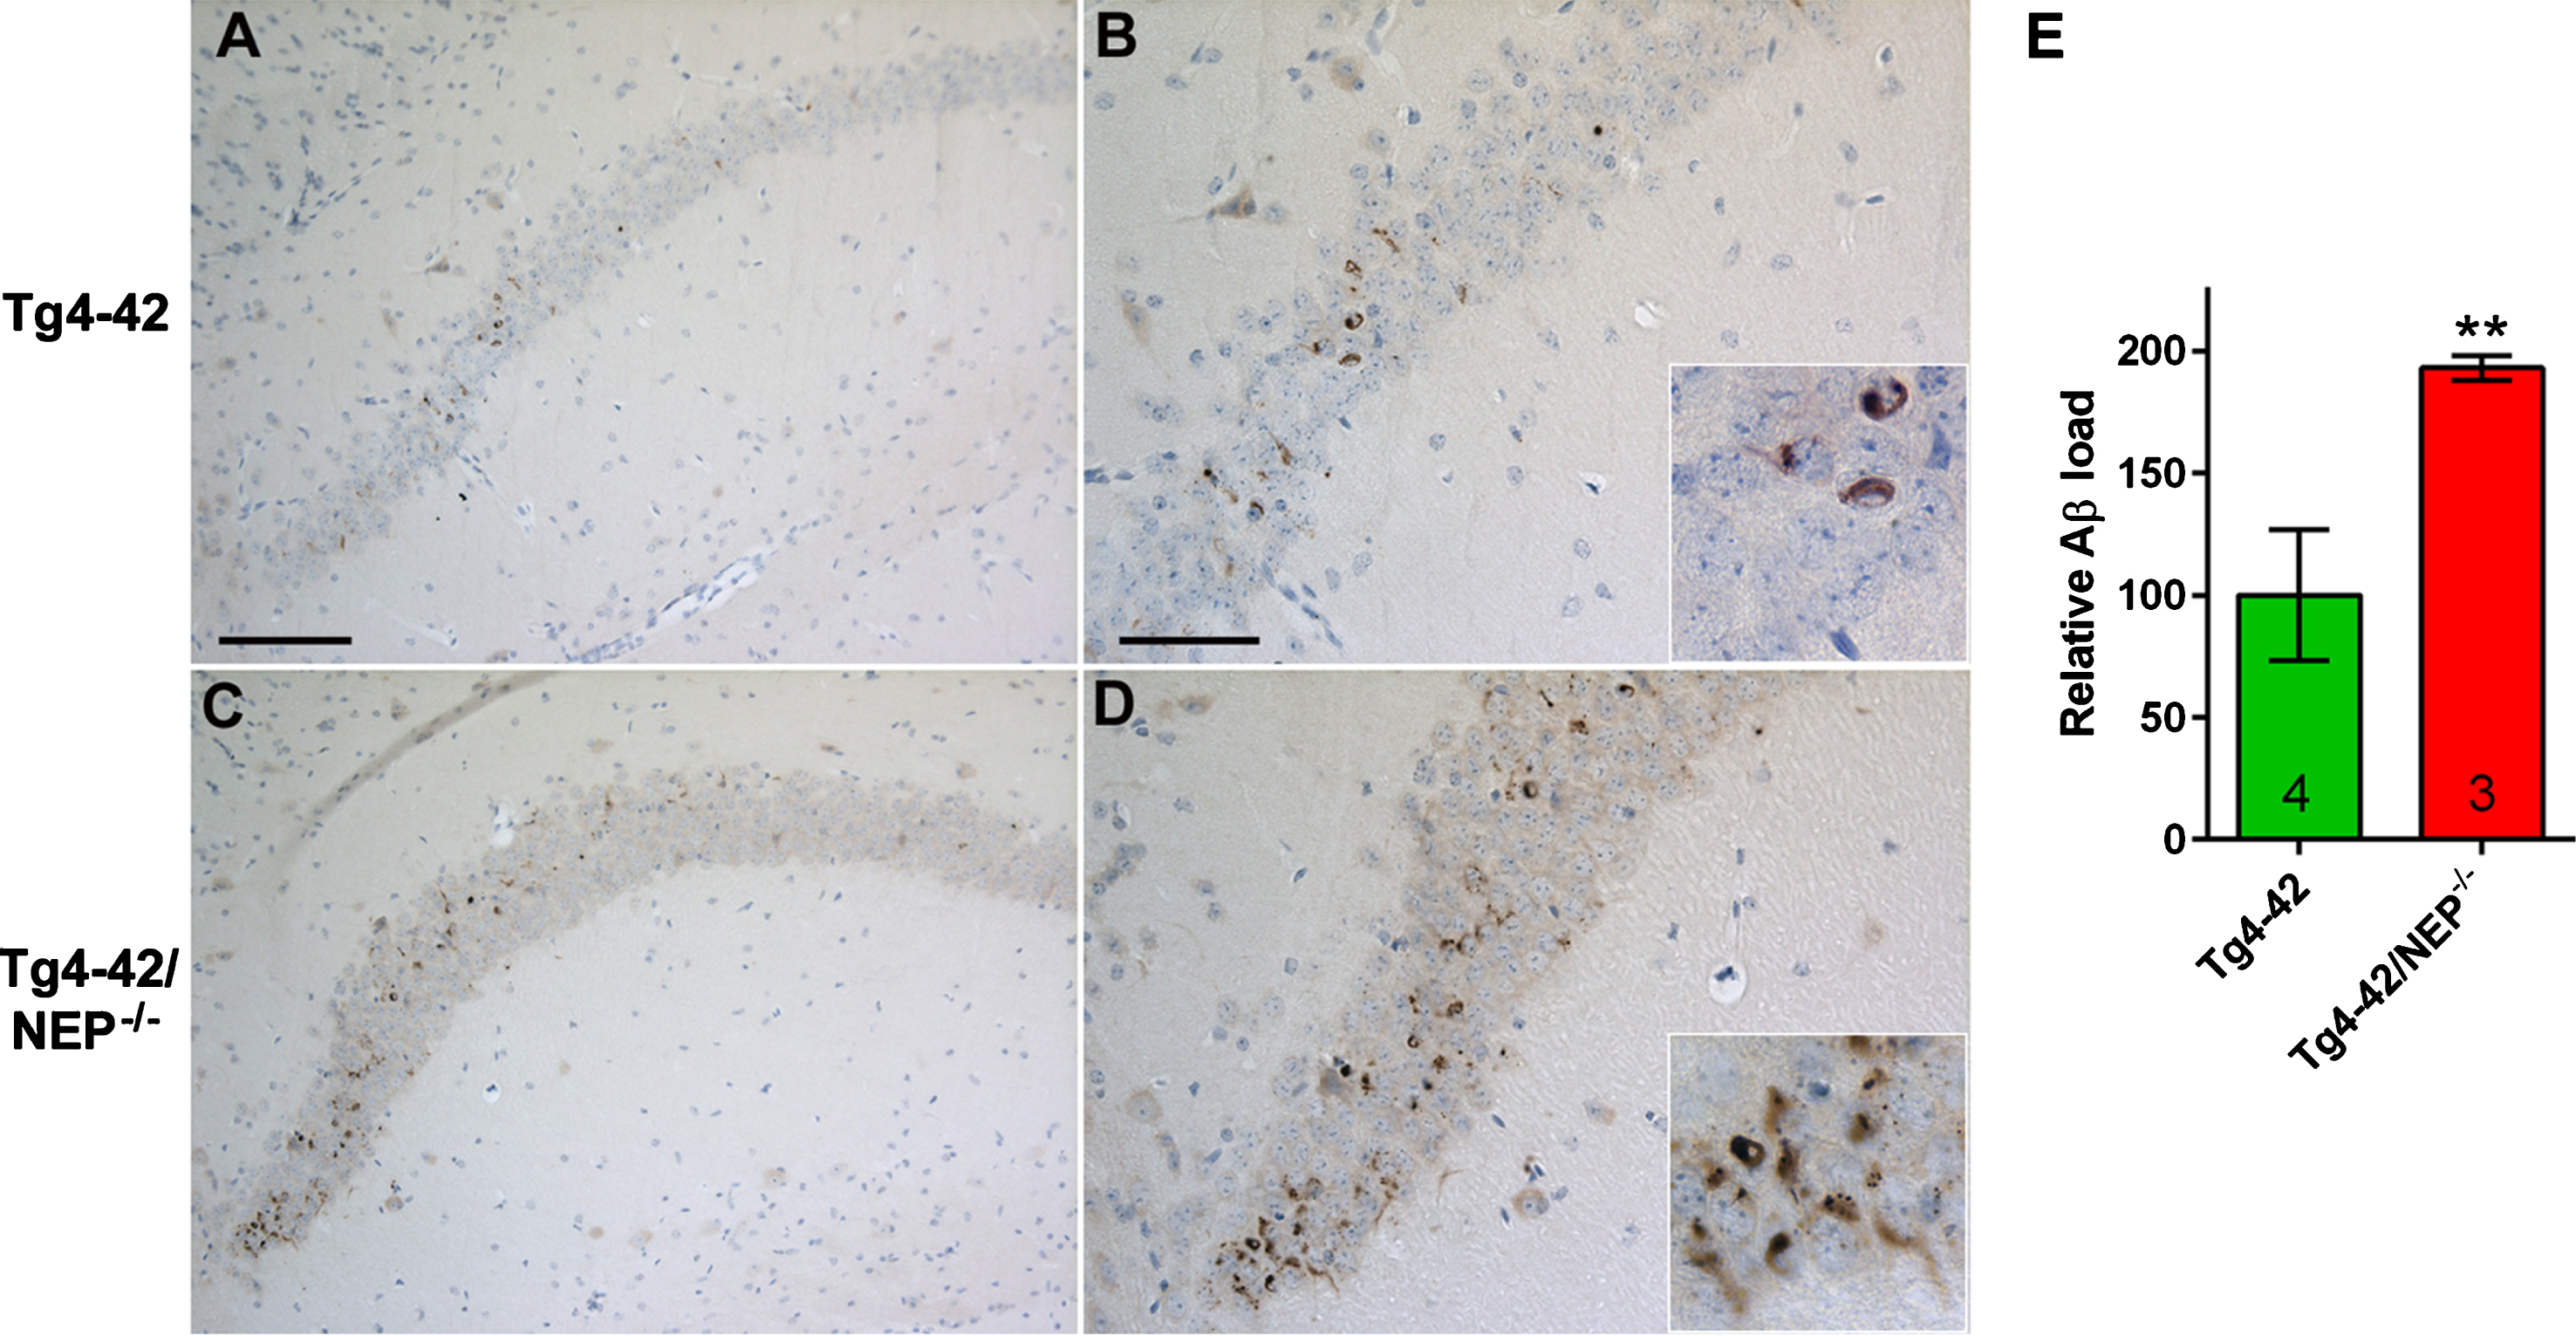
Intraneuronal Aβ4-42 accumulation in young Tg4-42 and Tg4-42/NEP-/- mice. Intracellular accumulations of Aβ4-42 peptides were detectable in CA1 pyramidal neurons in Tg4-42 mice (A,B). This accumulation was strongly aggravated in Tg4-42 mice lacking endogenous NEP expression (C,D). Semi-quantitative analysis revealed a significant increase in Tg4-42/NEP-/- compared to Tg4-42 mice (p < 0.01) (E). Scale bars: A,C: 100μm; B,D: 50μm.
Intraneuronal accumulation of Aβ4-42 in Tg4-42 and Tg4-42/NEP-/- mice
Sagittal sections of 3- and 12-month-old Tg4-42 and Tg4-42/NEP-/- mice were stained with a polyclonal pan-Aβ antibody (24311) that has been previously demonstrated to show a preference for Aβ4-42 peptides [25]. Intraneuronal accumulations of Aβ4-42 were observed in CA1 pyramidal neurons in young Tg4-42 mice (Fig. 3A, B) but were barely detectable in aged 12-month-old Tg4-42 mice as described previously [15]. A semi-quantitative analysis in young mice revealed a significant increase in Aβ immunoreactivity in Tg4-42/NEP-/- (Fig. 3C, D) compared to Tg4-42 mice (p < 0.01) demonstrating a strong increase in intraneuronal Aβ accumulation in the NEP knock-out background (Fig. 3E). As expected, no such increase was observed in aged Tg4-42 and Tg4-42/NEP-/- mice (p > 0.05). In addition, semi-quantitative analysis of the microglia/macrophage marker IBA1 revealed no significant difference in the CA1 region between Tg4-42 and Tg4-42/NEP-/- mice (p > 0.05) (Supplementary Fig. 4).
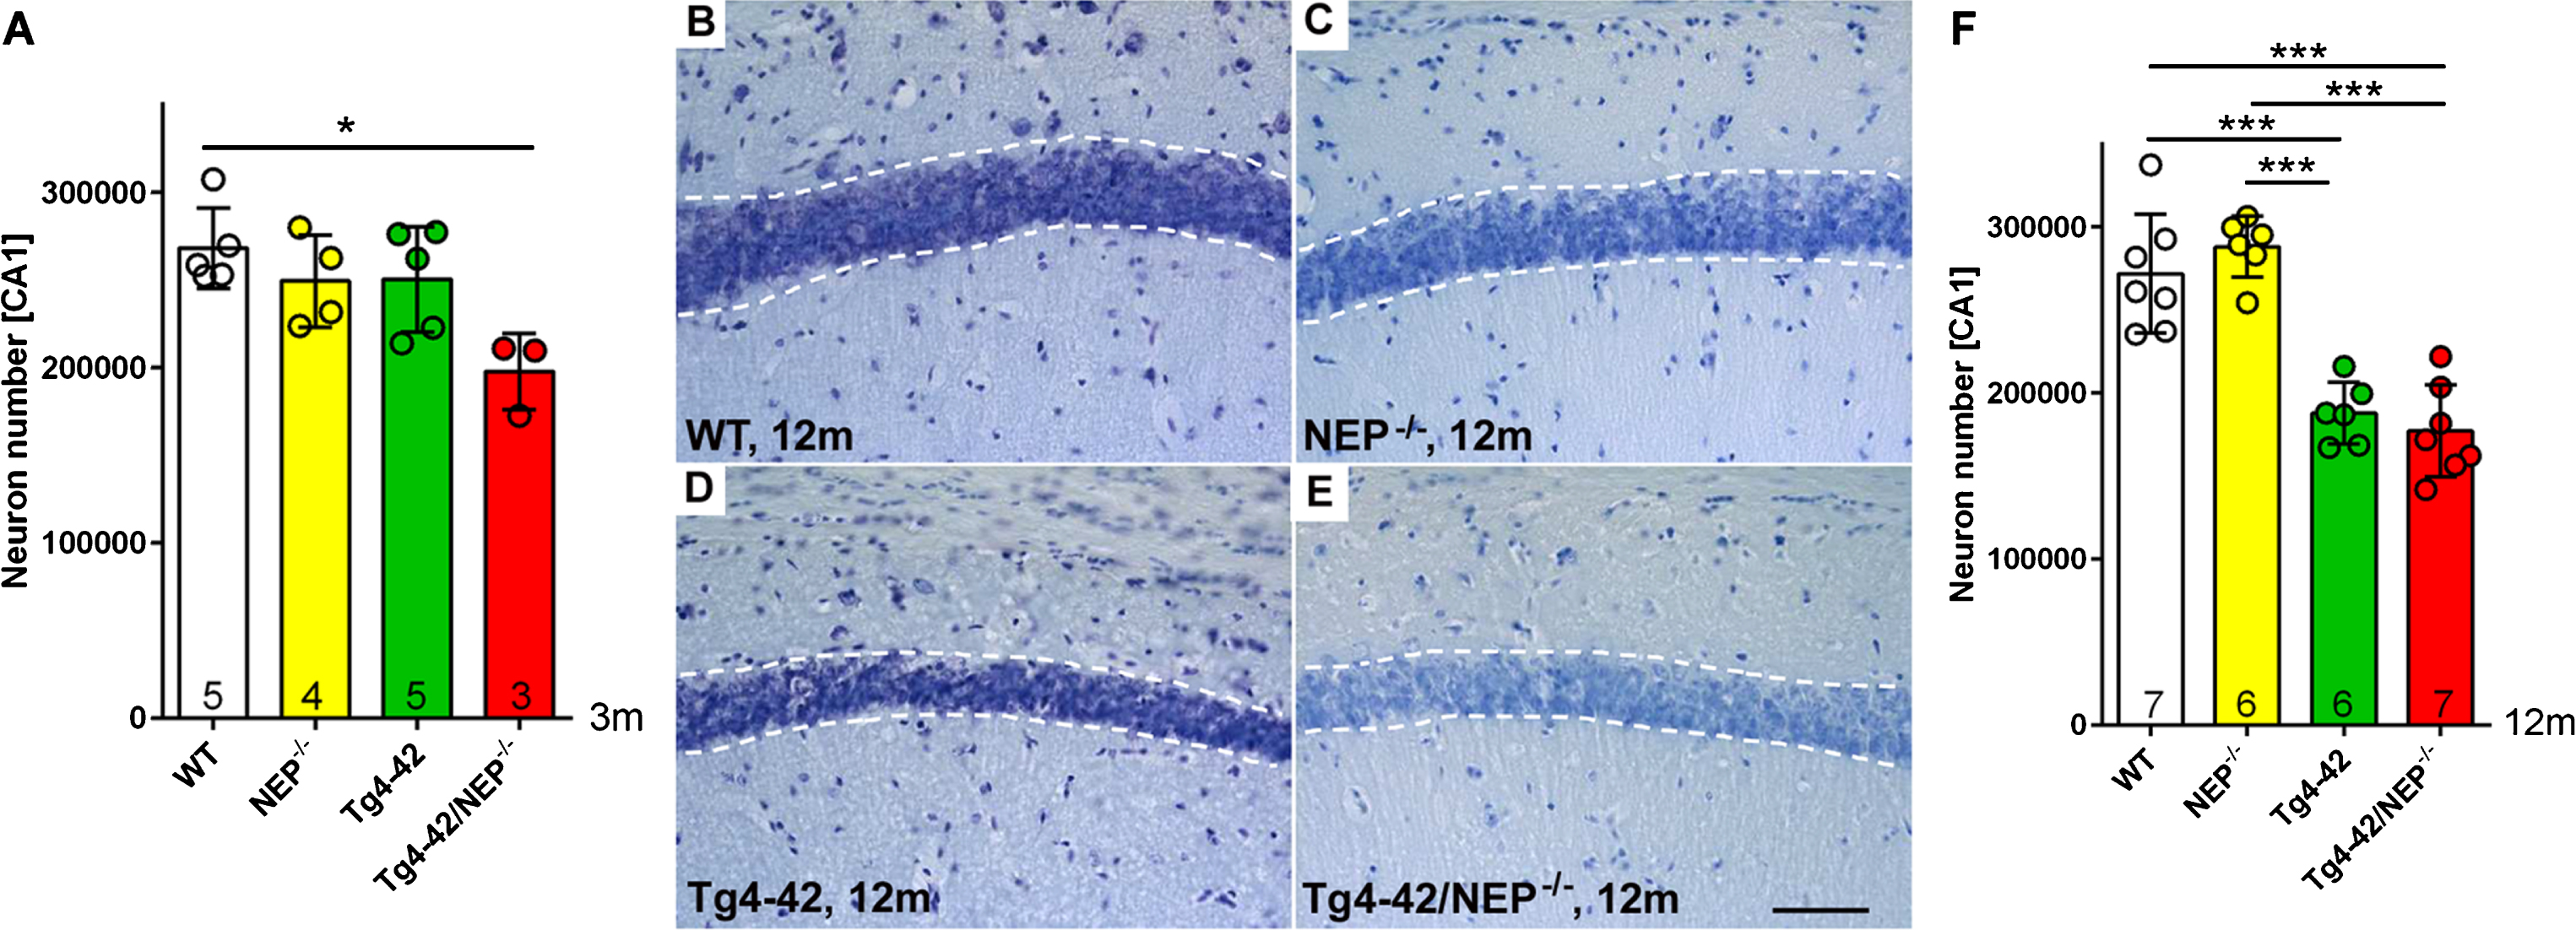
Quantification of CA1 neuron numbers using design-based stereology. A) A significantly reduced CA1 neuron number could be detected already in 3-month-old Tg4-42/NEP-/- compared to WT mice (p < 0.05), while no such differences were evident in NEP-/- or Tg4-42 mice. Exemplary images of cresyl violet-stained sections illustrating the CA1 layer in 12-month-old WT (B), NEP-/- (C), Tg4-42 (D), and Tg4-42/NEP-/- mice (D). At 12 months of age, both Tg4-42 and Tg4-42/NEP-/- mice showed significantly reduced CA1 neuron numbers compared to WT mice and NEP-/- mice respectively (p < 0.0001) (F). *p < 0.05; ***p < 0.0001. Scale bar: 50μm
Quantitative analysis of CA1 neuron numbers
A stereological quantification of CA1 pyramidal neuron numbers in cresyl violet stained coronal sections from 3-month-old mice revealed a significant loss of ∼26% in Tg4-42/NEP-/- (197830±21768) compared to WT (268247±23024) mice (p < 0.01) (one-way ANOVA, p = 0.0189, F (3,13) = 4.749), while no such difference was observed for NEP-/- (24526±26239) or Tg4-42 (250491±30054) mice (Fig. 4A). At 12 months of age (Fig. 4B-E), both Tg4-42 (187383±18630) and Tg4-42/NEP-/- (177266±27825) mice showed a highly significant decrease in neuron numbers compared to both WT (271877±13526) and NEP-/- mice (288105±18357) mice (all p < 0.0001) (one-way ANOVA, p < 0.0001, F (3,21) = 29.17). No statistically significant difference was detected between 12-month-old WT and NEP-/- or Tg4-42 and Tg4-42/NEP-/- mice (p > 0.05) (Fig. 4F).
DISCUSSION
In this study, we assessed whether Aβ4-x peptides represented substrates for NEP and whether NEP reduction in Tg4-42 mice had an impact on the neurodegenerative phenotype observed in this model. Aβ4-42 peptides lack the N-terminal three amino acids and start with phenylalanine. The presence of these peptides in the brain of AD patients has been confirmed in numerous studies by mass spectrometry [13, 28] or based on Aβ4-x specific antibodies [29, 30].
In vitro digestion confirms that in addition to Aβ1-40 [4] and Aβ1-42, Aβ4-40, and Aβ4-42 represent NEP substrates. The occurrence of short Aβ fragments after NEP digestion identified by mass spectrometry and further verified by mass spectrometric sequencing suggests cleavage at multiple sites as previously assumed and demonstrated [26, 31]).
Tg4-42 mice express Aβ4-42 peptides and show an age-dependent loss of pyramidal neurons in the CA1 layer of the hippocampus. In good agreement with previous studies, we confirm here a significant reduction of the CA1 neuron number in Tg4-42 mice at 12 months of age compared to age-matched WT mice [15, 32], as well as an unchanged neuron number in young 3-month-old Tg4-42 mice [20]. Comparison of 12-month-old Tg4-42/NEP-/- with single-transgenic Tg4-42 mice did not show a further aggravation of this neurodegenerative phenotype, indicating that the CA1 neuron loss reached a plateau phase. This neuron loss seems to be associated with intraneuronal Aβ peptides which can be detected in young Tg4-42 mice [20] and declines in an age-dependent manner as shown previously [15].
In the present study, a significantly increased Aβ accumulation was observed in pyramidal cells of the CA1 layer in the hippocampus of young Tg4-42/NEP-/- mice compared to age-matched Tg4-42 mice. An association of intraneuronal Aβ peptides and neurodegeneration has been previously established in a variety of transgenic mouse models of AD (reviewed in [33]). In AβPP-overexpressing transgenic mice, such as the widely-used 5XFAD mouse model of AD, a significant loss of cortical neurons was reported, starting at approximately 9 months of age [34]. This is preceded by intraneuronal accumulation of Aβ peptides [35]. In APP/PS1KI mice, a further transgenic mouse model with robust amyloid pathology, an age-dependent loss of cortical [23], hippocampal [36] and cholinergic neurons [37] has been reported which is dependent on anteceding cellular Aβ accumulation.
Previous studies employing transgenic AβPP-overexpressing mice on a NEP knock-out background have demonstrated that NEP deficiency impacts Aβ levels in vivo. A higher abundance of amyloid plaques was observed in the hippocampal formation of J9 mice on either a heterozygous or homozygous NEP knockout background [7]. In good agreement, semi-quantitative analysis of extracellular amyloid plaque load in 6-month-old 5XFAD/NEP+/- mice revealed a significant increase in dentate gyrus, subiculum, or spinal cord compared to age-matched 5XFAD mice. Again this was accompanied by an elevation of soluble Aβ42 levels [8].
Correspondingly, an elevation of neprilysin levels by either viral vector-mediated gene transfer or by transgenic overexpression facilitated clearance of Aβ peptides in AD transgenic mice [11, 39]. With regard to our current study, it is particularly interesting that sustained expression of neprilysin for up to 6 months using a lentiviral vector did not only lower extracellular amyloid plaque load but also reduced intracellular Aβ immunoreactivity [40]. Furthermore, IIjima-Ando and colleagues demonstrated that the neuron loss induced by intraneuronal Aβ42 deposits could be sufficiently suppressed in Drosophila melanogaster transgenic for Aβ42 by additional expression of human NEP [10].
In the present study we observed that a reduction of NEP led to significantly reduced CA1 neuron numbers in 3-month-old Tg4-42/NEP-/- mice compared to Tg4-42 mice with normal endogenous NEP expression. Taken together, this may suggest that in young Tg4-42/NEP-/- mice an increased Aβ accumulation accelerates neurodegeneration. However, at 12 months of age, the extent of neuronal loss has reached a plateau and is essentially the same in Tg4-42/NEP-/- and Tg4-42 mice. The unchanged number of neurons in NEP-/- compared to WT mice confirms that a lack of NEP expression does not per se alter neuronal integrity.
NEP is almost exclusively expressed in neurons, especially in the stratum lacunosum-moleculare and the stratum pyramidale of the CA1-3 fields and it is axonally transported to presynaptic terminals following synthesis in the soma [41]. This suggests that presynaptic terminals and intracellular locations are likely the main sites of NEP-mediated Aβ degradation [38]. This assumption is supported by the finding that viral expression of NEP in primary neurons led to effective clearance of Aβ in vitro [42].
In summary, the current data suggests that Aβ4-x peptides represent NEP substrates and that a lack of NEP accelerates hippocampal neuron loss in relatively young transgenic mice expressing Aβ4-42.
Footnotes
ACKNOWLEDGMENTS
The expert technical assistance of Petra Tucholla, Petra Rieper, and Gabriele Paetzold, as well as the generous gift of Neprilysin knock-out mice by Dr. Takaomi Saido, are gratefully acknowledged. The authors further gratefully acknowledge financial support provided by the Alzheimer Forschung Initiative (grant 16013) and Gerhard-Hunsmann-Stiftung to OW. JW is supported by an Ilídio Pinho professorship and iBiMED (UID/BIM/04501/2013), and FCT project PTDC/DTP_PIC/5587/2014 at the University of Aveiro, Portugal.
