
Abstract
Background:
Amyloid plaque and tau-containing neurofibrillary tangles are important features of Alzheimer’s disease (AD). However, the relationship between these processes is still debated.
Objective:
We aimed to investigate local and distant relationships between tau and amyloid deposition in the cortex in mild cognitive impairment (MCI) and AD using PET imaging.
Methods:
Seventy-nine subjects (51 controls, 13 amyloid-positive MCI subjects, and 15 amyloid positive AD subjects) underwent MRI and 18F-flutemetamol PET. All MCI/AD subjects and 8 healthy controls as well as 33 healthy control subjects from the ADNI dataset also had 18F-AV1451 PET. Regional and distant correlations were examined after sampling target-to-cerebellar ratio images. Biological parametric mapping was used to evaluate voxel level correlations locally.
Results:
We found multiple clusters of voxels with highly significant positive correlations throughout the association cortex in both MCI and AD subjects.
Conclusion:
The multiple clusters of positive correlations indicate that tau and amyloid may interact locally and be involved in disease progression. Our findings suggest that targeting both pathologies may be required.
INTRODUCTION
Amyloid-β (Aβ) plaques and tau-containing neurofibrillary tangles (NFTs) have been consistently described as cardinal features of Alzheimer’s disease (AD) [1]. While the presence of both is required for a pathological diagnosis of AD, the exact interaction is still debated.
Aβ has a central role in AD: by definition, plaques are necessary but not sufficient for a diagnosis of AD [2]. NFTs are also required for a diagnosis [1]. However, NFT aggregation increases with age almost universally, but can occasionally be found in healthy individuals under 30 years [3, 4]. Thus, isolated medial temporal tauopathy is not sufficient to cause AD [4]. This suggests that while Aβ plaques and tau tangles are both required to cause AD, neither is sufficient by itself.
PET imaging allows us to evaluate both these processes. 18F-flutemetamol and 18F-florbetapir are amyloid tracers, while 18F-AV1451 has nanomolar affinity for paired helical filament-tau [5]. PET also enables us to correlate these processes at a voxel level using biological parametric mapping (BPM) analysis in SPM [6].
We hypothesized that tau aggregation would correlate at voxel level with amyloid levels in the isocortex, and that tau aggregation in the medial temporal lobe structures would correlate with amyloid in the isocortex. We further hypothesized that there will be local correlation between tau and amyloid in different cortical regions.
METHODS
Standard protocol approvals, registrations, and patient consents
Ethical approval was obtained from local and national ethics committees (The Riverside Research Ethics Committee – National Health Research Services, Health Research Authority, UK.) The approval for administration of radioactive activity was given by the Administration of Radioactive Substances Advisory Committee (ARSAC). Written informed consent was obtained from all subjects.
Recruitment
Subjects were recruited from memory clinics, a national dementia recruitment website and advertisements in local media. All subjects underwent a screening visit consisting of history, physical and neurological examination, and neuropsychological testing. The clinical diagnosis of MCI or AD was re-confirmed applying the Petersen [7] and NINCDS-ADRDA (National Institute of Neurological and Communicative Disorders and Stroke and the Alzheimer’s disease and Related Disorders Association (NINCDS-ADRDA) criteria, respectively [8, 9].
Inclusion criteria were: 1) A diagnosis of MCI as defined by the Petersen criteria, or AD as defined by NINCDS-ADRDA criteria, or normal cognition for the healthy controls; 2) Age range 50–85 years; 3) Ability to give informed consent; 4) At least 8 years of formal education; 5) Mini-Mental State Examination (MMSE) score above 24 for MCI, above 15 for AD, and normal cognition for healthy control subjects. Exclusion criteria were: 1) Major depression, or any significant disease influencing neuropsychological testing; 2) A history of schizophrenia/schizoaffective disorder. 3) Contraindication to MRI scanning; 4) A malignancy within the last 5 years.
Alzheimer’s disease neuroimaging initiative (ADNI) database
In order to ensure a sufficiently large group of normal controls (only eight controls from our center had 18F-AV1451 scans), 33 healthy control subjects were drawn from the ADNI database (http://adni.loni.usc.edu/). Selection criteria included subjects who had had amyloid and tau imaging, and age range between 65–75 years old. All subjects gave written informed consent.
Image acquisition
ADNI controls
A description of the MRI, 18F-AV45, and 18F-AV1451 data acquisition for the 33 controls from the ADNI database is available on the ADNI website (http://www.adni-info.org/Scientists/ADNIStudyProcedures.aspx). Only the 18F-AV1451 scans for these individuals were used in the correlation and group analyses, as these individuals had different amyloid PET scans from our cohort (18F-florbetapir scans were used in the ADNI controls, and 18F-flutemetamol used in our center).
MRI
Subjects recruited at our center had magnetic resonance imaging (MRI) with a 3 Tesla Siemens 32-channel Verio scanner. A T1-weighted magnetization prepared rapid gradient echo sequence (MPRAGE; time repetition = 2400 ms, time echo = 3.06 ms, flip angle of 9, inversion time = 900 ms, matrix = [256×246]) with a 1 mm3 voxel size, anteroposterior phase encoding direction, and a symmetric echo was used. Two subjects with coronary artery stents (who were ineligible for 3 Tesla MRI) underwent 1.5 Tesla MRI in a Philips Achieva system (Best, Netherlands) at the MRC Clinical Sciences Centre, Imperial College London.
18F-flutemetamol
18F-flutemetamol was manufactured by GE Healthcare, Amersham, UK, and scans were performed at Imperial College Clinical Imaging Facility using a Siemens Biograph 6 scanner with a 15 cm field of view. A mean dose of 183.4 (±5.3) MBq 18F-flutemetamol in 8 ml saline was injected followed by a 5–10 ml saline flush. Data was acquired in 3D list mode from 90 to 120 min following injection and re-binned as 6×5 min frames. Image reconstruction was performed by filtered back projection with attenuation correction. Post reconstruction 5 mm Gaussian smoothing was applied (the zoom was 2.6, the matrix size was 168×168 and the pixel size was 1.56 mm×1.56 mm×1.92 mm).
18F-AV1451 (flortaucipir)
18F-AV1451 was manufactured at Imanova Centre for Imaging Sciences, London, and scans were acquired using a Siemens Truepoint PET/CT (axial field of view of 21.8 cm; 111 transaxial planes; spatial resolution of 2.056 mm×2.056 mm×2 mm after image reconstruction. A mean dose of 168.3 (±7.4) MBq 18F-AV1451 in 20 ml saline was injected. Data was acquired in 3D list mode for 120 min and the data was rebinned at the following time frames: 8×15 s, 3×60 s, 5×120 s, 5×300 s, 8×600 s. Data reconstruction was performed by iterative reconstruction and 5 mm Gaussian smoothing post reconstruction.
Image processing
Image processing was performed with Analyze AVW 11.0 and SPM (Statistical parametric mapping software; Wellcome Trust Centre for Neuroimaging, University College London) on a Matlab platform. Scans were pre-processed in Analyze AVW. Voxel level correlations were performed using the Biological Parametric Mapping toolbox, which is integrated into SPM5 software. Regional correlations were calculated using SPSS version 24.0 (IBM), using a statistical threshold of significance of p < 0.05.
Creation of ratio images for 18F-flutemetamol and 18F AV1451
The 90–120 min summed PET image for 18F-flutemetamol and 80–100 min summed PET image for 18F-AV1451 were co-registered to the T1-weighted MRI and were then transformed into standard Montreal Neurologic Institute (MNI) space. In order to create an object map for each subject, each individual MRI was segmented in Analyze AVW into grey matter, white matter, and cerebrospinal fluid (CSF). Grey matter voxels were those that had a > 50% probability of containing grey matter and were used to create an individual grey matter binarized image. This individual grey matter binarized image was then convolved with the Hammers probabilistic atlas [10] to create an individualized object map. This object map was then applied to the normalized PET to quantify the uptake in the cerebellum. RATIO images were then created by dividing the individual PET image by the uptake of cerebellar grey matter to create a target to cerebellar RATIO image. The ratio image was then sampled for individual regions.
Voxel level examination of tracer binding
SPM8 was used to perform independent t-tests on the data (p-value <0.05, no extent threshold) to distinguish voxel level tracer uptake between the MCI/AD groups and the control group, using the normalized ratio images for 18F-AV1451 and 18F-flutemetamol.
Creation of Z-score maps and voxel-level correlations using biological parametric mapping
Voxel level correlations between 18F-AV1451 and 18F-flutemetamol were examined using the biological parametric mapping toolbox in SPM written on a Matlab (Mathworks Inc.) platform [6]. Z-score maps were created for each subject, for each tracer, to demonstrate the specific increase in tracer uptake compared to the control group. Generating a Z-score parametric map allows multi-modal comparison of different tracers, representing the level of each pathology relative to the control group. In addition, it accounts for non-specific binding seen in these tracers. The Z-score was calculated using the following formulae:
Individual Z-score 18F-flutemetamol and 18F-AV-1451 maps were then interrogated in BPM toolbox in order to localize clusters of positive correlation between the uptake of the two tracers. Results were corrected for family wise error. All clusters with a corrected p-value of p < 0.05 with an extent threshold of 1000 voxels were considered significant.
Single subject SPM analysis
Individualized tracer uptake on a ‘single subject’ basis was performed using an independent t-test in SPM, compared to the control group. This allowed us to identify clusters of significantly increased tracer uptake in each individual.
Region of interest analysis
Region of interest (ROI) analysis of the RATIO images was performed by sampling the following regions: anterior cingulate, posterior cingulate, temporal, frontal, parietal, and occipital lobes. Correlations were considered significant if the p-value was <0.05. Group comparisons were examined using the Kruskal-Wallis test. Regional correlations were interrogated using Spearman rho correlation coefficient, using continuous variables (SUVR values for 18F-flutemetamol and 18F-AV1451 for each region). Spearman rho correlation coefficient was used rather than Pearson coefficient because of the small number of participants used in the study.
Only MCI and AD subjects with positive amyloid scans were included in this study, because we wanted to examine the relationship between increasing amyloid load and tau deposition. Furthermore, we wanted to examine the underlying processes in individuals on the AD trajectory. Amyloid status was defined as positive if there was binding above the recently published cut-off of SUVR 1.42 in one or more of the regions described above (anterior cingulate, posterior cingulate, frontal, temporal, parietal, and occipital lobes) [11]. Tau status was considered positive if binding was above the threshold of 1.32 in the temporal lobe structures (hippocampus, parahippocampus, amygdala, fusiform gyrus), whole temporal lobe, parietal, frontal, or occipital lobe [11].
RESULTS
Demographics
In total, 79 subjects participated in the study (51 healthy controls, 13 amyloid-positive MCI subjects, and 15 amyloid-positive AD subjects). Eighteen controls were recruited at our center at Imperial College London (all had 18F-flutemetamol and eight of these had 18F-AV1451 scans). Additionally, the scans of 33 healthy controls were used from the ADNI database for 18F-AV1451 (these participants also had MMSE, MRI scans, and 18F-AV45 (18F-florbetapir scans). Subjects recruited from our center had neuropsychometric testing, T1-weighted MRI, and 18F-flutemetamol. Table 1A shows the age and MMSE scores for the cohort. Table 1B shows the neuropsychometric data for the subjects recruited at our center.
Demographic data of study participants. Values are mean (standard deviation)
Neuropsychometric data of the subjects recruited at our center. Values are mean (standard deviation) *p < 0.05, **p < 0.01
Voxel level increases in tau aggregation and amyloid deposition in MCI and AD
Figure 1 shows the voxel-level increases in 18F-flutemetamol and 18F-AV1451 in the MCI and AD groups compared to the controls
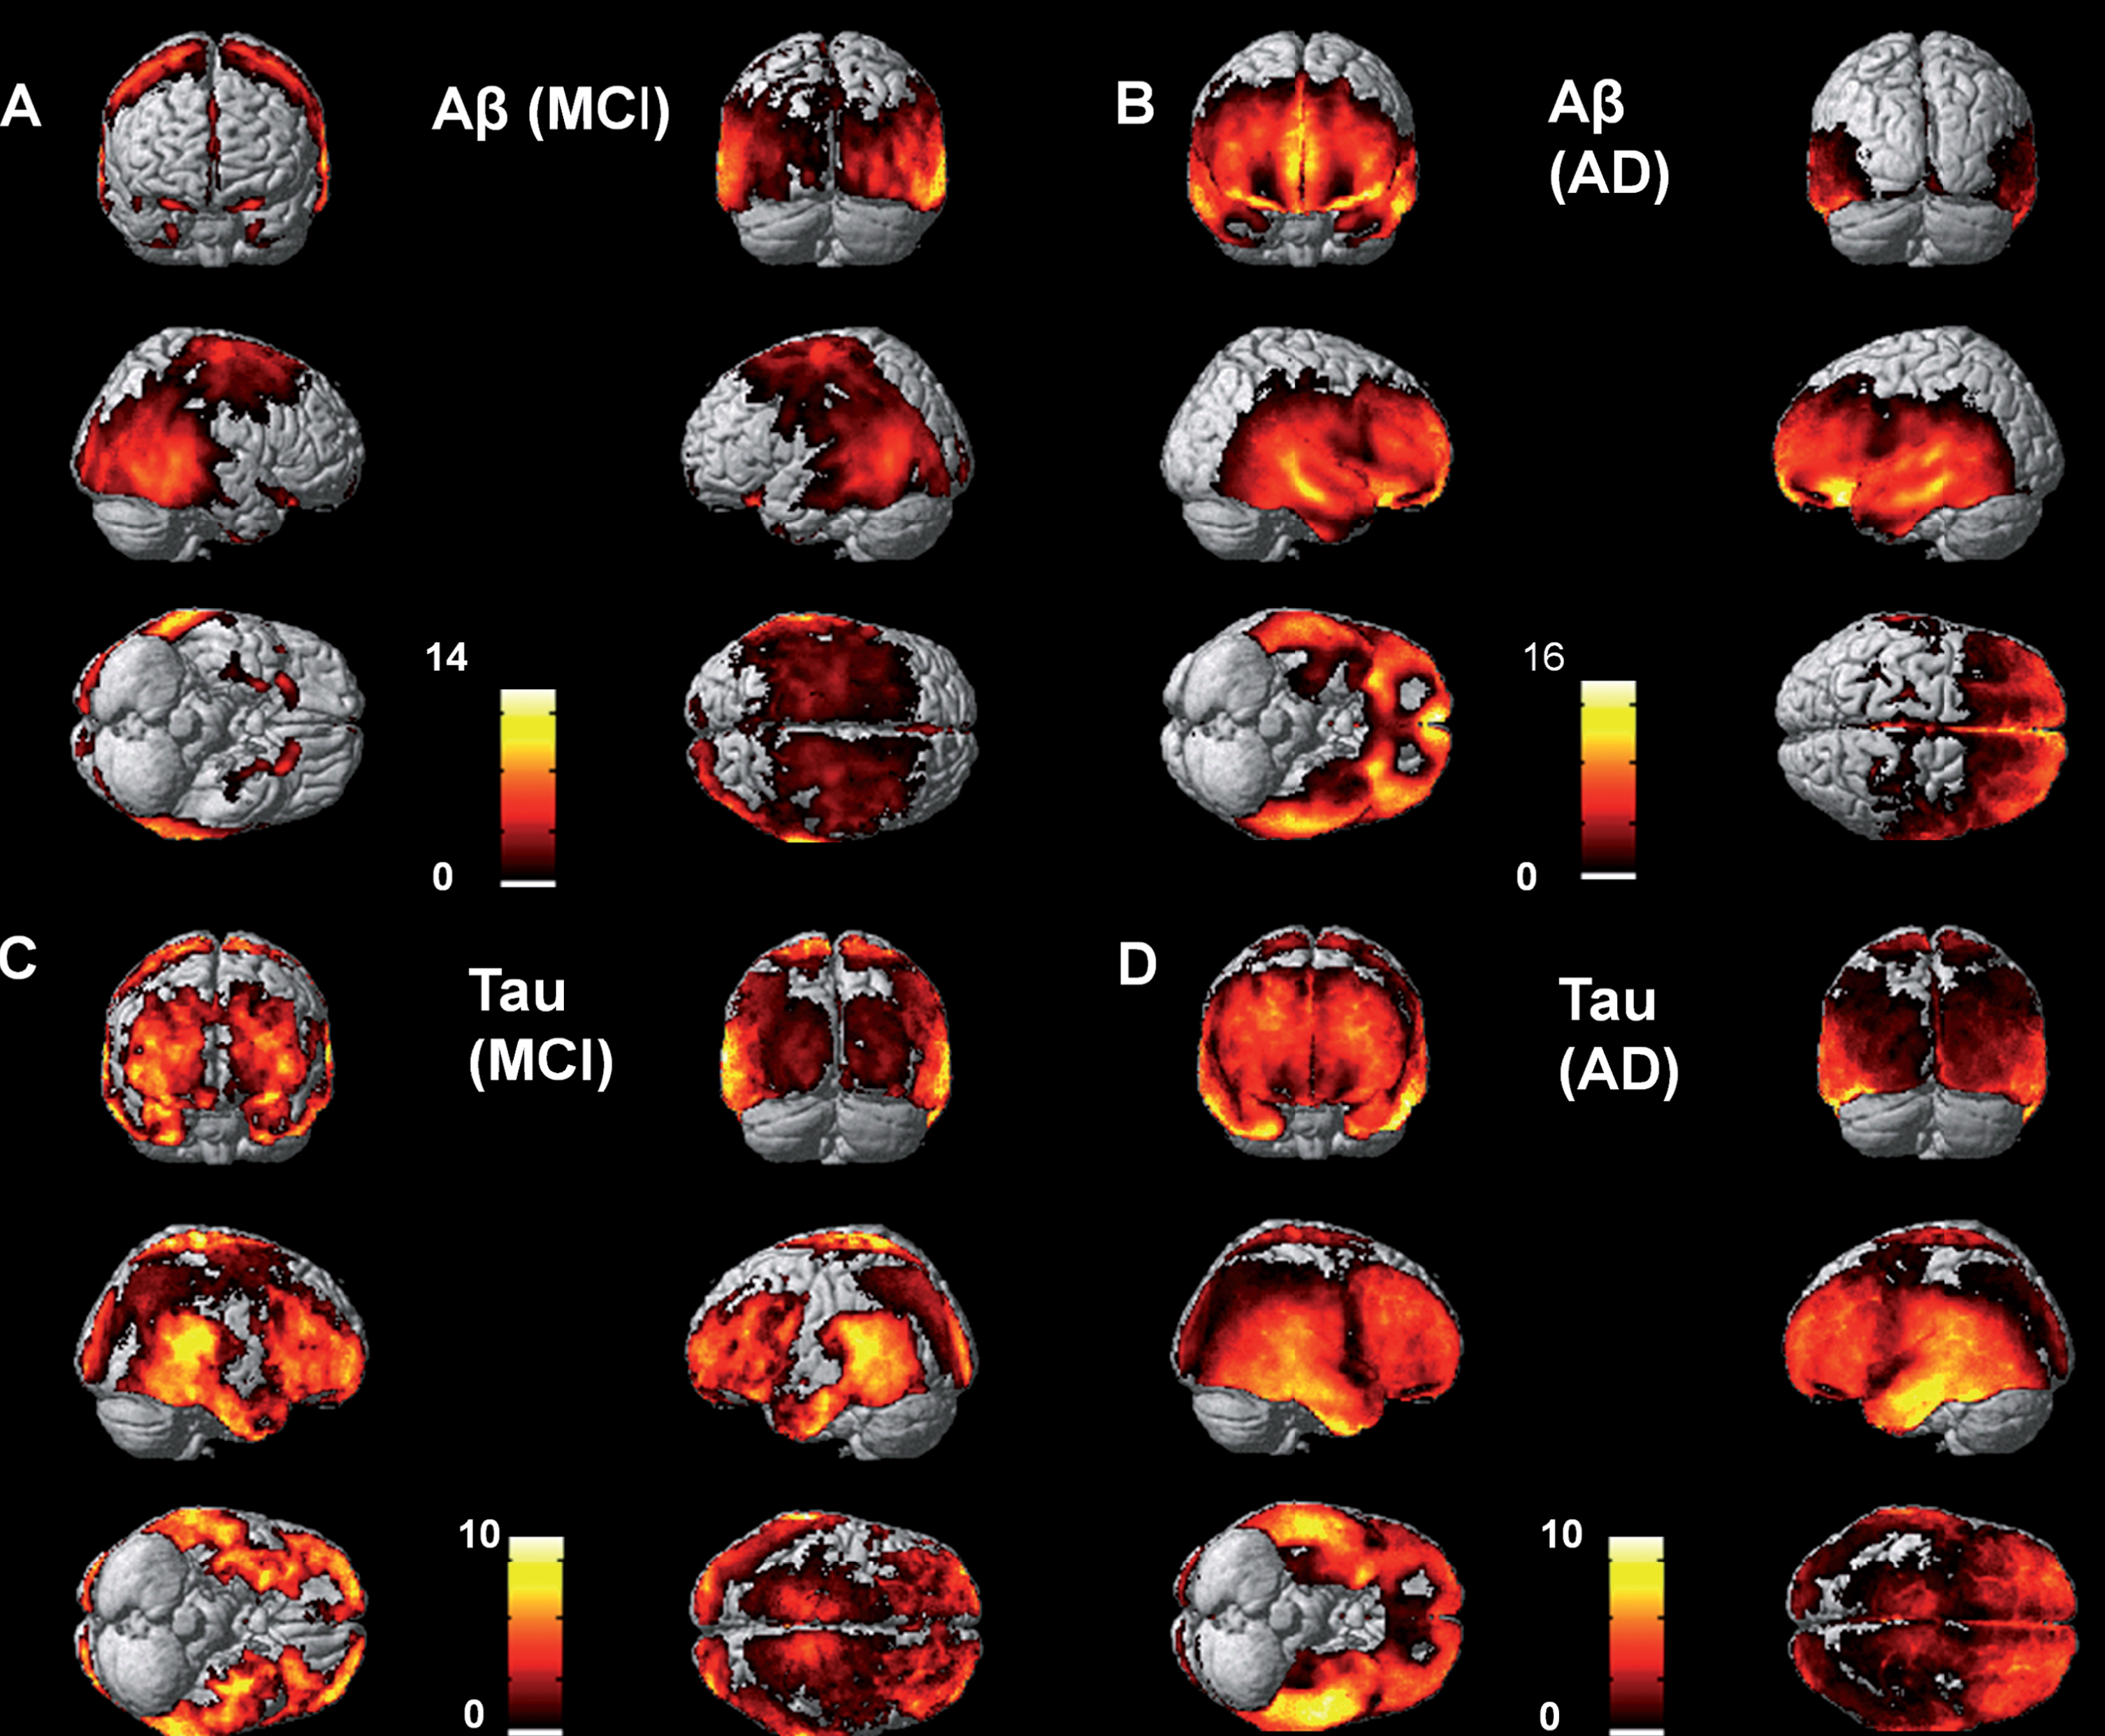
Voxel level increases in 18F-flutemetamol and 18F-AV1451 in the MCI and AD groups compared to the controls.
We were interested particularly in the relationships and correlations in the MCI group, and so we examined the spatial distribution of amyloid and tau in each individual MCI subject. Figure 2 shows the distribution of amyloid and tau aggregation in the six MCI individuals who had voxel level significant increases in tau aggregation compared with the controls on independent t-test. The amount and density of both amyloid deposition and tau aggregation varied in these MCI individuals, demonstrating the heterogeneity of the pathological load in these individuals.

Individual subject increases in amyloid and tau in the MCI group.
Regional level increases in amyloid and tau in MCI and AD
Individual SUVR values for each subject are shown in Supplementary Figures 1 (for 18F-Flutemetamol), Supplementary Figure 2 (for 18F-AV1451), and Supplementary Figure 3 (individuals recruited from the ADNI database). Both the MCI and AD groups demonstrated significantly increased 18F-flutemetamol uptake in the fusiform gyrus, anterior and posterior cingulate cortex, temporal frontal, parietal and occipital cortices (Supplementary Table 1).
The AD group had significantly higher 18F-AV1451 retention in the hippocampus, fusiform gyrus, amygdala, parahippocampus, temporal, frontal, parietal, and occipital cortices. The MCI group had higher 18F-AV1451 retention than the controls in the hippocampus, fusiform gyrus, amygdala, and parahippocampus (Supplementary Table 2).
Voxel level correlations between amyloid and tau aggregation in the cortex
There were multiple clusters of highly significant positive correlations between 18F-AV1451 and 18F-Flutemetamol in both MCI and AD (shown in Fig. 3 and Table 2). In the MCI group, the clusters of strongest correlation (that is Z-scores over 4) were in the frontal and temporal cortices, and subcortical structures (corpus callosum, thalamus, and caudate). In the AD group, the largest clusters of strong correlation were in the frontal lobe. Z-scores and correlation coefficients were higher in the positive correlation clusters in the MCI group compared with those in the AD group.
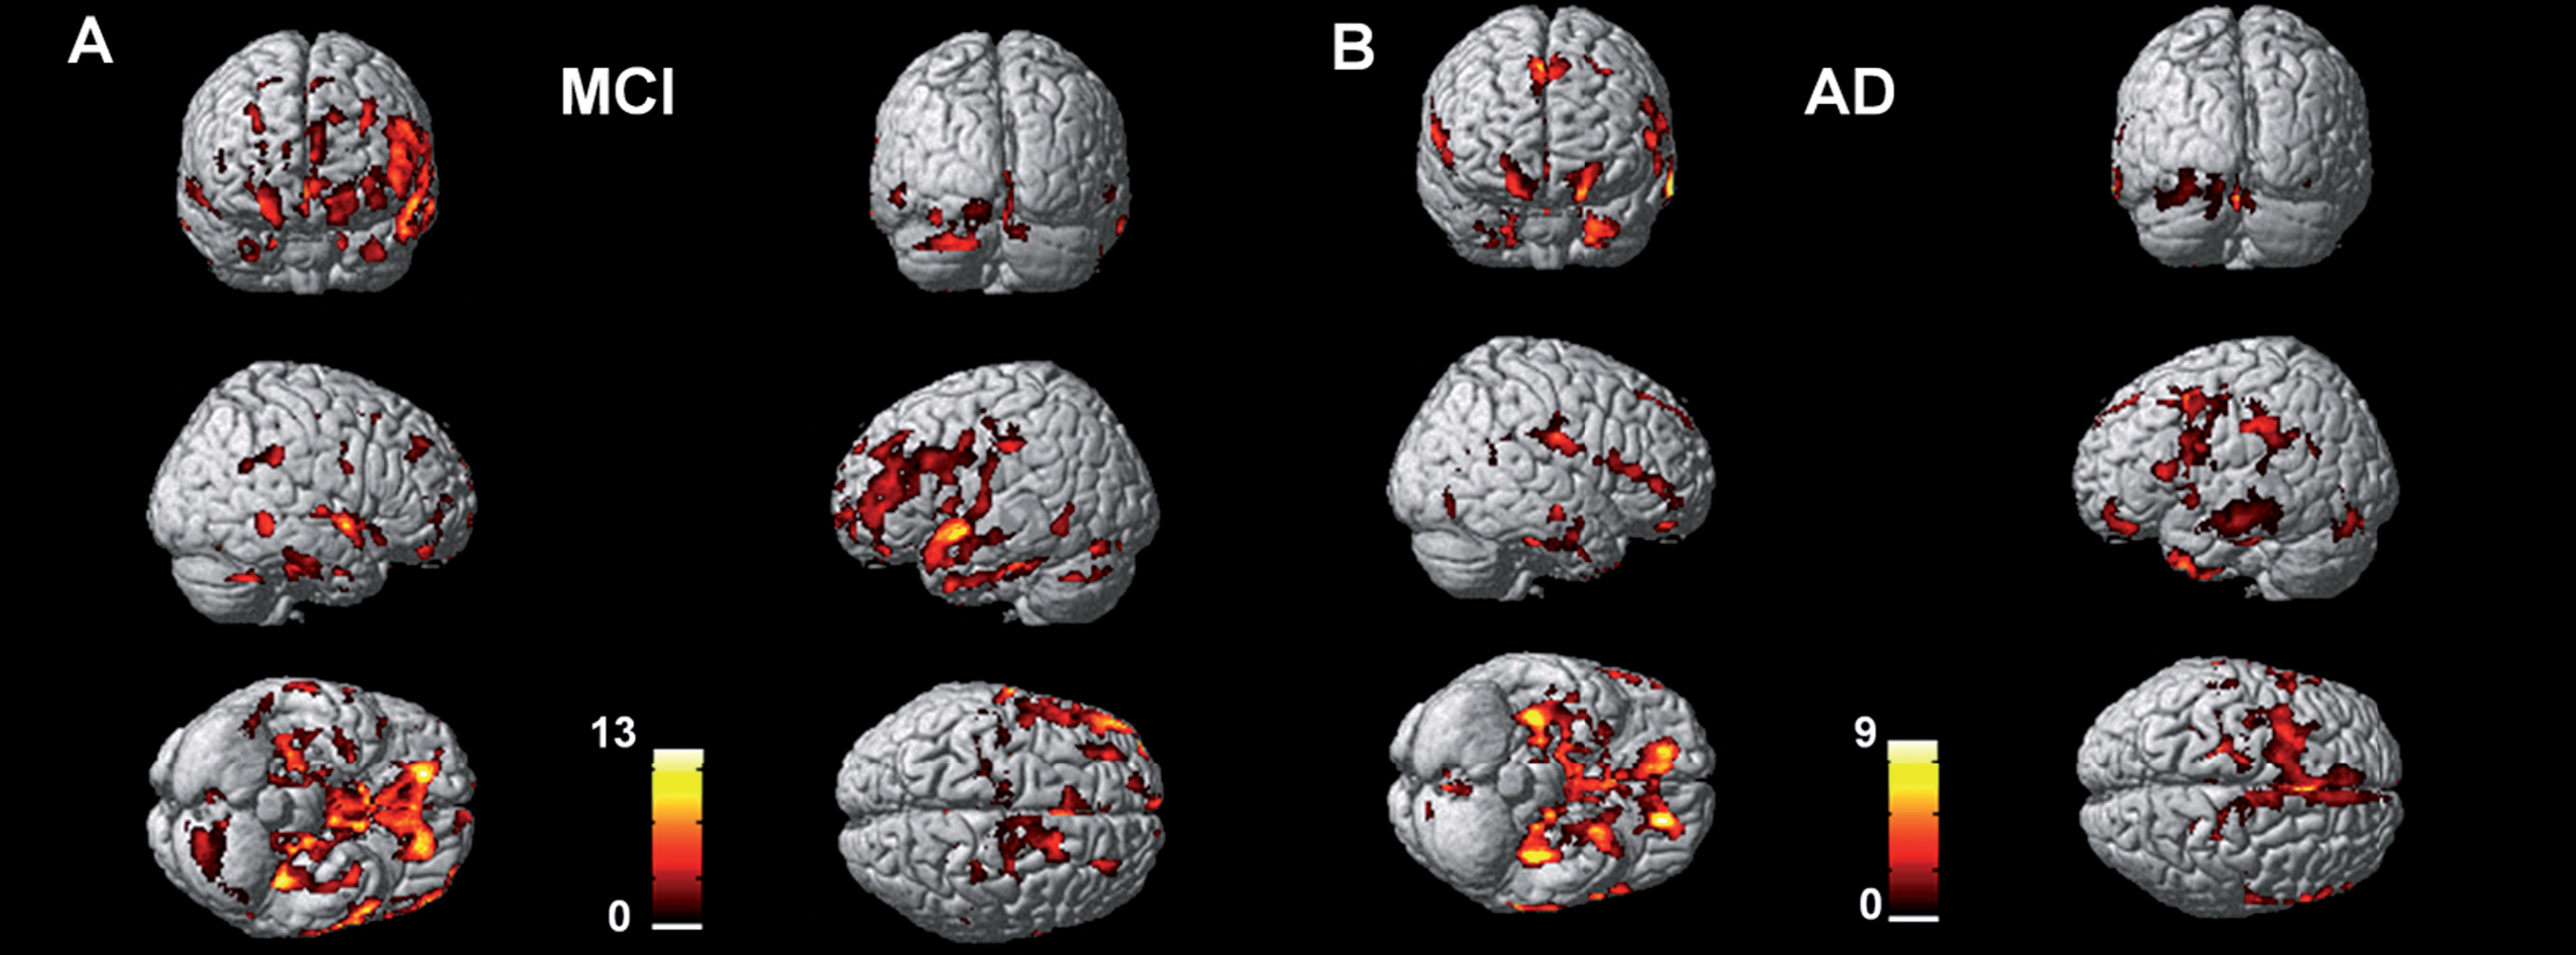
Voxel level correlations between amyloid deposition and tau aggregation in MCI and AD.
Voxel level correlations between 18F-flutemetamol and 18F-AV1451 in MCI and AD
Clusters of voxel-wise positive correlations between 18F-flutemetamol and 18F-AV1451 in MCI and AD subjects (clusters >1000 voxels only).
Regional level correlations between amyloid and tau aggregation in the cortex
In the AD group, there was a positive correlation in the amygdala (r = 0.588, p = 0.035) but no correlations in the MCI group.
DISCUSSION
This is the first study to our knowledge to examine in vivo voxel level correlations between amyloid deposition and tau aggregation in MCI subjects compared with AD subjects. We found highly significant clusters of positive correlations throughout the cortex in both MCI and AD. Z-scores and r correlation coefficients were higher in the MCI group than the AD group, which may be due to the plateauing of amyloid deposition at the MCI stage, while NFT aggregation continues to intensify as the disease progresses [2, 13].
At a regional level, we did not find correlations either locally or in cortical projections in the MCI group. In the AD group, there were correlations in the amygdala only. This was an unexpected finding, and possibly reflects the heterogeneity of the disease process, particularly at the MCI stage. Our groups may have been underpowered to detect the differences in the processes and correlations. Finally, it is possible that the regions that we were analyzing were too large to detect voxel level processes.
Our findings are in line with histopathological findings of AD brains showing that amyloid and tau coexist within neurons in AD [14] consistent with the voxel-level correlations seen in our study. It is possible that the two processes occur independently, but in close proximity to each other, as tau propagation both locally and across the cortex can occur independently of amyloid [15].
There is evidence, however, that the processes act synergistically in driving disease progression. Tau transgenic (rThTauEC) mice (which overexpress tau in the medial temporal lobe) crossed with amyloid transgenic mice (APP/PS1) show a significantly higher tau load with propagation throughout the cortex when cortical Aβ is present [16]. Injecting brain extracts from amyloid transgenic mice into tau transgenic mice results in spreading of tau from the hippocampus to projections at more distant sites. In human neural cell cultures, inhibition of Aβ formation reduces tauopathy [17] further implicating amyloid in inducing tau aggregation. The voxel level correlations, suggesting local aggregation, may also point to local toxicity between the two processes. In vitro studies have shown that Aβ induces tau fibrillization by cross-seeding, and enhances existing tau aggregation. The possibility of this process occurring across specific networks could explain the spatial discordance between these two pathologies [18], networks involving the hippocampus providing a transport mechanism for tau while those involving the cingulate transport Aβ aggregates.
Similarly, tau can promote amyloid pathology. The presence of tau aggregates can enhance Aβ toxicity [19], which in turn exerts its toxicity by neuronal projections. Injecting phosphorylated tau from AD brains into transgenic AD mice (3×Tg; mutations to APP, Presenilin 1, and MAPT 1) not only induced tau aggregation and propagation, but also increased amyloid plaque load (compared with injection of saline). [20] The same group found that passive immunization of monoclonal antibodies to tau into AD transgenic mice not only decreased total tau and phosphorylated tau, but also decreased amyloid-β protein precursor levels and amyloid plaque [21]. This suggests that passive immunization to tau could target both pathologies, thus breaking the disease cycle and halting disease progression.
In humans, it is suggested that isocortical amyloid may be required to induce slow developing medial temporal lobe NFTs to become rapidly spreading toxic NFT aggregates in the isocortex [22, 23]. Thus, while the processes can appear to be spatially discordant, there may be multiple neuronal projections connecting these ‘discordant’ areas. For example, corticocortical evoked potential studies in humans have revealed connections between the hippocampus and temporal lobe structures; the parahippocampus and posterior cingulate cortex; and between the amygdala and the temporal, frontal, inferior parietal, cingulate, and insula [24]. Evoked intracranial EEG responses in humans have suggested multiple connections between lobes—with a high frequency of connections within the temporal and frontal lobes [25].
It is likely that while these processes can occur independently, they also act synergistically and have been described as a ‘toxic pas de deux’ [26].
Study strengths and limitations
A strength of this study was that our individuals with MCI and AD were well characterized and showed amyloid positivity on PET. This allowed us to evaluate tau aggregation in homogenous groups of individuals. Additionally, interrogation for both regional and voxel-level correlations revealed the full extent of spatial associations between the two processes.
A limitation of the study was the inclusion of small numbers of individuals in each disease group, so caution needs to be applied when we generalize our results to the MCI and AD populations. Additionally, the inclusion of both tau positive and tau negative MCI individuals in the correlation analysis introduces the possibility of false positive results arising from null data points. If we had larger numbers we would have performed separate correlation analyses for tau-positive and all patients, respectively. However, we felt that it was important to include all individuals in this case, as tau deposition is a continuous process in the AD trajectory.
Another consideration is the reported off-target binding of 18F-AV1451 described in the choroid plexus, basal ganglia, retinal tissue, and melanin containing cells [27–29], so our results should be interpreted with caution. However, the use of individualized Z-maps reduces this problem. While our findings are in line with previous histopathological studies [14], ideally our findings should be confirmed with autoradiographic studies. Additionally, detection of correlated tracer binding is influenced by the sensitivity of PET radioligands and is liable to false negatives [30]. Amyloid PET imaging can only confidently detect amyloid plaques at Thal stage 3 or higher when the load is moderate or severe and consistently misses Thal stages 1 and 2 [30]. Individuals who are labelled as amyloid negative PART (Primary-age related tauopathy) based on PET imaging may have Aβ that is below the threshold for detection [30]. Alternatively, they may enter an amyloidogenic pathway after NFTs aggregate in the medial temporal lobes [31, 32]. Another consideration is our chosen cut-offs for amyloid and tau positivity, based on previous models by Jack et al. [11]. Amyloid and tau deposition are continuous processes. In particular, tau deposition increases in the medial temporal lobes in normal ageing, and thresholds for biomarker positivity are still debated. Thus, positivity depends on the threshold used. Additionally, both amyloid and tau can be present in healthy controls [33, 34]. In view of the limited numbers and the older age of the cohort, we did not differentiate between preclinical AD stages 0, 1, and 2 when creating Z-scores for our disease groups. If we had only used individuals with preclinical AD stage 0, higher levels of tracer uptake in the MCI and AD group would be likely.
Additionally, we included a subset of 18F-AV1451 scans for healthy controls recruited from the ADNI database. These individuals had amyloid scans, but using a different tracer from our center (18F-florbetapir, compared to 18F-flutemetamol) so direct comparison of amyloid was not possible. Additionally, the 18F-AV1451 scans were performed on different scanners, increasing the possibility of introducing variability into the cohort.
Here we report for the first time that correlations between amyloid and tau are stronger in MCI compared with AD. This is consistent with the fact that both pathologies are increasing in MCI but then amyloid deposition plateaus, while NFT aggregation continues to progress with the clinical course. However, a longitudinal study would allow us to better establish the temporal relationship between these processes, and the sequence of events.
Conclusion
In this PET study of MCI and AD subjects, we found that amyloid deposition and tau aggregation were significantly correlated at a voxel level across association cortex, in both MCI and AD. Our findings reinforce the view that the two pathological processes are synergistic when contributing to AD. The strong correlations in the MCI group may suggest that both these pathological processes are still evolving in the MCI stage. Any future therapeutic strategy may need to target both of these pathologies.
Footnotes
ACKNOWLEDGMENTS
The authors thank Imanova Centre for Imaging Sciences, Imperial College Clinical Imaging facility and GE Healthcare for the provision of radiotracers, scanning and blood analysis equipment. We thank Avid Pharmaceuticals for use of the radiotracer 18F-AV1451. The PET scans and MRI scans were funded by the Medical Research Council and Alzheimer’s Research UK. This article presents independent research funded by Medical Research Council and Alzheimer’s Research, UK and supported by the NIHR CRF and BRC at Imperial College Healthcare NHS Trust.
The PET scans and MRI scans were funded by the Medical Research Council (grant number WMCN_P33428) and part of the study was funded by Alzheimer’s Research UK (grant number WMCN_P23750), while amyloid tracer was made available by GE Healthcare. 18F-AV1451 PET scans were performed under license from Avid.